
ABSTRACT
Accurate high-resolution maps of oil palm plantations underpin effective management of environmental and socio-economic impacts at global, regional, and national levels. However, young industrial and highly irregular small-holder plantations are mostly unmapped and not included in official FAO statistics. This issue is addressed here by discriminating global oil palm plantation in 2020 into four subclasses: Industrial Mature Oil Palm (IMOP); Industrial Young Oil Palm (IYOP); Smallholder Mature Oil Palm (SMOP); and Smallholder Young Oil Palm (SYOP). Data, resolved to 4.77 m, from Planet & NICFI, Sentinel-1/2, were combined with other layers using the image-oriented classification and regression tree (CART) algorithm which performed best in classification tests. Results show that SMOP dominates distributional extent, but it was also the most accurately mapped subclass typically found at 500–1000 m altitude. IMOP had the most extensive altitude range of 500–1300 m, while IYOP and SYOP were found at similar altitudes of 500–800 m and 500–900 m respectively. Recent developments in South East Asia show oil palm plantations expanding into new areas with a slope of 24 degrees. Results provide data to support Sustainable Development Goal by assisting future oil palm-related development planning and monitoring in the world's major oil palm-growing countries.
1. Introduction
Oil palm supports local livelihoods, industrial economic activities, and food businesses (Bank Citation2009). It is widely used as vegetable oil for direct consumption, an ingredient in many processed products, and an important biofuel (Qaim et al. Citation2020). Globally, the main cultivation regions are Southeast Asia and Pacific, Western and Central Africa, and Southern and Central America (Cheng et al. Citation2018).
Since the 1980s global market demand for oil palm expanded rapidly driven by employment, economic gains, and support of local livelihoods (Danylo et al. Citation2021; Henders, Persson, and Kastner Citation2015). However, the expansion of oil palm has brought several environmental and social problems, such as loss of biodiversity and reduction of forests (Choquette-Levy et al. Citation2021; Nelson et al. Citation2014; Tarigan Sunarti, and Widyaliza Citation2015; Xu et al. Citation2022). Sustainable development of oil palm cultivations is therefore necessary to reduce environmental impacts whilst maintaining or increasing economic benefits.
Scientific assessment of oil palm expansion on environmental impacts and sustainable development requires finer spatial resolution maps of oil palm subclasses. From 1997 to 2018, global oil palm production increased from 100 million metric ton to 300 million metric ton, and expanded to 21 Mha in 2018 (FAO Citation2018). However, accurate records from the Food and Agriculture Organization Corporate Statistical Database (FAOSTAT) are only available for legal mature oil palm cultivations, hence maps are required of other subclasses for accurate monitoring.
Previous research mapped oil palm as a single class, or as industrial and smallholder oil palm within a closed canopy. Also, young oil palms less than three years old are difficult to map so only a few studies exist for this class (Descals et al. Citation2021; Xu et al. Citation2020). Nationally, studies mostly focus on major producer countries such as Indonesia, Malaysia, and Thailand (Cooper et al. Citation2020; Gaveau et al. Citation2018). Global studies therefore lack consideration of other countries and oil palm subclasses for different cropping patterns and tree ages.
Existing classifications are based on traditional machine learning methods (supervised and unsupervised) and recent more popular deep learning methods; all with respective advantages and disadvantages depending on application. Deep learning methods show some advantages in the identification of single oil palm tree and plantation density (Li et al. Citation2016; Li et al. Citation2018), while traditional methods are more often applied in discriminating types of oil palm plantations (Cheng et al. Citation2019; Shaharum et al. Citation2020). In this paper, we compare the performance of the supervised classification and regression tree (CART) algorithm and the Random Forest classifier.
Our aim was to map four subclasses globally at a resolution of 4.77 m. The subclasses are IMOP; IYOP; SMOP; and SYOP. Analyses included the spatial distribution of four subclasses globally, regionally, and by country. Additional analyses included the relationship of the subclasses to elevation and slope. We compare our classifications to those from other previous global mapping studies.
2. Data and methods
2.1. Study area
Oil palms grow in humid, warm tropical regions of Southeast Asia, South Asia, the Pacific Islands, West Africa, Central Africa, and the Americas (Cooper et al. Citation2020). National cultivations vary depending on the climate, environment, crop structure, and economic policies. For instance, smallholders dominate oil palm cultivation in Nigeria, while large estates dominate in Malaysia (Adebowale Citation2012; Glinskis and Gutiérrez-Vélez Citation2019; Kajisa, Maredia, and Boughton Citation1997). Climate variability affects productivity worldwide (Lamb Citation2013) from changes in wet and dry seasons in countries such as Malaysia and Nigeria, while others such as Indonesia and Tanzania have no clear distinction between dry and wet seasons. Furthermore, topography varies significantly around the world (Jarvis et al. Citation2008) from gentle topography in West Africa to hilly regions and plains in Indonesia and Malaysia.
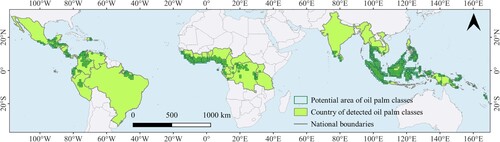
Our study area () excluded areas identified by Descals et al. (Citation2019) as unlikely to be used for oil palm cultivation (Descals et al. Citation2021). These areas included regions identified from thresholds for high elevation and slope (Farr et al. Citation2007), permanent water body (Pekel et al. Citation2016), mangrove (Xiao et al. Citation2021), and impervious surface (Karra et al. Citation2021).
Figure 1. Study area of global oil palm subclass distributions in 2020. The soft green areas represent the countries included in this study. Dark green grids indicate the potential distribution area of the oil palm subclasses.
2.2. Data
Three types of data were used in this study including: (i) remote sensing data, (ii) auxiliary data, and (iii) sample point data. Details of these data are listed in respectively.
Table 1. Remote sensing data and the corresponding index information data were used in this study.
Table 2. Details of the Auxiliary data are shown.
Table 3. The number of sample points selected for each oil palm subclass in the different regions.
2.2.1. Remote sensing data
The various types of remote sensing data and corresponding index information are presented in . Remote sensing data used included Planet & NICFI, Sentinel-1/2, and their corresponding index information. Planet & NICFI data from December 2015 at a spatial resolution of 4.77 m, consisted of four bands (red, blue, green, and near-infrared) nominally used for monitoring forest loss, safeguarding biodiversity, combating climate change, and encouraging sustainable development (Team Citation2017). Sentinel-1 data of 10 m resolution was obtained from the dual-polarized C-band synthetic aperture radar (SAR). Most of the study area, except Papua New Guinea, Solomon Islands, and Vanuatu, had Sentinel-1 data from Google Earth Engine (GEE): https://code.earthengine.google.com/. Sentinel-1 radar penetrates cloud and fog which would otherwise confound imaging in tropical regions throughout the year (Maskell et al. Citation2021). Sentinel-1 provides vegetation canopy information used for classifying oil palm subclasses. Sentinel-2 Multi-Spectral Instrument (MSI), Level-1C was used due its multispectral capability, high resolution, and large-area coverage. It is commonly used for monitoring vegetation, soil cover, water cover and observing inland waterways and coastal areas. Index information for dry and rainy seasons was synthesized separately to account for slight local climate change variations across different countries.
2.2.2. Auxiliary data
Auxiliary data was used for masking areas unsuitable for oil palm plantation, including urban and impervious surfaces, water bodies, mangrove areas, vegetation canopy height, and regions with elevation and slope beyond certain threshold. City area data was from Sentinel-2 global land use/land cover (Karra et al. Citation2021). JRC Global Surface Water Mapping Layers, v1.4 was used for water surfaces, global mangrove data was from Xiao et al. (Citation2021), and global vegetation canopy height data was from Lang et al. (Citation2022). Spatial resolutions for JRC Global Surface Water Mapping Layers v1.4, global mangrove distribution data, global vegetation canopy height data, and city area data from Global land use/land cover with Sentinel-2 were 30m, 10m, 10m, and 10 m, respectively, as listed in .
2.2.3. Sample point data
Google Earth Pro data at sub-meter precision, produced by Maxar Technology and Airbus, was used to identify various feature types that included, but were not limited to, oil palm subclasses, forests, bare land, urban buildings, and water bodies. Time-series changes were used to discern oil palm subclasses as their maturation period is a mere three years. To ensure an adequate sample size for the 2020 oil palm subclass, a stratified random sampling method (Aoyama Citation1954) was employed. If clear images of oil palms were not available in a particular area in 2020, images from the preceding year were reviewed. For young oil palm, sample points were chosen in areas planted in 2019, thus increasing available sample points. A total of 17,671 sample points were selected with proportions of IMOP, IMYP, SMOP, and SMYP accounting for 5747, 2108, 7637, and 2179, respectively .
2.3. Definition of the oil palm subclasses
The age range of young oil palms (IMYP, SMYP) is from the day of self-planting to the third year. For young oil palms, the range of values for N/N-2/N-3 is [0, 3]. Characteristics of the different subclasses used in the classification were as follows in .
Table 4. Characteristics of the different subclasses used in the classification.
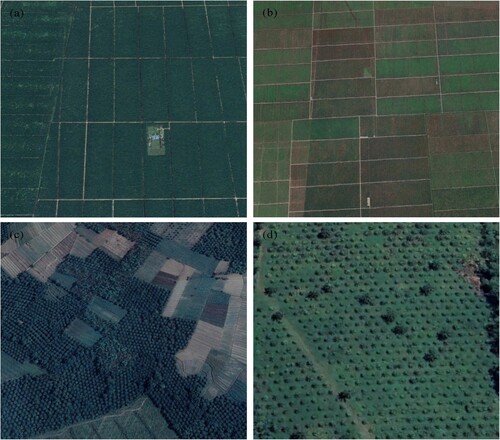
The four oil palm subclasses and their distinguishing characteristics are also depicted in (a, b, c, d).
Figure 2. Examples of IMOP, IYOP, SMOP, and SYOP plantations from Airbus or Maxar Technologies images displayed in true colours. (a) IMOP plantations are regular and uniform, with a dark green colour and regular paths. (b) IYOP plantations are also planted in regular, equidistant pockets of young oil palms, with clear information on the soil context. (c) SMOP plantations are unevenly distributed in a mosaic with other feature types, with no obvious planned paths. (d) SYOP plantations have specific soil background information and irregularly distributed plantation periphery contours, often bordering forest or scrub.
2.4. Pre-processing planet & nicfi, sentinel-1 and sentinel-2 satellite images
Noise in Sentinel-1 raw data affects the supervised classification of features, hence pre-processing is critical to ensure accurate and reliable feature classification. Pre-processing steps used included thermal noise removal, radiometric calibration, terrain correction, removal of edge noise, streaks, scattered signals, and normalization of local incidence angle (Kaplan et al. Citation2021).
Spectral and raw band information from Sentinel-2 data, used to classify subclasses, is impeded by clouds (Nguyen et al. Citation2021) which were removed using a maximum cloud threshold of 5%.
Several tropical nations exhibit a distinct dichotomy between rainy and dry seasons, evident in discernible dissimilarities in Sentinel-2 images of clouds and median ground spectral reflectance. Furthermore, seasonal textural differences of vegetation canopy and ground water content induce significant disparities in backscatter in Sentinel-1 data. provides the corresponding schedules for the rainy and dry seasons in different countries.
Table 5. the corresponding wet and dry season schedules for different countries. ‘/’ Indicates that the corresponding country does not have a distinct wet or dry season.
Growth of oil palm subclasses in 2020 is primarily observed in coastal countries. Coverage areas of Sentinel-1 are distinct for their ascending and descending orbits, leading to inadequate data coverage in specific countries for certain oil palm regions. In instances of a region/country subject to a sole Sentinel-1 orbit, we utilized its dual polarisation bands (VV and VH). Where Sentinel-1 coverage was lacking, we relied exclusively on Planet & NICFI and Sentinel-2 data. Only a small fraction of Papua New Guinea and Cameroon lack Sentinel-1 data coverage.
Sentinel-1 and Sentinel-2 images were resampled to a spatial resolution of 4.77 meters, using nearest-neighbour interpolation. Planet & NICFI data were selected for the whole of 2020 and image mosaics were from median values.
2.5. Feature bands selection
The present study utilizes 150 bands of remote sensing data from multiple sources to classify oil palm subclasses. However, not all bands are effective, thus GEE band feature importance function was used to rank bands from first to last to improve the classification and remove redundant bands. After analysis, 36 bands were identified as characteristic bands, with Planet & NICFI band demonstrating the highest importance, followed by elevation, slope, and texture bands. Additionally, derivatives of Sentinel-1 and spectral indices of Sentinel-2 contributed to characteristic bands. The filtered bands used for the classifier are presented in .
Table 6. Feature bands used for classification in the input classifier.
2.6. Mapping of global oil palm subclasses
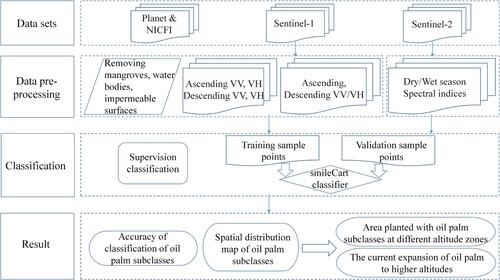
Generating the global high-resolution subclass maps involved two key steps. First, Planet & NICFI and Sentinel-1/2 data were fused using supervised classification (CART) to categorize oil palm subclasses within each grid based on samples from Google Earth Pro; with subsequent quantification of areas occupied by each subclass. Second, post-processing to refine raw classification images included identification of optimal patches, enhancement of classification accuracy and visual effects, masking non-oil palm subclasses, and mapping oil palm subclasses. A comprehensive depiction of the workflow for classifying global oil palm subclasses is illustrated in .
Figure 3. Workflow diagram of the global oil palm subclass classification.
2.7. Accuracy assessment
A training-to-validation sample point ratio of 7:3 was used to evaluate the classification of oil palm subclasses. Several accuracy measures were used including producer accuracy (PA), user accuracy (UA), omission error (OE), and commission error (CE). Subclass classification performance was deemed better when values of PA and UA were high, and those of OE and CE were low.
3. Results
3.1. Global oil palm subclasses accuracy and analysis
We compared the performance of CART and Random Forest (RF) classifiers for four oil palm subclasses of Sumatra Island, Indonesia. CART was slightly better than RF with overall accuracy (OA) for CART of 74.34%, a kappa coefficient of 0.69, while OA for RF classifier was 73.93%, with a kappa coefficient of 0.68. Furthermore, CART demonstrated superior flexibility, robustness, intuitiveness, computational efficiency, execution speed, and resilience of spatial characteristics and categorical identity. Hence, CART was used to classify six features, including four oil palm subclasses, resulting in an overall accuracy of 81.44% and a kappa coefficient of 0.767. The producer accuracy (PA) and user accuracy (UA) for IMOP, IYOP, SMOP, and SYOP are above 70%, except for SYOP, which had a lower PA, and UA of 72.34%. Compared to 2019, Descals et al. (Citation2021) mapping focused on IMOP and SMOP-only, our results exhibit lower classification accuracy. However, the subclasses are more refined. presents the global classification accuracy of the oil palm subclasses. Classification errors for IMOP and SMOP are primarily due to confusion between them. In contrast, classification errors for IYOP and SYOP are due to confusion between them, and with other classes such as grassland, bare land, and other agricultural lands.
Table 7. Classification accuracy of global oil palm subclasses.
3.2. Share of global oil palm subclasses
We analysed four global oil palm subclasses across different regions totalling 72.7 million hectares (Mha), comprising 48.41 Mha of mature oil palm and 24.30 Mha of young oil palm, with IMOP, IYOP, SMOP, and SYOP contributing 22.21 (31%), 12.17 (17%), 26.20 (35%), and 12.12 (17%) Mha, respectively. and shows that Southeast Asia and the Pacific dominate regional share for all four subclasses, with respective global shares of IMOP, IYOP, SMOP, and SYOP of 84.00%, 95.60%, 72.30%, and 86.30%. 7.97% of the global IMOP is in Western and Central Africa, while IYOP, SMOP, and SYOP account for 0.60%, 11.62%, and 6.24% respectively. Similarly, in Central and South America, IMOP represents 7.98% of the global IMOP, while IYOP, SMOP, and SYOP account for 3.80%, 12.31%, and 7.46% respectively. shows that in Southeast Asia and the Pacific, smallholder oil palm area is comparable to industrial, whereas, in South Asia, Africa, and the Americas, the area of smallholder is larger than industrial.
Figure 4. Spatial distribution map of oil palm subclasses in Southeast Asia and Pacific.
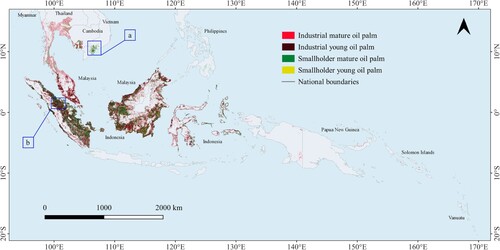
Table 8. The area under the oil palm subclasses was in different regions.
As listed in , in 2020, mature and young oil palm planting areas accounted for approximately two-thirds and one-third respectively of the total oil palm planting area. However, the global percentage of young palm plantation in South Asia and Pacific (SAP) region is higher at 91%, while that in other regions is lower, implying that the SAP region requires closer monitoring of environmental and ecological impacts. These findings also highlight the dominance of Southeast Asia and the Pacific region in the cultivation of oil palm and the relatively smaller scale of cultivation in other regions.
Table 9. Areas and proportions of mature and young oil palm plantations for the difference regions.
3.3. Spatial distribution patterns of global oil palm subclasses
In 2020, oil palm was commonly cultivated in 42 countries, with ten growing four subclasses of the plant. However, five countries, namely the Philippines, Gabon, Republic of the Congo, Rwanda, and Nicaragua, only had one subclass, either IMOP or SMOP.
Distributions varied across different regions from differences in topography, climate, and degree of development. Malaysia and Indonesia: Cultivation was concentrated across plains and extended to mountainous regions. Displayed a wider range of subclasses and dense distribution along rivers and major roads. Africa and the Americas: Cultivation was largely distributed along plains and valleys. Philippines and Nicaragua: Less developed subclasses limited to a single type, small and scattered with no discernable distribution features along rivers and main roads.
Spatial distribution of subclasses is represented in for Southeast Asia and Pacific, Africa, Americas, and South Asia, respectively. provide a closer look at specific small areas within each region.
Figure 5. Spatial distribution map of oil palm subclasses in Africa.
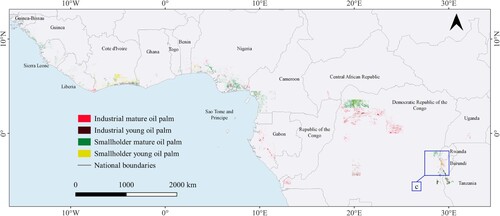
Figure 6. Spatial distribution map of oil palm subclasses in Americas.
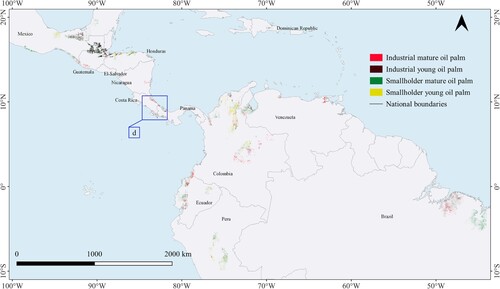
Figure 7. Spatial distribution map of oil palm subclasses in the South Asia.
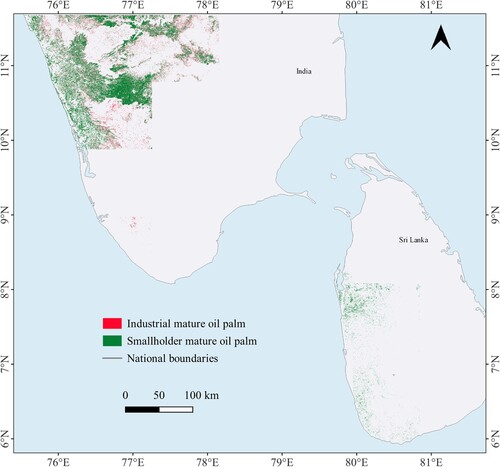
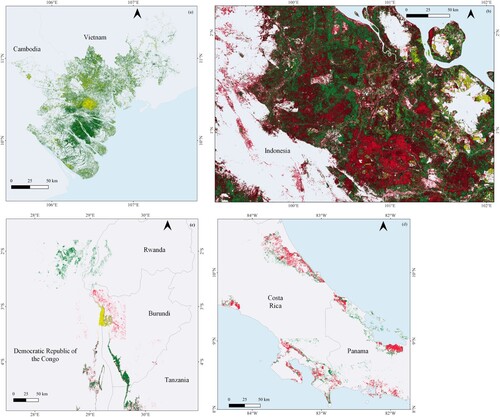
Figure 8. Spatial distribution map of oil palm subclasses in (a) Vietnam, (b) Riau Province, Indonesia, (c) Democratic Republic of the Congo, Rwanda, Burundi, Tanzania, (d) the Costa Rica, Panama.
3.4. Oil palm subclasses at different elevations and slopes
3.4.1. Oil palm subclasses at different elevations and slopes in South-East Asia and the pacific
Planting of different oil palm subclasses decreases as elevation increases. Within altitudes of 0–100 m, SMOP and SYOP subclasses dominate, with percentages of 36.65% and 93.34%, respectively. However, within 400–500 m, SMOP and SYOP was significantly lower, at 9.71% and 0.02% respectively. These percentages were the highest and lowest values, respectively, compared to other subclasses. The majority of IMOP (89%), IYOP (87%), SMOP (58%), and SYOP (98%) are planted between 0 and 200 m. It may be concluded that industrial oil palm plantations in Southeast Asia are primarily located at lower altitudes in comparison to smallholder oil palm. Additionally, smallholder cultivations are extending to higher altitudes.
Subclasses are distributed at varying elevations and slopes across Myanmar, Thailand, Indonesia, Malaysia, the Philippines, Papua New Guinea, Vietnam, and Cambodia. Subclasses occur between 0 and 500 m elevation in Myanmar, Philippines, and Cambodia. In Papua New Guinea, subclasses occur between 0 and 400 m, and in Vietnam, between 0 and 300 m. Notably, all four subclasses expanded to positions above 400 m in the aforementioned countries. Expansion extends to slopes greater than 20 degrees. For instance, in Myanmar and Thailand, subclasses are distributed at slopes 0–24 degrees and 0–27 degrees, respectively. Similarly, in Malaysia, IMOP, IYOP, and SMOP subclasses are observed at 0–27 degrees, while SYOP is found at 0–24 degrees; the relative percentage of smallholder plantations on 6–9 degrees is greater than industrial plantations. In Indonesia, SMOP is found at 0–27 degrees, and other subclasses are observed at 0–24 degrees.
To summarise, approximately 90% of existing plantations in Southeast Asia are situated on topographic slopes ranging from 0 to 9 degrees. Moreover, there exists a discernible pattern of smallholder oil palm expansion onto steeper slopes ().
Figure 9. Area of oil palm subclasses at different elevation ranges in (a) South East Asia and Pacific, (b) South Asia, (c) West and Central Africa, (d) Americas. ‘100’ in the graph refer to the interval [0 m,100 m], ‘200’ refers to the interval [100 m,200 m], … … and so on.
![Figure 9. Area of oil palm subclasses at different elevation ranges in (a) South East Asia and Pacific, (b) South Asia, (c) West and Central Africa, (d) Americas. ‘100’ in the graph refer to the interval [0 m,100 m], ‘200’ refers to the interval [100 m,200 m], … … and so on.](/cms/asset/e01eacab-5329-4e72-ace4-94a14d9f9dca/tjde_a_2220612_f0009_oc.jpg)
3.4.2. Oil palm subclasses at different elevations and slopes in south Asia
In India, IMOP occurs between 0 and 300 m elevation and slopes of 0–18 degrees, while SMOP occurs between 0 and 600 m elevation and slopes of 0–15 degrees. Similarly, SMOP in Sri Lanka is below 300 m and under 18 degrees slope. Across South Asia, about 80% of smallholder cultivation is on slopes of 1–6 degrees.
3.4.3. Oil palm subclasses at different elevations and slopes in Africa
In Africa, the altitude range for IMOP, IYOP, SMOP, and SYOP is 0–1300 m, 0–800 m, 0–1000 m, and 0–1000 m, respectively. Within 0–200 m, 65%, 66%, 66%, and 66% of each subclass is planted with IMOP, IYOP, SMOP, and SYOP, respectively. Uganda, Burundi, and Tanzania generally grow oil palm in high-altitude areas. In Uganda, subclasses are grown between 1100 and 1300 m; in Burundi, between 700 and 1500 m; and in Tanzania, between 700 and 1100 m. Equatorial Guinea, Guinea, Sierra Leone, Liberia, Côte d'Ivoire, Ghana, Togo, Nigeria, Benin, and Gabon all grow between 0 and 400 m.
3.4.4. Oil palm subclasses at different elevations and slopes in the americas
Within 0–300 m, IMOP, IYOP, SMOP, and SYOP account for 87%, 84%, 88%, and 90% of the total for each subclass, respectively. IYOP accounts for 40% within 0–100 m, and does not expand beyond 500 m. IMOP, SMOP, and SYOP do not expand beyond 800 m. More than 80% of the total area have slopes of 0–9 degrees. The most significant expansion of IMOP and SMOP in South America is in the Peruvian region, where cultivation at higher altitudes is increasing. In contrast, the most notable expansion of IYOP to higher altitudes is in the Colombian region.
4. Discussion
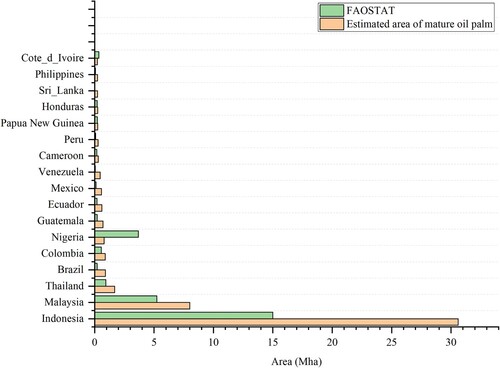
We compared our results to prior studies by Descals et al. (Citation2021) and Cheng et al. (Citation2018) to understand additional insights provided by the subclasses. Furthermore, the number of countries growing oil palm increased from 15 to 42. We also compared the area of mature oil palm planted in each country in 2020 recorded by FAOSTAT, to further explore the accuracy of the data. We observed discrepancies in the estimated area of oil palm cultivation in Guatemala and Indonesia. Specifically, we estimated area under mature oil palm (IMOP and SMOP) in Indonesia was 30.6 Mha, double that of FAOSTAT's estimate of 15 Mha. Similarly, in Malaysia, we estimated 8.01 Mha of mature oil palm plantations, while MPOB estimated only 5.2Mha. In comparison to countries with mature oil palm plantations in 2020 reported by FAOSTAT, countries in Americas remain unchanged, totaling 11 countries, including Brazil and Colombia. In contrast, our study revealed disparities between countries in Africa, compared to FAOSTAT such as Guinea-Bissau, Angola, and Equatorial Guinea, where presence cannot be verified due to a lack of subclass sample points through Google Earth Pro. Furthermore, we identified small oil palm cultivations in Rwanda, Uganda, and Tanzania, not recorded by FAOSTAT. In South Asia, mature cultivations, not in FAOSTAT, were detected in India and Sri Lanka. In Southeast Asia, consistent with FAOSTAT, Brunei and Singapore have no oil palm crops, whereas Myanmar and Vietnam had scattered cultivations. Finally, we found oil palm cultivation in Vanuatu, in addition to Papua New Guinea and Solomon Islands, which were recorded by FAOSTAT ().
Figure 10. Comparison of mature oil palm acreage with FAOSTAT statistics from the study.
In Citation2019, Descals et al. estimated global closed-canopy oil palm plantations of 19.5 Mha, comprising monoculture oil palm plantations of 67.2% (13.1Mha) industrial (IMOP) and 32.8% (6.4 Mha) smallholder (SMOP). In 2020, we estimated a global closed-canopy area of 48.41 Mha, of which 45.88% (22.21 Mha) is IMOP and 54.12% (26.20 Mha) is SMOP. Discrepancies with Descals et al. could be attributed to differences in study year and methodology. Descals’maps primarily depict oil palm areas within legally designated areas for oil palm cultivation, neglecting non-legal oil palm plantation areas. In contrast, our study includes non-legal plantation areas, leading to a better representation of SMOP. In Citation2019, Descales et al. compare high-resolution mappings of subclasses with images from Google Earth Pro. For Malaysia, the study found large areas of SMOP closely spaced individual plantations were erroneously labelled as IMOP. In Cambodia, there was clear misclassification between SMOP and other crops with similar canopy structures. Consequently, the actual area of subclasses identified by Descales differs significantly from FAOSTAT statistics in some countries.
We compared 2020 global subclasses with the 2016 global map by Cheng et al, focusing on topography. Our analysis shows that in Southeast Asia, plantations occur in slopes below 8 degrees and elevations below 800 m, consistent with Cheng et al's findings. However, we observed plantations in Indonesia and Malaysia on slopes of up to 18 degrees, unlike Cheng et al.’s results.
In the classification accuracy , we list Xu et al. (Citation2020) results for oil palm areas for a single undifferentiated group in Southeast Asia for 2016. Subsequently, Descals et al. (Citation2019) introduced a global mapping morphological categorization of ‘IMOP’ and ‘SMOP’. In contrast, our study provides a more comprehensive approach by considering young oil palm plantations and subdividing the crop into four distinct categories (IMOP, IYOP, SMOP, SYOP). While our study exhibits a higher level of precision than Xu et al. (Citation2020) and lower than Descals et al. (Citation2019), it contains valuable information on young oil palm plantations (IYOP and SYOP) that is not present in Descals et al.'s work, despite our subclasses demonstrating relatively lower precision. For a better presentation of our research results, we selected different oil palm plantation species in five different regions around the world, obtained corresponding high-resolution Google images, and compared our research findings with those of Descals et al. based on these images ().
Figure 11. Comparison of classification results of oil palm subclasses (IMOP, IYOP, SMOP, SYOP) with those (IMOP, SMOP) of Descals et al. (Citation2019): (a) high-resolution Maxar Technologies image base. (b) oil palm subclasses from this study. (c) taxonomic oil palm subclasses (IMOP, SMOP) of Descals et al. (Citation2019).
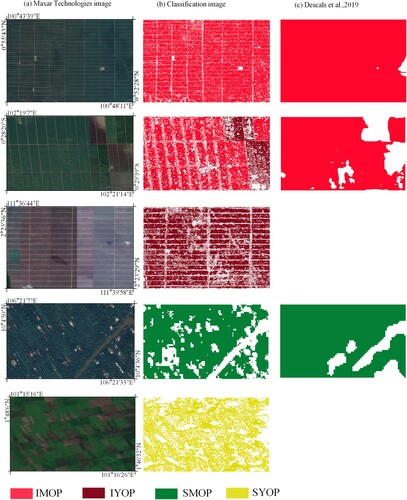
Table 10. Comparison of the accuracy of our high-resolution spatial mapping results for oil palm subclasses with previous studies.
We downloaded oil palm cultivation areas for Indonesia and Malaysia in 2020 from official websites of the Badan Pusat Statistik of Indonesia and MPOB. Oil palm cultivation area in Malaysia was 5.86 Mha, with mature and young oil palm accounting for 89.2% (5.23 Mha) and 10.8% (0.63 Mha) (https://bepi.mpob.gov.my/index.php/area), respectively. Meanwhile, in Indonesia, the mature plantation area is 14.86 Mha (https://www.bps.go.id/). However, our research reveals mature plantation area in Indonesia is 30.59 Mha, while in Malaysia, the mature plantation area is 8.08 Mha, and the young oil plantation area is 3.27 Mha, representing 71% and 29%, respectively. These findings represent the current state of oil palm cultivation in the two countries ().
Table 11. Comparison of our mature oil palm acreage with FAOSTAT and historical oil palm acreage from previous studies in the world's major oil palm growing countries in 2020.
We enriched our study by providing novel information on young oil palm, not covered in previous studies. In 2020, out of a total area of young oil palm of 24.28, 12.17 and 12.11 Mha are IYOP and SYOP, respectively. Of these, IYOP and SYOP in Indonesia occupied the largest areas of 9.48Mha and 8.15Mha, respectively, accounting for 77.89% and 67.21% of the global total. Meanwhile, in Malaysia, IYOP and SYOP cover 2.10 and 1.16 Mha, respectively, accounting for 17.26% and 9.64% of the global total. Interestingly, Americas have larger areas of young oil palm plantations than Africa. Specifically, IYOP plantations in the Americas was 6.57 times greater than in Africa. Across Southeast Asia, IYOP (77%) and SYOP (93.34%) are located at elevations between 0 and 100 meters. In Africa, the figures are lower, with 44% of IYOP and 33.10% of SYOP at such elevations. However, Tanzania and Burundi, due to their higher altitudes, have IYOP (700–1500 m) and SYOP (700–900 m) at higher elevations. In Americas, 40% of IYOP and 31% of SYOP are between 0–100 m. Notably, the maximum altitude for IYOP in Americas is lower than SYOP. Overall, these findings highlight the difference in elevation ranges in which IYOP and SYOP can be grown across different regions.
Plantation size exhibits significant global variations. In Indonesia, most IMOP exceed 1000 ha. In West Africa, 18% of IMOP exceed 1000 ha, while over half are less than 100 ha. In Brazil, only 3.3% of IMOP exceed 1000 ha.
Furthermore, we note that young oil palm occupies smaller areas than distinct mature oil palm. Young oil palm is concentrated in countries with prosperous plantation industries, characterized by new plantations replacing low-productivity and over 25-year-old trees. Smallholder young plantations are more flexible than industrial young plantations; distributions range from mosaic of mature smallholder plantations to separate and irregularly bounded distributions near mature smallholder plantations. This flexibility might be due to sustainable policies to mitigate the environmental impacts of oil palm cultivation, such as those promoted by the Roundtable on Sustainable Palm Oil. These policies strongly constrain industrial plantations expansion, but the scope of smallholder plantations is weakly defined.
In Southeast Asia, the alteration of subclasses between elevation zones is relatively moderate, while in the Americas and Africa, it is more rapid. We infer that drivers for the spread of oil palm to higher elevations may be linked to the high profitability of oil palm farming forced by unfavourable local living conditions (Austin et al. Citation2017; Pirker et al. Citation2016; Xu et al. Citation2022).
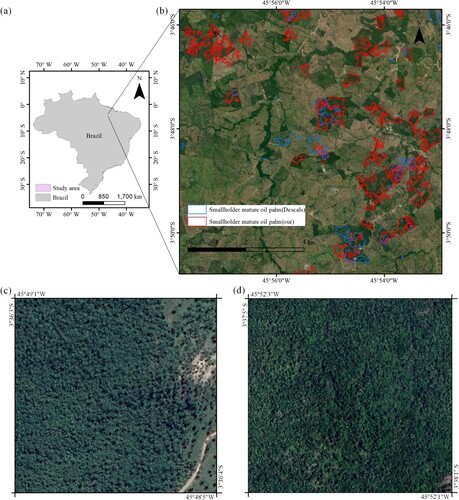
Certain countries have significantly larger areas than what is reported by FAOSTAT due to classification difficulties. In Brazil, numerous abandoned smallholder Plantations are mixed with other tree species, representing a novel discovery undocumented by other studies including Descales et al. For example, the image below depicts an abandoned smallholder plantation in Maranhão Province, Brazil (). Moreover, FAOSTAT only includes legal cultivations, disregarding those beyond legally permitted rights.
Figure 12. (a) Brazilian vector boundaries and corresponding study area for oil palm cultivation. (b) Smallholder oil palm vector boundaries derived from the study compared with those derived from Descals, Maranhão Province, Brazil. (c), (d) High-resolution images of mature oil palms from smallholder farmers with disrupted structural planting.
Despite successfully producing the world’s first set of 4.77 m four-subclass oil palm mapping, there are several limitations. Selection of sample points is impeded by sub-meter high-resolution images on the Google Earth Pro, and insufficient sample points in some small grids, resulted in suboptimal classification. To mitigate uneven local sampling, grids should be adjusted to 10 km x 10 km. In the oil palm plantations in Africa, there is a portion that consists of semi-wild oil palm plantations. In these plantations, oil palms grow in a mixed state with other tree species, which poses some difficulties in their classification and extraction. Further research should develop more advanced classification techniques to enhance classification accuracy.
5. Conclusions
We produced a world’s first high-resolution classification by combining radar and optical satellite data to generate a 4.77 m resolved global oil palm subclasses for 2020. Our study mapped high-resolution open canopy oil palm subclasses of slightly lower taxonomic precision than Descals et al.’s study. Overall classification accuracy of the subclasses was 81.44% with producer accuracy (PA) and user accuracy (UA) from 71% to 80%. Along altitude and slope varied across regions, with smallholder expansion into higher slope terrain evident in central oil palm producing regions (Indonesia and Malaysia). Current expansion is extending into areas with a slope of 24 degrees. This new dataset is valuable in evaluating the environmental and social impacts of oil palm expansion, such as deforestation and climate change, on a global scale. It can provide insights into options for oil palm trade from countries that practice more sustainable planting regimes, and may assist countries to conform to Sustainable Development Goal SDG 15 (land life) by assisting future oil palm-related development planning and monitoring.
Acknowledgements
The authors sincerely acknowledge the support of Norway’s International Climate and Forest Initiative for providing the Planet data. The authors would like to express their gratitude to the European Space Agency for providing the Sentinel-1 radar remote sensing data and Sentinel-2 optical remote sensing data. The authors are grateful to NASA Jet Propulsion Laboratory for providing the NASA SRTM Digital Elevation 30 m data. The authors also extend their thanks to the Google Earth Pro platform for providing high-resolution sub-meter optical imagery, which enabled the acquisition of sample points and visual interpretation information necessary for this research. Lastly, the authors would like to thank the anonymous reviewers for their valuable suggestions and feedback.
Disclosure statement
No potential conflict of interest was reported by the authors.
Data availability statement
The figure data for this study are available at https://www.scidb.cn/en/anonymous/enk2M1Vm. Metadata on the global spatial distribution of oil palm subclasses is available at https://www.scidb.cn/en/anonymous/M3VJakF6.
Additional information
Funding
References
- Adebowale, B. O. A. 2012. “Innovation Policies Institutions and Performance: Why Malaysia Overtook Nigeria in the Oil Palm Industry.” International Journal of Technological Learning, Innovation and Development 5 (1-2): 126–157. https://doi.org/10.1504/IJTLID.2012.044880.
- Aoyama, H. 1954. “A Study of Stratified Random Sampling.” Ann. Inst. Stat. Math 6 (1): 1–36. https://doi.org/10.1007/BF02960514
- Austin, K. G., A. Mosnier, J. Pirker, I. McCallum, S. Fritz, and P. S. Kasibhatla. 2017. “Shifting Patterns of oil Palm Driven Deforestation in Indonesia and Implications for Zero-Deforestation Commitments.” Land Use Policy 69: 41–48. https://doi.org/10.1016/j.landusepol.2017.08.036.
- Bank, World. 2009. World Development Report 2010: Development and Climate Change. Washington, DC: The World Bank.
- Broge, N. H., and E. Leblanc. 2001. “Comparing Prediction Power and Stability of Broadband and Hyperspectral Vegetation Indices for Estimation of Green Leaf Area Index and Canopy Chlorophyll Density.” Remote Sensing of Environment 76 (2): 156–172. https://doi.org/10.1016/S0034-4257(00)00197-8.
- Cheng, Y., L. Yu, Y. Xu, X. Liu, H. Lu, A. P. Cracknell, K. Kanniah, and P. Gong. 2018. “Towards Global oil Palm Plantation Mapping Using Remote-Sensing Data.” International Journal of Remote Sensing 39 (18): 5891–5906. https://doi.org/10.1080/01431161.2018.1492182.
- Cheng, Y., L. Yu, Y. Xu, H. Lu, A. P. Cracknell, K. Kanniah, and P. Gong. 2019. “Mapping oil Palm Plantation Expansion in Malaysia Over the Past Decade (2007–2016) Using ALOS-1/2 PALSAR-1/2 Data.” International Journal of Remote Sensing 40 (19): 7389–7408. https://doi.org/10.1080/01431161.2019.1580824.
- Choquette-Levy, N., M. Wildemeersch, M. Oppenheimer, and S. A. Levin. 2021. “Risk Transfer Policies and Climate-Induced Immobility among Smallholder Farmers.” Nature Climate Change 11 (12): 1046–1054. https://doi.org/10.1038/s41558-021-01205-4.
- Cooper, H. V., S. Evers, P. Aplin, N. Crout, M. P. B. Dahalan, and S. Sjogersten. 2020. “Greenhouse gas Emissions Resulting from Conversion of Peat Swamp Forest to oil Palm Plantation.” Nature Communications 11 (1): 407–414. https://doi.org/10.1038/s41467-020-14298-w.
- Copernicus Sentinel-1 & Sentinel-2 data [2019–2020]. 2022. Retrieved from Google Earth Engine, processed by ESA.
- Danylo, O., J. Pirker, G. Lemoine, G. Ceccherini, L. See, I. McCallum, H. F. Kraxner, F. Achard, and S. Fritz. 2021. “A map of the Extent and Year of Detection of oil Palm Plantations in Indonesia, Malaysia and Thailand.” Scientific Data 8 (1): 96. https://doi.org/10.1038/s41597-021-00867-1.
- Dash, J., C. Jeganathan, and P. M. Atkinson. 2010. “The use of MERIS Terrestrial Chlorophyll Index to Study Spatio-Temporal Variation in Vegetation Phenology Over India.” Remote Sensing of Environment 114 (7): 1388–1402. https://doi.org/10.1016/j.rse.2010.01.021.
- Descals, A., Z. Szantoi, E. Meijaard, H. Sutikno, G. Rindanata, and S. Wich. 2019. “Oil Palm (Elaeis Guineensis) Mapping with Details: Smallholder Versus Industrial Plantations and Their Extent in Riau, Sumatra.” Remote Sensing 11 (21): 2590. https://doi.org/10.3390/rs11212590.
- Descals, A., S. Wich, E. Meijaard, D. L. A. Gaveau, S. Peedell, and Z. Szantoi. 2021. “High-resolution Global map of Smallholder and Industrial Closedcanopy oil Palm Plantations.” Earth System Science Data 13 (3): 1211–1231. https://doi.org/10.5194/essd-13-1211-2021.
- FAO, FAOSTAT. 2018. Food and Agriculture Organization of the United Nations. Rome: CAKI publishing, CAB International Wallingford, Oxon OX10 8DE, UK.
- Farr, T. G., P. A. Rosen, E. Caro, R. Crippen, R. Duren, S. Hensley, M. Kobrick, et al. 2007. “The Shuttle Radar Topography Mission.” Reviews of Geophysics 45 (2): 1–33. https://doi.org/10.1029/2005RG000183.
- Gao, B.-C. 1996. “NDWI—A Normalized Difference Water Index for Remote Sensing of Vegetation Liquid Water from Space.” Remote Sensing of Environment 58 (3): 257–266. https://doi.org/10.1016/S0034-4257(96)00067-3.
- Gaveau, D. L. A., B. Locatelli, M. A. Salim, H. Yaen, P. Pacheco, and D. Sheil. 2018. “Rise and Fall of Forest Loss and Industrial Plantations in Borneo (2000–2017).” Conservation Letters 12 (3): e12622. https://doi.org/10.1111/conl.12622.
- Gitelson, A. A., A. Viña, V. Ciganda, D. C. Rundquist, and T. J. Arkebauer. 2005. “Remote Estimation of Canopy Chlorophyll Content in Crops.” Geophysical Research Letters 32 (8): 8. https://doi.org/10.1029/2005GL022688.
- Glinskis, E. A., and V. H. Gutiérrez-Vélez. 2019. “Quantifying and Understanding Land Cover Changes by Large and Small oil Palm Expansion Regimes in the Peruvian Amazon.” Land Use Policy 80: 95–106. https://doi.org/10.1016/j.landusepol.2018.09.032.
- Henders, S., U. M. Persson, and T. Kastner. 2015. “Trading Forests: Land-use Change and Carbon Emissions Embodied in Production and Exports of Forest-Risk Commodities.” Environmental Research Letters 10 (12): 125012. https://doi.org/10.1088/1748-9326/10/12/125012.
- Huete, A. R. 1988. “A Soil-Adjusted Vegetation Index (SAVI).” Remote Sensing of Environment 25 (3): 295–309. https://doi.org/10.1016/0034-4257(88)90106-X.
- Jarvis, A., H. I. Reuter, A. Nelson, and E. Guevara. 2008. “Hole-filled SRTM for the Globe Version 4.” CGIAR-CSI SRTM 90 m Database 15 (25-54): 5.
- Kajisa, K., M. K. Maredia, and D. Boughton. 1997. “Transformation versus stagnation in the oil palm industry: A comparison between Malaysia and Nigeria.”.
- Kaplan, G., L. Fine, V. Lukyanov, V. S. Manivasagam, J. Tanny, and O. Rozenstein. 2021. “Normalizing the Local Incidence Angle in Sentinel-1 Imagery to Improve Leaf Area Index, Vegetation Height, and Crop Coefficient Estimations.” Land 10 (7): 680. https://doi.org/10.3390/land10070680.
- Karra, K., C. Kontgis, Z. Statman-Weil, J. C. Mazzariello, M. Mathis, and S. P. Brumby. 2021. Global land use/land cover with Sentinel 2 and deep learning. Paper presented at the 2021 IEEE international geoscience and remote sensing symposium IGARSS.
- Koh, L. P., J. Miettinen, S. C. Liew, and J. Ghazoul. 2011. “Remotely Sensed Evidence of Tropical Peatland Conversion to oil Palm.” Proceedings of the National Academy of Sciences 108 (12): 5127–5132. https://doi.org/10.1073/pnas.1018776108.
- Lamb, H. H. 2013. Climate: Present, Past and Future (Routledge Revivals): Volume 2: Climatic History and the Future. London: Routledge.
- Lang, N., W. Jetz, K. Schindler, and J. D. Wegner. 2022. “A High-Resolution Canopy Height Model of the Earth.” Computer Vision and Pattern Recognition. https://doi.org/10.48550/arXiv.2204.08322.
- Li, W., R. Dong, H. Fu, and L. Yu. 2018. “Large-Scale Oil Palm Tree Detection from High-Resolution Satellite Images Using Two-Stage Convolutional Neural Networks.” Remote Sensing 11 (1): 11. https://doi.org/10.3390/rs11010011.
- Li, W., H. Fu, L. Yu, and A. Cracknell. 2016. “Deep Learning Based Oil Palm Tree Detection and Counting for High-Resolution Remote Sensing Images.” Remote Sensing 9 (1): 22. https://doi.org/10.3390/rs9010022.
- Maskell, G., A. Chemura, H. Nguyen, C. Gornott, and P. Mondal. 2021. “Integration of Sentinel Optical and Radar Data for Mapping Smallholder Coffee Production Systems in Vietnam.” Remote Sensing of Environment 266: 112709. https://doi.org/10.1016/j.rse.2021.112709.
- Nelson, P. N., J. Gabriel, C. Filer, M. Banabas, J. A. Sayer, G. N. Curry, G. Koczberski, and O. Venter. 2014. “Oil Palm and Deforestation in Papua New Guinea.” Conservation Letters 7 (3): 188–195. https://doi.org/10.1111/conl.12058.
- Nguyen, T. T. H., T. N. Q. Chau, T. A. Pham, T. X. P. Tran, T. H. Phan, and T. M. T. Pham. 2021. “Mapping Land use/Land Cover Using a Combination of Radar Sentinel-1A and Sentinel-2A Optical Images.” IOP Conference Series: Earth and Environmental Science 652 (1): 012021. https://doi.org/10.1088/1755-1315/652/1/012021.
- Pekel, J.-F., A. Cottam, N. Gorelick, and A. S. Belward. 2016. “High-resolution Mapping of Global Surface Water and its Long-Term Changes.” Nature 540 (7633): 418–422. https://doi.org/10.1038/nature20584.
- Pirker, J., A. Mosnier, F. Kraxner, P. Havlík, and M. Obersteiner. 2016. “What are the Limits to oil Palm Expansion?” Global Environmental Change 40: 73–81. https://doi.org/10.1016/j.gloenvcha.2016.06.007.
- Qaim, M., K. T. Sibhatu, H. Siregar, and I. Grass. 2020. “Environmental, Economic, and Social Consequences of the Oil Palm Boom.” Annual Review of Resource Economics 12 (1): 321–344. https://doi.org/10.1146/annurev-resource-110119-024922.
- Shaharum, N. S. N., H. Z. M. Shafri, W. A. W. A. K. Ghani, S. Samsatli, M. M. A. Al-Habshi, and B. Yusuf. 2020. “Oil Palm Mapping Over Peninsular Malaysia Using Google Earth Engine and Machine Learning Algorithms.” Remote Sensing Applications: Society and Environment 17: 100287. https://doi.org/10.1016/j.rsase.2020.100287.
- Tarigan, S. D., and S. Widyaliza. 2015. “Expansion of Oil Palm Plantations and Forest Cover Changes in Bungo and Merangin Districts, Jambi Province, Indonesia.” Procedia Environmental Sciences 24: 199–205. https://doi.org/10.1016/j.proenv.2015.03.026.
- Team, Planet. 2017. Planet Application Program Interface: In Space for Life on Earth. San Francisco, CA.
- Tucker, C. J., D. A. Slayback, J. E. Pinzon, S. O. Los, R. B. Myneni, and M. G. Taylor. 2001. “Higher Northern Latitude Normalized Difference Vegetation Index and Growing Season Trends from 1982 to 1999.” International Journal of Biometeorology 45 (4): 184–190. https://doi.org/10.1007/s00484-001-0109-8.
- Van Deventer, A. P., A. D. Ward, P. H. Gowda, and J. G. Lyon. 1997. “Using Thematic Mapper Data to Identify Contrasting Soil Plains and Tillage Practices.” Photogrammetric Engineering and Remote Sensing 63: 87–93.
- Wu, C., J. M. Chen, and N. Huang. 2011. “Predicting Gross Primary Production from the Enhanced Vegetation Index and Photosynthetically Active Radiation: Evaluation and Calibration.” Remote Sensing of Environment 115 (12): 3424–3435. https://doi.org/10.1016/j.rse.2011.08.006.
- Xiao, H., F. Su, D. Fu, H. Yu, C. Ju, T. Pan, and L. Kang. 2021. “10-M Global Mangrove Classification Products of 2018-2020 Based on Big Data.” In.: Science Data Bank.
- Xu, Y., L. Yu, P. Ciais, W. Li, M. Santoro, H. Yang, and P. Gong. 2022. “Recent Expansion of oil Palm Plantations Into Carbon-Rich Forests.” Nature Sustainability 5 (7): 574–577. https://doi.org/10.1038/s41893-022-00872-1.
- Xu, Y., L. Yu, W. Li, P. Ciais, Y. Cheng, and G. Peng. 2020. “Annual oil Palm Plantation Maps in Malaysia and Indonesia from 2001 to 2016.” Earth System Science Data 12 (2): 847–867. https://doi.org/10.5194/essd-12-847-2020.