
 ?Mathematical formulae have been encoded as MathML and are displayed in this HTML version using MathJax in order to improve their display. Uncheck the box to turn MathJax off. This feature requires Javascript. Click on a formula to zoom.
ABSTRACT
International ports play critical roles in maintaining transportation flows and sustaining the effectiveness of global maritime logistics. Although the concept of versatile ports has been introduced to represent the specific patterns that these ports play at the regional and global levels, there is still a need for the design and development of computational approaches that support these notions. This paper introduces a flexible multi-layer network approach for an international maritime network whose interest is that it offers a flexible model that favours the identification of the different transportation flows and versatile ports. The model is complemented by a series of structural indices complemented by a new overlap measure that evaluates the specific role of a given port across various transportation trades. The whole approach is implemented and experimented with using massive AIS maritime data that supports the automatic generation of the multi-layer network, and derivation of the structural measures while maintaining a flexible view of the maritime network. The experiments applied to the global maritime transportation network identify key versatile ports and highlight significant differences at the regional and trade flow levels.
1. Introduction
Maritime transportation is the backbone of international trade, accounting for roughly 80% of the total global trade volume (Xu et al. Citation2020). It has been observed that maritime trade relies on the transportation of diverse types of vessels connecting ports all over the world. Ports worldwide are essential nodes in the transport chain and logistics as they ensure the smooth operation of maritime transportation. Vessels of various types (e.g. oil, container, bulk carrier) tend to call at different ports and travel in distinctive patterns, resulting in the formation of some specific single-layer subnetworks. Among them, some vital ports can play a variety of roles when considering different single-layer subnetworks (Peng et al. Citation2018). Hence, the whole maritime transportation network can be defined as a multilayer network made of complementary single-layer subnetworks (Ducruet Citation2017). These vital ports play crucial roles in the cohesiveness of the whole maritime network structure, bridging together different types of trade relations. We define them as versatile ports with reference to the notion of the versatile node as suggested in previous research (De Domenico et al. Citation2015b). When considering a maritime network, this also leads to the emergence of a series of maritime trade networks, each with its own set of goods and structural properties that reflect the different roles exhibited by these versatile ports. Versatile ports play a critical role in ensuring the stability of different types of maritime cargo networks. A better understanding of these versatile port roles might be of great value when studying the global maritime network's stability and dynamics.
The concept of the versatile node has been previously introduced in a series of previous works (Wang et al. Citation2023; Depari et al. Citation2022). The computational implementation and application of this concept to large maritime datasets, on the other hand, remains an open research question. The objective will be to operationalize the concept using real maritime transportation data and then derive insights from the structural patterns that emerge. At the modelling level, a key question to address is the search for the most appropriate flexible network representation that keeps the specificity of the different maritime trades while also providing a global view. Next, a successful framework should also offer a series of structural indices to quantitatively evaluate the different versatile port properties that emerge from the different maritime trades. Finally, there will be a need to apply the whole approach to real and very large maritime transportation data in an implementation that supports the derivation of versatile ports and then an understanding of the different patterns that emerge.
This paper introduces a comprehensive multilayer modelling and computational framework for evaluating the various roles and trade relationships displayed by a global maritime transportation network. The goal is to characterize versatile ports and emerging properties of the global maritime network based on various transportation goods. Our approach is grounded on previous research that characterizes maritime transportation patterns as a whole and according to specific trade patterns (Mou et al. Citation2018; Yu et al. Citation2019; Wan, Yinxiang Zhao, and Yip Citation2021). For example, while these studies appear to show that Singapore and Shanghai play major roles in container, bulk carrier, and oil goods, this is not the case; Ras Laffan is important in LNG transportation but not so much in other goods (Peng et al. Citation2021). As a result, when summarizing all transportation routes and goods in an aggregated network, as suggested in previous work, a versatile port property and the presence of multiple types of routes cannot be thoroughly studied. A single-layer network, while providing a homogeneous view of maritime transportation patterns, does not provide a clear picture of specific transportation routes and volumes when considering different goods. This could even lead to false conclusions. A multi-layer modelling approach should keep the specific properties of the different transportation trades. For instance, container ships are important modes of transportation that are widely used in maritime transportation. Bulk carriers are prominent solutions for transporting a variety of specific cargoes such as grain, iron ore, coal, and so on, whereas oil, natural gas, and petroleum gas are critical strategic resources that play an important role in maritime transportation. Over the last few years, most ships have had the Automatic Identification System (AIS) installed, which accurately provides and broadcasts real-time maritime transportation data (e.g. ship type and cargo, origin, and destination ports) (Zhang, Meng, and Fwa Citation2019). AIS data are valuable data sources for developing an appropriate network-based and real-time representation of the global maritime transportation system, as well as transportation flows and logistical trade relationships between global ports (Kaluza et al. Citation2010; Woolley-Meza et al. Citation2011; Yan et al. Citation2020). Our goal is to apply the principles of our multilayer network to exhibit maritime transportation properties at different levels and highlight the multifaceted nature of global maritime transportation by taking advantage of the large maritime transportation data flows made available by AIS systems.
Our research makes both theoretical and experimental contributions. On the theoretical side, we show that the multilayer network model for the global maritime transportation network can consider all the distinctive features of the corresponding single-layer networks, and we develop a multi-layer modelling strategy to represent the global maritime transportation network while maintaining the structural characteristics of various maritime routes and offering a global perspective. A series of complementary structural indices derived from network analysis principles and recent progress in the analysis of large social and multilayer networks are used to evaluate the various trends that appear at the layer and global levels. At the experimental level, we apply our modelling approach to a demonstrative maritime cargo network derived from a massive AIS maritime dataset. The goal is to gain some insight into the various roles that major global ports play when it comes to various freights. The primitive transportation goods considered for the design of our multi-layer maritime transportation network are containers, bulk carriers, oil, liquefied natural gas (LNG), and liquefied petroleum gas (LPG), all of which play an important role in international trade.
The remainder of this paper is structured as follows: Section 2 introduces related works, while the main principles of our modelling approach are introduced in Section 3. Section 4 develops the application of our modelling framework to a large maritime transportation network and analyzes a series of empirical results. The conclusions are finally presented in Section 5.
2. Related work
Global maritime transportation serves as the backbone of logistics operations for international trade and global supply chains (Li, Pundt, and Miller-Hooks Citation2021). Among many economic factors, ports play a key logistical role in the worldwide distribution of transportation and transhipment flows. By abstracting ports as nodes and trade routes as edges, the global maritime transportation system can be represented as a complex network model, thus providing many opportunities for analyzing its underlying structural properties. Over the past few years, global maritime and trade flows have been progressively studied using network theories and principles (Asadabadi and Miller-Hooks Citation2020; Jiang et al. Citation2015; Wu et al. Citation2019; Pan et al. Citation2019; Peng et al. Citation2019). The importance of ports has been highlighted with different types of maritime transportation goods (container, bulk carrier, oil, etc.) and using network-based indices such as the local measures of degree (Del Mondo et al. Citation2021; Sun et al. Citation2020), global measures like betweenness centrality (Laxe, Seoane, and Montes Citation2012), closeness centrality (Peng et al. Citation2019; Wang and Cullinane Citation2016), eigenvector centrality (Kanrak and Nguyen Citation2021), hubs and authorities (Jeon, Duru, and Yeo Citation2019); and PageRank (Gülmez, Denktaş Şakar, and Baştuğ Citation2021). Among them, three typical network models are adopted: the single-layer network, the aggregated network, and the multilayer network (used in our study). The peculiarity of the approach as compared to a series of related works is introduced in .
Table 1. Comparison to previous research.
2.1. Single layer and aggregated layer network modelling
Most studies of maritime networks mostly adopted a single-layer network model to mine the important ports. This model generally assumes that ports are linked to each other only by a single type of homogeneous edge (trade relation), which encapsulates all transportation connections between them. The results of other relevant investigations conducted with a single-layer model are presented in . Singapore, Rotterdam, Hamburg, and Hong Kong emerge as the most prominent ports according to measures of degree and betweenness centrality, as demonstrated by Ducruet and Notteboom (Citation2012), who conducted research on the global container transportation network in 1996 and 2006 to reach their conclusions. When considering ports of global bulk carrier and oil transportation, Yan, He, and Yang (Citation2022) discovered that the Ports of Singapore, Rotterdam, Kandla, Zhoushan, Qingdao, Ulan, and Los Angeles are the top 10 ports in terms of the importance of in-degree and in-strength from 2014 to 2017. When examining the transit of LNG, the majority of the top 10 ports do not do very well when compared to other transportation networks (Peng et al. Citation2021). When looking at various kinds of maritime transportation networks from a broader perspective, the findings of this research indicate that the relative significance of key ports varies significantly. For instance, some of the most significant ports for the transportation of oil and gas tend to be among the least significant for the movement of container ships and bulk carriers. Nevertheless, the versatile characteristics of ports and the vital role they play in the world's maritime system are not capable of being modelled with a single-layer network employing a single type of trade.
Aggregating multiple single layers into a single aggregated layer is the definition of an aggregated network model. However, this must be done without considering the presence of multiple types of edges (which means that all ports must be involved in all types of interactions) and without analyzing the overlaps and interdependencies between those edges (Woolley-Meza et al. Citation2011; Peng et al. Citation2018). Using a variety of structural measures such as weighting degrees, weighted closeness centralities, and weighted betweenness centralities, it has been determined that Singapore, Algeciras, and Marsaxlokk rank as the top three most important ports along the twenty-first century Maritime Silk Road. Marsaxlokk ranks fourth, followed by Algeciras, and then Marsaxlokk (Peng et al. Citation2018).
However, a challenging question that still arises is whether different transportation layers exhibit similar or contrasting patterns when considering different goods, and to what degree an aggregated layer can represent the underlying structure and complexity of the maritime transportation system. Another question that still arises is whether a single layer can represent the underlying structure and complexity of the maritime transportation system. For example, while comparing the network topologies of three distinct maritime levels – tankers, bulk carriers, and containers, in that order – it has been found that there is considerable variance in the network structure of each of these layers (Kaluza et al. Citation2010). As a result, reducing the entire maritime system to an aggregated network in which ports are connected by only a single type of trade relation is considered an extreme oversimplification of transportation complexity, and the versatile characteristics of a given port resulted in different patterns when considering specific types of maritime networks. In addition, combining many networks may cause one to ignore some of the specialized functions that ports perform in a certain transportation industry (De Domenico et al. Citation2015a).
2.2. Multilayer network modelling
A global maritime transportation system can be viewed as a network of interactions that can be classified as trade links among various trade layers. This should lead to a multi-layer modelling approach whose properties should be evaluated to capture the versatile characteristics of ports. A multilayer network model combines multiple networks, called ‘layers,’ into one mathematical object (Kivelä et al. Citation2014). It enables us to model different types of trade relations among the same set of ports, where each layer corresponds to a specific maritime layer (e.g. container, bulk carrier, oil, LNG, and LPG). Moreover, studying multilayer networks enables the examination of ports’ roles, namely their versatile characters, in a maritime network by simultaneously considering multiple modes of interaction. Over the past few years, the multilayer network model has attracted a great deal of attention (Kivelä et al. Citation2014; Boccaletti et al. Citation2014; McGee et al. Citation2019; Danziger et al. Citation2019). Multilayer modelling has been so far applied to many domains, such as the analysis of corporate networks (de Jeude, Aste, and Caldarelli Citation2019), animal behaviour networks (Finn et al. Citation2019), global trade networks (Alves et al. Citation2018; Alves et al. Citation2019), and transportation networks (Du et al. Citation2016; Zhou et al. Citation2021). A series of theoretical and experimental studies have shown that multilayer network analysis has facilitated substantial advances over single-layer network approaches. Common network indices used in a single-layer network have been extended to make them suitable for multi-layer network modelling (De Domenico et al. Citation2013; Kivelä et al. Citation2014; Aleta and Moreno Citation2019). De Domenico et al. (Citation2013) introduced a tensor framework to manipulate single-layer and multilayer networks and generalized several network indices (e.g. degree centrality, eigenvector centrality, diffusion, etc.). Among all the above-mentioned indices, De Domenico et al. (Citation2015b) introduced a mathematical framework to derive centrality and rank versatile nodes. By conducting empirical multilayer network analysis, they showed that aggregated network approaches would lead to a misleading finding of the nodes that are the most versatile while overestimating the importance of some marginal nodes. Conversely, a multilayer model comprehensively considers the importance of the different nodes according to different underlying layers and might then identify nodes ranked non-prominent in the aggregated network while playing a significant role when considering different layers.
In a related study, it was shown that by examining global maritime multilayer networks and their development from 1977 to 2008, a noteworthy pattern was the strengthening of previously significant ports while the maritime network gradually grew and centred around large hub ports (Ducruet Citation2017). Ducruet (Citation2022) also looks at 20 shipping traffic types that connected more than 1,600 ports in 2008. The main findings indicate that more diverse nodes, which get more traffic and have stronger connectivity, are very important to the global network. Also, it highlights the maritime system's levels and the functions of several shipping sectors. Including various maritime and land trade routes, a multilayer network model offers a comprehensive perspective on maritime trade patterns while permitting more trade-specific patterns (Alderson, Funk, and Gera Citation2020). They thoroughly list all potential situations with precisely interdicted ports or maritime chokepoints in order to determine the most crucial ports (i.e. ports that, if interdicted, result in the largest rise in the overall ‘cost’ of the system). Overall, these preliminary studies provide the main motivation and background for developing a formal multilayer modelling approach applied to the global maritime domain. The peculiarity of our approach is that it first retains a multilayer modelling approach applied to the international maritime transportation network and secondly integrates a series of structural indices identified in several of these works while also complementing them with a specific overlap measure that evaluates the respective role of a given port across different transportation trade layers. The second contribution of our approach is that the multilayer network is interactively and automatically generated from a large repository of AIS maritime trajectories, showing the applicability of the whole approach. The interest in the whole approach is demonstrated by an analysis of the different roles of key ports as exhibited by a data mining approach applied to the multilayer model.
3. Data and methodology
3.1. Data and network construction
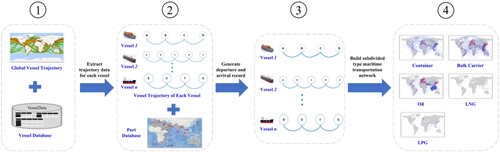
The container, bulk carrier, oil, LNG, and LPG AIS data, as well as worldwide port and vessel attribute data from 1 January to 31 December 2017, have been used to construct the global maritime network. HiFleet Co., Ltd. (http://www.hifleet.com), a maritime data supplier in Shanghai, China, was consulted for AIS data, a port attributes database, and a vessel attributes database. AIS data, which is transmitted automatically with a reporting frequency, consists of both static information about vessels (such as their names, types, lengths, and widths) and real-time information about their whereabouts and movements (e.g. real-time position, speed, course, heading, loading status, destination port, etc.). (a) depicts a simplified version of the AIS data structure used to compute vessel arrival and departure records. Each line of records represents the ship's real-time trajectory. The Maritime Mobile Service Identity (MMSI) number, which is specific to each vessel and connected to its type via the Vessel Database (Kroodsma et al. Citation2018), and the real-time position of the vessel are both included in this structure (longitude and latitude). More than 100 million vessel trajectories are recorded per day, for a total of almost 40 billion in 2017. The port characteristics database is the source for the location data of the ports ((b)).
Table 2. Simplified version of AIS data and Port data.
Before building the worldwide maritime transportation network, we preprocessed AIS data using Yan et al. (Citation2020)'s methods, which comprised noise elimination, data screening, and data calibration. shows the process of constructing the world's maritime transportation network. First, all the single vessel trajectory data are extracted by combining the global vessel trajectory data and the vessel data (①). For instance, the trajectory data for Vessel 1′s departure from port A and arrival at port D can be found in ②. Secondly, by utilizing the methods described in this reference (Wu et al. Citation2017), trajectory data are aggregated and associated with corresponding port locations around the world, as well as departure and arrival time records (②). For instance, a vessel that is called port A, B, C, or D can be associated with journeys (AB, BC, and CD, units: times), as shown in ③; Thirdly, a reference dataset is generated that contains all of the vessel journeys (measured in times) that occurred during that time period (③); Last but not least, individual transportation networks for the container, bulk carrier, oil, LNG, and LPG have been generated, and they support further analysis based on departure and arrival records from 2017 (④).
Figure 1. Maritime transportation network generation.
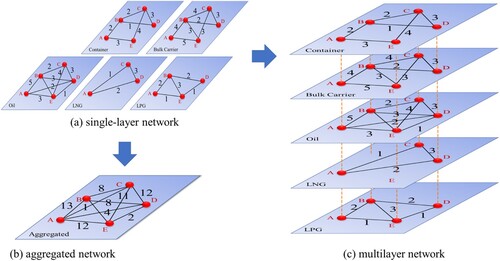
Based on the above modelling principle, five types of single-layer networks (a, namely container, bulk carrier, oil, LNG, and LPG) and an aggregated network are constructed (b). The aggregated network denotes a single layer aggregated from all trade relations represented as different five single layers; the edge's weight is equal to the sum of the edge weights of the five single layers, while a multi-layer network is made of five maritime transportation networks (c). A common simplifying assumption is that each layer encompasses the same ports, but not all ports need to be involved in all types of links. Regarding the multi-layer network (c), red nodes denote ports in the network, while black lines represent the actual routes between these ports. The orange dotted lines connect a given port between different layers and denote its different roles in those layers. For example, a port named A can play a role across all five layers, while a port named B with four functions (namely, container, bulk carrier, oil, and LPG) is associated with all layers except the LNG layer.
Figure 2. Schematic representation of network: (a) single-layer network; (b) aggregated network; (c) multilayer network.
More formally let us define a multilayer graph where
,
, … ,
denote the layers,
denotes the number of layers (e.g. container, bulk carrier, oil, etc.). A given layer
is defined as
with
the set of nodes representing the ports involved in this layer,
the connections between these ports,
the weight matrix associated with this layer (the weight between every two ports is valued by the accumulated trade journeys on this route) (cf. for formal notations). For any port
, let
denotes the set of layers associated with this port, that is,
(that is a subset of
). We adopt an adjacency tensor
to represent the global maritime multilayer network (De Domenico et al. Citation2013). This adjacency tensor
is a generalization of the concept of an adjacency matrix from graphs to hypergraphs, it is formally defined as follows:
where
denotes the intensity of the relationship (possibly asymmetric) between node
in layer
(
) and node
in layer
(
), and
denotes the fourth-order tensors of the canonical basis in space
. The focus is to represent the interlayer connections of a given node to its corresponding node in the other layers.
Table 3. Formal notations.
3.2. Methodology
Let us first introduce the network indices that denote the structural properties and compare the differences between single-layer network and their aggregated network. Then, a series of additional indices highlight the degree to which the multi-layer network exhibits structural properties that confirm or diverge from specific single-layer networks (overlap ratio, Pearson's correlation coefficient, and structural reducibility). Thirdly, we introduce a multi-layer network PageRank algorithm applied to mine versatile ports. Finally, the characteristics of some typical ports in multi-layer, aggregated, and single-layer networks are outlined and discussed.
3.2.1. Network indices
Two network indices are selected to characterize the structural properties of the maritime transportation network, that is, the shortest path L and the clustering coefficient C. These two indices have complementary objectives: the shortest path should reveal the specific location and role of a given port in the maritime network (i.e. central vs. peripheral), while the clustering coefficient shows differences between locally homogenous or homogenous local trends in the maritime network.
The average shortest path length L of the global maritime network is given by the average topological distance between any two single ports as follows (Ashton, Jarrett, and Johnson Citation2005):
(1)
(1) where n denotes the number of ports in the network and
is the topologically shortest path distance between ports i and j calling the number of intermediary ports.
The clustering coefficient (Albert and Barabási Citation2002) C applied to a maritime network should reflect the tightness of the port connections in a given maritime network:
(2)
(2)
(3)
(3)
where N is the number of ports of the network denotes the clustering coefficient of node v,
is the set that contains all connected ports with port v,
is the size of the set
,
is the possible maximum number of edges between
nodes,
is the number of edges in the whole network between all neighbours of port v. A higher C denotes a relatively clustered neighbourhood, this, for example, showing that a cargo can be transported rapidly within the local trade area.
3.2.2. Multilayer structure
Let us further elaborate on the properties of the multilayer maritime transportation network approach. We first introduce an overlap ratio between ports and routes of any two single-layer networks to evaluate the respective multiple functions of a given port. Next, the Pearson's correlation coefficient, as suggested in related work (Nicosia and Latora Citation2015), is applied to evaluate the interlayer relationships of different categories of maritime networks. Finally, structural reducibility (De Domenico et al. Citation2015a) indicates whether a multilayered maritime complex system can be represented by an aggregated network model.
The port (route) overlap ratio (
) is derived as follows:
(4)
(4) where
denotes the routes for a given port which appear in layers
and
, while
denotes the total number of routes of a given port over the considered layers
and
.
The Pearson's correlation coefficient formula is given as follows:
(5)
(5) where
and
represent the degrees of the node
respectively at layers
and
.
,
, and
respectively represent the inner product of vectors
,
, and
.
and
respectively represent the standard deviation of vector
and
.
The correlation coefficient is tested using the t-test in this paper. The procedure is as follows:
First, the correlation coefficient ‘s
value is computed:
(6)
(6) Second, in the
distribution table, find the critical values that correspond to the given saliency level and degree of freedom (n-2). Second, the corresponding critical value
(or p value) in the distribution table is found based on the given significance level and degree of freedom. Assuming
(or
),
is statistically significant; there is no statistical significance for
, if
(or
).
Structural reducibility (De Domenico et al. Citation2015a) evaluates whether the single layers of a multilayer network can be aggregated without losing their distinguishability from their corresponding aggregate network. The structural reducibility measures the relative entropy between a multilayer network and its corresponding aggregate network. The structural reducibility is given as:
(7)
(7) where
denotes the layer's counterpart to the maximum relative entropy value (formula 8 and 9) max [
], and the ratio between the reductions
and the potentially reducible layers (M–1). One can remark that
if the network cannot be reduced, namely when
, while
, only if
, the M layers can be reduced into a single aggregated layer network.
(8)
(8)
(9)
(9) A particular case is denoted by the aggregated network corresponding to
, which is the one-layer network whose adjacency matrix
is obtained by summing all the adjacency matrices of five single layers of
, that is,
. The Von Neumann entropy of this multilayer is
, where
, the Von Neumann entropy of
layer
with eigenvalues
. The Von Neumann entropy of the aggregated graph is
. Let us consider for example a five-layer multilayer network
and aggregate these single layers of
, so this gives a multilayer network
with
, where the new adjacency matrix
,
is either one or the sum of two (or more) the adjacency matrices of the original layers of
.
The value of the relative entropy q is adopted to measure the structural information of the multilayer versus its aggregated network. The larger value of , the more distinguishable the multilayer is from its aggregated network. When no layers are structurally reducible via redundant structural information calculated from the entropy value, all the layers are included and give the maximum entropy. For a complete description of the multilayer, all interactions between the different layers are represented.
3.2.3. Versatile ports mining in multilayer network
PageRank is the initial ranking strategy originally applied to evaluate web hubs and authorities (Brin and Page Citation1998). PageRank mainly reveals the role of a single webpage in relation to other web pages. The more a page is linked to by other pages, the more important it is to have a high PageRank value. The more quality pages are linked to, the more important the page with a high PageRank value is. Under similar principles in the maritime network, the PageRank algorithm not only considers the number of ports connected to other ports but also whether these connected ports include some important ports. The formula can be derived as follows:
(10)
(10)
(11)
(11)
where is the corresponding transition tensor, where such transitions can be illustrated by the process of a walker that jumps to its neighbour node with a rate
while teleporting to any other nodes with a rate
.
is the rank-4 tensor with all components equal to 1. One should note that the above definition is valid for all multilayer networks when all nodes have out-connections through edges. If not, as this might be the case for a given maritime trade network, one can reduce Eq. (10) to
for all the nodes i without out-connections, confirming the precise normalization of this transition tensor
. This residual probability r is set to
as in usual PageRank algorithms.
4. Experimental results
4.1. Single layers network analysis
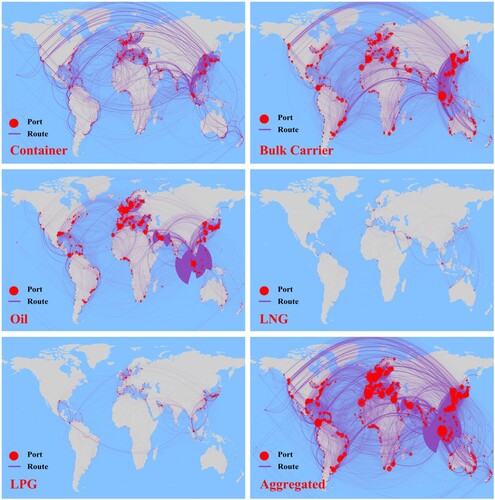
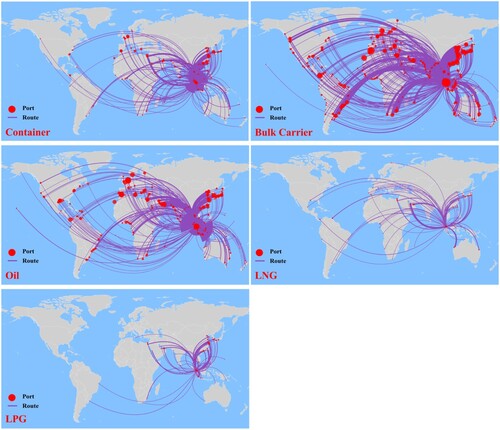
The geospatial distribution and topological structure of the five types of global maritime transportation networks considered, as well as their aggregated network, are depicted in . The visualization of these five distinct single layers demonstrates how complex trade interactions result in various network structures. Among the various types of maritime transportation, it appears that there are considerable disparities in route coverage and scale. While the route coverage between East Asia, Northwest Europe, and America is significantly higher than in other regions, the number of ports and trade journeys in these regions is much larger than those in other regions. Among these, container, bulk carrier, and oil transport are significantly larger than LNG and LPG transport. Similarly, it also appears that the majority of ports have versatile characteristics (more than two types of transportation).
Figure 3. Global maritime transportation networks.
As was mentioned in the introduction, different types of ports serve varied functions in the international trade system. It is possible to learn about the variations between maritime transport systems by analyzing their structural properties. As a first step in illustrating these distinctions, let's compute some representative network indices for a variety of single-layer and aggregated network types. The findings are shown in .
Table 4. Maritime network: structural properties.
Maritime transportation networks differ greatly. First, let's count the ports and routes used for maritime transportation. Oil transportation has 2029 ports and 43,578 routes. The largest number of routes is 45,338 for bulk carrier, which has 1974 ports. Container transportation has 1,560 ports and 16,576 routes, fewer than oil and bulk carrier transportation. LNG's 361 ports and 2012 routes are the fewest of the above networks.
Each transportation network's average degree value indicates its typical route and trade scale. The bulk carrier and oil transportation networks’ average degree values are 45.94 and 42.96, respectively, suggesting high density in trade connection. LNG and LPG transportation networks have an average degree value of 11.21 and 11.15, respectively, which indicates a lower density than the other three networks.
The bulk carrier network has the smallest average shortest path length (namely L, 2.70), and the LPG network has the largest (3.70). The average clustering coefficient (C) measures all network ports’ liking tightness. LPG has the highest value (0.57), while the bulk carrier has the lowest (0.48). Yet, these five networks have large C values, showing close port links in the five types of transportation networks.
Most ports are versatile, as the aggregated network has 2,286 ports, slightly more than the top 2 number of ports in the single-layer network (oil and bulk carrier transportation). The aggregated network has 81,758 routes, which is substantially greater than the bulk carrier transportation network (45,338) with the most routes in the single-layer network, indicating that maritime transportation single-layer networks have less overlap (cf. section 4.2). So, while the aggregated network can emphasize vital ports in the global maritime transportation network, it ignores the intimate relationships between single-layer networks. Ports in single-layer networks that contribute to the global maritime network are easy to overlook.
4.2. Towards a multi-layer network model
The previous section introduced the topological properties of the five single layers and their aggregated network. Let us then consider and distinguish these different interactions and evaluate whether an aggregated network is sufficient to represent the global maritime transportation network. Next, the port (route) overlap ratio introduced in section 3.2.2 is illustrated, as shown in .
Table 5. Port and route overlaps.
Any two types of networks have a relatively high port overlap ratio (a). The top two ports in terms of number of ports, the oil network and the bulk carrier network, have the highest overlapping ratio, reaching 76.6% and overlapping 1751 ports. While the two networks with the fewest ports, namely the LNG and LPG networks, have the lowest overlapping ratio (only 12.9%) and the fewest overlapping ports (only 294). Furthermore, it appears that 1933 ports have two or more functions (84.5%), with 273 ports having five functions (11.9%). The relatively high port overlap ratio indicates that most ports are versatile.
In comparison to the higher proportion of overlap between ports, the overlap ratio between routes is very low (b). The oil and bulk carrier networks, which ranked first and second in terms of routes, still had the highest ratio of route overlap, accounting for 23.3%, while the container and LNG networks have the lowest ratio of route overlap, accounting for only 0.8%. A low edge overlap value indicates that these different layers have not replicated many trade connections specified in the other layers, and thus the global maritime networks do not have a simple overlap status.
The Pearson correlation with verification of its significance between different networks shows the inter-layer associativity of different layers, the results are shown in .
Table 6. Inter-layer associativity (Pearson correlation) of different layers.
The Pearson correlation value between different single-layer networks ranges from 0.406 to 0.724, and all the P values are less than 0.05. Among them, the oil and LPG networks had the largest value at 0.724, and even the container and LNG networks had the smallest value at 0.406. Therefore, this shows a strong correlation and is significant between different layers.
By determining whether some layers in a multilayer network can be aggregated without losing their distinguishability, one can find the multilayer configuration that maximizes information. The structural reducibility is applied to derive the relative entropy value between the multilayer and its aggregate network, as shown in .
Figure 4. Multilayer structural reducibility.
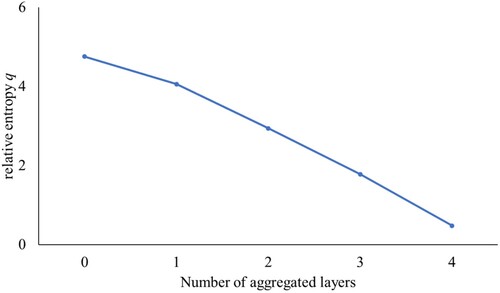
As can be seen in , the largest relative entropy q equals 5 when all 5 layers are considered in the multilayer network (specifically, the value of the X-axis is 0; X-axis = 1 denotes 4 layers in the multilayer network, and so on), and this can be obtained by calculating the structural reducibility value between all layers, which yields a null value. As this is the case, a multilayer structure consisting of identical single-layer networks is ideal for a network. For this reason, it is not possible to simply combine the multilayer network into a single layer, as each layer conveys unique structural information. This demonstrates that the worldwide maritime transportation network can be modelled using a multi-layer network model, which considers the unique characteristics of each layer to yield a useful strategy for mining versatile ports.
4.3. Versatile ports in a global maritime multilayer network
It can be concluded from the previous section that most ports have the multifunctionality of berthing several maritime transportation trades. Therefore, analyzing the versatile ports might be of great significance for exploring the emerging patterns of global maritime transportation.
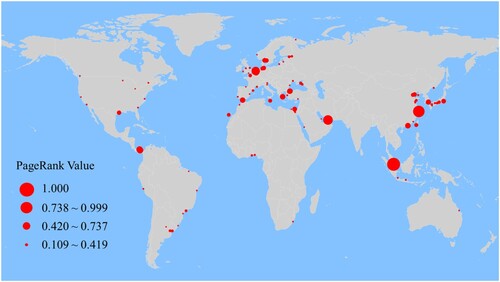
PageRank values for various ports are derived from the global maritime network's multi-layer network and specific layers. As illustrated in , the top 150 ports are primarily located in Eastern Asia, Europe and the Mediterranean Sea, America, and the Middle East. A PageRank analysis of the top 150 ports reveals that, while all transportation layers are generally active, significant differences emerge when considering the various transportation trades.
Figure 5. Geospatial distribution of the top 150 ranked ports.
A few examples of top-ranked ports illustrate the vital function they play in the worldwide maritime network. The multi-layer network model is applied to the identification of versatile ports, and its performance is compared to the single-layer and aggregated network models. Versatile ports are ranked over three different network modelling approaches: multilayer, aggregated, and single-layer. PageRank values for these well-known ports are shown in .
Table 7. PageRank ranking of some representative top-ranked ports.
According to , the table shows that both models identify the most prominent ports, but with differences in the rankings, and the multilayer and aggregated network models rank versatile ports differently. On the one hand, we present some of the well-known top 20 ports in multilayer rank, and we can see that there is little difference between the ranks of ports in multi-layer networks and those in aggregated networks. For example, the major is the Hamburg case, which is ranked 14th in the aggregated network but 20th in the multi-layer network. Comparison to the single-layer rankings demonstrates the multifaceted nature of their versatile roles in maritime transportation. On the other hand, as we show in the table's last three rows, several of the most important oil and gas ports that are toward the top of the multi-layer network are near the bottom of the aggregated network. Ras Sudr, Gladstone, and Ras Laffan, for example, are ranked in the top 150 in the multi-layer network (101, 120, and 149, respectively), and the aggregated network (225, 286, and 560, respectively). Furthermore, these ports are highly ranked in one transport category but have very poor rankings in all other transport categories.
In order to highlight differences between the single layer, multilayer and aggregated networks, we categorize these ports into three types based on their ranking in various types of maritime transportation: (1) key ports that play important roles in all transportation networks (i.e. layers); (2) key ports that play important roles in several transportation networks; (3) specialized ports that play an important role in only one transportation network.
4.3.1. Ports leading in all five single layers
Previous works have demonstrated the crucial significance that major ports like Singapore and Rotterdam play when thinking about various forms of global maritime transit. Most of the world's transhipment, banking, and other services are provided by these ports, which are concentrated mostly in countries with highly developed economies and commerce or in key strategic channel positions. Because of the high transhipment demand or massive commerce demand in the hinterland, port transhipment transport is highly developed in these ports. Given their centrality to maritime trade, ports and the routes connecting them have been subject to extensive path dependence after years of development (Ducruet Citation2017). As a result, the highest PageRank values that emerge in a multi-layer network are indicative of these features. Examples include Singapore, on the Malacca Strait, which ranked 1st; Zhoushan Port, in the world’s largest trading nation, China, which ranked 2nd; Khawr Fakkan, the largest transhipment hub port in the United Arab Emirates serving the Middle East, which ranked 5th; and Balboa, the most important transhipment port on the Panama Canal, which ranked 8th.
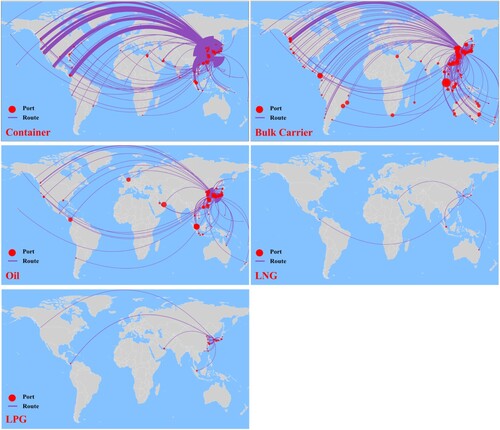
Let's use Singapore as an illustration. The growing trade patterns of the Singapore-related maritime transportation networks are shown in using PageRank values. Singapore is a peninsula that protrudes into the Strait of Malacca, which joins the Pacific and Indian oceans. It is ideally positioned as a major transhipment port between the emerging economies of Europe, the Middle East, and East Asia. It specifically holds the top rank in the multi-layer network, demonstrating the critical role it plays in connecting global maritime transportation. These ports have two features that are quite typical. First, the ports have highly extensive commercial links with the vast majority of ports in the world, which is also visible in the various maritime transport network segments. Single-layer network research demonstrates that, despite coming in just sixteenth place in the container transportation category, it is among the top three in the bulk carrier, oil, LNG, and LPG categories, highlighting its critical importance in all maritime transportation systems. The second aspect is the very large volume of trade with the top-ranked shipping ports worldwide. For example, the ports of Zhoushan and Khawr Fakkan, two of the world's top adjacent places, have also greatly contributed to Singapore's success in generating substantial trade volumes. Singapore is ranked 1st in the aggregated network, which is consistent with its multi-layer network ranking. The most significant reason for this is because it is far better positioned than other ports in all single layers and has a much higher volume of routes and journeys.
Figure 6. Singapore in the multilayer network.
4.3.2. Ports leading in some single layers
Most of the top-ranked ports are ports that maintain an important position in two or more layers, compared with the few essential global ports that play important roles in all single-layer networks. These ports serve as a significant transit hub connecting domestic and international markets, facilitating regional transhipment services and a wide range of domestic import and export trade demands. These ports are mostly found in economically developed areas such as Northwest Europe, East Asia, and the United States. Pusan, located in northeast Asia of South Korea, is ranked 16th in the multilayer network by PageRank values, while Hamburg, Europe’s second-largest container port, is ranked 20th in the multilayer network by PageRank values.
A rising number of these ports are crucial to the transportation of containers, bulk carriers, and oil. Pusan serves as a case study for these ports to help us learn more about them. depicts the multilayer networks of Pusan. Busan is South Korea's most important port and a major international shipping hub. Busan, located in the middle of Northeast Asia, has excellent connections to container ports all over the world, as seen in . Its prominence in the worldwide container transportation network may be traced back to the enormous trade volumes it has created with major container hub ports in East Asia and the Americas, such as Zhoushan in China and Balboa in the Panama Canal. Busan, also in South Korea, serves as a pivotal node in the country's international commerce network due to its position as a financial and economic powerhouse. Based on its ranking in the multilayer network modelling, it is the 16th most important port. It ranks reasonably high in the bulk carrier and oil transportation industries as well, placing 33rd and 87th, respectively, despite its prominence in the container transportation industry. In terms of gas transit around the world, its position is fairly unremarkable. It is the 178th ranked LPG and the 147th ranked LNG port in the world, respectively. It ranks 11th in the aggregated network, but there is no significant difference between it and a multi-layer network. The primary reason for this is that it has more significant advantages in the transportation of container, bulk carrier, and oil, which, when combined, more than make up for its relatively minor disadvantage in the transportation of LNG and LPG. As a result, it also holds a more pronounced dominant position in the aggregated network.
Figure 7. Pusan in the multilayer network.
4.3.3. Specialized ports
There are other specialized ports in addition to the two types of ports listed above. While they serve a variety of transit roles and are less noticeable, which are influenced by things like their very remote geographic position. Nonetheless, because of their location in a nation or region with an abundance of resources, these ports may be crucial to both local and international trade. Most of these ports are located in countries like the Middle East and Australia that have relatively substantial oil and gas industries. Typical ports include Ras Sudr in Egypt, which is ranked 101st; Gladstone in Australia, which is ranked 120th; and Ras Laffan in Qatar, which is ranked 149th globally.
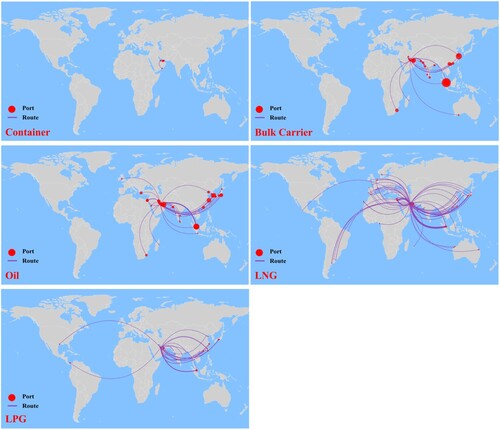
To demonstrate the features of these ports, let's use Ras Laffan as an example. In the multilayer networks, Ras Laffan's trade relations are distributed geographically and spatially (see ). Ras Laffan serves as the main port for the processing of natural gas, condensate, petrochemicals, and natural gas downstream businesses in Qatar. Qatar has abundant natural gas and oil resources, with natural gas reserves of up to 24.5 trillion cubic metres, or 13.1% of the world's total reserves, and placing third globally. In terms of transporting LNG globally, it ranks 1st. However, in stark contrast to its position in LNG, its position in other types of transportation is extremely behind, coming in at 1063rd for containers, 1071st for bulk carriers, 704th for oil, and 122nd for LPG transportation. However, its position in the worldwide multi-layer network, which is substantially higher than its specific ranking in the container, bulk carrier, and oil categories, is 149th. The primary factor is that it builds trade relations with numerous ports and occupies a very prominent place in the networks of LNG and LPG transportation. It also has a lot of trade links with the aforementioned two kinds of hub ports, including Singapore, Zhoushan, and Pusan. These vital ties have greatly aided the port's competitive advantage in international maritime traffic. Even though Ras Laffan performed well in the multi-layer network, it ranks considerably lower 560th in the aggregated network. Therefore, its position in the aggregated network significantly undervalues its vital significance in the international trade of gas. The primary cause of this is that its position is significantly behind in larger-scale transport, including container, bulk carrier, and oil transportation. also shows how few trade relations and journeys there are. This gap becomes especially noticeable when all the single layers are aggregated, which causes it to remain in a relatively backward position in the aggregated network.
Figure 8. Ras Laffan in the multilayer network.
4.4. Discussion
The findings show that several of the world's key strategic ports have distinct advantages when considering diverse maritime transportation trades. Relatively recent ports in the multi-layer network also exhibit different patterns than well-established ones. This generates diversity and variable capabilities when analyzing the roles played by the ports in the maritime network. The analysis should not be limited to the analysis of aggregated patterns. For instance, given the increasing demand for oil and gas, LNG-oriented transportation ports, although with relatively small trade scales, should be considered as playing a crucial role in global maritime transportation. Aside from their less-than-ideal location, these ports haven't made much progress in large-scale transportation modes like container and bulk carrier shipping, which reduces their relative structural importance in the overall network. In fact, by excluding the critical connections between these ports that appear at different layers, the aggregated network minimizes their roles in the global maritime transportation network. Overall, our modelling framework identifies vital ports and the whole approach is based on a massive maritime big database. Furthermore, our study does not only reflect the roles these ports play in terms of various transportation and goods but also mines the ports that play an important role in global maritime transportation, such as Singapore and Zhoushan, as is common in current research (Kawasaki et al. Citation2019; Liu, Wang, and Zhang Citation2018). By way of illustration, our methodology can be used to identify oil and gas ports that are comparatively unimportant nodes in the global aggregated maritime transportation network.
The results reveal a few significant trends that are relevant to those in charge of shipping on a global or regional scale. In particular, the multilayer approach's categorization of various trade patterns reveals varying degrees of adaptability in port activities and provides a clearer picture of the ports’ functions within the global maritime network. Another unique feature of this modelling approach is that it allows for a look back in time to see how things have changed and how various patterns have emerged, which can then be used to speculate on the impact of past economic and management choices. Ports that can accommodate a wide variety of maritime commerce activities are an indirect indication of the resiliency of the maritime transport system as a whole or of the various layers of maritime commerce that make up that system. For instance, how likely is it that the shutdown of several major ports would bring down the entire maritime transportation system? The safety and dependability of the maritime transportation network can be greatly improved if the hazards associated with these vital ports are mitigated.
Our research suggests that the global maritime network is profoundly influenced by the characteristics of the various transportation layers and that these layers display significant structural differences when analyzing patterns that emerge at the regional and local levels; this, in turn, necessitates the development of policy and management decisions at a fine level of granularity that takes into account the particulars of each trade network. Emergent patterns, in reality, do not always signify a complete overlap of the structural features of the various transit layers. This emphasizes the necessity for a multilayer model that preserves the characteristics of individual transportation networks and permits the identification of versatile ports. When these versatile ports are impeded in their usual operations due to congestion, epidemics, or other occurrences, it has a substantial effect on maritime transport. Hence, enterprises and policymakers may benefit from mining versatile ports using a multilayer network to identify the most vulnerable nodes and forecast the effects of disruptions.
5. Conclusion
The research developed in this paper introduces a multilayer modelling approach that supports the identification of versatile ports in a global maritime network through the integration of different levels of trade interactions. The first peculiarity of our approach is that it combines a sound mathematical modelling approach with a series of structural indices derived from network analysis and is complemented by a new overlap index. The second contribution is a computational implementation applied to a very large maritime trajectory dataset that practically shows the feasibility of the whole approach. The experiments are applied to containers, bulk carriers, oil, LNG, and LPG, as well as trajectory data extracted from a global maritime transportation network. The findings show that substantial differences emerge when analyzing the structure of different types of maritime single-layer transportation networks. This motivates the role of a multi-layer network model that favours the analysis of the multi-functional and versatile characteristics of key ports. It also provides a means to monitor the evolution of maritime transportation and the versatile port patterns that emerge at the global and regional levels. We believe that this will offer valuable opportunities for assisting scholars and policymakers in planning maritime transportation operations and regulation.
This research also opens many opportunities for further work. First, the current modelling principles might be extended towards the temporal dimension to provide novel opportunities to evaluate evolution trends at the different layer and multi-layer levels. Additional metrics might be considered to further refine the different indices so far identified, as well as a prospective integration of hierarchical spatial properties. Trade volumes might also be considered when loading cargo tonnages and materials. Moreover, the framework developed so far might provide some avenues to closely monitor and evaluate the impact of regional and worldwide economic trends on the different levels of properties that emerge from the multilayer transportation network, as well as a prospective resource for predicting the possible evolutions of the multilayer transportation network under different scenarios and constraints.
Disclosure statement
No potential conflict of interest was reported by the author(s).
Data availability statement
The data that support the study's findings are available from HiFleet Co., Ltd. (http://www.hifleet.com), which you can purchase from.
Additional information
Funding
References
- Albert, Réka, and Albert-László Barabási. 2002. “Statistical Mechanics of Complex Networks.” Reviews of Modern Physics 74 (1): 47. doi:10.1103/RevModPhys.74.47
- Alderson, David L, Daniel Funk, and Ralucca Gera. 2020. “Analysis of the Global Maritime Transportation System as a Layered Network.” Journal of Transportation Security 13 (3): 291–325. doi:10.1007/s12198-019-00204-z
- Aleta, Alberto, and Yamir Moreno. 2019. “Multilayer Networks in a Nutshell.” Annual Review of Condensed Matter Physics 10: 45–62. doi:10.1146/annurev-conmatphys-031218-013259
- Alves, Luiz GA, Giuseppe Mangioni, Isabella Cingolani, Francisco Aparecido Rodrigues, Pietro Panzarasa, and Yamir Moreno. 2019. “The Nested Structural Organization of the Worldwide Trade Multi-Layer Network.” Scientific Reports 9 (1): 1–14. doi:10.1038/s41598-018-37186-2
- Alves, Luiz GA, Giuseppe Mangioni, Francisco A Rodrigues, Pietro Panzarasa, and Yamir Moreno. 2018. “Unfolding the Complexity of the Global Value Chain: Strength and Entropy in the Single-Layer, Multiplex, and Multi-Layer International Trade Networks.” Entropy 20 (12): 909. doi:10.3390/e20120909
- Asadabadi, Ali, and Elise Miller-Hooks. 2020. “Maritime Port Network Resiliency and Reliability Through co-Opetition.” Transportation Research Part E: Logistics and Transportation Review 137: 101916. doi:10.1016/j.tre.2020.101916
- Ashton, Douglas J, Timothy C Jarrett, and Neil F Johnson. 2005. “Effect of Congestion Costs on Shortest Paths Through Complex Networks.” Physical Review Letters 94 (5): 058701. doi:10.1103/PhysRevLett.94.058701
- Boccaletti, Stefano, Ginestra Bianconi, Regino Criado, Charo I Del Genio, Jesús Gómez-Gardenes, Miguel Romance, Irene Sendina-Nadal, Zhen Wang, and Massimiliano Zanin. 2014. “The Structure and Dynamics of Multilayer Networks.” Physics Reports 544 (1): 1–122. doi:10.1016/j.physrep.2014.07.001
- Brin, Sergey, and Lawrence Page. 1998. “The Anatomy of a Large-Scale Hypertextual web Search Engine.” Computer Networks and ISDN Systems 30 (1-7): 107–117. doi:10.1016/S0169-7552(98)00110-X
- Danziger, Michael M, Ivan Bonamassa, Stefano Boccaletti, and Shlomo Havlin. 2019. “Dynamic Interdependence and Competition in Multilayer Networks.” Nature Physics 15 (2): 178–185. doi:10.1038/s41567-018-0343-1
- De Domenico, Manlio, Vincenzo Nicosia, Alexandre Arenas, and Vito Latora. 2015a. “Structural Reducibility of Multilayer Networks.” Nature Communications 6 (1): 1–9. doi:10.1038/ncomms7864.
- De Domenico, Manlio, Albert Solé-Ribalta, Emanuele Cozzo, Mikko Kivelä, Yamir Moreno, Mason A Porter, Sergio Gómez, and Alex Arenas. 2013. “Mathematical Formulation of Multilayer Networks.” Physical Review X 3 (4): 041022. doi:10.1103/PhysRevX.3.041022
- De Domenico, Manlio, Albert Solé-Ribalta, Elisa Omodei, Sergio Gómez, and Alex Arenas. 2015b. “Ranking in Interconnected Multilayer Networks Reveals Versatile Nodes.” Nature Communications 6 (1): 1–6. doi:10.1038/ncomms7868.
- de Jeude, JA van Lidth, Tomaso Aste, and Guido Caldarelli. 2019. “The Multilayer Structure of Corporate Networks.” New Journal of Physics 21 (2): 025002. doi:10.1088/1367-2630/ab022d
- Del Mondo, Géraldine, Peng Peng, Jérôme Gensel, Christophe Claramunt, and Feng Lu. 2021. “Leveraging Spatio-Temporal Graphs and Knowledge Graphs: Perspectives in the Field of Maritime Transportation.” Isprs International Journal of Geo-Information 10 (8): 541. doi:10.3390/ijgi10080541
- Depari, Alessandro, Paolo Bellagente, Paolo Ferrari, Alessandra Flammini, Marco Pasetti, Stefano Rinaldi, and Emiliano Sisinni. 2022. “Minimal Wide-Range Resistive Sensor-to-Microcontroller Interface for Versatile IoT Nodes.” IEEE Transactions on Instrumentation and Measurement 71: 1–9. doi:10.1109/TIM.2022.3175045
- Du, Wen-Bo, Xing-Lian Zhou, Oriol Lordan, Zhen Wang, Chen Zhao, and Yan-Bo Zhu. 2016. “Analysis of the Chinese Airline Network as Multi-Layer Networks.” Transportation Research Part E: Logistics and Transportation Review 89: 108–116. doi:10.1016/j.tre.2016.03.009
- Ducruet, César. 2017. “Multilayer Dynamics of Complex Spatial Networks: The Case of Global Maritime Flows (1977–2008).” Journal of Transport Geography 60: 47–58. doi:10.1016/j.jtrangeo.2017.02.007
- Ducruet, César. 2022. “Port Specialization and Connectivity in the Global Maritime Network.” Maritime Policy & Management 49 (1): 1–17. doi:10.1080/03088839.2020.1840640
- Ducruet, C., and T. Notteboom. 2012. “The Worldwide Maritime Network of Container Shipping: Spatial Structure and Regional Dynamics.” Global Networks-a Journal of Transnational Affairs 12 (3): 395–423. doi:10.1111/j.1471-0374.2011.00355.x.
- Finn, Kelly R, Matthew J Silk, Mason A Porter, and Noa Pinter-Wollman. 2019. “The use of Multilayer Network Analysis in Animal Behaviour.” Animal Behaviour 149: 7–22. doi:10.1016/j.anbehav.2018.12.016
- Gülmez, Seçil, Gül Denktaş Şakar, and Sedat Baştuğ. 2021. “An Overview of Maritime Logistics: Trends and Research Agenda.” Maritime Policy & Management, 1–20. doi:10.1080/03088839.2021.1962557.
- Jeon, Jun-Woo, Okan Duru, and Gi-Tae Yeo. 2019. “Cruise Port Centrality and Spatial Patterns of Cruise Shipping in the Asian Market.” Maritime Policy & Management 46 (3): 257–276. doi:10.1080/03088839.2019.1570370
- Jiang, Jianlin, Loo Hay Lee, Ek Peng Chew, and Chee Chun Gan. 2015. “Port Connectivity Study: An Analysis Framework from a Global Container Liner Shipping Network Perspective.” Transportation Research Part E: Logistics and Transportation Review 73: 47–64. doi:10.1016/j.tre.2014.10.012
- Kaluza, P., A. Kölzsch, M. T. Gastner, and B. Blasius. 2010. “The Complex Network of Global Cargo Ship Movements.” Journal of the Royal Society Interface 7 (48): 1093–1103. doi:10.1098/rsif.2009.0495
- Kanrak, Maneerat, and Hong-Oanh Nguyen. 2021. “Structure, Characteristics and Connectivity Analysis of the Asian-Australasian Cruise Shipping Network.” Maritime Policy & Management, 1–15. doi:10.1080/03088839.2021.1914876.
- Kawasaki, Tomoya, Shinya Hanaoka, Jiang Yiting, and Takuma Matsuda. 2019. “Evaluation of Port Position for Intra-Asia Maritime Network.” Asian Transport Studies 5 (4): 570–583. doi:10.11175/eastsats.5.570.
- Kivelä, Mikko, Alex Arenas, Marc Barthelemy, James P Gleeson, Yamir Moreno, and Mason A Porter. 2014. “Multilayer Networks.” Journal of Complex Networks 2 (3): 203–271. doi:10.1093/comnet/cnu016
- Kroodsma, David A, Juan Mayorga, Timothy Hochberg, Nathan A Miller, Kristina Boerder, Francesco Ferretti, Alex Wilson, Bjorn Bergman, Timothy D White, and Barbara A Block. 2018. “Tracking the Global Footprint of Fisheries.” Science 359 (6378): 904–908. doi:10.1126/science.aao5646
- Laxe, Fernando González, Maria Jesus Freire Seoane, and Carlos Pais Montes. 2012. “Maritime Degree, Centrality and Vulnerability: Port Hierarchies and Emerging Areas in Containerized Transport (2008–2010).” Journal of Transport Geography 24: 33–44. doi:10.1016/j.jtrangeo.2012.06.005
- Li, Wenjie, Ralph Pundt, and Elise Miller-Hooks. 2021. “An Updatable and Comprehensive Global Cargo Maritime Network and Strategic Seaborne Cargo Routing Model for Global Containerized and Bulk Vessel Flow Estimation.” Maritime Transport Research 2: 100038. doi:10.1016/j.martra.2021.100038
- Liu, Chengliang, Jiaqi Wang, and Hong Zhang. 2018. “Spatial Heterogeneity of Ports in the Global Maritime Network Detected by Weighted ego Network Analysis.” Maritime Policy & Management 45 (1): 89–104. doi:10.1080/03088839.2017.1345019
- McGee, Fintan, Mohammad Ghoniem, Guy Melançon, Benoît Otjacques, and Bruno Pinaud. 2019. “The State of the Art in Multilayer Network Visualization.” Paper presented at the Computer Graphics Forum.
- Montes, Carlos Pais, Maria Jesus Freire Seoane, and Fernando González Laxe. 2012. “General Cargo and Containership Emergent Routes: A Complex Networks Description.” Transport Policy 24: 126–140. doi:10.1016/j.tranpol.2012.06.022
- Mou, Naixia, Caixia Liu, Lingxian Zhang, Xin Fu, Yichun Xie, Yong Li, and Peng Peng. 2018. “Spatial Pattern and Regional Relevance Analysis of the Maritime Silk Road Shipping Network.” Sustainability 10 (4), doi:10.3390/su10040977.
- Nicosia, Vincenzo, and Vito Latora. 2015. “Measuring and Modeling Correlations in Multiplex Networks.” Physical Review E 92 (3): 032805. doi:10.1103/PhysRevE.92.032805
- Pan, Jing-Jing, Michael GH Bell, Kam-Fung Cheung, Supun Perera, and Hang Yu. 2019. “Connectivity Analysis of the Global Shipping Network by Eigenvalue Decomposition.” Maritime Policy & Management 46 (8): 957–966. doi:10.1080/03088839.2019.1647587
- Peng, Peng, Shifen Cheng, Jinhai Chen, Mengdi Liao, Lin Wu, Xiliang Liu, and Feng Lu. 2018a. “A Fine-Grained Perspective on the Robustness of Global Cargo Ship Transportation Networks.” Journal of Geographical Sciences 28 (7): 881–899. doi:10.1007/s11442-018-1511-z.
- Peng, Peng, Feng Lu, Shifen Cheng, and Yu Yang. 2021. “Mapping the Global Liquefied Natural gas Trade Network: A Perspective of Maritime Transportation.” Journal of Cleaner Production, 124640. doi:10.1016/j.jclepro.2020.124640
- Peng, Peng, Jessie PH Poon, Yu Yang, Feng Lu, and Shifen Cheng. 2019a. “Global oil Traffic Network and Diffusion of Influence among Ports Using Real Time Data.” Energy 172: 333–342. doi:10.1016/j.energy.2019.01.118
- Peng, Peng, Yu Yang, Shifen Cheng, Feng Lu, and Zimu Yuan. 2019b. “Hub-and-spoke Structure: Characterizing the Global Crude oil Transport Network with Mass Vessel Trajectories.” Energy 168: 966–974. doi:10.1016/j.energy.2018.11.049
- Peng, Peng, Yu Yang, Feng Lu, Shifen Cheng, Naixia Mou, and Ren Yang. 2018b. “Modelling the Competitiveness of the Ports Along the Maritime Silk Road with big Data.” Transportation Research Part A: Policy and Practice 118: 852–867. doi:10.1016/j.tra.2018.10.041
- Sun, Zhuo, Ran Zhang, Yuan Gao, Zhongxing Tian, and Yi Zuo. 2020. “Hub Ports in Economic Shocks of the Melting Arctic.” Maritime Policy & Management, 1–24. doi:10.1080/03088839.2020.1752948.
- Wan, Chengpeng, Di Zhang Yinxiang Zhao, and Tsz Leung Yip. 2021. “Identifying Important Ports in Maritime Container Shipping Networks Along the Maritime Silk Road.” Ocean & Coastal Management 211: 105738. doi:10.1016/j.ocecoaman.2021.105738
- Wang, Yuhong, and Kevin Cullinane. 2016. “Determinants of Port Centrality in Maritime Container Transportation.” Transportation Research Part E: Logistics and Transportation Review 95: 326–340. doi:10.1016/j.tre.2016.04.002
- Wang, Gang-Jin, Li Wan, Yusen Feng, Chi Xie, Gazi Salah Uddin, and You Zhu. 2023. “Interconnected Multilayer Networks: Quantifying Connectedness among Global Stock and Foreign Exchange Markets.” International Review of Financial Analysis, 102518. doi:10.1016/j.irfa.2023.102518
- Woolley-Meza, O., C. Thiemann, D. Grady, J. J. Lee, H. Seebens, B. Blasius, and D. Brockmann. 2011. “Complexity in Human Transportation Networks: A Comparative Analysis of Worldwide air Transportation and Global Cargo-Ship Movements.” The European Physical Journal B 84 (4): 589–600. doi:10.1140/epjb/e2011-20208-9.
- Wu, Di, Nuo Wang, Anqi Yu, and Nuan Wu. 2019. “Vulnerability Analysis of Global Container Shipping Liner Network Based on Main Channel Disruption.” Maritime Policy & Management 46 (4): 394–409. doi:10.1080/03088839.2019.1571643
- Wu, Lin, Yongjun Xu, Qi Wang, Fei Wang, and Zhiwei Xu. 2017. “Mapping Global Shipping Density from AIS Data.” The Journal of Navigation 70 (1): 67–81. doi:10.1017/S0373463316000345
- Xu, Mengqiao, Qian Pan, Alessandro Muscoloni, Haoxiang Xia, and Carlo Vittorio Cannistraci. 2020. “Modular Gateway-Ness Connectivity and Structural Core Organization in Maritime Network Science.” Nature Communications 11 (1): 1–15. doi:10.1038/s41467-019-13993-7
- Yan, Zhaojin, Rong He, and Hui Yang. 2022. “The Small World of Global Marine Crude oil Trade Based on Crude oil Tanker Flows.” Regional Studies in Marine Science 51: 102215. doi:10.1016/j.rsma.2022.102215
- Yan, Zhaojin, Yijia Xiao, Liang Cheng, Song Chen, Xiao Zhou, Xiaoguang Ruan, Manchun Li, Rong He, and Bin Ran. 2020. “Analysis of Global Marine oil Trade Based on Automatic Identification System (AIS) Data.” Journal of Transport Geography 83: 102637. doi:10.1016/j.jtrangeo.2020.102637
- Yu, Hongchu, Zhixiang Fang, Feng Lu, Alan T Murray, Zhiyuan Zhao, Yang Xu, and Xiping Yang. 2019. “Massive Automatic Identification System Sensor Trajectory Data-Based Multi-Layer Linkage Network Dynamics of Maritime Transport Along 21st-Century Maritime Silk Road.” Sensors 19 (19): 4197. doi:10.3390/s19194197
- Zhang, Liye, Qiang Meng, and Tien Fang Fwa. 2019. “Big AIS Data Based Spatial-Temporal Analyses of Ship Traffic in Singapore Port Waters.” Transportation Research Part E: Logistics and Transportation Review 129: 287–304. doi:10.1016/j.tre.2017.07.011
- Zhou, Yaoming, Tanmoy Kundu, Mark Goh, and Jiuh-Biing Sheu. 2021. “Multimodal Transportation Network Centrality Analysis for Belt and Road Initiative.” Transportation Research Part E: Logistics and Transportation Review 149: 102292. doi:10.1016/j.tre.2021.102292