
 ?Mathematical formulae have been encoded as MathML and are displayed in this HTML version using MathJax in order to improve their display. Uncheck the box to turn MathJax off. This feature requires Javascript. Click on a formula to zoom.
ABSTRACT
The intensity of extreme weather events has been increasing, posing a unique threat to society and highlighting the importance of our electrical power system, a key component in our infrastructure. In severe weather events, quickly identifying power outage impact zones and affected communities is crucial for informed disaster response. However, a lack of household-level power outage data impedes timely and precise assessments. To address these challenges, we introduced an analytical workflow using NASA’s Black Marble daily nighttime light (NTL) images to detect power outages from the 2021 Winter Storm Uri. This workflow includes adjustments to mitigate viewing angle and snow reflection effects. Power outage is detected by comparing storm-time and baseline (normal condition) NTL images using an empirical adjusted equation. The outcomes of the workflow are 500-meter resolution power outage maps, which have the optimal correlation with real outage tracking data when NTL intensity is reduced by 26%. With the resultant power outage maps, we analyzed the relations between power outages and disadvantaged populations in 126 Texas counties and 4182 census tracts to evaluate environmental justice in the storm. The results show that Latino/Hispanic communities tend to suffer more from power outages at both the county and census tract levels.
1. Introduction
With the changing climate, an increasing number and intensity of extreme weather events, such as hurricanes, winter storms, thunderstorms, and tornadoes, pose an unprecedented threat to human society. The serviceability of critical infrastructures (CIs) during extreme weather events is of critical importance to socio-economic activities (Deshmukh, Ho Oh, and Hastak Citation2011). Published evidence shows that disinvestment and poor maintenance of CIs often lead to greater losses in human communities (Chang Citation2003; Mastroianni et al. Citation2021). Additionally, disruptions of CIs in extreme weather events may add extra burdens to disadvantaged communities (Hendricks and Van Zandt Citation2021). Thus, the serviceability and resilience of CIs in extreme weather events are often associated with social equality and environmental justice. As lifeline infrastructure systems, electrical power systems are critical for socioeconomic activities but vulnerable to multiple types of hazards. The failures of electric power systems may trigger a series of cascading effects (Kwasinski et al. Citation2019). Long-lasting blackouts affect food and water supplies, disrupting communication and leaving people in discomforting conditions (e.g. heat, cold, and darkness) (Casey et al. Citation2020; Klinger, Landeg, and Murray Citation2014). When combined with freezing temperatures, blackouts can cause damage to building structures and pose threats to people’s lives and health (Dominianni et al. Citation2018). Underserved and marginalized population groups often suffer greater impacts due to the lack of adaptive capacities (Min, O’Keeffe, and Zhang Citation2017). Thus, timely and fine-resolution assessments of power outages in extreme weather events are of critical importance for emergency response, disaster relief, and policymaking to mitigate inequalities and injustice in disasters.
However, monitoring power outages in extreme weather events faces challenges. First, household-level power outage data are not publicly available due to privacy concerns (Boroojeni, Amini, and Iyengar Citation2017). According to reports from the U.S. Energy Information Administration (EIA) (Alexander and Sara Citation2017; Tweed Citation2016), only a small proportion of the population agrees to share data about electricity consumption and outage with a third party, let alone the public. To protect individuals’ privacy, power outage data are usually aggregated at coarse spatial units (e.g. cities and counties), which are not sufficient to guide emergency response and resilience assessment at the neighborhood level. Second, multiple electric providers serving the same area create challenges to acquire complete outage data. For example, Texas is served by more than 100 electric utility companies, some of which have overlapped serving areas (Public Utility Commission of Texas Citation2022). Due to different tracking standards and methods, different utility companies may provide inconsistent power outage data. Additionally, the total number of blackouts in a disaster, which synthesizes household surveys and outage tracking devices, can take a long time to conclude (Cole et al. Citation2017), impeding timely actions for disaster response and relief. The data collected from surveys and power tracking devices only cover a small population sample and may overlook certain disadvantaged population groups. To overcome these issues, alternative data sources have been explored to detect power outages. For instance, Volunteered Geographic Information (VGI) (e.g. social media) can provide a considerable amount of data on the population impacted by power outages (Goodchild Citation2007; Guan and Chen Citation2014; Li, Ma, and Cao Citation2020; Mao et al. Citation2018). A few studies have detected spatial and temporal distributions of power outages by mining social media data (Mao et al. Citation2018; Sun et al. Citation2016), despite the concerns of biased user demography and data uncertainty (Ribeiro et al. Citation2018; Ribeiro, Benevenuto, and Zagheni Citation2020). Thus, there is a pressing need to leverage alternative data sources to develop timely and reliable power outage assessments to support disaster response and resilience enhancement.
With the ability to detect artificial lights on the earth's surface, nighttime light (NTL) remote sensing radiometers are a promising instrument to assess disaster impacts on human communities and CIs. In previous studies, NTL images are primarily used to assess disaster impact and damage (Xu and Qiang Citation2021; Zhao et al. Citation2018) and monitor the recovery of human activities (Qiang, Huang, and Xu Citation2020). Pioneer work has been conducted to detect power outages from time series of NTL images. For example, Wang et al. (Citation2018) introduced the use of NTL radiance from NASA’s Black Marble images to detect the spatial extent of outages during Hurricane Sandy in 2012 and Hurricane Maria in 2017. A few studies (e.g. Román et al. (Citation2019) and Azad and Ghandehari (Citation2021)) used the Black Marble images to monitor electricity restoration during Hurricane Maria and discovered social and geographic disparities in electric restoration among Puerto Rican communities. A major issue in the previous studies is the lack of empirical validation, which raises doubts about the accuracy of power outage detection. Additionally, the previous studies simply used original NTL radiance in the remote sensing images to detect power outages, without addressing biases introduced by extraneous factors, such as the viewing angle and snow reflection (Wang et al. Citation2021). These uncertainties can be amplified by the changing atmospheric and ground conditions in extreme weather events, which can further affect the validity of outage detection results.
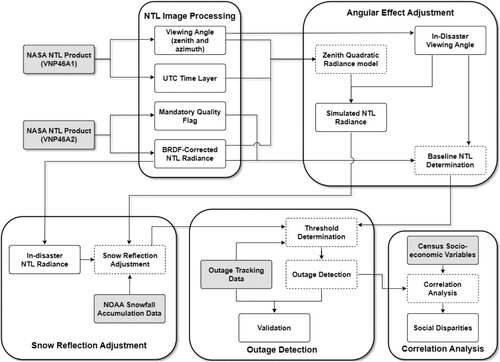
In this study, we introduced an analytical workflow that applies NASA’s Black Marble NTL daily images to detect power outages in 2021 Winter Storm Uri (). This workflow includes radiance adjustments to reduce the effects of viewing angle and snow reflection on the NTL radiance. Additionally, novel approaches were introduced to determine the baseline radiance (radiance captured in the normal condition) and the radiance reduction threshold for power outage detection. The workflow generated power outage maps at a 15-arc-second resolution (approximately 500 meters) covering the entire declared disaster areas, enabling various analyzes from the neighborhood scale to the county or city scale. Finally, we overlaid the power outage maps with socio-economic variables to evaluate environmental justice in the storm. Our hypothesis is that disadvantaged populations are disproportionally exposed to power outages and correlation analysis was used to assess the hypothesis. The developed workflow can be used as an actionable tool to produce timely and scaled power outage detection from publicly available data. Meanwhile, the analysis will provide valuable information for developing sustainable, resilient, and equitable communities in the face of increasing extreme weather events in the changing climate.
Figure 1. Workflow of outage detection using NASA’s Black Marble product suites.
2. Datasets
2.1. Study area
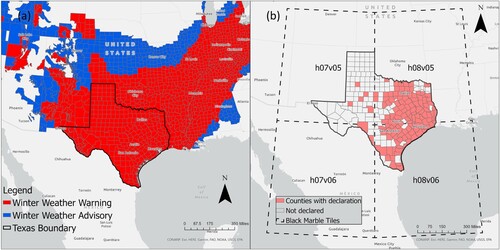
Winter Storm Uri, also named Valentine’s week winter outbreak 2021 by National Oceanic and Atmospheric Administration (NOAA), emerged on Feb 11th, and dissipated on Feb 20th. Due to this storm, a winter storm warning has been issued for the entire state of Texas and multiple states in the U.S. Midwest and Southern Plains ((a)). As one of the most affected states, Texas was hit by massive snow, sleet, freezing rain, and low temperature. The storm resulted in a death toll of 246 people and an economic loss of over 195 billion dollars in Texas, which makes Uri the costliest winter storm on record (Ivanova Citation2021). As a critical infrastructure, the electric power system in Texas was seriously disrupted and caused extensive blackouts lasting for several days (Lee, Maron, and Mostafavi Citation2021). The Texas Interconnection network, the largest electric grid in Texas, generated rolling blackouts across the whole state of Texas, which affected 4 million people (Rice and Aspegren Citation2021). Due to Uri’s devastating impacts, President Joseph R. Biden approved three major disaster declaration orders for a total of 126 Texas counties (Federal Agency Management Agency Citation2021a; Citation2021c; Citation2021b). Our study focused on the counties that had declared Uri as a major disaster. However, including all pixels within these selected counties in the radiance adjustment model (intended to mitigate the angular effect and snow reflection of NTL) can introduce biases in two significant ways. Primarily, given the extensive undeveloped lands in Texas where NTL emissions might not originate from human activities, including these areas could distort the adjusted result, favoring the multitude of non-urban pixels with minimal NTL radiance. This, in effect, may blur the impact on NTL from outages. Secondly, surface oil wells located outside urban zones can yield high NTL radiance (occasionally surpassing the brightest pixel in the city center), even though these areas do not represent populations affected by power outages. Such conspicuous brightness in rural areas shall not be included in the study area. Thus, our study focuses on urban areas where the impervious surface area (ISA) ratio surpasses 0.5 and avoided areas near oil wells. The ISA ratio signifies the proportion of impervious surface pixel (∼30 m) count to the total land-use pixel (∼30 m) count within each pixel (∼500 m) in the NTL image, which is calculated based on the imperviousness product in the National Land Cover Database 2019 (https://www.mrlc.gov/data/nlcd-imperviousness-conus-all-years).
Figure 2. (a) National Weather Services (NWS) winter weather forecast near Texas, (b) counties that declared Winter Storm Uri as a major disaster.
2.2. Data
2.2.1. Nighttime light images
NASA’s Black Marble daily images (VNP46) were utilized to detect power outages. Black Marble images were collected from the Visible Infrared Imaging Radiometer Suite (VIIRS) day/night band (DNB) sensor of the Suomi National Polar-Orbiting Partnership (SNPP) satellite. The Black Marble product suite includes two products: VNP46A1 and VNP46A2. VNP46A1 offers a consistent temporal scale at the daily level with a spatial resolution at 15-arc-second (around 500 meters in the study area) and overcomes the saturation effect and onboard calibration issue in the preceding NTL product. The VNP46A2 product includes 6 layers that were processed from the VNP46A1 product by removing biases from irrelevant NTL sources (e.g. moonlight, atmospheric effect) using the bidirectional reflectance distribution function (BRDF) model inversion (Román et al. Citation2018; Román et al. Citation2019). In this study, the NTL radiance (DNB_BRDF-Corrected_NTL layer) in the VNP46A2 product was used to detect blackouts in Texas during the winter storm. Meanwhile, the viewing zenith and azimuth angles in VNP46A1 were used to adjust the angular effect. Images from Jan 1, 2020, to Mar 2, 2021, were downloaded from the Level-1 and Atmosphere Archive & Distribution System (LAADS) Distributed Active Archive Center (DAAC) Portal (https://ladsweb.modaps.eosdis.nasa.gov/search/). (b) shows the four tiles (dashed line) of Black Marble images used in this study, which were mosaicked to cover the whole study area. The parameters of layers extracted from Black Marble products are summarized in .
Table 1. Descriptions of layers extracted from NASA’s Black Marble product.
2.2.2. Auxiliary data
In addition to the NTL images, four types of auxiliary datasets were used in this study. First, hourly power outage data at the county level from Feb 10, 2021 to Feb 25, 2021 were acquired from BlueFire Studios LLC (http://poweroutage.us) to calculate the power outage detection model. This dataset summarized power outage tracking data from 61 electricity providers during Uri in Texas. Second, the most recent land use and land cover (LULC) data from the National Land Cover Database 2019 were used to calculate the ISA ratios in NTL image pixels (Dewitz Citation2021; Homer et al. Citation2020; Jin et al. Citation2019; Wickham et al. Citation2021; Yang et al. Citation2018). Pixels with a ratio of ISA > 0.5 and not near surface oil wells were considered urban areas and selected as the study area. Locations of surface oil wells were retrieved from the Railroad Commission of Texas (https://www.rrc.texas.gov/resource-center/research/data-sets-available-for-download/). Third, socio-economic variables at the census-tract and county level were acquired from the 2019 American Community Survey (). These socio-economic variables are common indicators in community resilience assessment (Cutter, Boruff, and Shirley Citation2003; Lam et al. Citation2016) and are available in the American Community Survey data. These variables were used to analyze the relations between the detected power outages and socio-economic conditions of communities. Fourth, snow accumulation data were collected from NOAA National Gridded Snowfall Analysis (https://www.nohrsc.noaa.gov/snowfall/). Due to the heavy cloud cover during and after the winter storm, snow accumulation data from NOAA is the only data source that covers the whole research area and has a fine temporal granularity (updated every 12 h).
Table 2. The list of tables and socio-economic variables extracted from the 2019 American Community Survey.
2.2.3. NTL date selection
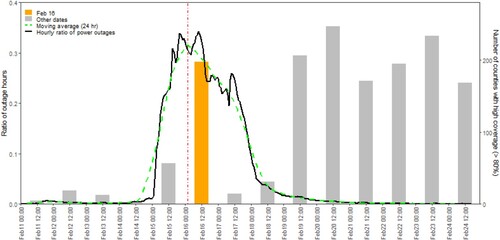
Next, we determined the dates of NTL images for power outage detection. This selection was made with two criteria: (1) the images should be captured when extensive power outages occurred, and (2) the study area should have a cloudless sky (less cloud coverage). For the first criterion, the hourly ratio of power outages was calculated from the power outage tracking data from Bluefire Studios LLC. The ratio is the quotient of total outage hours and total tracked hours. The hourly outage ratio and its 24-hour moving average are displayed in , which shows that the extensive power outage lasted from Feb 15 to Feb 18 with a peak on Feb 16. For the second criterion, we calculated the number of counties that have > 80% high-quality NTL pixels (cloudless sky) each day, which is represented as gray bars in . Pixels in the VNP46A2 images where the value of the Mandatory Quality Flag (QF) is 00 are defined as high-quality pixels and selected for the analyzes in this study. QF 01 pixels include ephemeral radiance, such as wildfire and lightning, which cannot represent a persistent human settlement. Meanwhile, QF 01 pixels are very few in the selected images (e.g. no QF 01 pixels on Feb 16). Thus, we decided to exclude QF 01 pixels in the analyzes. shows that the highest number of counties with a cloudless sky during the power outage period occurred on Feb 16, when 197 of the 254 counties have >80% coverage of high-quality pixels (QF 00). Thus, NTL images on Feb 16 meet both criteria and are selected to detect power outages in the following analysis.
Figure 3. Hourly ratio of power outage from Feb 11 to Feb 24 (lines, left axis) and the number of counties where > 80% area is covered by high-quality NTL pixels (bars, right axis). The red dashed line indicates the general NTL acquisition time (close to 2:45 AM Central Standard Time) of NTL images on Feb 16, 2021.
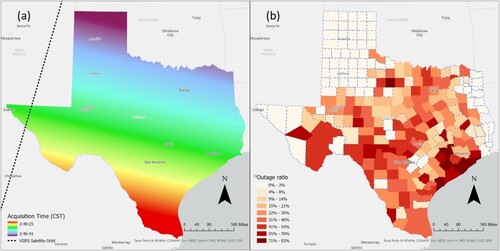
The NTL images on Feb 16 were captured between 2:45 AM to 2:50 AM in Central Standard Time (CST) as shown in (a). Thus, power outage tracking data between 2:00 AM and 3:00 AM on Feb 16 (highlighted in , red dashed lines) were selected to adjust the NTL radiance in the following steps. (b) shows the county-level outage ratios between 2–3 AM CST on Feb 16.
Figure 4. (a) Acquisition time in Central Standard Time (CST) and VIIRS satellite orbit from VNP46A2 on Feb 16, 2021, (b) power outage ratios (tracking data) between 2–3 AM in Texas counties, areas that did not experience extensive power outages are highlighted in blue dashed boundaries.
3. NTL radiance adjustment
Power outages can be detected by comparing the NTL radiance during outages and the radiance in the normal condition (baseline). However, the various viewing angles and snow reflection may affect the NTL radiance captured in the images and introduce biases to the comparison (Wang et al. Citation2021). Thus, a radiance adjustment is needed to eliminate the biases and make the images comparable. This section introduces the adjustment process that removes the angular effect and snow reflection in the NTL images.
3.1. Angular effect
The viewing angle of the satellite sensor may affect the NTL radiance captured in images. Previous studies show that the relation between the viewing zenith angle and NTL radiance can be fitted into a quadratic equation (Li et al. Citation2019; Tan et al. Citation2022). This equation is known as the Zenith-Radiance Quadratic (ZRQ) model and can be expressed as EquationEq. (1(1)
(1) ):
(1)
(1) where
stands for the nighttime light radiance,
means the viewing zenith angle, and a, b, and c are the coefficients.
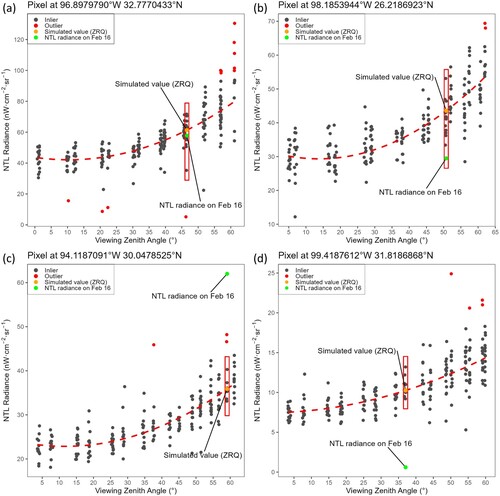
The actual effects of the zenith angle may vary in the geographic space due to different land cover types and radiance levels. shows the variation of zenith-radiance relations at four randomly selected pixels in the study area, where shapes of the quadratic fitting curve between NTL radiance and viewing zenith angle are different, meaning that the coefficients a, b, and c in EquationEq. (1(1)
(1) ) vary at different pixels. Thus, instead of using a global model to adjust the entire study area, we fit the ZRQ model locally at each pixel using NTL values from Jan 1, 2020, to Jan 31, 2021. To minimize the impact of the azimuth viewing angle, we selected data points on dates that have the same viewing direction (east or west) on Feb 16 to fit in the ZRQ model. According to the Interquartile Rule (Upton and Cook Citation1996), NTL values that fall outside the +/− 1.5 interquartile range from the median value were considered outliers and excluded in the model fitting (red dots in ). R programs are developed to automate this local fitting process. Using the locally-fitted ZRQ models, the expected NTL radiance in the viewing zenith angle on Feb 16 was simulated (orange dots in ).
Figure 5. Scatterplots of radiance by zenith angle from Jan 1, 2020, to Mar 2, 2021, in random four pixels in the study area. The red box indicates the radiance values on dates that have a similar viewing zenith angle as Feb 16, 2021.
(a) shows the ratio of differences between the and
at the pixel level (denoted as
), which is calculated using EquationEq. (2
(2)
(2) ):
(2)
(2) where
is the actual radiance on Feb 16, and
is the simulated NTL radiance on Feb 16, 2021, using the ZRQ model (EquationEq. (1
(1)
(1) )).
Figure 6. Comparison between NTL radiance change and snow accumulation: (a) spatial distribution of NTL radiance change (), (b) snowfall accumulation from NOAA National Gridded Snowfall Analysis (72-hour snowfall accumulation) at 12:00 AM, Feb 16, 2021.
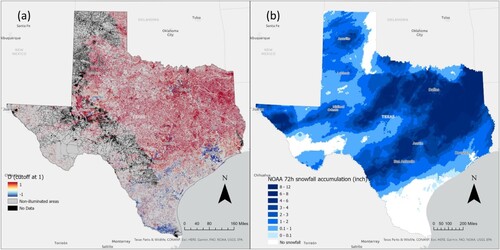
The red pixels in (a) have a larger radiance value than the simulated (expected) value () on Feb 16. Most of the red pixels are located at higher latitudes (north). These larger-than-expected radiance values contradict our expectation that power outages and reduced human activities would dim NTL radiance in the storm. This phenomenon is possibly due to the snow-covered land surface that can enhance NTL radiance (Levin and Zhang Citation2017; Wang et al. Citation2021). Thus, we conducted the following analysis to evaluate the effect of snow reflection on the NTL radiance.
3.2. Snow reflection
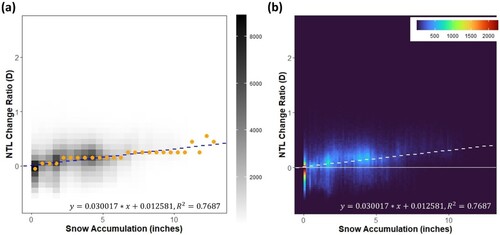
We developed an additional adjustment process to reduce the snow effect on NTL radiance. After evaluating multiple sources for snow data, including MODIS Snow Cover (MOD10), VIIRS/NPP Snow Cover (VNP10), and ground images from Sentinel-2 and Landsat-8, we found these products are heavily impacted by cloud coverage in the study area (Texas) during the storm. Previous studies show that snow accumulation is highly correlated with snow cover (Jonas, Marty, and Magnusson Citation2009). Thus, we chose to use the snow accumulation data from NOAA (https://www.nohrsc.noaa.gov/snowfall/), which provides complete coverage in the study area, to represent snow coverage. (b) shows the 72-hour snow accumulation measured at 12:00 AM on Feb 16. Compared with (a), we found that areas with increased NTL radiance (positive D) generally have higher snow accumulation. To eliminate the influence of outliers, we applied the bin-fitting method to quantify the relation between snow accumulation and NTL radiance change (Currit Citation2002; Sanchez de Miguel et al. Citation2020). Specifically, we aggregate data points in the scatter plot into bins, each of which represents an interval of 0.5 in. snow accumulation (x-axis) and 0.1 NTL change ratio (y-axis). Then, we selected the bin with the highest point density in each interval in the x-axis (shown as orange dots in (a)) to derive a linear regression model. The positive coefficient of the regression (β = 0.03) indicates that the NTL difference ratio (D) is positively correlated with snowfall accumulation ((b)). This result confirms that snow coverage may enhance NTL radiance and justify the need for the snow effect adjustment.
Figure 7. (a) Bin-fit scatterplot between 72-hour snowfall and NTL difference ratio (D) of pixels in the Feb 16 NTL image, (b) density plots between 72-hour snowfall and NTL difference ratio (D) of pixels in the Feb 16 NTL image. The white horizontal line (D = 0) represents no change in NTL. The blue dashed line in (a) and white dashed line in (b) indicate the actual bin fit to the target (equation and R2 listed at the bottom of each graph).
The radiance adjustment includes the following steps. First, the adjustment models were developed in areas that did not experience extensive power outages (i.e. outage ratio < 10%, see (b)), assuming that the difference between the actual NTL radiance and simulated radiance was primarily caused by snow reflection. The outage ratio is the ratio of detected power outage time to total tracking time in the county, described in Section 2.2.3. The adjustment is expressed in EquationEq. (3(3)
(3) ), which is a linear equation of logarithmically transformed
and
. We acknowledge that the correlation between
and
varies in different snow accumulation categories, and thus calculated the model parameters in seven snow accumulation categories (). In each category, we apply the bin-fitting method to derive a regression model between NTL radiance change (D) and snow accumulation. Details of models in each snow accumulation category can be found in Figure SI 1 to Figure SI 7. Then, we use the derived models to adjust the actual NTL radiance of pixels in different snow accumulation categories (EquationEq. (4
(4)
(4) )).
(3)
(3)
(4)
(4) where
is the base of natural logarithms,
and
were calculated from pixels in each snow accumulation category.
Table 3. Coefficients in NTL radiance adjustment function by snow accumulation category.
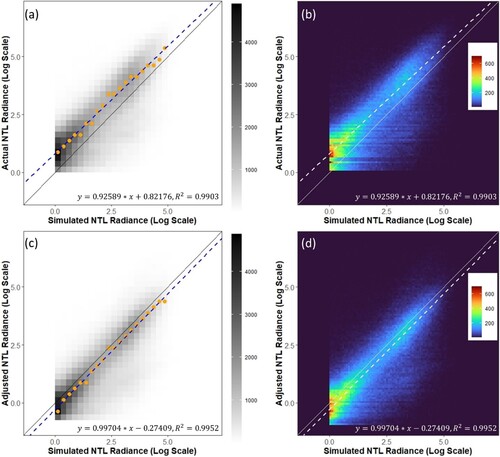
The actual radiance and adjusted radiance values were compared with simulated radiance using the bin fit linear model in (a)&(c). The snow effect adjustment pulls the regression line (blue, where slope changed from 0.92589–0.99704 and intercept changed from 0.82176 to −0.27409) closer to the central line (black, where slope = 1 & intercept = 0), indicating a higher consistency between the adjusted radiance with the simulated radiance. The enhanced NTL values on Feb 16 that are potentially impacted by snow were adjusted and corrected to a normal level (based on the simulated NTL radiance on Feb 16). Comparing (a) with (c) and (b) with (d), we can see that the adjustment has alleviated the radiance biases caused by the snow effect.
Figure 8. (a) Bin-fit scatterplot between the actual NTL radiance and simulated NTL radiance on Feb 16 (bin width = 0.25 unit), (b) density plots between the actual NTL radiance and simulated NTL radiance on Feb 16, (c) bin-fit scatterplot between the actual NTL radiance and simulated NTL radiance on Feb 16 (bin width = 0.25 unit), (d) density plots between the adjusted NTL radiance and simulated NTL radiance on Feb 16. Black lines in (a)&(c) and white lines in (b)&(d) indicate the adjustment target (f(x) = x). The blue dashed lines in (a)&(c) and white dashed lines in (b)&(d) indicate the actual bin fit to the target in all figures (equation and R2 listed at the bottom of each graph).
4. Blackout detection
Power outage is detected by comparing the adjusted NTL radiance on Feb 16 and the radiance in the normal condition (baseline radiance). The baseline radiance is a sample of radiance values on dates from Jan 1, 2020, to Jan 31, 2021, when the viewing angle and acquisition time is similar to that on Feb 16. We assume that blackout occurs in pixels where the radiance on Feb 16 reduces below a certain level (threshold) in comparison with the baseline radiance. The comparison was conducted only in high-quality pixels (Mandatory QF is 00) with similar viewing zenith angles (+/− 0.3°). Various thresholds are used in previous studies to detect power outages (Kar et al. Citation2021; Min, O’Keeffe, and Zhang Citation2017; Shah et al. Citation2020), but some can be arbitrary and lack empirical validation. In this study, we evaluated three different thresholds to detect power outages using Eqs. (Equation5(5)
(5) )–(Equation7
(7)
(7) ), respectively. The detected power outage by the three thresholds was validated against the county-level power outage tracking data. The threshold that generates the best correlation with the county-level power outage data was considered optimal and was used for the analysis in the next step. The parallel computing package (doSnow) in R developed by Microsoft Corporationand Weston (Citation2022) was applied to accelerate the pixel-wise computation.
(5)
(5)
(6)
(6)
(7)
(7) where
is the radiance values from Jan 1, 2020, to Jan 31, 2021 when the viewing angle is similar to that on Feb 16, 2021. These radiance values are considered the baseline that represents radiance values at the normal time. As an example, the red bounding boxes in highlight the baseline radiance values in the four pixels.
are the thresholds below which power outages are determined.
,
and
are functions to calculate standard deviation, mean, and minimum from the baseline radiance values.
Using the three thresholds, pixels in the Feb 16 images are classified into outage pixels (radiance < threshold) and non-outage pixels (radiance threshold). The ratio of power outages is calculated as the division of outage pixels by total pixels in counties and census tracts. Instead of using arbitrary values, the coefficient
and
in
and
are derived from an iterative program. The program uses all possible values of
in
and
in
with an increment of 0.01 to calculate power outage ratios in counties and conducts regression analysis between the power outage ratios detected from NTL and the outage ratios calculated from the outage tracking data. The optimal values of
and
are selected when the coefficient of determination (R2) of the regression analysis is the highest, indicating the highest consistency between the two datasets. shows the changing pattern of R2 with increasing values of
and
in the iterative program. The values of
and
at the peaks of the curves are considered optimal and applied in Eqs. (5) & (6) to calculate
and
, respectively. The higher R2 in the blue line shows that adjusted radiance achieved a higher consistency with the outage tracking data than the original radiance.
Figure 9. Changes of R2 with increasing (left) and
(right) in the iterative program. Blue and red curves are calculated with adjusted and original radiance, respectively.
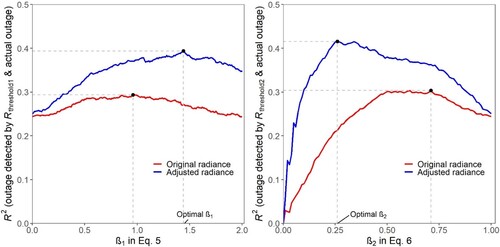
To evaluate the effect of the adjustment in Section 3, changing patterns of R2 calculated from the original NTL images (red lines) and adjusted NTL images (blue lines) are illustrated in , indicating that the adjustment process has improved the ability of the NTL images for power outage detection. Regression analysis was used to validate the power outage ratios calculated from NTL images against the ratios calculated from outage tracking data at the county level. A higher coefficient of determination (R2) implies a better match of power outages detected in the two data sources. Comparing the three thresholds, the power outage ratio calculated using (EquationEq. (6
(6)
(6) )) has the highest correlation (R2 = 0.4157) with the ratios from the outage tracking data, followed by the ratios calculated by
(EquationEq. (5
(5)
(5) )) &
(EquationEq. (7
(7)
(7) )). In other words, our study found that NTL data have the highest correlation with real outage tracking data when NTL intensity was reduced by 26% (
= 0.26). Thus, the power outage pixels and ratios of the outage pixels calculated with
(EquationEq. (6
(6)
(6) )) are used in the following analysis.
Table 4. Highest coefficient of determination (R2) in each NTL threshold and the optimal coefficient (if applicable) that generates the highest R2.
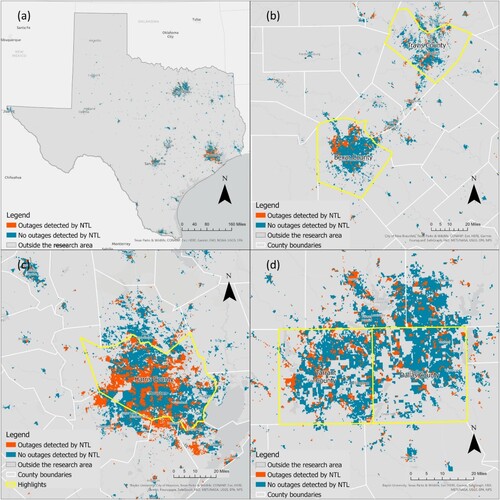
The outage pixels derived from the threshold with the best performance () were visualized in (a). A zoom-in view for three metropolitan areas, Houston, Dallas-Fort Worth, and Austin-San Antonio, was shown in (b)–(d). The outage occurred around suburban areas or the edges of the urban areas in Dallas, Austin, and San Antonio, whereas large areas in the center of Houston suffered from blackouts. At the pixel level ((c)), areas surrounding Houston were heavily impacted by the outage. The western area of Texas did not experience widespread outages.
Figure 10. (a) Outage pixels from NTL images in the declared disaster counties in Texas, (b) zoom-in view of Austin (Travis County) and San Antonio (Bexar County), (c) zoom-in view of Houston (Harris County), (d) zoom-in view of Dallas (Dallas County) and Fort Worth (Tarrant County).
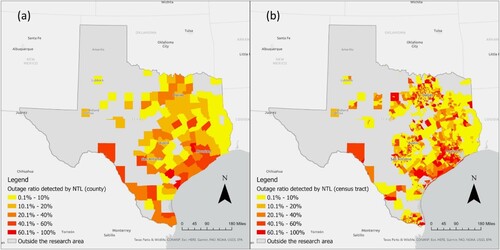
(a)&(b) show outage ratios in counties and each census tract, where coastal counties near the Gulf of Mexico experienced large outage ratios. The patterns of NTL power outage ratios generally agree with the outage ratios calculated in (b). However, within Harris County, the outage tracking data show a low outage ratio ((b)) whereas the outage ratio detected from NTL ((a)) shows the opposite. Considering the large industrial areas in Houston and differences in electricity consumption between residential clients and industrial clients, the power outage tracking data in residential areas can be diluted by the large regularly supplied industrial electricity consumption. Overall, regardless of a few places that show discrepancies between outage tracking data and NTL outage ratio, the spatial patterns of county-level power outage ratios derived from the two datasets are similar, plus the NTL images can provide timely power outage detection at a higher resolution (∼500 m).
Figure 11. (a) Power outage ratios aggregated in counties, (b) power outage ratios aggregated in census tracts.
5. Correlation analysis
Pearson correlation analyzes were then used to analyze the relations between outage ratios detected in NTL images and socio-economic variables listed in at both the county level and the census tract level. lists the p values and Pearson correlation coefficients between the power outage ratio and each socio-economic variable. Socio-economic variables that have significant correlations (p-value < 0.05) with power outage ratios are highlighted in bold font. At the county level, the blackouts tend to occur in Hispanic/Latino communities and communities with newer buildings. At the census tract level, power outages are more likely to happen in Latino/Hispanic communities, communities with fewer white populations, a longer commuting time, lower unemployment ratios, and higher median housing value. The results show that the relations between disadvantaged population groups and power outages vary at the two spatial scales, except that Ratios of the Hispanic/Latino population show strong correlations at both scales.
Table 5. The statistics (p-value and Pearson correlation coefficient) of the correlation models between socio-economic variables and the NTL power outage ratio.
6. Discussion
This study presents an analytical workflow to detect power outages from daily Black Marble NTL images and the application of this approach in 2021 Winter Storm Uri. Compared to other data sources (e.g. the county-level power outage tracking data), the NTL-based approach can detect power outages at a finer spatial resolution (∼500 m), providing important support for emergency response and assessment of infrastructure damage and recovery. Through exploratory data analysis, we discovered the effects of the viewing angle and ground snow reflection on the NTL radiance, which prohibits a direct comparison between the images captured in the storm with the images in normal times (baseline condition). Additionally, the snow and angular effects show strong spatial variation, and thus cannot be corrected using a global model. To this end, we developed radiance adjustment models to reduce the biases introduced by various viewing angles and snow reflection over the study area. The model training at each pixel creates a substantial computational load, which was effectively addressed by parallel algorithms. In the validation against the outage tracking data, the adjusted NTL radiance shows an improved ability in power outage detection than the non-adjusted images.
The power outage detection was conducted by comparing the adjusted NTL radiance on Feb 16 with the radiance in the normal condition (baseline condition). Due to the instability of NTL radiance, choosing images on a specific date as the baseline may introduce uncertainties caused by radiance fluctuations on that day. Instead, we used a sample of dates in 2020 and 2021 when the viewing angle was similar to that on Feb 16 to represent the baseline radiance. Another challenge we faced in this study is choosing an appropriate threshold to detect power outages. The choice of the threshold determines the extent of radiance reduction that should be classified as power outages. Various thresholds are used in previous studies, which are somehow arbitrary and lack empirical validation. To address this issue, we developed an iterative algorithm to search for the optimal threshold that can generate the highest correlation between the outage detected from NTL and the outage tracking data. This approach fuzes the outage tracking data and NTL images to find the threshold to obtain a finer-resolution (∼500 m) power outage detection.
With the developed power outage detection approach, the second objective is to evaluate environmental justice issues in Winter Storm Uri. Our hypothesis is that disadvantaged populations are disproportionally exposed to power outages in the storm. The resultant power outage map at a finer resolution (∼500 m) enables the evaluation of the hypothesis at the census tract level. The statistical analyzes show that the ratio of the Latino/Hispanic population has a significant correlation with power outage ratios at both the county and census-tract level. This result confirms the finding in the previous studies by Lee, Maron, and Mostafavi (Citation2021) and Flores et al. (Citation2023). As Texas is the state with the second largest Hispanic population (Nielsen-Gammon Citation2011), this result signals an alarming trend that the Hispanic population may be disproportionally exposed to vulnerable electric power systems in natural disasters. Despite the statistical significance, the correlations between power outages and other disadvantaged population groups are not extraordinarily strong (relatively low Pearson’s r values). This result is possibly due to the limited data sample in one specific event. To fully understand the environmental justice issues, further research with improved outage detection techniques should be conducted in more and other hazard events to confirm the findings from this study.
The proposed method can be improved in the following aspects. First, the NTL should be further decomposed into several types of human activities. The captured NTL radiance can be generated from road traffic, industrial sites (e.g. oil refineries), and critical facilities that have an emergency power supply (e.g. hospitals). The illumination from these facilities may influence the detection of power outages that hit residential households. A future improvement is to classify the NTL radiance into different land use and land cover types, from which the power outage occurred in residential areas can be differentiated. The differentiated power outage detection will provide more reliable data to study environmental justice issues in the storm. Second, the NTL radiance captured in the Black Marble images is highly dependent on weather conditions. The introduced approach requires a cloudless sky to detect changes in NTL radiance, which may not occur in some disaster events. In this study, Feb 16 is the only date during the storm when there are sufficient high-quality pixels (cloudless sky) to observe NTL in the study area. On other dates, most urban areas are fully or partially covered by clouds, preventing the observation of NTL on the ground. Additionally, the NTL variation is affected by complex factors other than snow cover, which lead to only a moderate fit between outage tracking data and outages detected by NTL. Such factors can include but are not limited to the ground condition (e.g. snow cover, flood inundation) and atmospheric conditions (e.g. moisture). In future research, we would further improve the method to reduce biases and uncertainties introduced by these factors.
7. Conclusion
This study utilizes NASA’s daily Black Marble images to detect power outages in Winter Storm Uri that hit Texas in 2021. The study introduces a complete workflow from image selection, processing, and radiance adjustment to power outage detection. The analysis uncovers the effects of viewing angle and snow cover on NTL radiance and introduces adjustment methods to mitigate the effects. The validation against an additional data source (the outage tracking data) indicates an improved NTL quality after the adjustment. The derived power outage maps at a finer resolution (∼500 m) provide important support for emergency response, disaster relief, and recovery. Using publicly available data sources, the developed methodology is widely applicable to other hazardous events in other regions, which provide important support for enhancing community and infrastructure resilience. Furthermore, we analyzed the relations between the ratios of detected power outages and ratios of over 10 disadvantaged population groups, aiming to discover environmental injustice and social disparities in this disaster. The results show that the Hispanic/Latino population tends to reside in communities that are impacted by power outages, which echoes findings in peer studies about this storm. This finding raises concerns about potential environmental justice issues in natural disasters, warranting further investigation with improved data and techniques.
Disclosure statement
No potential conflict of interest was reported by the author(s).
Data availability statement
The data is freely available upon contacting the corresponding author.
Additional information
Funding
References
- Alexander, Mey, and Hoff Sara. 2017. “Nearly Half of All U.S. Electricity Customers Have Smart Meters.” December 6, 2017. https://www.eia.gov/todayinenergy/detail.php?id=34012.
- Azad, Shams, and Masoud Ghandehari. 2021. “A Study on the Association of Socioeconomic and Physical Cofactors Contributing to Power Restoration After Hurricane Maria.” IEEE Access 9: 98654–98664. https://doi.org/10.1109/ACCESS.2021.3093547
- Boroojeni, Kianoosh G., M. Hadi Amini, and Sundararaja S. Iyengar. 2017. Smart Grids: Security and Privacy Issues. Cham, Switzerland: Springer International Publishing. https://doi.org/10.1007/978-3-319-45050-6
- Casey, Joan A., Mihoka Fukurai, Diana Hernández, Satchit Balsari, and Mathew V. Kiang. 2020. “Power Outages and Community Health: A Narrative Review.” Current Environmental Health Reports 7 (4): 371–383. https://doi.org/10.1007/s40572-020-00295-0
- Chang, Stephanie E. 2003. “Evaluating Disaster Mitigations: Methodology for Urban Infrastructure Systems.” Natural Hazards Review 4 (4): 186–196. https://doi.org/10.1061/(ASCE)1527-6988(2003)4:4(186)
- Cole, Tony A., David W. Wanik, Andrew L. Molthan, Miguel O. Román, and Robert E. Griffin. 2017. “Synergistic Use of Nighttime Satellite Data, Electric Utility Infrastructure, and Ambient Population to Improve Power Outage Detections in Urban Areas.” Remote Sensing 9 (3): 286. https://doi.org/10.3390/rs9030286.
- Currit, N. 2002. “Inductive Regression: Overcoming OLS Limitations with the General Regression Neural Network.” Computers, Environment and Urban Systems 26 (4): 335–353. https://doi.org/10.1016/S0198-9715(01)00045-X.
- Cutter, Susan L., Bryan J. Boruff, and W. Lynn Shirley. 2003. “Social Vulnerability to Environmental Hazards.” Social Science Quarterly 84 (2): 242–261. https://doi.org/10.1111/1540-6237.8402002.
- Deshmukh, Abhijeet, Eun Ho Oh, and Makarand Hastak. 2011. “Impact of Flood Damaged Critical Infrastructure on Communities and Industries.” Built Environment Project and Asset Management 1 (2): 156–175. https://doi.org/10.1108/20441241111180415
- Dewitz, J, and U.S. Geological Survey. 2021. “National Land Cover Database (NLCD) 2019 Products (Ver. 2.0, June 2021) - ScienceBase-Catalog.” 2021. https://www.sciencebase.gov/catalog/item/5f21cef582cef313ed940043.
- Dominianni, Christine, Munerah Ahmed, Sarah Johnson, Micheline Blum, Kazuhiko Ito, and Kathryn Lane. 2018. “Power Outage Preparedness and Concern among Vulnerable New York City Residents.” Journal of Urban Health 95 (5): 716–726. https://doi.org/10.1007/s11524-018-0296-9
- Federal Agency Management Agency. 2021a. “President Joseph R. Biden, Jr. Approves Major Disaster Declaration for Texas | FEMA.Gov.” 2021. https://www.fema.gov/press-release/20210220/president-joseph-r-biden-jr-approves-major-disaster-declaration-texas.
- Federal Agency Management Agency. 2021b. “Texas Winter Storm Survivors in 18 Additional Counties Can Apply for Federal Disaster Assistance | FEMA.Gov.” 2021. https://www.fema.gov/press-release/20210227/texas-winter-storm-survivors-18-additional-counties-can-apply-federal.
- Federal Agency Management Agency. 2021c. “Texas Winter Storm Survivors in 31 Additional Counties Can Apply for Federal Disaster Assistance.” 2021. https://www.fema.gov/press-release/20210222/texas-winter-storm-survivors-31-additional-counties-can-apply-federal.
- Flores, Nina M., Heather McBrien, Vivian Do, Mathew V. Kiang, Jeffrey Schlegelmilch, and Joan A. Casey. 2023. “The 2021 Texas Power Crisis: Distribution, Duration, and Disparities.” Journal of Exposure Science & Environmental Epidemiology, 21–31. https://doi.org/10.1038/s41370-022-00462-5.
- Goodchild, Michael F. 2007. “Citizens as Sensors: The World of Volunteered Geography.” GeoJournal 69 (4): 211–221. https://doi.org/10.1007/s10708-007-9111-y.
- Guan, Xiangyang, and Cynthia Chen. 2014. “Using Social Media Data to Understand and Assess Disasters.” Natural Hazards 74: 837–850. https://doi.org/10.1007/s11069-014-1217-1
- Hendricks, Marccus D., and Shannon Van Zandt. 2021. “Unequal Protection Revisited: Planning for Environmental Justice, Hazard Vulnerability, and Critical Infrastructure in Communities of Color.” Environmental Justice 14 (2): 87–97. https://doi.org/10.1089/env.2020.0054
- Homer, Collin, Jon Dewitz, Suming Jin, George Xian, Catherine Costello, Patrick Danielson, Leila Gass, et al. 2020. “Conterminous United States Land Cover Change Patterns 2001–2016 from the 2016 National Land Cover Database.” ISPRS Journal of Photogrammetry and Remote Sensing 162 (April): 184–199. https://doi.org/10.1016/j.isprsjprs.2020.02.019.
- Ivanova, Irina. 2021. “Texas Winter Storm Costs Could Top $200 Billion — More Than Hurricanes Harvey and Ike.” February 25, 2021. https://www.cbsnews.com/news/texas-winter-storm-uri-costs/.
- Jin, Suming, Collin Homer, Limin Yang, Patrick Danielson, Jon Dewitz, Congcong Li, Zhe Zhu, George Xian, and Danny Howard. 2019. “Overall Methodology Design for the United States National Land Cover Database 2016 Products.” Remote Sensing 11 (24): 2971. https://doi.org/10.3390/rs11242971.
- Jonas, T., C. Marty, and J. Magnusson. 2009. “Estimating the Snow Water Equivalent from Snow Depth Measurements in the Swiss Alps.” Journal of Hydrology 378 (1): 161–167. https://doi.org/10.1016/j.jhydrol.2009.09.021.
- Kar, Bandana, Jessica Bobeck, Tamar Moss, and David Hughes. 2021. “Spatiotemporal Tracking of Wide Area Power Outage from Night-Time Light Imagery. 2021 IEEE International Geoscience and Remote Sensing Symposium IGARSS. Brussels, Belgium. https://doi.org/10.1109/IGARSS47720.2021.9554293
- Klinger, Chaamala, Owen Landeg, and Virginia Murray. 2014. “Power Outages, Extreme Events and Health: A Systematic Review of the Literature from 2011-2012.” PLoS Currents 6. https://doi.org/10.1371/currents.dis.04eb1dc5e73dd1377e05a10e9edde673
- Kwasinski, Alexis, Fabio Andrade, Marcel J. Castro-Sitiriche, and Efraín O’Neill-Carrillo. 2019. “Hurricane Maria Effects on Puerto Rico Electric Power Infrastructure.” IEEE Power and Energy Technology Systems Journal 6 (1): 85–94. https://doi.org/10.1109/JPETS.2019.2900293.
- Lam, Nina S. N., Margaret Reams, Kenan Li, Chi Li, and Lillian P. Mata. 2016. “Measuring Community Resilience to Coastal Hazards Along the Northern Gulf of Mexico.” Natural Hazards Review 17 (1): 04015013. https://doi.org/10.1061/(ASCE)NH.1527-6996.0000193.
- Lee, Cheng-Chun, Mikel Maron, and Ali Mostafavi. 2021. “Community-Scale Big Data Reveals Disparate Impacts of the Texas Winter Storm of 2021 and Its Managed Power Outage.” Humanities and Social Sciences Communications 9 (1): 1–12. https://doi.org/10.48550/arXiv.2108.06046.
- Levin, Noam, and Qingling Zhang. 2017. “A Global Analysis of Factors Controlling VIIRS Nighttime Light Levels from Densely Populated Areas.” Remote Sensing of Environment 190 (March): 366–382. https://doi.org/10.1016/j.rse.2017.01.006.
- Li, Lingyao, Zihui Ma, and Tao Cao. 2020. “Leveraging Social Media Data to Study the Community Resilience of New York City to 2019 Power Outage.” International Journal of Disaster Risk Reduction 51: 101776. https://doi.org/10.1016/j.ijdrr.2020.101776
- Li, Xi, Ruiqi Ma, Qingling Zhang, Deren Li, Shanshan Liu, Tao He, and Lixian Zhao. 2019. “Anisotropic Characteristic of Artificial Light at Night – Systematic Investigation with VIIRS DNB Multi-Temporal Observations.” Remote Sensing of Environment 233 (November): 111357. https://doi.org/10.1016/j.rse.2019.111357.
- Mao, Huina, Gautam Thakur, Kevin Sparks, Jibonananda Sanyal, and Budhendra Bhaduri. 2018. “Mapping Near-Real-Time Power Outages from Social Media.” International Journal of Digital Earth 12 (11): 1285–1299. https://doi.org/10.1080/17538947.2018.1535000
- Mastroianni, Elyssa, James Lancaster, Benjamin Korkmann, Aaron Opdyke, and Wesam Beitelmal. 2021. “Mitigating Infrastructure Disaster Losses Through Asset Management Practices in the Middle East and North Africa Region.” International Journal of Disaster Risk Reduction 53: 102011. https://doi.org/10.1016/j.ijdrr.2020.102011
- Microsoft Corporation, and Steve Weston. 2022. DoSNOW: Foreach Parallel Adaptor for the Snow Package.” R Package Version 1.0.20. 2022 https://CRAN.R-project.org/package=doSNOW
- Min, Brian K., Zachary O’Keeffe, and Fan Zhang. 2017. “Whose Power Gets Cut? Using High-Frequency Satellite Images to Measure Power Supply Irregularity.” Using High-Frequency Satellite Images to Measure Power Supply Irregularity (June 29, 2017). World Bank Policy Research Working Paper, no. 8131.
- Nielsen-Gammon, John W. 2011. “The Changing Climate of Texas.” The Impact of Global Warming on Texas. University of Texas Press, Austin, TX (1995) 39–68. https://doi.org/10.7560/723306
- Public Utility Commission of Texas. 2022. “Alphabetical Directory of Retail Electric Providers.” 2022. https://www.puc.texas.gov/industry/electric/directories/rep/alpha_rep.aspx.
- Qiang, Yi, Qingxu Huang, and Jinwen Xu. 2020. “Observing Community Resilience from Space: Using Nighttime Lights to Model Economic Disturbance and Recovery Pattern in Natural Disaster.” Sustainable Cities and Society 57: 102115. https://doi.org/10.1016/j.scs.2020.102115
- Ribeiro, Filipe N., Fabrício Benevenuto, and Emilio Zagheni. 2020. “How Biased Is the Population of Facebook Users? Comparing the Demographics of Facebook Users with Census Data to Generate Correction Factors.” 12th ACM Conference on Web Science, Southampton, England, 325–334.
- Ribeiro, Filipe N., Lucas Henrique, Fabricio Benevenuto, Abhijnan Chakraborty, Juhi Kulshrestha, Mahmoudreza Babaei, and Krishna P. Gummadi. 2018. “Media Bias Monitor: Quantifying Biases of Social Media News Outlets at Large-Scale.” Twelfth International AAAI Conference on Web and Social Media.Palo Alto, California USA.
- Rice, Doyle, and Elinor Aspegren. 2021. “At Least 4 Dead, 150M People Under Winter Advisories as ‘Unprecedented’ Storm Stretches Across 25 States; 4.3M Without Power in Texas.” USA TODAY. 2021. https://www.usatoday.com/story/news/nation/2021/02/15/winter-storm-texas-power-outages-south-ice-snow/4487366001/.
- Román, Miguel O., Eleanor C. Stokes, Ranjay Shrestha, Zhuosen Wang, Lori Schultz, Edil A. Sepúlveda Carlo, Qingsong Sun, Jordan Bell, Andrew Molthan, and Virginia Kalb. 2019. “Satellite-Based Assessment of Electricity Restoration Efforts in Puerto Rico After Hurricane Maria.” PloS One 14 (6): e0218883. https://doi.org/10.1371/journal.pone.0218883
- Román, Miguel O., Zhuosen Wang, Ranjay Shrestha, Tian Yao, and Virginia Kalb. 2019. Black Marble User Guide Version 1.0. Washington, DC, USA: NASA.
- Román, Miguel O., Zhuosen Wang, Qingsong Sun, Virginia Kalb, Steven D. Miller, Andrew Molthan, Lori Schultz, et al. 2018. “NASA’s Black Marble Nighttime Lights Product Suite.” Remote Sensing of Environment 210 (June): 113–143. https://doi.org/10.1016/j.rse.2018.03.017.
- Sanchez de Miguel, Alejandro, Christopher CM Kyba, Jaime Zamorano, Jesús Gallego, and Kevin J. Gaston. 2020. “The Nature of the Diffuse Light Near Cities Detected in Nighttime Satellite Imagery.” Scientific Reports 10 (1): 7829. https://doi.org/10.1038/s41598-020-64673-2.
- Shah, Zeal, Feng-Chi Hsu, Christopher D. Elvidge, and Jay Taneja. 2020. “Mapping Disasters & Tracking Recovery in Conflict Zones Using Nighttime Lights.” 2020 IEEE Global Humanitarian Technology Conference (GHTC), 1–8, Santa Clara, CA, USA. http://doi.org/10.1109/GHTC46280.2020.9342937
- Sun, Haifeng, Zhaoyu Wang, Jianhui Wang, Zhen Huang, NichelleLe Carrington, and Jianxin Liao. 2016. “Data-Driven Power Outage Detection by Social Sensors.” IEEE Transactions on Smart Grid 7 (5): 2516–2524. https://doi.org/10.1109/TSG.2016.2546181
- Tan, Xiaoyue, Xiaolin Zhu, Jin Chen, and Ruilin Chen. 2022. “Modeling the Direction and Magnitude of Angular Effects in Nighttime Light Remote Sensing.” Remote Sensing of Environment 269 (February): 112834. https://doi.org/10.1016/j.rse.2021.112834.
- Tweed, Katherine. 2016. “Texas Has Millions of Smart Meters. So Why Haven’t Third-Party Energy Services Blossomed?” October 14, 2016. https://www.greentechmedia.com/articles/read/texas-highlights-the-challenge-of-one-click-energy-services.
- Upton, Graham, and Ian Cook. 1996. Understanding Statistics. Oxford, England: Oxford University Press.
- Wang, Zhuosen, Miguel O. Román, Virginia L. Kalb, Steven D. Miller, Jianglong Zhang, and Ranjay M. Shrestha. 2021. “Quantifying Uncertainties in Nighttime Light Retrievals from Suomi-NPP and NOAA-20 VIIRS Day/Night Band Data.” Remote Sensing of Environment 263 (September): 112557. https://doi.org/10.1016/j.rse.2021.112557.
- Wang, Z., M. O. Román, Q. Sun, A. L. Molthan, L. A. Schultz, and V. L. Kalb. 2018. “Monitoring Disaster-Related Power Outages Using NASA Black Marble Nighttime Light Product.” ISPRS Int. Arch. Photogramm. Remote Sens. Spat. Inf. Sci, 1853–1856. https://doi.org/10.5194/isprs-archives-XLII-3-1853-2018
- Wickham, James, Stephen V. Stehman, Daniel G. Sorenson, Leila Gass, and Jon A. Dewitz. 2021. “Thematic Accuracy Assessment of the NLCD 2016 Land Cover for the Conterminous United States.” Remote Sensing of Environment 257 (May): 112357. https://doi.org/10.1016/j.rse.2021.112357.
- Xu, Jinwen, and Yi Qiang. 2021. “Spatial Assessment of Community Resilience from 2012 Hurricane Sandy Using Nighttime Light.” Remote Sensing 13 (20): 4128. https://doi.org/10.3390/rs13204128
- Yang, Limin, Suming Jin, Patrick Danielson, Collin Homer, Leila Gass, Stacie M. Bender, Adam Case, Catherine Costello, Jon Dewitz, and Joyce Fry. 2018. “A New Generation of the United States National Land Cover Database: Requirements, Research Priorities, Design, and Implementation Strategies.” ISPRS Journal of Photogrammetry and Remote Sensing 146: 108–123. https://doi.org/10.1016/j.isprsjprs.2018.09.006
- Zhao, Xizhi, Bailang Yu, Yan Liu, Shenjun Yao, Ting Lian, Liujia Chen, Chengshu Yang, Zuoqi Chen, and Jianping Wu. 2018. “NPP-VIIRS DNB Daily Data in Natural Disaster Assessment: Evidence from Selected Case Studies.” Remote Sensing 10 (10): 1526. https://doi.org/10.3390/rs10101526.