
ABSTRACT
Land change science co-evolves with remote sensing technology. The world has witnessed an exponential growth in Earth observation satellites since 1972, and concurrently, land change research has experienced transformative advancement. This review summarizes the major milestones in global land cover and change mapping in a chronological order, from the pioneering efforts in the 1980s to the latest innovations at present, illustrating the tremendous progress in monitoring global land change from space. The second part of the review presents a critical synopsis of the recent progress in land change research, focusing on the technical aspects of temporal trends characterization, change mapping and area estimation, as well as the applied aspects of driver attribution and the complex consequences to the Earth system and human society. The last part of the article offers insights in the strategic directions of land change monitoring, including generation of analysis ready data, application of artificial intelligence algorithms, reconstruction of historical land change records, and near-real-time land change monitoring. Land change science will continue to play a vital role in addressing a wide range of global challenges, including climate change and carbon sequestration, food security, sustainable energy transition, natural disaster relief and environmental change in conflicted societies.
1. Introduction
Land cover and land use (LCLU) characterize the land surface and how it is being managed by humans. Maps of LCLU provide fundamental information for many scientific fields such as informing the ecological state of the Earth system, as well as practical applications such as informing local and regional land use policies (Foley et al. Citation2005; Townshend et al. Citation1991; Wulder et al. Citation2022). On the global scale, land surface characteristics represent important boundary conditions for modulating biosphere-atmosphere interactions (DeFries et al. Citation1995a). Thus, information on global LCLU is essential for understanding the functioning of biogeochemical cycles, and accurate quantification of changes in LCLU is important for understanding human perturbations to the global cycles and their consequences, including climate change.
Land cover refers to the biophysical cover on the ground, such as vegetation, water, bare soil and impervious surface, whereas land use refers to the purpose the land serves, for example, agriculture, wildlife habitat, urban infrastructure and recreation. Land cover, as opposed to land use, can be directly observed from satellites or other remote sensing platforms, whereas land use is a major driver of land cover change. When land is regarded as a system, land change, a term central to land system science and land change science, refers to all changes occurring on the land surface, which include changes in both land cover and land use (Song et al. Citation2018; Turner, Lambin, and Reenberg Citation2007).
Earth observations (EO) from satellites are the primary data source to generate land cover and change maps (DeFries, Hansen, and Townshend Citation1995; Running et al. Citation1995; Townshend et al. Citation1991). Although the first EO satellite (i.e. Landsat-1) was launched in 1972, Landsat data were not freely available until 2008 and research using Landsat data was predominantly over local or regional scales (Cihlar Citation2000; Woodcock et al. Citation2001; Wulder et al. Citation2018; Citation2022). The field of continental-to-global-scale land cover mapping began in the 1980s with the creative use of meteorological satellite data, such as the Advanced Very High Resolution Radiometer (AVHRR) (Tucker, Townshend, and Goff Citation1985). Over the last 40 years, considerable progress has been made in creating land cover and change products, owing to the proliferation of EO satellites, the open data policy of the United States Geological Survey (USGS) and other organizations, the advancement of computer algorithms, and the reduced cost of data storage and processing. For example, in areal terms the spatial resolution of the global land cover maps has been increased by over 100 million times, from one degree (approximately 111 km at the Equator) to 10 m. The technical evolution in land cover mapping has facilitated new scientific discoveries. For instance, while satellite data clearly show that tropical forests continue to be destroyed at an alarming rate (Achard et al. Citation2002; Hansen et al. Citation2013; Skole and Tucker Citation1993), analysis of a 35-year satellite data record reveals expanding tree cover in higher latitudes and higher altitudes of the Earth’s land surface (Song et al. Citation2018).
This paper outlines our increasing capabilities in land change monitoring and how these will substantially extend their value for Earth system research and for many practical applications in the near future. As a major strength of satellite remote sensing is its capability to reveal environmental change consistently over broad scales, this review focuses on land change studies at the global scale. Many insights communicated in this review are drawn from recent research results.
2. Brief timeline of global land cover and change mapping from the 1980s to early 2020s
The first breakthrough of continental land cover mapping was accomplished by Tucker, Townshend, and Goff (Citation1985), who characterized land cover over Africa using data from AVHRR onboard National Oceanic and Atmospheric Administration (NOAA) satellites (). Subsequently in the 1990s, Defries and Townshend (Citation1994) created the first global-scale land cover product at one degree resolution, which was later refined to 8 km (DeFries et al. Citation1998) and 1 km resolutions (Hansen et al. Citation2000). Parallel efforts by Loveland et al. (Citation2000) at the USGS created the 1 km International Geosphere-Biosphere Programme (IGBP) DISCover product, also from AVHRR. A consortium of international research groups led by the Joint Research Centre of the European Commission generated the 1 km Global Land Cover 2000 (GLC2000) product using data from VEGETATION sensor onboard the SPOT satellite (Bartholomé and Belward Citation2005). After the turn of the century, improved sensors such as the Moderate Resolution Imaging Spectroradiometer (MODIS) on Terra & Aqua and Medium Resolution Imaging Spectrometer (MERIS) on Envisat were the main data sources for several 250 m-to-1 km land cover products, including the MODIS land cover (Friedl et al. Citation2002), the MODIS Vegetation Continuous Fields (VCF) (Hansen et al. Citation2003) and GlobCover (Arino et al. Citation2007).
Figure 1. Global land cover maps and major characteristics from 1980s to 2020s. AVHRR: Advanced Very High Resolution Radiometer; NOAA: National Oceanic and Atmospheric Administration; UMD: University of Maryland; SPOT: Satellite Pour l'Observation de la Terre; MODIS: Moderate Resolution Imaging Spectroradiometer; MERIS: Medium Resolution Imaging Spectrometer; VCF: Vegetation Continuous Fields; PROBA-V: Project for On-Board Autonomy – Vegetation; TM: Thematic Mapper; ETM+: Enhanced Thematic Mapper Plus; OLI-TIRS: Operational Land Imager/Thermal Infrared Sensor; MSI: MultiSpectral Instrument; ESA: European Space Agency; CCI: Climate Change Initiative; GLAD: Global Land Analysis & Discovery Laboratory; ESRI: Environmental Systems Research Institute, Inc.
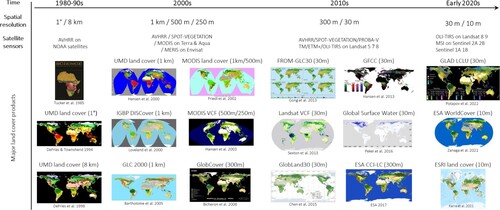
A watershed event in the history of remote sensing was the opening of the Landsat archive by USGS in 2008, which significantly changed global land cover mapping (Townshend et al. Citation2012; Woodcock et al. Citation2008; Wulder et al. Citation2012). The decade following the Landsat archive opening was decorated by global mapping efforts at 30 m resolution, including Global Forest Cover Change (Hansen et al. Citation2013), Global Landsat VCF (Sexton et al. Citation2013), Fine Resolution Observation and Monitoring of Global Land Cover (FROM-GLC) (Gong et al. Citation2013), GlobeLand30 (Chen et al. Citation2015), global land-cover classification with a fine classification system (GLC_FCS30) (Zhang et al. Citation2021), the Global Land Analysis and Discovery Lab (GLAD) Global Land Cover and Land Use Change data (Potapov, Hansen, et al. Citation2022), and the Global Land Cover Estimation (GLanCE) data (Friedl et al. Citation2022). Most recently in the early 2020s, EO from the Sentinel-2 and Sentinel-1 satellites have become the main data source for global mapping at 10 m resolution, and several global land cover datasets have already been generated, such as the European Space Agency (ESA)’s WorldCover (Zanaga et al. Citation2022), Environmental Systems Research Institute, Inc. (ESRI)’s global land cover (Karra et al. Citation2021), and Google’s Dynamic World (Brown et al. Citation2022). It is clear, that along with the enhanced spatial resolution of satellite data, private institutions are increasingly involved in global land cover mapping and monitoring.
3. Recent progress in land change research
A central theme of technical advance in land change research is the continued adoption of more advanced image analytical methods on higher-resolution satellite data. Machine/deep learning algorithms such as random forests and convolutional neural networks have become the mainstream methods in land cover classification (Breiman Citation2001; Zhu et al. Citation2017). Consequently, the utility of moderate-to-high-resolution global land cover data has evolved beyond the original scientific purpose of providing boundary conditions for climate models (DeFries et al. 1995). Increased characteristics of satellite data offer an unprecedent opportunity to better depict the patterns and trends of contemporary landscape transformation, expediting a deeper understanding of the drivers of land change and the consequences to the Earth system and human society.
3.1. Characterizing temporal trends in land cover
When land cover is considered as a static variable, time-series of remote sensing data not only allows more accurate quantification of first-order change (i.e. velocity of land cover change), but also enables characterization of second-order change (i.e. temporal trend). So, why is trend characterization important for land change research? First, trend is a more realistic representation of land change, as the Earth’s land surface is constantly modified by natural or anthropogenic forces and repeated modifications are not uncommon. Second, trends can help uncover the underlying drivers of land change or changes in drivers, as many factors can gradually modify land cover without radically altering the stable state (see more details in Section 3.3). Moreover, representing temporal trends in a spatially explicit manner is useful for identifying emerging hotspots of land change. Such information is vital for devising prescriptive policies to control destructive land use activities (e.g. deforestation).
Trends in land cover can be present at the pixel level or over broad scales (e.g. the scale of political units). At the pixel level, abrupt changes can occur, which can be detected and summarized over land use units to form continuous trends. A number of domain-specific methods have been developed to detect pixel-level change using dense time series of satellite data, such as LandTrender (Kennedy, Yang, and Cohen Citation2010), Vegetation Change Tracker (Huang et al. Citation2010), Breaks for Additive Season and Trend (Verbesselt et al. Citation2010), Continuous Change Detection and Classification (Zhu and Woodcock Citation2014) and VCF-based Change Analysis (Song et al. Citation2014), although large-area applications of these methods remain to be studied (Friedl et al. Citation2022).
To date, trend quantification over broad scales is largely accomplished by the annual production or update of land cover datasets. The most notable example is the Global Forest Cover Change (GFCC) map generated by Hansen et al. (Citation2013). Numerous studies have been empowered by this dataset. For instance, GFCC revealed an abrupt increase in mapped forest loss over Europe after 2015, which was linked to increasing harvested area promoted by the bioeconomy policies of the European Union, although the causal connection is still being debated (Ceccherini et al. Citation2020; Palahí et al. Citation2021). Forest loss driven by fire has been found rising over the globe from 2000 to 2019 (Tyukavina et al. Citation2022). Increasing forest cover loss in the tropics has resulted in a doubling of carbon emissions from 2001 to 2019 (Feng et al. Citation2022). Production of time-series of global cropland maps suggested that cropland expansion has been accelerating in the twenty-first century, especially in Africa (Potapov, Turubanova, et al. Citation2022). Production of annual soybean maps over South America showed a sustained expansion of soybeans, mostly replacing open woodland in the Cerrado (Song, Hansen, et al. Citation2021). The nearly linear growth in soybean area in Brazil indicates robust driving forces and continued expansion in the near future. Likewise, analysis of annual Cropland Data Layer (CDL) over the US suggested that cropland has been encroaching into low-yield lands in the northern Great Plains (Lark et al. Citation2020). Production of annual impervious surface layers demonstrated accelerating urban sprawl in the Washington DC-Baltimore metroplex (Song et al. Citation2016). Global hotspots of land cover change were recently mapped using ESA’s annual Climate Change Initiative Land Cover data (Liu et al. Citation2018).
The annual time step is a natural choice for updating global land cover maps for long-term trend analysis as it matches the annual cycles of vegetation phenology and land management in many parts of the world. Annual land cover mapping can also facilitate integration of remote sensing data with other data sources, e.g. agricultural statistics. As such, time-series of global land cover datasets will continue to be developed for tracking temporal trends in land cover.
3.2. Combining satellite-based land cover mapping and sample-based areal estimation
Areal statistics are a derivative of land cover maps useful for many practical applications and pixel counting is a straightforward way of deriving areal statistics. Due to unbalanced omission and commission errors and mixed pixels, pixel counting can yield biased areal estimates at aggregated scales (Gallego Citation2004; McRoberts Citation2011). As scientific measurements, rigorous uncertainties associated with the area of land change are required in many downstream applications, but pixel counting cannot produce uncertainty estimates. A recent methodological development in land cover research is integration of satellite mapping with statistical sampling, which can simultaneously deliver validated land cover maps, unbiased areal and uncertainty estimates. Consequently, satellite-assisted sampling for areal estimation has become a widely accepted method (Stehman and Xing Citation2022). Although land cover maps may not be directly used to calculate area through pixel counting, they can provide spatial information for stratification to effectively locate the target land cover class, and thus, improve the efficiency of sampling. Compared to simple random and systematic sampling, map-based stratification can increase the precision of areal estimation by multiple times in terms of reducing the standard error or sample size (e.g. Broich et al. Citation2009; Song et al. Citation2017). Stratified sampling has been successfully applied to categorize the drivers of deforestation in the Congo Basin (Tyukavina et al. Citation2018), estimate the area of forest degradation in the Amazon (Bullock et al. Citation2020) and quantify long-term land cover and land use change (LCLUC) over South America (Zalles et al. Citation2021).
On the other hand, probability sampling offers three distinctive advantages for satellite mapping: (1) it provides a mechanism to collect spatially representative data for calibrating supervised machine learning models; (2) observations collected over sample units can be directly used as reference data for map validation; and (3) sample-based areal estimates can serve as a constraint for mapping such that the map-based area through pixel counting matches the sample-based areal estimates at the population level. The bridge to reconcile the potential discrepancy between sample-based area and map-based area lies in the per-pixel probability output layer of nonparametric machine-learning algorithms. Utilizing the continuous probability layer, the reconciliation becomes a mathematical optimization problem with the sample-based areal estimates as the optimization target and the empirical probability threshold for pixel discretization as the variable (Song et al. Citation2017; Tyukavina et al. Citation2022). Furthermore, by setting the optimization target as the upper or lower bound of statistical areal estimates, the approach can generate spatially explicit uncertainty estimates (Song et al. Citation2017; Tyukavina et al. Citation2022).
One of the critical applications of the approach is in agriculture, where both crop distribution maps and crop areal statistics are highly desirable products for operational agricultural agencies. The generic method of combining satellite-based crop mapping and sample-based area estimation has been demonstrated at various scales, including the provincial scale (Khan et al. Citation2021), the national scale (King et al. Citation2017; Li et al. Citation2023; Song et al. Citation2017), the continental scale (Song, Hansen, et al. Citation2021) and the global scale (Potapov, Turubanova, et al. Citation2022). Extending the research to other LCLUC themes beyond agriculture and forest, especially for rare land change types requires further demonstration.
3.3. Land change driver attribution
Substantial progress has been made in understanding the complex drivers of land change. Drivers of land change are diverse, multi-scale and interactive (Geist and Lambin Citation2002; Lambin et al. Citation2001; Liu et al. Citation2017; Meyfroidt et al. Citation2022). They can be broadly classified into three conceptual groups: (1) natural drivers, (2) direct human impacts, and (3) human-induced environmental change factors (Song et al. Citation2018). Natural drivers include a variety of abiotic factors such as drought, earthquake, flood, landslide, windthrow, and wildfire, as well as biotic agents such as vegetation diseases and insects. Many of the natural factors are related to extreme climatic and weather events, which can cause land cover change to occur abruptly at the local scale. In contrast, land cover can be directly changed by anthropogenic activities to meet human need (Foley et al. Citation2005). Direct human impact is mainly related to land-use conversion and land management, which can also cause land cover change to occur abruptly at the local scale. The third and an emerging category of drivers is human-induced environmental change, such as climate change, CO2 fertilization, and nitrogen deposition (Zhu et al. Citation2016). This category of drivers is ultimately caused by human activities, but they modify land cover through altering the Earth system processes, and thus, the effects exhibit at regional or broader scales and the resulting land cover changes are gradual.
The wide range of drivers determines that no single method is capable of identifying all of them. Instead, various attribution methods are suitable for a particular category of drivers. First, mapping using EO is a straightforward way to attribute drivers that have distinctive spectral, spatial or temporal signatures, such as wildfire, flooding, landslides, and logging. For example, Curtis et al. (Citation2018) mapped four major drivers of global forest cover loss (deforestation, forestry, shifting agriculture, and wildfire) at 10-km grid scale. Recently, Tyukavina et al. (Citation2022) mapped fire-induced forest cover loss at 30 m and annual resolutions. Second, sample-based visualization approach that combines probability sampling, very-high-resolution satellite imagery and advanced image interpretation skills is an established method for driver attribution. This method is most suitable for land use and land management activities that are directly observable on very-high-resolution images but not readily mappable using coarse-resolution data. For example, Song et al. (Citation2018) employed a sample-based approach and attributed 60% of all global land cover changes from 1982 to 2016 to direct human impact. Zalles et al. (Citation2021) applied a sample-based approach and discovered that 20% of natural lands in South America were converted from 1985 to 2018.
The third and an increasingly popular approach is to apply econometric techniques on time-series of satellite data to quantify human factors that are not directly observable from remote sensing. Recent examples include Li et al. (Citation2022), who applied fixed-effect models to quantify the cropland area change caused by the Syrian Civil War, and Olsen et al. (Citation2021), who applied a quasi-experimental method to define the relationship between cropland abandonment and armed conflicts in South Sudan. Lastly, Dynamic Global Vegetation Models (DGVMs), by simulating vegetation distribution under past, current and future climate conditions, provide a valuable way to quantify terrestrial ecosystem responses to broad-scale environmental changes (Prentice et al. Citation2007; Sitch et al. Citation2008). The impacts of individual processes such as CO2 fertilization and N deposition on vegetation cover can be simulated in a spatially explicit manner by DGVMs (Zhu et al. Citation2016). With substantial human perturbations to the Earth system in the Anthropocene, human-induced environmental change, natural variations and human land use are increasingly intertwined (Gauthier et al. Citation2015; Lewis, Edwards, and Galbraith Citation2015; Popkin Citation2021). Disentangling the impact of the diverse and interactive drivers of land change continues to be a challenging and active direction in land change research.
3.4. Evaluating complex impacts and tradeoffs of land change
Satellite monitoring of land cover continues to advance our understanding of the impacts and tradeoffs of land change on the Earth system and human society. Because different land cover types function differently in modulating the exchanges of energy, gas and water between the atmosphere and the biosphere, changes in land cover can cause profound impacts on global biogeochemical cycles (Vitousek et al. Citation1997). Recent analysis of satellite-based forest cover loss and biomass data suggested that deforestation emissions, which are already the 2nd largest carbon emission source, are still rising in the twenty-first century (Feng et al. Citation2022). Improved global land cover change data has led to renewed recognition of the role of land cover change in regulating soil respiration, which is the largest flux of carbon from the terrestrial ecosystems to the atmosphere. Huang et al. (Citation2020) reported an overall increasing trend in annual soil respiration based on MODIS data and demonstrated that while climate change played a dominant role in regulating soil respiration changes in the tropics, land cover change played a more important role in temperate and boreal regions.
The impacts of land change resulting from human activities are multifaceted and involve tradeoffs due in part to the unintended environmental externalities. Driven by increasing demand for food, large areas of natural vegetation in South America and Africa are being converted to crop cultivation at an unprecedented rate (Potapov, Turubanova, et al. Citation2022). In particular, the rate of cropland expansion inside protected areas has been accelerating, threatening the aspirations of the post-2020 biodiversity framework (Meng et al. Citation2023). Meanwhile, large amount of prime agricultural lands in the North China Plain are being replaced by permanent urban development (Potapov, Hansen, et al. Citation2022). Tree cover gain from forest plantations in southern China has substantially increased above-ground carbon stocks, but at the same time it depleted soil water through enhanced evapotranspiration, which challenges the longevity of the carbon sink service (Tong et al. Citation2020). These recent studies clearly demonstrate the various tradeoffs between urban development, food production, nature protection and water conservation, highlighting the challenges that must be resolved to achieve multiple sustainable development goals (SDGs) set by the United Nations 2030 agenda (Guo et al. Citation2022). Recently, nature-based solutions (NbS) through ecosystem restoration and sustainable resource management are acclaimed in the public policy arena as an integrated solution to a suite of global challenges (Cohen-Shacham et al. Citation2016; Seddon et al. Citation2020). EO-based land cover monitoring will be vital for the measuring, monitoring, reporting and verification of the effectiveness of NbS efforts.
4. Future prospects
Here we outline some of the future directions and applications of land change monitoring. Due to the continued growth of Earth Observation data, more powerful computing facilities and advanced analytical algorithms such as deep learning, land change science will continue to evolve in multiple dimensions. Along the temporal dimension, accumulating satellite data archives and consistent satellite data pre-processing will allow reconstruction of long-term historical land change records. The low latency of satellite data acquisition and distribution will enable innovative techniques for near-real-time land change monitoring, transforming applications such as disaster management for natural and human disasters (e.g. warfare). Along the spatial and thematic dimensions, fine-grained natural or human-created land surface objects (e.g. individual trees) will be increasingly visible and identifiable by applying deep learning algorithms. Globally under-studied themes (e.g. crop type mapping) and emerging land change themes (e.g. land use for renewable energy generation) are attracting efforts from the remote sensing community. Moreover, increasing adoption of satellite data by various scientific disciplines is facilitating inter-disciplinary inquires to a range of complex and pressing issues facing the world today (e.g. global climate change and regional warfare).
4.1. Developing analysis ready data from multiple satellites
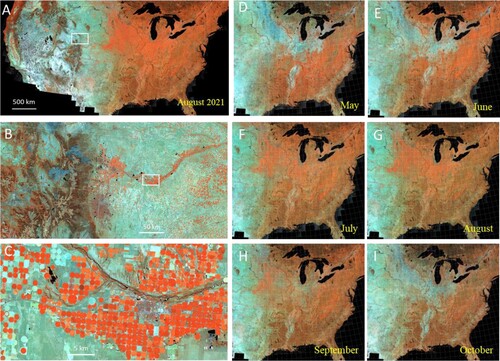
Robust satellite data pre-processing is crucial for land change monitoring over broad scales. Traditionally, satellite images are distributed in scenes such as the Worldwide Reference System (WRS) tiles of Landsat, which creates artificial disruption at the scene boundaries and impedes large-area applications (Hansen and Loveland Citation2012). Analysis Ready Data (ARD) is defined as ‘satellite data that have been processed to a minimum set of requirements and organized into a form that allows immediate analysis with a minimum of additional user effort and interoperability both through time and with other datasets’ (http://ceos.org/ard/). They are being increasingly adopted by the EO community. With enhanced quality assurance, cloud and shadow masking, pixel composition, and spatially aligned grids, users of ARD can directly conduct time-series analysis to monitor land change over large areas (). Exemplary ARDs generated to date include the global-scale USGS Landsat ARD (Dwyer et al. Citation2018), the University of Maryland GLAD Landsat ARD (Potapov et al. Citation2020), and regional-scale ARDs such as the Australian Geoscience Data Cube (Lewis et al. Citation2017), the Swiss Data Cube (Chatenoux et al. Citation2021) and the Brazilian Data Cube (Ferreira et al. Citation2020).
Figure 2. 10 m Analysis Ready Data (ARD) based on Sentinel-2 satellites shows spatial and temporal coherency for large-area land cover mapping. A. Surface reflectance mosaic over the Conterminous United States in August 2021. B and C. Zoom-in examples showing the spatial details of ARD at the crop field level. White squares on A and B indicate the spatial extents of B and C, respectively. D-I. Time series of ARD depicting the temporal variations of vegetation phenology throughout the year. Straight white lines overlaid on the panels represent the boundaries of ARD tiles.
A future prospect is to develop ARDs utilizing observations across the entire observable electromagnetic spectrum, as remotely sensed observations from the visible, infrared, thermal and microwave ranges can all contribute unique information for land change characterization. ARD can be employed as a unifying framework to combine data from multiple satellite missions. Developing Radar ARD and combining optical and Radar ARD is particularly valuable, as Radar and optical data provide complementary information of the Earth’s surface and they are often acquired through different satellite missions. A leading effort to date in multi-sensor ARD creation is the Harmonized Landsat and Sentinel-2 (HLS) product (Claverie et al. Citation2018). As the satellite data policies become increasingly open for both optical and Radar sensors, expanding the scope of ARDs from multi-spectral surface reflectance, to Radar backscatter, hyperspectral surface reflectance and nighttime light, would greatly enhance global land change characterization and monitoring. Potential satellite missions with global data acquisition and open data policy for ARD integration include Landsat, Sentinel-2, Sentinel-1, ALOS/PALSAR (Advanced Land Observation Satellite / Phased Array L-band SAR), EnMAP (Environmental Mapping and Analysis Program), and the upcoming Biomass, NISAR (NASA-Indian Space Research Organization SAR) and SBG (Surface Biology and Geology) missions (Berger et al. Citation2012; Guanter et al. Citation2015; Kellogg et al. Citation2020; Masek et al. Citation2020; Rosenqvist et al. Citation2014; Stavros et al. Citation2023; Wu et al. Citation2019). High-resolution data from commercial small satellites can substantially expand the capability of ARDs from public satellites, although data availability over large areas from commercial satellites is still an issue at present.
4.2. Mining historical satellite archives for long-term trend characterization
The Landsat data archive and its >10 million images represent one of the most systematic databases we have assembled for understanding changes of the Earth’s land surface over the past half century when the climate change impact became discernible (Roy et al. Citation2014; Wulder et al. Citation2022). Mining Landsat and other satellite data archives using advanced data analytics can reconstruct a spatially explicit history of land change, potentially leading to discoveries of new human-environmental interactions.
Nonparametric machine learning algorithms continue to be the mainstream methods for land change mapping. These algorithms require representative training data for model calibration. While the requirements of training data are well established in the literature, in practice, unlike validation data that have strict statistical protocols to follow (Stehman and Czaplewski Citation1998), training data collection is often based on convenience or limited by the availability of existing data (Friedl et al. Citation2022). This conventional way of training data collection is cost effective. However, mapping land cover, especially those highly relevant to land use (e.g. crop type), requires greater generalization of the capability of models, which in turn requires that the training data are enhanced to improve their representation of the land cover or land use. Limitations also exist for mapping land cover of historical years where field-based training data collection is by definition impossible.
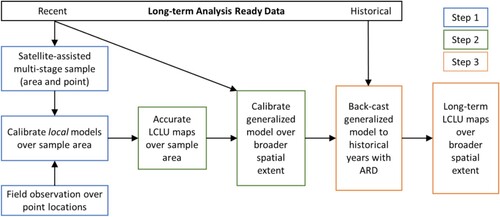
A promising way for future land cover mapping is to adopt a structured means of model calibration and generalization that utilizes the inherent spatiotemporally continuous nature of geographical issues. Recently, a multi-scale approach was developed with probability sampling as a critical component (Potapov, Turubanova, et al. Citation2022; Song, Hansen, et al. Citation2021). The method consists of three generalization steps in a spatially, temporally and statistically explicit way: (1) scaling from point-based field observations to area-based sample blocks, (2) scaling from probabilistic sample blocks to regions/continents/globe scales, and (3) back-casting calibrated models to historical years (). Step-1 allows managing mapping problems within the context of local geographical diversity at the sample unit level. Step-2 allows generalization of calibrated models across broad spatial extents. Step-3 allows generalization of calibrated models across the temporal domain enabled by consistent processing of ARD. Although demonstrated for crop applications, this approach may be applicable for mapping other higher level land cover and land use themes across broad extents and time.
Figure 3. A conceptual workflow for long-term land cover monitoring over broad spatial extent. The workflow consists of three major steps in a spatially, temporally and statistically explicit manner. ARD: Analysis Ready Data.
4.3. Near-real-time land cover monitoring for disaster relief
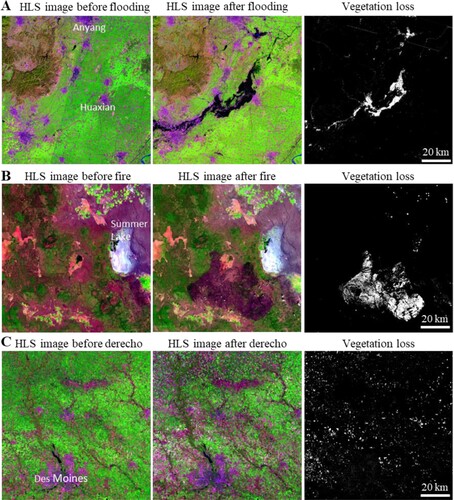
Many natural disasters are internal events of the Earth system. Nevertheless, the impact of natural disasters on human society will become increasingly heightened. On one hand, wildfires, flooding, droughts, hurricanes, and other extreme weather and climate events will intensify under 1.5°C warming (IPCC Citation2023). On the other hand, along with population growth and urban sprawl, human population continue to encroach onto uninhabitable landscapes, increasing their vulnerability to natural disasters. Already, many of the climate-induced disasters and geohazards occur at the wildland urban interface. The low latency of satellite data acquisition and preprocessing, rapid application of machine learning algorithms, and wide adoption of cloud computing platforms can transform space-based disaster monitoring in a near-real-time (NRT) fashion. Operational satellite-based NRT monitoring capability has been demonstrated for tropical deforestation alert systems, such as the Landsat- and Sentinel-2-based GLAD Forest Alerts (Hansen et al. Citation2016), and Sentinel-1-based forest disturbance alert (Reiche et al. Citation2021). A global land surface disturbance product (DIST), as one of the Observational Products for End-Users from Remote Sensing Analysis (OPERA) product suites, has recently become available (Hansen Citation2023). Developed based on the Harmonized Landsat-8 and Sentinel-2 (HLS) data, DIST characterizes per-pixel vegetation cover and disturbance at a daily frequency in Cloud-Optimized GeoTIFF format. Land development and natural disasters causing vegetation loss across the world can be tracked through DIST (). Contextualizing vegetation disturbance for disaster monitoring and developing NRT monitoring systems over non-vegetated regions represents important lines of future research.
Figure 4. Vegetation loss generated by the global land surface disturbance project can be used to assess the impacts of a variety of natural disasters. For each panel, the first and second columns are Harmonized Landsat Sentinel-2 (HLS) images before and after a natural disaster shown in shortwave-infrared – near-infrared – red band combination. The last columns are vegetation loss layers with >50% vegetation cover reduction shown in white. A. Flooding in Henan, China, 17–31 July 2021. B. Bootleg Fire in Oregon, USA, July 6–Aug 16, 2021. C. Derecho in Iowa, USA, 10–11 August 2020.
4.4. Characterizing individual trees for carbon estimation
Quantifying changes in forests is important for climate change mitigation due to the large fluxes of carbon between forest ecosystems and the atmosphere (Harris et al. Citation2021). Satellite data of moderate spatial resolution (10-30 m) are the prevailing data source for mapping tree cover at the global scale (Hansen et al. Citation2013; Sexton et al. Citation2013). However, the 30 m resolution does not allow characterization of individual trees. A recent study identified 1.8 billion trees across a 1.3 million km2 area in West Africa by analyzing submeter satellite data, which were largely absent in the Landsat-based tree cover maps (Brandt et al. Citation2020). Analysis of wall-to-wall 3 m PlanetScope images suggested that more than 25% of Africa’s tree cover were located outside areas previously classified as forests (Reiner et al. Citation2023).
Trees-outside-forests (TOF) systems contain large amounts of carbon and possess a great potential to sequester atmospheric carbon (Tucker et al. Citation2023). Thus, TOF could become an important component of natural climate solutions that is currently missing in forest-based international financial schemes such as REDD + (Reducing Emissions from Deforestation and forest Degradation, and conservation, as well as the sustainable management of forests and the conservation and enhancement of forest carbon stocks) (Skole et al. Citation2021). Mapping TOF is especially important for the global drylands, where sparsely treed ecosystems and agroforestry are predominant. Deep learning algorithms applied on very-high-resolution images can effectively delineate individual tree crowns (Brandt et al. Citation2020), which can be integrated with allometric equations for biomass estimation (Tucker et al. Citation2023). Fusion optical data with light detection and ranging (Lidar) measurements (e.g. ICESat-2, Global Ecosystem Dynamics Investigation or GEDI) enables characterization of the 3D structure of individual trees, leading to improved biomass estimation (Dubayah et al. Citation2020). Extending the research using time series analysis to estimate changes in the carbon stock of TOF over the globe will have profound implications for landscape restoration efforts in locations that do not meet the formal definition of forests.
4.5. High resolution global crop and yield mapping
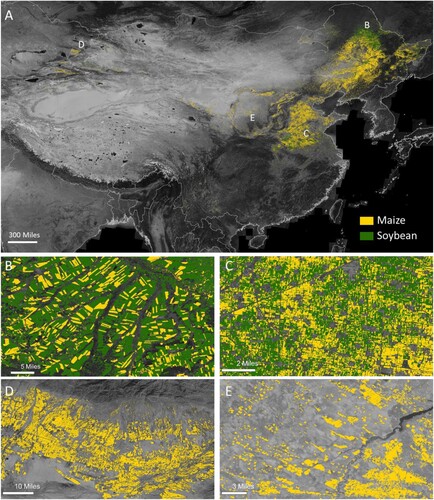
Satellite remote sensing is transforming global agricultural monitoring. Crop maps are essential data for crop monitoring systems and crop modeling projects e.g. the Agricultural Model Intercomparison and Improvement Project (AgMIP) (Rosenzweig et al. Citation2013). Generating high-resolution global crop maps represents a research area of significant potential. Large-area crop mapping is a technical challenge due to a number of factors, including crop species diversity, phenological variations, varying field size, and varying vegetation responses to weeds, disease and management practices. Mapping crops in smallholder systems is especially challenging owing to the smaller field size and inter-cropping mixes. The Landsat and Sentinel series of satellites, with 10-30 m spatial resolution, sub-weekly revisit frequency, free data policy, and standardized pre-processing, represent the best available datasets for crop mapping over the global scale (). The shortwave infrared bands from Landsat and red-edge bands from Sentinel-2 are particularly valuable for mapping maize and soybeans (Li et al. Citation2023; Song, Huang, et al. Citation2021). Commercial very-high-resolution images have the potential to play an important role in smallholder systems but, at present their high data costs remain prohibitive for operational applications.
Figure 5. A satellite-based 10 m maize and soybean map over China using data from Li et al. (Citation2023) A. Overview of the map over China. B. Large maize and soybean fields in the Northeast China Plain. C. Small-holder maize and soybean in the North China Plain. D and E. Dryland maize cultivation in Northwest China.
Mapping crop yield requires crop type masks as a prerequisite. Numerous studies have revealed that remote sensing indices at key vegetation growth stages, that are critical to crop biomass accumulation and yield formation, are directly related to crop yield (Becker-Reshef et al. Citation2010; Johnson Citation2014; Song et al. Citation2022). Advanced machine-learning algorithms are increasingly used to explore the nonlinear relationships between satellite observations and yield (Weiss, Jacob, and Duveiller Citation2020). Recent research also demonstrated that machine-learning models calibrated with long-term historical observations could be employed to predict yield in future years (Song et al. Citation2022). Innovative data such as solar-induced fluorescence and the near-infrared reflectance of vegetation (NIRv) are shown to be directly correlated with plant photosynthesis and Gross Primary Production and thus proved promising to improve yield mapping (Badgley, Field, and Berry Citation2017; Guan et al. Citation2016; Guanter et al. Citation2014; Wu et al. Citation2020). Another line of active research is to advance the date of in-season forecasting (Gao et al. Citation2020; Lin et al. Citation2022), as reliable early- and mid-season forecasting would allow critical time to respond to production shocks from extreme weather events. A common drawback for large-area yield mapping/forecasting is the lack of field observations for model calibration (Deines et al. Citation2021; Kang and Özdoğan Citation2019). Improving the accessibility to field-level yield measurements are viable ways to improve crop yield assessment over large areas (Song et al. Citation2022).
4.6. Land use issues associated with sustainable energy transition
The global energy crisis resulted from the COVID-19 pandemic and the Ukraine war will likely boost fossil fuel extraction in the short term. Over the long term, transitioning from fossil fuel to renewable energy is the inevitable path to combat climate change. However, due to renewables’ lower energy intensity, a major challenge is the projected large demand for land resources for energy production, which may create conflicts with food production and/or undermine biodiversity and the provision of ecosystem services (Edwards et al. Citation2022; Larson et al. Citation2021; Scheidel and Sorman Citation2012; van de Ven et al. Citation2021). Yet, energy land use, including fossil fuels and renewables, is rarely considered as an independent category in global land cover mapping projects. As a result, the current status and trend of global energy land use is still unknown. How to optimize the spatial allocation of infrastructures to minimize environmental impact and ensure equitable access to renewable energy are still open questions.
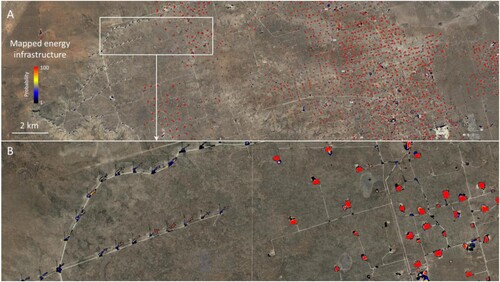
Due to the relatively small size of the energy facilities, high spatial resolution images from space or aerial platforms and deep learning-based object identification techniques are essential components for infrastructure mapping and monitoring (). Pioneering efforts have mapped commercial-, industrial-, and utility-scale photovoltaic solar installations across the world’s land surface using Sentinel 2 data (Kruitwagen et al. Citation2021). Although solar and wind currently constitute a small fraction of the energy mix, their contributions are expected to grow in the next few decades and so is their footprint on land (Scheidel and Sorman Citation2012). Based on model simulations, large-scale solar and wind farms can alter regional climatic patterns, such as increasing rainfall in the Sahara (Li et al. Citation2018). Developing wind or solar farms can also cause conflict and resistance from local communities (Susskind et al. Citation2022). Identifying the potential lands for energy infrastructure development while minimizing environmental damage and ensuring equitable access is a high priority for research and implementation. Remote sensing data is expected to play a central role in monitoring the expansion of energy infrastructures, which is rapidly occurring in many parts of the world.
Figure 6. Energy infrastructure (wind turbines and oil/gas pads) mapped using National Agriculture Imagery Program (NAIP) data and deep learning algorithms over West Texas. Red polygons on the right represent mapped oil/gas pads.
4.7. Land cover and land use change in conflicted societies
Political instability due to drastic shocks such as armed conflicts is prevalent in the world and can strongly affect society and the environment (Baumann and Kuemmerle Citation2016; Landholm, Pradhan, and Kropp Citation2019; Li et al. Citation2022; Olsen et al. Citation2021). Armed conflicts can affect land systems in diverse ways, creating local, immediate as well as tele-coupled, long-lasting impacts (Baumann and Kuemmerle Citation2016). Based on daytime and nighttime satellite observation, Li et al. (Citation2022) showed that the impacts of Syrian Civil War exhibit considerable spatial heterogeneity. While the Syrian Civil War severely reduced food production in some regions, the war also promoted food production in relatively safer zones. A growing literature is investigating the impacts of the ongoing Russia-Ukraine War on regional and global environments, including the freshwater resources and water infrastructure in Ukraine, global food security, and the potential land and water ‘grabbing’ in the Global South (Dell’Angelo, Rulli, and D’Odorico Citation2023; Lin et al. Citation2023; Shumilova et al. Citation2023).
Timely and continued monitoring of LCLUC amid conflicts is vital for providing humanitarian aid for food security and post-conflict planning. The recent proliferation of very-high resolution, high frequency, and multi-modal remote sensing data sets from public and private sectors has opened new opportunities in land change monitoring in the conflicted area, where remote sensing is often the only means for information collection. However, current studies focusing on the causal linkage between armed conflict and land system change are scarce, spatially clustered, and non-systematic (Baumann and Kuemmerle Citation2016). Understanding the impacts of LCLUC caused by armed conflicts and political instability is urgently needed. Advancing this under-researched field will have broad and long-term implications as climate change is expected to increase crop failure and resource scarcity and increase the likelihood of war in the future (Burke et al. Citation2009).
5. Conclusions
The field of land change research is closely coupled with the advancement of remote sensing technology. Over the past half century, the proliferation of Earth observation satellites, open data policy, rapid development of machine learning algorithms and access to high-performance computing have revolutionized global land change monitoring. The best available global land cover maps today have an areal spatial resolution 100 million times finer than that of the first global map. The extraordinary development in observational capacity of today’s satellites allows researchers, practitioners, and the public to visualize land surface change with greater granularity and increasingly in real time.
Moving forward, land cover will be characterized in greater thematic details that match the scale of direct human modification of the landscape. Locally relevant and globally consistent land change products are increasingly built on advanced workflows of satellite data processing, such as the generation of Analysis Ready Data. More broadly, Analysis Ready Data can be employed as a unifying framework to combine optical and radar datasets from the current, the future as well as the past satellite missions. Retrospectively processing the accumulated satellite data archive will allow us to reconstruct a spatially explicit history of land surface change over the past half century when the climate change impact became discernible.
These technological advances are expediting a deeper understanding of Earth system science. As the Earth transforms into a human-dominated planet, human activities in many aspects have already exceeded the planetary boundaries. Land change monitoring will continue to play a vital role in addressing a wide range of contemporary global challenges. Characterizing individual tree structure from space will help us to understand the carbon sequestration potential of the terrestrial ecosystems. High-resolution crop distribution and yield mapping is critical to address the tradeoffs between food production and environmental protection, which is one of the central challenges of the United Nations’ Sustainable Development Goals. Remote sensing data are expected to play an essential role in monitoring the expansion of energy infrastructures and addressing land use issues associated with the sustainable energy transition. Natural disasters and human conflicts are reshaping regional environments and global societies, where near-real-time land cover monitoring is vital for information acquisition and post-disaster planning. Harnessing the power of satellite technology to understand how land is changing will ultimately result in enormous benefits for human society.
Acknowledgements
This paper would not have been possible without the continued mentoring support from Dr. John Townshend. I thank Dr. Matthew Hansen and the University of Maryland Global Land Analysis & Discovery (UMD GLAD) team for insightful discussion. I thank Dr. Zhen Song and Haijun Li for providing data used in some figures.
Disclosure statement
No potential conflict of interest was reported by the author(s).
Additional information
Funding
References
- Achard, F., H. D. Eva, H. J. Stibig, P. Mayaux, J. Gallego, T. Richards, and J. P. Malingreau. 2002. “Determination of Deforestation Rates of the World's Humid Tropical Forests.” Science 297 (5583): 999–1002. https://doi.org/10.1126/science.1070656.
- Arino, O., D. Gross, F. Ranera, M. Leroy, P. Bicheron, C. Brockman, P. Defourny, et al. 2007. “GlobCover: ESA Service for Global Land Cover from MERIS.” Paper presented at the 2007 IEEE International Geoscience and Remote Sensing Symposium, 23-28 July 2007.
- Badgley, Grayson, Christopher B. Field, and Joseph A. Berry. 2017. “Canopy Near-Infrared Reflectance and Terrestrial Photosynthesis.” Science Advances 3 (3): e1602244. https://doi.org/10.1126/sciadv.1602244.
- Bartholomé, E., and A. S. Belward. 2005. “GLC2000: A new Approach to Global Land Cover Mapping from Earth Observation Data.” International Journal of Remote Sensing 26 (9): 1959–1977. https://doi.org/10.1080/01431160412331291297.
- Baumann, Matthias, and Tobias Kuemmerle. 2016. “The Impacts of Warfare and Armed Conflict on Land Systems.” Journal of Land Use Science 11 (6): 672–688. https://doi.org/10.1080/1747423X.2016.1241317.
- Becker-Reshef, I., E. Vermote, M. Lindeman, and C. Justice. 2010. “A Generalized Regression-Based Model for Forecasting Winter Wheat Yields in Kansas and Ukraine Using MODIS Data.” Remote Sensing of Environment 114 (6): 1312–1323. https://doi.org/10.1016/j.rse.2010.01.010.
- Berger, Michael, Jose Moreno, Johnny A. Johannessen, Pieternel F. Levelt, and Ramon F. Hanssen. 2012. “ESA's Sentinel Missions in Support of Earth System Science.” Remote Sensing of Environment 120:84–90. https://doi.org/10.1016/j.rse.2011.07.023.
- Brandt, M., C. J. Tucker, A. Kariryaa, K. Rasmussen, C. Abel, J. Small, J. Chave, et al. 2020. “An Unexpectedly Large Count of Trees in the West African Sahara and Sahel.” Nature 587 (7832): 78–82. https://doi.org/10.1038/s41586-020-2824-5.
- Breiman, Leo. 2001. “Random Forests.” Machine Learning 45 (1): 5–32. https://doi.org/10.1023/A:1010933404324.
- Broich, Mark, Stephen V. Stehman, Matthew C. Hansen, Peter Potapov, and Yosio E. Shimabukuro. 2009. “A Comparison of Sampling Designs for Estimating Deforestation from Landsat Imagery: A Case Study of the Brazilian Legal Amazon.” Remote Sensing of Environment 113 (11): 2448–2454. https://doi.org/10.1016/j.rse.2009.07.011.
- Brown, Christopher F., Steven P. Brumby, Brookie Guzder-Williams, Tanya Birch, Samantha Brooks Hyde, Joseph Mazzariello, Wanda Czerwinski, et al. 2022. “Dynamic World, Near Real-Time Global 10 m Land use Land Cover Mapping.” Scientific Data 9 (1): 251. https://doi.org/10.1038/s41597-022-01307-4.
- Bullock, Eric L., Curtis E. Woodcock, Carlos Souza Jr, and Pontus Olofsson. 2020. “Satellite-Based Estimates Reveal Widespread Forest Degradation in the Amazon.” Global Change Biology 26 (5): 2956–2969. doi:10.1111/gcb.15029.
- Burke, Marshall B., Edward Miguel, Shanker Satyanath, John A. Dykema, and David B. Lobell. 2009. “Warming Increases the Risk of Civil war in Africa.” Proceedings of the National Academy of Sciences 106 (49): 20670–4. https://doi.org/10.1073/pnas.0907998106.
- Ceccherini, Guido, Gregory Duveiller, Giacomo Grassi, Guido Lemoine, Valerio Avitabile, Roberto Pilli, and Alessandro Cescatti. 2020. “Abrupt Increase in Harvested Forest Area Over Europe After 2015.” Nature 583 (7814): 72–77. https://doi.org/10.1038/s41586-020-2438-y.
- Chatenoux, B., J. P. Richard, D. Small, C. Roeoesli, V. Wingate, C. Poussin, D. Rodila, et al. 2021. “The Swiss Data Cube, Analysis Ready Data Archive Using Earth Observations of Switzerland.” Scientific Data 8 (1): 295. https://doi.org/10.1038/s41597-021-01076-6.
- Chen, Jun, Jin Chen, Anping Liao, Xin Cao, Lijun Chen, Xuehong Chen, Chaoying He, et al. 2015. “Global Land Cover Mapping at 30m Resolution: A POK-Based Operational Approach.” ISPRS Journal of Photogrammetry and Remote Sensing 103:7–27. https://doi.org/10.1016/j.isprsjprs.2014.09.002.
- Cihlar, J. 2000. “Land Cover Mapping of Large Areas from Satellites: Status and Research Priorities.” International Journal of Remote Sensing 21 (6-7): 1093–1114. https://doi.org/10.1080/014311600210092.
- Claverie, Martin, Junchang Ju, Jeffrey G. Masek, Jennifer L. Dungan, Eric F. Vermote, Jean-Claude Roger, Sergii V. Skakun, and Christopher Justice. 2018. “The Harmonized Landsat and Sentinel-2 Surface Reflectance Data set.” Remote Sensing of Environment 219:145–161. https://doi.org/10.1016/j.rse.2018.09.002.
- Cohen-Shacham, E., G. Walters, C. Janzen, and S. Maginnis. 2016. “Nature-based Solutions to Address Global Societal Challenges”, xiii + 97pp. Switzerland: IUCN. https://doi.org/10.2305/IUCN.CH.2016.13.en.
- Curtis, Philip G., Christy M. Slay, Nancy L. Harris, Alexandra Tyukavina, and Matthew C. Hansen. 2018. “Classifying Drivers of Global Forest Loss.” Science 361 (6407): 1108–1111. https://doi.org/10.1126/science.aau3445.
- DeFries, Ruth S., Christopher B. Field, Inez Fung, Christopher O. Justice, Sietse Los, Pamela A. Matson, Elaine Matthews, et al. 1995a. “Mapping the Land Surface for Global Atmosphere-Biosphere Models: Toward Continuous Distributions of Vegetation's Functional Properties.” Journal of Geophysical Research 100 (D10): 20867–20882. https://doi.org/10.1029/95JD01536.
- DeFries, Ruth, Matthew Hansen, and John Townshend. 1995b. “Global Discrimination of Land Cover Types from Metrics Derived from AVHRR Pathfinder Data.” Remote Sensing of Environment 54 (3): 209–222. https://doi.org/10.1016/0034-4257(95)00142-5.
- DeFries, R. S., M. Hansen, J. R. G. Townshend, and R. Sohlberg. 1998. “Global Land Cover Classifications at 8 km Spatial Resolution: The use of Training Data Derived from Landsat Imagery in Decision Tree Classifiers.” International Journal of Remote Sensing 19 (16): 3141–3168. https://doi.org/10.1080/014311698214235.
- Defries, R. S., and J. R. G. Townshend. 1994. “NDVI-derived Land Cover Classifications at a Global Scale.” International Journal of Remote Sensing 15 (17): 3567–3586. https://doi.org/10.1080/01431169408954345.
- Deines, Jillian M., Rinkal Patel, Sang-Zi Liang, Walter Dado, and David B. Lobell. 2021. “A Million Kernels of Truth: Insights Into Scalable Satellite Maize Yield Mapping and Yield gap Analysis from an Extensive Ground Dataset in the US Corn Belt.” Remote Sensing of Environment 253:112174. https://doi.org/10.1016/j.rse.2020.112174.
- Dell’Angelo, Jampel, Maria Cristina Rulli, and Paolo D’Odorico. 2023. “Will war in Ukraine Escalate the Global Land Rush?” Science 379 (6634): 752–755. doi:doi:10.1126/science.adf9351.
- Dubayah, Ralph, James Bryan Blair, Scott Goetz, Lola Fatoyinbo, Matthew Hansen, Sean Healey, Michelle Hofton, et al. 2020. “The Global Ecosystem Dynamics Investigation: High-Resolution Laser Ranging of the Earth’s Forests and Topography.” Science of Remote Sensing 1: 100002. https://doi.org/10.1016/j.srs.2020.100002.
- Dwyer, John L., David P. Roy, Brian Sauer, Calli B. Jenkerson, Hankui K. Zhang, and Leo Lymburner. 2018. “Analysis Ready Data: Enabling Analysis of the Landsat Archive.” Remote Sensing 10 (9): 1363. https://doi.org/10.3390/rs10091363.
- Edwards, Morgan R., Tracey Holloway, R. Bradley Pierce, Lew Blank, Madison Broddle, Eric Choi, Bryan N. Duncan, et al. 2022. “Satellite Data Applications for Sustainable Energy Transitions.” Frontiers in Sustainability 3. https://doi.org/10.3389/frsus.2022.910924.
- Feng, Yu, Zhenzhong Zeng, Timothy D. Searchinger, Alan D. Ziegler, Jie Wu, Dashan Wang, Xinyue He, et al. 2022. “Doubling of Annual Forest Carbon Loss Over the Tropics During the Early Twenty-First Century.” Nature Sustainability 5 (5): 444–451. https://doi.org/10.1038/s41893-022-00854-3.
- Ferreira, Karine R., Gilberto R. Queiroz, Lubia Vinhas, Rennan F. B. Marujo, Rolf E. O Simoes, Michelle C. A. Picoli, Gilberto Camara, et al. 2020. “Earth Observation Data Cubes for Brazil: Requirements, Methodology and Products.” Remote Sensing 12. https://doi.org/10.3390/rs12244033.
- Foley, J. A., R. Defries, G. P. Asner, C. Barford, G. Bonan, S. R. Carpenter, F. S. Chapin, et al. 2005. “Global Consequences of Land use.” Science 309 (5734): 570–574. https://doi.org/10.1126/science.1111772.
- Friedl, M. A., D. K. McIver, J. C. F. Hodges, X. Y. Zhang, D. Muchoney, A. H. Strahler, C. E. Woodcock, et al. 2002. “Global Land Cover Mapping from MODIS: Algorithms and Early Results.” Remote Sensing of Environment 83 (1-2): 287–302. https://doi.org/10.1016/S0034-4257(02)00078-0.
- Friedl, Mark A., Curtis E. Woodcock, Pontus Olofsson, Zhe Zhu, Tom Loveland, Radost Stanimirova, Paulo Arevalo, et al. 2022. “Medium Spatial Resolution Mapping of Global Land Cover and Land Cover Change Across Multiple Decades from Landsat.” Frontiers in Remote Sensing 3: 894571. https://doi.org/10.3389/frsen.2022.894571
- Gallego, F. J. 2004. “Remote Sensing and Land Cover Area Estimation.” International Journal of Remote Sensing 25 (15): 3019–3047. https://doi.org/10.1080/01431160310001619607.
- Gao, Feng, Martha Anderson, Craig Daughtry, Arnon Karnieli, Dean Hively, and William Kustas. 2020. “A Within-Season Approach for Detecting Early Growth Stages in Corn and Soybean Using High Temporal and Spatial Resolution Imagery.” Remote Sensing of Environment, https://doi.org/10.1016/j.rse.2020.111752
- Gauthier, S., P. Bernier, T. Kuuluvainen, A. Z. Shvidenko, and D. G. Schepaschenko. 2015. “Boreal Forest Health and Global Change.” Science 349 (6250): 819–822. https://doi.org/10.1126/science.aaa9092.
- Geist, Helmut J., and E. F. Lambin. 2002. “Proximate Causes and Underlying Driving Forces of Tropical Deforestation.” BioScience 52 (2): 143–150. https://doi.org/10.1641/0006-3568(2002)052[0143:PCAUDF]2.0.CO;2.
- Gong, Peng, Jie Wang, Le Yu, Yongchao Zhao, Yuanyuan Zhao, Lu Liang, Zhenguo Niu, et al. 2013. “Finer Resolution Observation and Monitoring of Global Land Cover: First Mapping Results with Landsat TM and ETM+ Data.” International Journal of Remote Sensing 34 (7): 2607–2654. https://doi.org/10.1080/01431161.2012.748992.
- Guan, K., J. A. Berry, Y. Zhang, J. Joiner, L. Guanter, G. Badgley, and D. B. Lobell. 2016. “Improving the Monitoring of Crop Productivity Using Spaceborne Solar-Induced Fluorescence.” Global Change Biology 22 (2): 716–726. https://doi.org/10.1111/gcb.13136.
- Guanter, Luis, Hermann Kaufmann, Karl Segl, Saskia Foerster, Christian Rogass, Sabine Chabrillat, Theres Kuester, et al. 2015. “The EnMAP Spaceborne Imaging Spectroscopy Mission for Earth Observation.” Remote Sensing 7 (7): 8830–8857. https://doi.org/10.3390/rs70708830.
- Guanter, L., Y. Zhang, M. Jung, J. Joiner, M. Voigt, J. A. Berry, C. Frankenberg, et al. 2014. “Global and Time-Resolved Monitoring of Crop Photosynthesis with Chlorophyll Fluorescence.” Proceedings of the National Academy of Sciences 111 (14): E1327–E1333. https://doi.org/10.1073/pnas.1320008111.
- Guo, H., D. Liang, Z. Sun, F. Chen, X. Wang, J. Li, L. Zhu, et al. 2022. “Measuring and Evaluating SDG Indicators with Big Earth Data.” Science Bulletin 67 (17): 1792–1801. https://doi.org/10.1016/j.scib.2022.07.015.
- Hansen, Matthew. 2023. “OPERA Land Surface Disturbance Alert from Harmonized Landsat Sentinel-2 Provisional Product (Version 0).” In.: NASA EOSDIS Land Processes DAAC.
- Hansen, M. C., R. S. DeFries, J. R. G. Townshend, M. Carroll, C. Dimiceli, and R. A. Sohlberg. 2003. “Global Percent Tree Cover at a Spatial Resolution of 500 Meters: First Results of the MODIS Vegetation Continuous Fields Algorithm.” Earth Interactions 7 (10): 1. https://doi.org/10.1175/1087-3562(2003)007<0001:GPTCAA>2.0.CO;2
- Hansen, M. C., R. S. DeFries, J. R. G. Townshend, and R. A. Sohlberg. 2000. “Global Land Cover Classification at 1 km Spatial Resolution Using a Classification Tree Approach.” International Journal of Remote Sensing 21 (6-7): 1331–1364. https://doi.org/10.1080/014311600210209.
- Hansen, Matthew C., Alexander Krylov, Alexandra Tyukavina, Peter V. Potapov, Svetlana Turubanova, Bryan Zutta, Suspense Ifo, Belinda Margono, Fred Stolle, and Rebecca Moore. 2016. “Humid Tropical Forest Disturbance Alerts Using Landsat Data.” Environmental Research Letters 11 (3): 0034008. https://doi.org/10.1088/1748-9326/11/3/034008.
- Hansen, Matthew C., and Thomas R. Loveland. 2012. “A Review of Large Area Monitoring of Land Cover Change Using Landsat Data.” Remote Sensing of Environment 122: 66–74. https://doi.org/10.1016/j.rse.2011.08.024.
- Hansen, M. C., P. V. Potapov, R. Moore, M. Hancher, S. A. Turubanova, Alexandra Tyukavina, D. Thau, et al. 2013. “High-Resolution Global Maps of 21st-Century Forest Cover Change.” Science 342 (6160): 850–853. https://doi.org/10.1126/science.1244693.
- Harris, Nancy L., David A. Gibbs, Alessandro Baccini, Richard A. Birdsey, Sytze de Bruin, Mary Farina, Lola Fatoyinbo, et al. 2021. “Global Maps of Twenty-First Century Forest Carbon Fluxes.” Nature Climate Change 11 (3): 234–240. https://doi.org/10.1038/s41558-020-00976-6.
- Huang, Chengquan, Samuel N. Goward, Jeffrey G. Masek, Nancy Thomas, Zhiliang Zhu, and James E. Vogelmann. 2010. “An Automated Approach for Reconstructing Recent Forest Disturbance History Using Dense Landsat Time Series Stacks.” Remote Sensing of Environment 114 (1): 183–198. https://doi.org/10.1016/j.rse.2009.08.017.
- Huang, Ni, Li Wang, Xiao-Peng Song, T. Andrew Black, Rachhpal S. Jassal, Ranga B. Myneni, Chaoyang Wu, et al. 2020. “Spatial and Temporal Variations in Global Soil Respiration and Their Relationships with Climate and Land Cover.” Science Advances 6 (41): eabb8508. https://doi.org/10.1126/sciadv.abb8508.
- IPCC. 2023. Climate Change 2023: Synthesis Report. In.
- Johnson, David M. 2014. “An Assessment of pre- and Within-Season Remotely Sensed Variables for Forecasting Corn and Soybean Yields in the United States.” Remote Sensing of Environment 141: 116–128. https://doi.org/10.1016/j.rse.2013.10.027.
- Kang, Yanghui, and Mutlu Özdoğan. 2019. “Field-level Crop Yield Mapping with Landsat Using a Hierarchical Data Assimilation Approach.” Remote Sensing of Environment 228: 144–163. https://doi.org/10.1016/j.rse.2019.04.005.
- Karra, K., C. Kontgis, Z. Statman-Weil, J. C. Mazzariello, M. Mathis, and S. P. Brumby. 2021. “Global Land Use / Land Cover with Sentinel 2 and Deep Learning.” Paper presented at the 2021 IEEE International Geoscience and Remote Sensing Symposium IGARSS, 11-16 July 2021.
- Kellogg, K., P. Hoffman, S. Standley, S. Shaffer, P. Rosen, W. Edelstein, C. Dunn, et al. 2020. NASA-ISRO Synthetic Aperture Radar (NISAR) Mission. Paper presented at the 2020 IEEE Aerospace Conference, 7-14 March 2020.
- Kennedy, Robert E., Zhiqiang Yang, and Warren B. Cohen. 2010. “Detecting Trends in Forest Disturbance and Recovery Using Yearly Landsat Time Series: 1. LandTrendr — Temporal Segmentation Algorithms.” Remote Sensing of Environment 114 (12): 2897–2910. https://doi.org/10.1016/j.rse.2010.07.008.
- Khan, Ahmad, Matthew C. Hansen, Peter Potapov, Bernard Adusei, Stephen V. Stehman, and Marc K. Steininger. 2021. “An Operational Automated Mapping Algorithm for in-Season Estimation of Wheat Area for Punjab, Pakistan.” International Journal of Remote Sensing 42 (10): 3833–3849. https://doi.org/10.1080/01431161.2021.1883200.
- King, LeeAnn, Bernard Adusei, Stephen Stehman, Peter V. Potapov, Xiao-Peng Song, Alexander Krylov, Carlos Di Bella, Thomas R. Loveland, David M. Johnson, and Matthew C. Hansen. 2017. “A Multi-Resolution Approach to National-Scale Cultivated Area Estimation of Soybean.” Remote Sensing of Environment 195: 13–29. https://doi.org/10.1016/j.rse.2017.03.047.
- Kruitwagen, L., K. T. Story, J. Friedrich, L. Byers, S. Skillman, and C. Hepburn. 2021. “A Global Inventory of Photovoltaic Solar Energy Generating Units.” Nature 598 (7882): 604–610. https://doi.org/10.1038/s41586-021-03957-7.
- Lambin, Eric F., B. L. Turner, Helmut J. Geist, Samuel B. Agbola, Arild Angelsen, John W. Bruce, Oliver T. Coomes, et al. 2001. “The Causes of Land-use and Land-Cover Change: Moving Beyond the Myths.” Global Environmental Change 11 (4): 261–269. https://doi.org/10.1016/S0959-3780(01)00007-3.
- Landholm, David M., Prajal Pradhan, and Juergen P. Kropp. 2019. “Diverging Forest Land use Dynamics Induced by Armed Conflict Across the Tropics.” Global Environmental Change 56: 86–94. https://doi.org/10.1016/j.gloenvcha.2019.03.006.
- Lark, T. J., S. A. Spawn, M. Bougie, and H. K. Gibbs. 2020. “Cropland Expansion in the United States Produces Marginal Yields at High Costs to Wildlife.” Nature Communications 11 (1): 4295. https://doi.org/10.1038/s41467-020-18045-z.
- Larson, E., C. Greig, J. Jenkins, E. Mayfield, A. Pascale, C. Zhang, J. Drossman, et al. 2021. “Net Zero America: Potential Pathways, Infrastructure, and Impacts.” In Princeton, NJ: Princeton University.
- Lewis, Simon L., David P. Edwards, and David Galbraith. 2015. “Increasing Human Dominance of Tropical Forests.” Science 349 (6250): 827–832. https://doi.org/10.1126/science.aaa9932.
- Lewis, Adam, Simon Oliver, Leo Lymburner, Ben Evans, Lesley Wyborn, Norman Mueller, Gregory Raevksi, et al. 2017. “The Australian Geoscience Data Cube — Foundations and Lessons Learned.” Remote Sensing of Environment 202: 276–292. https://doi.org/10.1016/j.rse.2017.03.015.
- Li, Yan, Eugenia Kalnay, Safa Motesharrei, Jorge Rivas, Fred Kucharski, Daniel Kirk-Davidoff, Eviatar Bach, and Ning Zeng. 2018. “Climate Model Shows Large-Scale Wind and Solar Farms in the Sahara Increase Rain and Vegetation.” Science 361 (6406): 1019–1022. https://doi.org/10.1126/science.aar5629.
- Li, Xi-Ya, Xi Li, Ziying Fan, Li Mi, Tarek Kandakji, Zhen Song, Deren Li, and Xiao-Peng Song. 2022. “Civil war Hinders Crop Production and Threatens Food Security in Syria.” Nature Food 3 (1): 38–46. https://doi.org/10.1038/s43016-021-00432-4.
- Li, Haijun, Xiao-Peng Song, Matthew C. Hansen, Inbal Becker-Reshef, Bernard Adusei, Jeffrey Pickering, Li Wang, et al. 2023. “Development of a 10-m Resolution Maize and Soybean map Over China: Matching Satellite-Based Crop Classification with Sample-Based Area Estimation.” Remote Sensing of Environment 294: 113623. https://doi.org/10.1016/j.rse.2023.113623.
- Lin, Faqin, Xuecao Li, Ningyuan Jia, Fan Feng, Hai Huang, Jianxi Huang, Shenggen Fan, Philippe Ciais, and Xiao-Peng Song. 2023. “The Impact of Russia-Ukraine Conflict on Global Food Security.” Global Food Security 36: 100661. https://doi.org/10.1016/j.gfs.2022.100661.
- Lin, Chenxi, Liheng Zhong, Xiao-Peng Song, Jinwei Dong, David B. Lobell, and Zhenong Jin. 2022. “Early- and in-Season Crop Type Mapping Without Current-Year Ground Truth: Generating Labels from Historical Information via a Topology-Based Approach.” Remote Sensing of Environment 274: 112994. doi:10.1016/j.rse.2022.112994.
- Liu, Shuguang, Ben Bond-Lamberty, Lena R. Boysen, James D. Ford, Andrew Fox, Kevin Gallo, Jerry Hatfield, et al. 2017. “Grand Challenges in Understanding the Interplay of Climate and Land Changes.” Earth Interactions 21 (2): 1–43. https://doi.org/10.1175/EI-D-16-0012.1.
- Liu, Xiaoxuan, Le Yu, Yali Si, Chi Zhang, Hui Lu, Chaoqing Yu, and Peng Gong. 2018. “Identifying Patterns and Hotspots of Global Land Cover Transitions Using the ESA CCI Land Cover Dataset.” Remote Sensing Letters 9 (10): 972–981. https://doi.org/10.1080/2150704X.2018.1500070.
- Loveland, T. R., B. C. Reed, J. F. Brown, D. O. Ohlen, Z. Zhu, L. Yang, and J. W. Merchant. 2000. “Development of a Global Land Cover Characteristics Database and IGBP DISCover from 1 km AVHRR Data.” International Journal of Remote Sensing 21 (6-7): 1303–1330. https://doi.org/10.1080/014311600210191.
- Masek, Jeffrey G., Michael A. Wulder, Brian Markham, Joel McCorkel, Christopher J. Crawford, James Storey, and Del T. Jenstrom. 2020. “Landsat 9: Empowering Open Science and Applications Through Continuity.” Remote Sensing of Environment 248: 111968. https://doi.org/10.1016/j.rse.2020.111968.
- McRoberts, Ronald E. 2011. “Satellite Image-Based Maps: Scientific Inference or Pretty Pictures?” Remote Sensing of Environment 115 (2): 715–724. https://doi.org/10.1016/j.rse.2010.10.013.
- Meng, Ziqi, Jinwei Dong, Erle C. Ellis, Graciela Metternicht, Yuanwei Qin, Xiao-Peng Song, Sara Löfqvist, Rachael D. Garrett, Xiaopeng Jia, and Xiangming Xiao. 2023. “Post-2020 Biodiversity Framework Challenged by Cropland Expansion in Protected Areas.” Nature Sustainability, https://doi.org/10.1038/s41893-023-01093-w
- Meyfroidt, P., A. de Bremond, C. M. Ryan, E. Archer, R. Aspinall, A. Chhabra, G. Camara, et al. 2022. “Ten Facts About Land Systems for Sustainability.” Proceedings of the National Academy of Sciences 119 (7), https://doi.org/10.1073/pnas.2109217118.
- Olsen, Victor Mackenhauer, Rasmus Fensholt, Pontus Olofsson, Rogerio Bonifacio, Van Butsic, Daniel Druce, Deepak Ray, and Alexander V. Prishchepov. 2021. “The Impact of Conflict-Driven Cropland Abandonment on Food Insecurity in South Sudan Revealed Using Satellite Remote Sensing.” Nature Food 2 (12): 990–996. https://doi.org/10.1038/s43016-021-00417-3.
- Palahí, Marc, Rubén Valbuena, Cornelius Senf, Nezha Acil, Thomas A. M. Pugh, Jonathan Sadler, Rupert Seidl, et al. 2021. “Concerns About Reported Harvests in European Forests.” Nature 592 (7856): E15–EE7. https://doi.org/10.1038/s41586-021-03292-x.
- Popkin, Gabriel. 2021. “Forest Fight.” Science 374 (6572): 1184–1189. https://doi.org/10.1126/science.acx9733.
- Potapov, P., Matthew C. Hansen, Indrani Kommareddy, Anil Kommareddy, Svetlana Turubanova, Amy Pickens, Bernard Adusei, Alexandra Tyukavina, and Qing Ying. 2020. “Landsat Analysis Ready Data for Global Land Cover and Land Cover Change Mapping.” Remote Sensing 12 (3): 426. https://doi.org/10.3390/rs12030426.
- Potapov, Peter, Matthew C. Hansen, Amy Pickens, Andres Hernandez-Serna, Alexandra Tyukavina, Svetlana Turubanova, Viviana Zalles, et al. 2022a. “The Global 2000-2020 Land Cover and Land Use Change Dataset Derived from the Landsat Archive: First Results.” Frontiers in Remote Sensing 3. https://doi.org/10.3389/frsen.2022.856903.
- Potapov, Peter, Svetlana Turubanova, Matthew C. Hansen, Alexandra Tyukavina, Viviana Zalles, Ahmad Khan, Xiao-Peng Song, Amy Pickens, Quan Shen, and Jocelyn Cortez. 2022b. “Global Maps of Cropland Extent and Change Show Accelerated Cropland Expansion in the Twenty-First Century.” Nature Food 3: 19–28. https://doi.org/10.1038/s43016-021-00429-z.
- Prentice, I. Colin, Alberte Bondeau, Wolfgang Cramer, Sandy P. Harrison, Thomas Hickler, Wolfgang Lucht, Stephen Sitch, Ben Smith, and Martin T. Sykes. 2007. “Dynamic Global Vegetation Modeling: Quantifying Terrestrial Ecosystem Responses to Large-Scale Environmental Change.” In In Terrestrial Ecosystems in a Changing World, edited by Josep G. Canadell, Diane E. Pataki, and Louis F. Pitelka, 175–192. Berlin, Heidelberg: Springer Berlin Heidelberg.
- Reiche, Johannes, Adugna Mullissa, Bart Slagter, Yaqing Gou, Nandin-Erdene Tsendbazar, Christelle Odongo-Braun, Andreas Vollrath, et al. 2021. “Forest Disturbance Alerts for the Congo Basin Using Sentinel-1.” Environmental Research Letters 16 (2), https://doi.org/10.1088/1748-9326/abd0a8.
- Reiner, F., M. Brandt, X. Tong, D. Skole, A. Kariryaa, P. Ciais, A. Davies, et al. 2023. “More Than one Quarter of Africa's Tree Cover is Found Outside Areas Previously Classified as Forest.” Nature Communications 14 (1): 2258. https://doi.org/10.1038/s41467-023-37880-4.
- Rosenqvist, A., M. Shimada, S. Suzuki, F. Ohgushi, T. Tadono, M. Watanabe, K. Tsuzuku, T. Watanabe, S. Kamijo, and E. Aoki. 2014. “Operational Performance of the ALOS Global Systematic Acquisition Strategy and Observation Plans for ALOS-2 PALSAR-2.” Remote Sensing of Environment 155: 3–12. https://doi.org/10.1016/j.rse.2014.04.011.
- Rosenzweig, C., J. W. Jones, J. L. Hatfield, A. C. Ruane, K. J. Boote, P. Thorburn, J. M. Antle, et al. 2013. “The Agricultural Model Intercomparison and Improvement Project (AgMIP): Protocols and Pilot Studies.” Agricultural and Forest Meteorology 170: 166–182. https://doi.org/10.1016/j.agrformet.2012.09.011.
- Roy, D. P., M. A. Wulder, T. R. Loveland, C. E. Woodcock, R. G. Allen, M. C. Anderson, D. Helder, et al. 2014. “Landsat-8: Science and Product Vision for Terrestrial Global Change Research.” Remote Sensing of Environment 145: 154–172. https://doi.org/10.1016/j.rse.2014.02.001.
- Running, Steven W., Thomas R. Loveland, Lars L. Pierce, R. R. Nemani, and E. R. Hunt Jr. 1995. “A Remote Sensing Based Vegetation Classification Logic for Global Land Cover Analysis.” Remote Sensing of Environment 51 (1): 39–48. https://doi.org/10.1016/0034-4257(94)00063-S.
- Scheidel, Arnim, and Alevgul H. Sorman. 2012. “Energy Transitions and the Global Land Rush: Ultimate Drivers and Persistent Consequences.” Global Environmental Change 22 (3): 588–595. https://doi.org/10.1016/j.gloenvcha.2011.12.005.
- Seddon, Nathalie, Alexandre Chausson, Pam Berry, Cécile A. J. Girardin, Alison Smith, and Beth Turner. 2020. “Understanding the Value and Limits of Nature-Based Solutions to Climate Change and Other Global Challenges.” Philosophical Transactions of the Royal Society B: Biological Sciences 375 (1794): 20190120. https://doi.org/10.1098/rstb.2019.0120.
- Sexton, Joseph O., Xiao-Peng Song, Min Feng, Praveen Noojipady, Anupam Anand, Chengquan Huang, Do-Hyung Kim, et al. 2013. “Global, 30-m Resolution Continuous Fields of Tree Cover: Landsat-Based Rescaling of MODIS Vegetation Continuous Fields with Lidar-Based Estimates of Error.” International Journal of Digital Earth 6 (5): 427–448. https://doi.org/10.1080/17538947.2013.786146.
- Shumilova, Oleksandra, Klement Tockner, Alexander Sukhodolov, Valentyn Khilchevskyi, Luc De Meester, Sergiy Stepanenko, Ganna Trokhymenko, Juan Antonio Hernández-Agüero, and Peter Gleick. 2023. “Impact of the Russia–Ukraine Armed Conflict on Water Resources and Water Infrastructure.” Nature Sustainability. https://doi.org/10.1038/s41893-023-01068-x.
- Sitch, S., C. Huntingford, N. Gedney, P. E. Levy, M. Lomas, S. L. Piao, R. Betts, et al. 2008. “Evaluation of the Terrestrial Carbon Cycle, Future Plant Geography and Climate-Carbon Cycle Feedbacks Using Five Dynamic Global Vegetation Models (DGVMs).” Global Change Biology 14 (9): 2015–2039. https://doi.org/10.1111/j.1365-2486.2008.01626.x.
- Skole, David L., Cheikh Mbow, Maurice Mugabowindekwe, Martin S. Brandt, and Jay H. Samek. 2021. “Trees Outside of Forests as Natural Climate Solutions.” Nature Climate Change 11 (12): 1013–1016. https://doi.org/10.1038/s41558-021-01230-3.
- Skole, D. L., and C. J. Tucker. 1993. “Tropical Deforestation and Habitat Fragmentation in the Amazon: Satellite Data from 1978 to 1988.” Science 260 (5116): 1905–1909. https://doi.org/10.1126/science.260.5116.1905.
- Song, Xiao-Peng, Matthew C. Hansen, Peter V. Potapov, Bernard Adusei, Jeffrey Pickering, Marcos Adami, Andre Lima, et al. 2021a. “Massive Soybean Expansion in South America Since 2000 and Implications for Conservation.” Nature Sustainability 4: 784–792. https://doi.org/10.1038/s41893-021-00729-z.
- Song, Xiao-Peng, M. C. Hansen, S. V. Stehman, P. V. Potapov, A. Tyukavina, E. F. Vermote, and J. R. Townshend. 2018. “Global Land Change from 1982 to 2016.” Nature 560 (7720): 639–643. https://doi.org/10.1038/s41586-018-0411-9.
- Song, Xiao-Peng, Wenli Huang, Matthew C. Hansen, and Peter Potapov. 2021b. “An Evaluation of Landsat, Sentinel-2, Sentinel-1 and MODIS Data for Crop Type Mapping.” Science of Remote Sensing 3: 100018. https://doi.org/10.1016/j.srs.2021.100018.
- Song, Xiao-Peng, Chengquan Huang, Joseph O. Sexton, Saurabh Channan, and John R. Townshend. 2014. “Annual Detection of Forest Cover Loss Using Time Series Satellite Measurements of Percent Tree Cover.” Remote Sensing 6 (9): 8878–8903. https://doi.org/10.3390/rs6098878.
- Song, Xiao-Peng, Haijun Li, Peter Potapov, and Matthew C. Hansen. 2022. “Annual 30 m Soybean Yield Mapping in Brazil Using Long-Term Satellite Observations, Climate Data and Machine Learning.” Agricultural and Forest Meteorology 326: 109186. doi:10.1016/j.agrformet.2022.109186.
- Song, Xiao-Peng, Peter V. Potapov, Alexander Krylov, LeeAnn King, Carlos M. Di Bella, Amy Hudson, Ahmad Khan, Bernard Adusei, Stephen V. Stehman, and Matthew C. Hansen. 2017. “National-scale Soybean Mapping and Area Estimation in the United States Using Medium Resolution Satellite Imagery and Field Survey.” Remote Sensing of Environment 190: 383–395. https://doi.org/10.1016/j.rse.2017.01.008.
- Song, Xiao-Peng, Joseph O. Sexton, Chengquan Huang, Saurabh Channan, and John R. Townshend. 2016. “Characterizing the Magnitude, Timing and Duration of Urban Growth from Time Series of Landsat-Based Estimates of Impervious Cover.” Remote Sensing of Environment 175: 1–13. https://doi.org/10.1016/j.rse.2015.12.027.
- Stavros, E. Natasha, Jon Chrone, Kerry Cawse -Nicholson, Anthony Freeman, Nancy F. Glenn, Liane Guild, Raymond Kokaly, et al. 2023. “Designing an Observing System to Study the Surface Biology and Geology (SBG) of the Earth in the 2020s.” Journal of Geophysical Research: Biogeosciences 128 (1), https://doi.org/10.1029/2021JG006471.
- Stehman, Stephen V., and Raymond L. Czaplewski. 1998. “Design and Analysis for Thematic Map Accuracy Assessment.” Remote Sensing of Environment 64 (3): 331–344. doi:10.1016/S0034-4257(98)00010-8.
- Stehman, Stephen V., and Dingfan Xing. 2022. “Confidence Intervals for Proportion of Area Estimated from a Stratified Random Sample.” Remote Sensing of Environment 280: 113193. doi:10.1016/j.rse.2022.113193.
- Susskind, Lawrence, Jungwoo Chun, Alexander Gant, Chelsea Hodgkins, Jessica Cohen, and Sarah Lohmar. 2022. “Sources of Opposition to Renewable Energy Projects in the United States.” Energy Policy 165. https://doi.org/10.1016/j.enpol.2022.112922.
- Tong, X., M. Brandt, Y. Yue, P. Ciais, M. Rudbeck Jepsen, J. Penuelas, J. P. Wigneron, et al. 2020. “Forest Management in Southern China Generates Short Term Extensive Carbon Sequestration.” Nature Communications 11 (1): 129. https://doi.org/10.1038/s41467-019-13798-8.
- Townshend, John, Christopher Justice, Wei Li, Charlotte Gurney, and Jim McManus. 1991. “Global Land Cover Classification by Remote Sensing: Present Capabilities and Future Possibilities.” Remote Sensing of Environment 35 (2-3): 243–255. doi:10.1016/0034-4257(91)90016-Y.
- Townshend, John R., Jeffrey G. Masek, Chengquan Huang, Eric F. Vermote, Feng Gao, Saurabh Channan, Joseph O. Sexton, et al. 2012. “Global Characterization and Monitoring of Forest Cover Using Landsat Data: Opportunities and Challenges.” International Journal of Digital Earth 5 (5): 373–397. https://doi.org/10.1080/17538947.2012.713190.
- Tucker, C., M. Brandt, P. Hiernaux, A. Kariryaa, K. Rasmussen, J. Small, C. Igel, et al. 2023. “Sub-continental-scale Carbon Stocks of Individual Trees in African Drylands.” Nature 615 (7950): 80–8l. https://doi.org/10.1038/s41586-022-05653-6.
- Tucker, Compton J., John R.G. Townshend, and Thomas E. Goff. 1985. “African Land-Cover Classification Using Satellite Data.” Science 227 (4685): 369–375. https://doi.org/10.1126/science.227.4685.369.
- Turner, B. L., E. F. Lambin, and A. Reenberg. 2007. “The Emergence of Land Change Science for Global Environmental Change and Sustainability.” Proceedings of the National Academy of Sciences 104 (52): 20666–20671. https://doi.org/10.1073/pnas.0704119104.
- Tyukavina, Alexandra, Matthew C. Hansen, Peter Potapov, Diana Parker, Chima Okpa, Stephen V. Stehman, Indrani Kommareddy, and Svetlana Turubanova. 2018. “Congo Basin Forest Loss Dominated by Increasing Smallholder Clearing.” Science Advances 4 (11): eaat2993. https://doi.org/10.1126/sciadv.aat2993.
- Tyukavina, Alexandra, Peter Potapov, Matthew C. Hansen, Amy H. Pickens, Stephen V. Stehman, Svetlana Turubanova, Diana Parker, et al. 2022. “Global Trends of Forest Loss Due to Fire from 2001 to 2019.” Frontiers in Remote Sensing 3: 825190. https://doi.org/10.3389/frsen.2022.825190
- van de Ven, D. J., I. Capellan-Perez, I. Arto, I. Cazcarro, C. de Castro, P. Patel, and M. Gonzalez-Eguino. 2021. “The Potential Land Requirements and Related Land use Change Emissions of Solar Energy.” Scientific Reports 11 (1): 2907. https://doi.org/10.1038/s41598-021-82042-5.
- Verbesselt, Jan, Rob Hyndman, Glenn Newnham, and Darius Culvenor. 2010. “Detecting Trend and Seasonal Changes in Satellite Image Time Series.” Remote Sensing of Environment 114 (1): 106–115. https://doi.org/10.1016/j.rse.2009.08.014.
- Vitousek, Peter M., Harold A. Mooney, Jane Lubchenco, and Jerry M. Melillo. 1997. “Human Domination of Earth's Ecosystems.” Science 277 (5325): 494–499. https://doi.org/10.1126/science.277.5325.494.
- Weiss, M., F. Jacob, and G. Duveiller. 2020. “Remote Sensing for Agricultural Applications: A Meta-Review.” Remote Sensing of Environment, https://doi.org/10.1016/j.rse.2019.111402.
- Woodcock, Curtis E., Richard Allen, Martha Anderson, Alan Belward, Robert Bindschadler, Warren Cohen, Feng Gao, et al. 2008. “Free Access to Landsat Imagery.” Science 320 (5879): 1011. https://doi.org/10.1126/science.320.5879.1011a.
- Woodcock, Curtis E., Scott A. Macomber, Mary Pax-Lenney, and Warren B. Cohen. 2001. “Monitoring Large Areas for Forest Change Using Landsat: Generalization Across Space, Time and Landsat Sensors.” Remote Sensing of Environment 78 (1-2): 194–203. https://doi.org/10.1016/S0034-4257(01)00259-0.
- Wu, Genghong, Kaiyu Guan, Chongya Jiang, Bin Peng, Hyungsuk Kimm, Min Chen, Xi Yang, et al. 2020. “Radiance-based NIRv as a Proxy for GPP of Corn and Soybean.” Environmental Research Letters 15 (3), https://doi.org/10.1088/1748-9326/ab65cc.
- Wu, Zhuoting, Gregory Snyder, Carolyn Vadnais, Rohit Arora, Michael Babcock, Gregory Stensaas, Peter Doucette, and Timothy Newman. 2019. “User Needs for Future Landsat Missions.” Remote Sensing of Environment 231: 111214. https://doi.org/10.1016/j.rse.2019.111214.
- Wulder, Michael A., Nicholas C. Coops, David P. Roy, Joanne C. White, and Txomin Hermosilla. 2018. “Land Cover 2.0.” International Journal of Remote Sensing 39 (12): 4254–4284. https://doi.org/10.1080/01431161.2018.1452075.
- Wulder, Michael A., Jeffrey G. Masek, Warren B. Cohen, Thomas R. Loveland, and Curtis E. Woodcock. 2012. “Opening the Archive: How Free Data has Enabled the Science and Monitoring Promise of Landsat.” Remote Sensing of Environment 122: 2–10. https://doi.org/10.1016/j.rse.2012.01.010.
- Wulder, Michael A., David P. Roy, Volker C. Radeloff, Thomas R. Loveland, Martha C. Anderson, David M. Johnson, Sean Healey, et al. 2022. “Fifty Years of Landsat Science and Impacts.” Remote Sensing of Environment, https://doi.org/10.1016/j.rse.2022.113195.
- Zalles, Viviana, Matthew C. Hansen, Peter V. Potapov, Diana Parker, Stephen V. Stehman, Amy H. Pickens, Leandro Leal Parente, et al. 2021. “Rapid Expansion of Human Impact on Natural Land in South America Since 1985.” Science Advances 7 (14): eabg1620. https://doi.org/10.1126/sciadv.abg1620.
- Zanaga, Daniele, Ruben Van De Kerchove, Dirk Daems, Wanda De Keersmaecker, Carsten Brockmann, Grit Kirches, Jan Wevers, et al. 2022. “ESA WorldCover 10 m 2021 v200.” In. Zenodo.
- Zhang, Xiao, Liangyun Liu, Xidong Chen, Yuan Gao, Shuai Xie, and Jun Mi. 2021. “GLC_FCS30: Global Land-Cover Product with Fine Classification System at 30 m Using Time-Series Landsat Imagery.” Earth System Science Data 13 (6): 2753–2776. https://doi.org/10.5194/essd-13-2753-2021.
- Zhu, Zaichun, Shilong Piao, Ranga B. Myneni, Mengtian Huang, Zhenzhong Zeng, Josep G. Canadell, Philippe Ciais, et al. 2016. “Greening of the Earth and its Drivers.” Nature Climate Change 6 (8): 791–795. https://doi.org/10.1038/nclimate3004. http://www.nature.com/nclimate/journal/v6/n8/abs/nclimate3004.html#supplementary-information.
- Zhu, Xiao Xiang, Devis Tuia, Lichao Mou, Gui-Song Xia, Liangpei Zhang, Feng Xu, and Friedrich Fraundorfer. 2017. “Deep Learning in Remote Sensing: A Comprehensive Review and List of Resources.” IEEE Geoscience and Remote Sensing Magazine 5 (4): 8–36. https://doi.org/10.1109/MGRS.2017.2762307.
- Zhu, Zhe, and Curtis E. Woodcock. 2014. “Continuous Change Detection and Classification of Land Cover Using all Available Landsat Data.” Remote Sensing of Environment 144: 152–171. https://doi.org/10.1016/j.rse.2014.01.011.