
 ?Mathematical formulae have been encoded as MathML and are displayed in this HTML version using MathJax in order to improve their display. Uncheck the box to turn MathJax off. This feature requires Javascript. Click on a formula to zoom.
ABSTRACT
Automatic registration of unordered point clouds is the prerequisite for urban reconstruction. However, most of the existing technologies still suffer from some limitations. On one hand, most of them are sensitive to noise and repetitive structures, which makes them infeasible for the registration of large-scale point clouds. On the other hand, most of them dealing with point clouds with limited overlaps and unpredictable location. All these problems make it difficult for registration technology to obtain qualified results in outdoor point cloud. To overcome these limitations, this paper presents a grid graph-based point cloud registration (GGR) algorithm to align pairwise scans. First, point cloud is divided into a set of 3D grids. We propose a voting strategy to measure the similarity between two grids based on feature descriptor, transforming the superficial correspondence into 3D grid expression. Next, a graph matching is proposed to capture the spatial consistency from putative correspondences, and graph matching hierarchically refines the corresponding grids until obtaining point-to-point correspondences. Comprehensive experiments demonstrated that the proposed algorithm obtains good performance in terms of successful registration rate, rotation error, translation error, and outperformed the state-of-the-art approaches.
1. Introduction
Point clouds are widely unitized for various applications such as 3D modeling (Montuori et al. Citation2014), 3D model reconstruction (Dong et al. Citation2018). Scanner’s field of vision is constrained, therefore several scans from various angles are required. The different view measured cloud data that lack georeferencing information must be aligned in order to provide a large-scale urban scene. Therefore, the registration is an indispensable operation before the scan are used further. However, several challenges exist in solving point cloud registration: (1) Large data size: millions or billions of points per scan calls for computationally efficient techniques. (2) Noise: noise will affect the reliability of geometric features extraction. (3) Occlusions and low overlapping: the search for correspondences is hampered by inadequate data and nonoverlapping region, which might be detrimental to registration. (4) Repetitive elements: homogeneous architectural structures may also cause the mismatching of corresponding feature pairs. Numerous researches (Cai et al. Citation2019; Dong et al. Citation2020; Zhou, Park, and Koltun Citation2016) have been conducted to increase the registration method's accuracy, effectiveness, and robustness in order to overcome these issues.
Point cloud registration involves the dual task of extracting correspondences and transformation parameters solving. The transformation parameters are derived by minimizing geometric errors on putative correspondences. As a result, outliers among these correspondences can undermine point cloud registration. The challenge of point cloud registration, therefore, is to ensure the reliability of correspondences extraction. However, approaches that extract correspondences from closest points, such as ICP (Iterative Closest Point) (Besl and McKay Citation1992), may converge to an incorrect local minimum if the initial orientation is not correct. Recently, feature-based registration methods (e.g. Li, Hu, and Ai Citation2021; Rusu, Blodow, and Beetz Citation2009), which provide accurate correspondences through feature descriptors, have gained more attention.
The core idea behind feature-based methods is to extract correspondences by comparing the feature representations of two scans. However, a high outlier rate is typical with these methods. To overcome this issue, researchers have focused on improving the stability of descriptions (e.g. Rusu, Blodow, and Beetz Citation2009; Salti, Tombari, and Stefano Citation2014). Robust descriptions ensure high similarity among corresponding points and discrimination against non-corresponding points. However, feature descriptors remain sensitive to noise and repetitive structures, leading to erroneous matching results when comparing the similarity between two points independently, especially for feature-based approaches (e.g. Enqvist, Josephson, and Kahl Citation2009; Fredriksson et al. Citation2016) that presume all-to-all correspondences. Note that in registration tasks, the accuracy of correspondences is more important than their number. Point cloud registration method requires only three corresponding pairs to accurately estimate the transformation, but correct correspondences can be drowned out by many mismatches. Consequently, outlier filters (e.g. Bai et al. Citation2021; Martin and Robert Citation1981; Yang, Jingnan, and Carlone Citation2021) advocate for identifying inliers from contaminated correspondences and building correspondences based only on these inliers. However, a high outlier rate can ultimately lead to the failure of outlier filters.
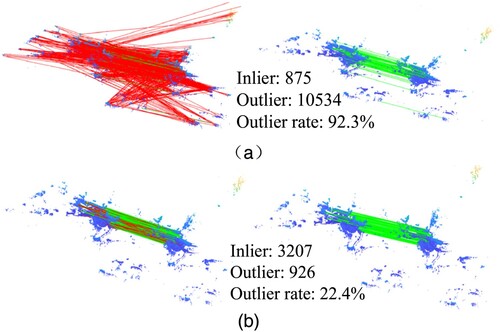
As previously discussed, one of the main challenges faced by feature-based registration methods is establishing accurate correspondences in scenarios with a high outlier rate. This paper proposes a method that aims to improve the ability to discern correct correspondences during the matching stage without the need to optimize the performance of the feature descriptor. Our approach may ultimately reduce the reliance on exact outlier filters and lead to more robust and precise registration results. demonstrates that this method leads to an increase in the number of inliers while also reducing the outlier rate. Notably, there was no significant difference between the proposed method and the outlier filtering method, suggesting that the removal of outliers is a contributing factor to the high inlier rate observed.
Figure 1. We address point cloud registration in an outdoor terrestrial laser scanner case where many point-to-point correspondences. (a) A classical method to align two scans by comparing feature representations of two scans. The data with 92.3% outliers (shown as red lines) and 7.7% inliers (shown as green lines). The number of inliers is 875 and the number of outliers is 10,534. (b) GGR computes the correspondence by using same feature descriptor. The data with 22.4% outliers (shown as red lines) and 77.6% inliers (shown as green lines), and our method increases the inliers.
We introduce a pairwise registration method for aligning two large-scale point clouds. Our approach utilizes a grid-graph matching technique to obtain spatially-consistent correspondences between the two point clouds. Initially, graph matching is used to obtain corresponding grids as the initial correspondences, which are then refined and updated alternately until obtaining point-to-point correspondences. The first step involves discretizing the point cloud into sparse 3D grids, where each point in a 3D grid represents its geometry information, instead of creating a global feature representation. We employ a voting strategy inspired by current Hough voting techniques (Lee et al. Citation2021) to determine the similarities between two grids. Next, we refine the votes hierarchically based on spatial geometry consistency and propose an improvement based on reweight random walk. Finally, we calculate the transformation parameter between the two scans by finding the largest number of consistent consensuses. Despite dividing point clouds into a series of 3D grids, our method retains the geometric information of the scans. The grid graph significantly reduces the complexity of searching for spatial consistency and is robust to unevenly distributed point densities without pre-processing. The main contributions of this work can be summarized as follows:
A voting mechanism that uses feature descriptors is proposed to calculate the similarity between two grids. The number of votes is counted to construct putative correspondences.
We propose a spatial consistency module for refine the ambiguous putative correspondences. To retrieve explicit result from superfluous putative correspondence, GGR leverages a new improved graph matching to guide the correspondences extraction. The similarity of spatial geometry is identified as a characteristic of inliers.
A hierarchical matching module is proposed to refine the corresponding grids. Experiment shows the GGR is robust to point clouds in lager scenes.
2. Related works
In this section, we will provide a brief overview of some techniques used in point cloud registration. A typical registration method must address two main challenges: identifying correspondences and estimating transformation parameters. Corresponding to the techniques used for identifying correspondence, point cloud registration methods can be broadly classified into two groups: point-based methods and feature-based methods.
2.1. Feature-based methods
The feature-based methods perform point cloud registration by matching 3D points between scans through comparing feature representations, and then using the resulting correspondences to estimate transformation parameters. To address the challenge of real-world datasets, Choy, Park, and Koltun (Citation2019) and Deng, Birdal, and Ilic (Citation2018) have emphasized the development of robust feature descriptors. These descriptors ensure discrimination against non-corresponding points, while also ensuring substantial similarity among feature descriptions of corresponding points. Prominent examples of hand-crafted methods include Spin Images (Johnson and Hebert Citation1999), Fast Point Feature Histogram (FPFH) (Rusu, Blodow, and Beetz Citation2009), and Signature of Histogram of Orientations (SHOT) (Salti, Tombari, and Stefano Citation2014). However, these methods are limited to local geometry and susceptible to noise. Learning-based methods, such as 3DMatch (Zeng et al. Citation2017), PPFNet (Deng, Birdal, and Ilic Citation2018), and FCGF (Choy, Park, and Koltun Citation2019), apply deep neural networks to encode 3D descriptors. Compared with hand-crafted methods, deep learning-based methods can automatically code more robust and distinct feature representations. Traditional matching strategies can be classified into two categories: unary-based and higher-order. Unary-based approaches, such as ratio test (Lowe Citation2004), similarity metric (Zeng et al. Citation2017), and reciprocal check (Bradski Citation2000), treat 3D features as independent units. However, this approach causes a much higher outlier rate, which is problematic for point cloud registration technology.
To remove outlier of correspondences, Outlier filtering methods are employed to detect mismatches. Outlier filtering algorithms eliminate incorrect correspondences and calculate rigid transformation between point clouds based on the remaining correspondences. Point cloud registration methods based on RANSAC (Martin and Robert Citation1981) are the most extensively used robust methods. Recently, learning-based 3D outlier rejection methods, such as PointDSC (Bai et al. Citation2021), 3DRegNet (Pais et al. Citation2020), and DGR (Choy, Dong, and Koltun Citation2020), have been proposed. These methods use operators such as sparse convolution and pointwise MLP to classify putative correspondences and predict the inlier probability of each correspondence. While these approaches achieve good performance at small-scale indoor point cloud registration, limitations on data amount and complexity make it difficult to apply them to large-scale outdoor point clouds (Dong et al. Citation2020).
In general, point-based methods are more popular for registration due to their applicability to various scenes. However, point cloud registration methods based on feature lines, plane, and surfaces have also emerged. Representative methods, such as voxel-based four-planes congruent sets (Xu et al. Citation2019), use planes instead of points as basic elements to form congruent sets. Geometric constraints constructed by building facades and ground surfaces were utilized by Xu et al. (Citation2017) for the coarse registration of urban point clouds. Khoshelham et al. (Citation2010) estimated the positions and orientations of two scans using the corresponding planes. Although line/plane-based methods (Xiao et al. Citation2013; Yang, Dong et al. Citation2016) work effectively for man-made objects, they suffer significant performance degradation in natural scenes with fewer line/plane features. Although feature-based methods can generally provide satisfactory results for point cloud registration, they still face common limitations such as low descriptiveness and weak robustness of existing 3D feature descriptors, as well as the high outlier rate of many outlier rejecting algorithms.
2.2. Points-based methods
Points-based registration uses mathematical rules instead of feature descriptor to identify corresponding pairs. There are some point-based methods in the literature which do not follow the paradigm of feature descriptors calculation and feature matching. For example, iterative closest point (ICP) (Besl and McKay Citation1992) is the most extensively used point cloud registration approach. ICP heuristically chooses the closest point in Euclidean space as a correspondence; then, a rigid transformation is fitted by using these correspondences. Thus, ICP searches for local optimum of initial transformation by alternating between finding the correspondences and computing the best transformation given these correspondences. Many variants, such as point-to-plane, plane-to-plane and normal, are proposed to improve one or more constraints of ICP. ICP is still sensitive to partial overlaps, and ICP will almost always fail in 3D scan sequences with partial overlaps. Many methods introduce robust transformation estimation technique to improve the robustness of ICP, such as Trimmed ICP (Chetverikov, Stepanov, and Krsek Citation2005), and Go-ICP (Yang, Li et al. Citation2016). ICP and its variant high relies on the initial transformation parameter.
The 4-points Congruent Set (4PCS) (Aiger, Mitra, and Cohen-Or Citation2008) is another representative work for point cloud registration. 4PCS determine the corresponding four-point base sets by exploiting the rule of intersection ratios instead of feature descriptor calculation and matching. 4PCS increases the correspondences set requirement to four points, resulting in increased robustness to noise. 4PCS’s variants have been proposed to improve performance of the algorithm. For example, Super 4PCS (Mellado, Aiger, and Mitra Citation2014) improved efficient of original 4PCS by applying a splitting and indexing strategy using a 3D grid. However, both the 4PCS and Super4PCS can result in wrong alignments for outdoor dataset. Keypoint 4PCS (K-4PCS) (Theiler, Wegner, and Schindler Citation2014) extracts keypoints as input candidates for creating and finding corresponding congruent sets. When Super4PCS is used for scenes with repeated structures or symmetrical structures such as buildings, it is easy to encounter registration misalignment, leading to low registration success rates.
3. The proposed methody
In this section, we present a registration algorithm that utilizes a successive scheme consisting of three components: correspondences generation, graph matching, and hierarchical refinement. This approach can help to improve the accuracy and robustness of the registration process, and has been shown to be effective in experiment of point cloud registration.
3.1. Registration framework
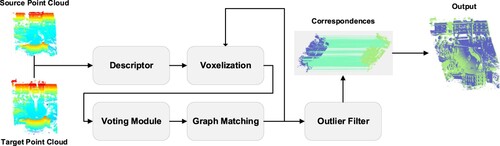
Our method aims to align two unordered point clouds in a global coordinate reference, without requiring an initial position. provides an overview of our registration framework. The input consists of a pair of point clouds, which are first divided into a set of 3D grids. A voting method generates putative correspondences by measuring the similarity between two 3D grids. Next, a graph matching process hierarchically refines the corresponding grids until two fragments are expressed as point-to-point correspondences. Finally, the transformation parameters is calculated using a random sample strategy for correspondence selection.
Figure 2. Workflow of the GGR.
3.2. Grid-based correspondences
To achieve robust correspondences in point clouds, we introduce a grid-based correspondence detection method that involves two primary steps: 3D grid generation and voting strategy. The aim of these methods is to establish a similarity measure capable of identifying corresponding grids when supplied with point cloud as input. By segmenting the point clouds into a series of 3D grids and utilizing a voting mechanism to create potential correspondences.
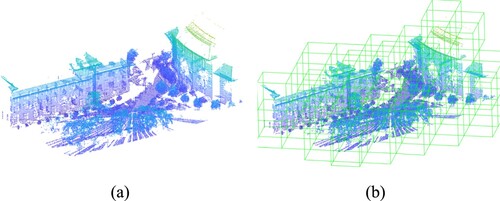
3D grid generation. In order to represent the point cloud, we generate a set of 3D grids, each containing several 3D points as illustrated in . The point cloud serves as input for this grid generation process.
Figure 3. Point cloud voxelization. (a) Initial point cloud. (b) Point cloud voxels.
Given point clouds , and
, where
,
,
and
are the numbers of points in
and
respectively. Given the voxel grid size
, we adopt the same interval
to generate square 3D grids. The grids of
and
are denoted as
and
. Meanwhile, each point with high dimensional feature vector is assigned to a unique label. Any corresponding points in two grids can be mapped into the two grids.
It should be noted that the size of the grid, , has a direct impact on the number of points contained within a grid. When a grid contains only one point, it is no longer subdivided, making that point the smallest 3D grid. As such, point cloud voxelization process begins with the initial point cloud and proceeds until the number of 3D points in each grid falls below a predetermined threshold.
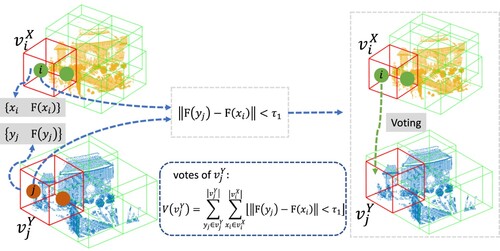
Voting strategy. Due to the spatial homogeneity of 3D data, corresponding points are highly likely to belong to the inliers of a grid pair. To take advantage of this fact and find the most reliable consensus between two scans, we utilize a voting method. This approach can help to identify putative correspondences that are robust to noise and other sources of error.
We propose a voting method where the votes are determined by retrieving closest points in a feature space. The grid is represented as a community, each point
is represented as voter, and the grid
is represented as a ballot box. We use the Fast Point Feature Histogram (FPFH) algorithm to obtain the feature descriptors of the point cloud. We have chosen this feature because it can be computed in a fraction of a millisecond and provides good matching accuracy across a broad range of datasets. For example, if the FPFH features of
and
are the nearest neighbors in feature space, then
contributes a vote to
, increasing its vote count by one, as the shown in .
represents the feature descriptor of point
,
represents the feature descriptor of point
. This voting strategy is better because multiple candidate correspondences can be considered. Therefore, in addition to the nearest point in the feature space, secondary neighboring points whose distance is less than the threshold are also selected for voting. The vote count is as follows:
(1)
(1) Where,
represents the Iverson bracket and
denotes a distance threshold, and
represents the number of votes obtained by grid
. After all the votes have been cast, the maximum number of votes received, represented by
, corresponds to the grid
.
Figure 4. A diagram of matching strategy. The green point represents a 3D point within grid , whereas the red point denotes a 3D point within grid
.
In real-world scenarios, feature descriptions may not be robust enough, leading to the selection of promising correspondences that are actually mismatches. To address this issue, GGR focuses on selecting promising correspondences to improve the accuracy of the point cloud registration process. To ensure the correct corresponding grid is extracted, we track candidate correspondences in addition to the list of candidates. While retrieving the grid with the most similar object is a common method for correspondence extraction, we explore some potentially correct correspondences in this paper. When the number of votes exceeds the threshold, we consider correspondence of to be valid if
. We additionally track two candidate correspondences in this paper, resulting in one-to-many putative correspondences, as shown in . Matching result is tackled by solving a binary matching matrix
, where
, i.e.
(2)
(2)
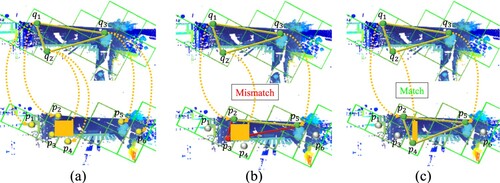
Figure 5. Two point cloud pairs matching process by increasing putative correspondence. (a) The grids with the maximal vote are taken to as a candidate correspondence. (b) We additionally track 2 candidate correspondences.
Although correspondence extraction is still based on 3D points, correspondences are represented as corresponding grids. By generating each point from a 3D grid and representing it as a grid in its own right, it becomes easier to combine cues from the grid during the point cloud registration process. The use of corresponding grids also helps to reduce computational complexity when searching for consistent correspondences, as the number of possible correspondences is effectively reduced.
It is worth noting that enlarging the putative correspondences can increase the indeterminacy of matching, which runs counter to the assumption that maximum similarity is the most promising correspondence. In order to reject mismatch from uncertain correspondences, we construct a graph to implicitly verify the spatial geometry between corresponding points. With the abuse of notation, we use to denote the
corresponds to
and we also use
to denote the map. As shown in (b),
but
,
,
are the candidate of
.
3.3. Spatial consistency-based grid matching
To enhance the reliability of selected grid correspondences, we have developed a graph matching method that adaptively refines voting. The aim of this approach is to refine correspondences and identify reliable corresponding grids based on input corresponding grid .
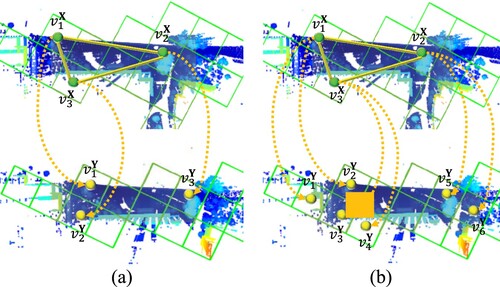
Problem formulation. The high-order similarity of grids is established through graph matching. The spatial structure similarity is an intuitive feature of promising correspondences. The grid generates canonical ‘meeting points’ from the center of the grids to verify the spatial consistency of corresponding grids. Two sets of centers, ,
, where
and
, are used to obtain correspondences
via a vote method. Correspondences with spatial consistency are returned when the Euclidean distance between
equals that of
. In ideal circumstances, if the lengths are not equal, there must be at least one false match in
, as shown in .
Figure 6. An example for computing the 3D grid reliability metric. Yellow dashed lines represent correspondence. (a) Three 3D grid and their candidates. (b) When they are mismatched, the topologies around them will make a difference. (c) Spatial consistent corresponding grids. This brief explanation is an example to interpret the method can be applied to many discrete point.
and
can be represented as two undirected graphs,
and
, where
represents a set of discrete points,
represents undirected edges, and
represents attributes. Node
is associated with an attribute
, while the associated attribute of edge
is the spatial distance between
and
. Therefore, we propose an algorithm to help find correspondences with similar spatial geometry from putative correspondences. The mutual similarity of correspondences is measured by
, which is defined as the mutual similarity score. In the case of grid, the mutual similarity
can be defined as follows:
(3)
(3)
Subject to ,
,
. Here,
represents the similarity of
, while
represents the similarity of Euclidean distance
and
. In this paper, we utilize a continuous relaxation optimization strategy to predict
. We consider any spatially consistent grid as a promising correspondence which will be inputted into the refinement process.
Affinity graph with candidate matches. The graph matching process between and
can be represented as a ranking within the association graph
. The attribute
is encoded into the affinity matrix
, which is utilized for calculating the graph matching. The affinity matrix element
, denoting the affinity of
, measures the mutual consistency of
.
is as defined as follows:
(4)
(4) Where
,
,
. Non-diagonal element
is pairwise similarity between
and
. The diagonal term
denotes the unary similarity of a correspondence. The column-wise vectorized replica of
, represented as
, is used in graph matching to seek the optimal solution
that maximizes the similarity function, which can be expressed as follows:
(5)
(5)
Whereas the constraints pertain to the one-to-one correspondence linking and
, the graph matching approach relaxes
to
. The score between
and
is represented by
, which is known as the soft matching matrix
.
We propose a method called additional conflicting walk prevention (ACWP) to construct the edges of the affinity graph. The aim of ACWP is to create a more concise version of by retaining important connections and removing connections from incompatible nodes. This same approach is also presented in Li et al. (Citation2020). Specifically, when a random walker is on node
, it is not allowed to move to nodes
and
in order to prevent conflicting walks. However, this self-loop rejection approach does not sufficiently address situations where a node is explicitly matched with candidates. For example, if
and
are matched with
and
, respectively, self-loop rejection would still preserve the outgoing edges of distorted nodes like
and
. In reality, the outgoing edges of
should be eliminated because
and
are incompatible. ACWP works by removing conflicting elements from the affinity matrix
. If
does not correspond to
, or if
and
do not represent a 3D point correspondence, then
is set to 0.
In order to select reliable nodes in , we use Random Walk to determine the ranking of nodes. We obtain an approximate solution through a continuous relaxation optimization strategy similar to the one used by Cho, Lee, and Lee (Citation2010).
Random walk. A typical approach to solving Eq. (5) is through a random walk on an association graph. The process involves starting from any node and selecting one of the outgoing edges based on the translation kernel of the affinity graph. The maximum degree, denoted as where
represents the infinite norm of the matrix, is defined. We then formulate the transition matrix
as follows.
(6)
(6) Where
is the
sub-stochastic matrix,
is an
all-one vector. The random walk includes a set of transient nodes
. For ranking on the absorbing Markov chain, define the conditional distribution
as:
(7)
(7)
If ,
is a quasi-stationary distribution of the Markov chain. Random walker traverses an edge with probability
or jumps to some constrained nodes with probability
.
(8)
(8)
Eq. (8) represents a dynamic Markov chain with a jump distribution that varies dynamically. The reweighting function, denoted by , incorporates inflation and bistochastic normalization techniques (Cho, Lee, and Lee Citation2010). The quasi-stationary distribution of Eq. (5) is computed using the power iteration method. The discretization algorithm (Munkres Citation1957) is then employed to obtain one-to-one correspondences. The experiments demonstrate that graph matching is a stable and effective approach for selecting reliable correspondences.
Table
3.4. Hierarchical matching
Any spatially consistent grid is considered a promising correspondence, but the corresponding grids may be too coarse to estimate precise transformation parameters. Therefore, we propose a hierarchical matching module to refine the rough correspondences. We input the grid graph matching result into the hierarchical matching module to generate corresponding points, as shown in . A simple way to alleviate the coarseness of the consensus is to aggregate nearby grids and refine them hierarchically, as shown in . The initial grid is subdivided into sub-grids, and these sub-grids will undergo an alternating process of corresponding grid extraction and subdivision until the number of points in the grid is below a certain threshold.
Figure 7. An example to show that the matching result of GGR. Green lines represent correct correspondence and red lines represent mismatches. (a) Grid correspondence. (b) Refinement result.
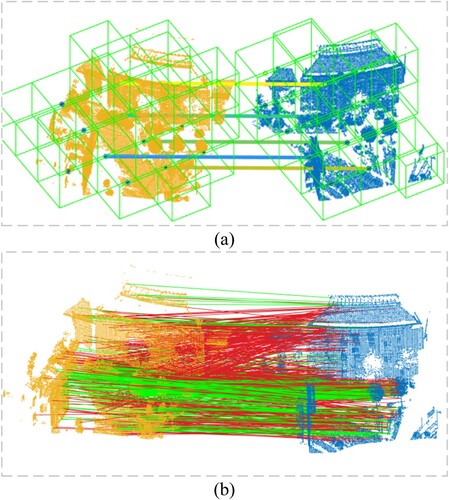
Figure 8. Nearby grids aggregation and sub-grid generation. (a) Red grid represents , green grids represent neighborhoods of
. (b) Red grid represents point cloud
, green grids represent sub-grids.
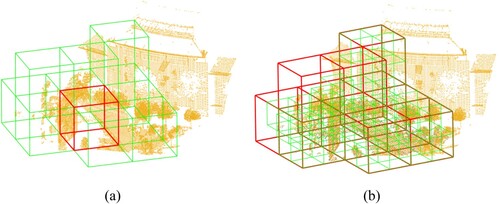
The corresponding grids may not completely overlap. To eliminate outliers caused by low overlap, the input of refinement aggregates nearby grids. The neighborhoods of
and
are grouped to form
. The points in
and
follow the process outlined in Algorithm 1. This approach produces point-to-point correspondences if the voxel has fewer points than the threshold, as the corresponding points are generated using each point as a grid in the final step. The hierarchical matching process is illustrated in Algorithm 2.
Table
3.5. Registration module
The extraction of correspondences has been constrained by geometric structure. To do so, a 3-point sample is generated through random sampling, and we retrieve the optimal rotation and translation parameters that minimize the 3-point geometric error outlined in EquationEq. (9(9)
(9) ).
(9)
(9) Where,
and
represent the coordinates of the 3-point sample. We calculate
and
using the Procrustes method (Gower Citation1975), a closed-form solution for rigid transformation in SE(3). The method processes all samples and clusters those correspondences that satisfy Eq. (3).
(10)
(10)
Where, represents the Iverson bracket and
denotes an inlier threshold. The group with a greater number of inliers is assumed to be the correct correspondences. Therefore, correspondences with a higher number of inliers are chosen for the final correspondences
.
We recompute the transformation matrix using all the surviving inliers . The correspondences are used to calculate the transformation
,
between by minimizing.
(11)
(11)
4. Experiments
The goal of this section is to: (1) define the evaluation metrics used in all experiments; (2) quantitatively evaluate the robustness of our method; and (3) analyze GGR in pairwise registration tasks on the WHU-TLS dataset, ETH dataset (Pomerleau et al. Citation2012) and iQmulus dataset (Vallet et al. Citation2015). In pairwise registration, we adhere to the same evaluation protocols as outlined in (Choy, Park, and Koltun Citation2019).
4.1. Evaluation metrics
To ensure a fair comparison, we adhere to the evaluation metrics of FCGF and report the following: (1) Feature Matching Recall (FMR), (2) Rotation Error (RE) and Translate Error (TE), and (3) Registration Recall (RR). Mathematically, FMR is defined as:
(12)
(12)
represents a set of correspondences between a pair of point clouds,
and
are 3D coordinates from the fragments, and
is the ground-truth pose.
and
are the inlier distance thresholds; and
is an operator that returns 1 if the input predicate is satisfied and 0 otherwise. The Rotation Error (RE) and Translation Error (TE) are used:
(13)
(13) Where
and
represent the true rotation and translation values, respectively. Additionally, we report the intermediate registration recall obtained with the pose estimation
. For fragment pairs
with at least a 30% overlap, registration is deemed correct if
and
. RR is a metric that assesses the percentage of pairs that correctly match the pose. As several studies have indicated, RR holds greater significance than precision because enhanced pruning can enhance precision.
4.2. Sensitivity of grid configuration
The 3D grid takes two parameters: grid size and orientation. We quantitatively evaluate the robustness of our method by testing it with different sizes and orientations. For accuracy consideration, we utilized varying voxel grid sizes for WUH-TLS dataset in subsequent calculation and analysis. In this experiment, all settings remained consistent except for the voxel size, which varied from 15 to 30 in intervals of 5. We set ,
, and
. The experimental results are illustrated in .
Figure 9. Rotation error and translation error of different grid size.
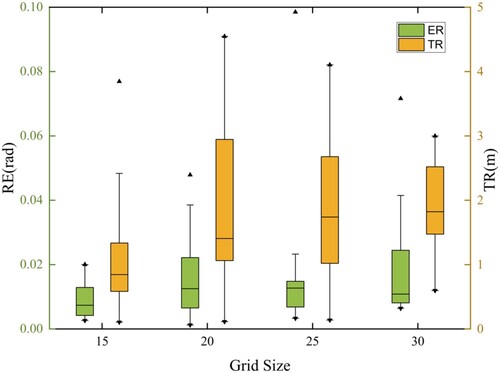
displays the evaluation of GGR's rotation error, translation error, and registration recall at each . All rotation and translation errors fall below 0.06 rad and 5 m, respectively. The lowest rotation and translation errors occur at
, while the registration recall is the highest. This effect is more pronounced when more correspondences require verification. In other words, building a graph model with a smaller grid yields better results. However, smaller
values may cause memory usage to exceed area limits. Accordingly, in the subsequent experiments, we set the value of
to 15. This value is approximately equal to 1/30th of the length of the longer side of the bounding box of the point cloud.
In practice, GGR does not require any assumptions about the initial position of the point cloud. Therefore, we analyze GGR's sensitivity to grid orientation. We adjust the grid's orientation by transforming the raw point cloud using various transformations that consider the characteristics of the TLS point cloud (following Cai et al. Citation2019). The second point cloud is displaced relative to the first one by a 4DOF transformation (3D translation and rotation around the vertical axis). Three types of transformation noise are generated, and we compare GGR's performance with RANSAC, RANSACo (a variant of RANSAC provided by the Open3D library), and TEASER. The results are illustrated in .
M1: The second point cloud is displaced relative to the first one by randomly generating a 4DOF transformation.
M2: The second point cloud is translated by adding random small constants to the x and y axes, respectively, and a random small constant rotation around the vertical axis.
M3: The second point cloud is transformed according to a ground-truth transformation.
Figure 10. Performance of orientation experiment of algorithms. (a) Rotation performance; (b) Translation performance.
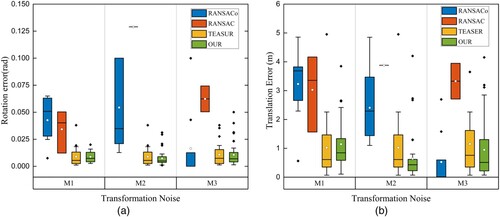
As shown in , the performance of RANSAC and RANSACo was erratic compared to that of TEASER and GGR at all three noise levels. In contrast, the performance of TEASER and GGR was more stable. Our method achieved greater accuracy, with a rotation error of about 0.01 rad under all three types of noise, and a translation error of less than 3 m.
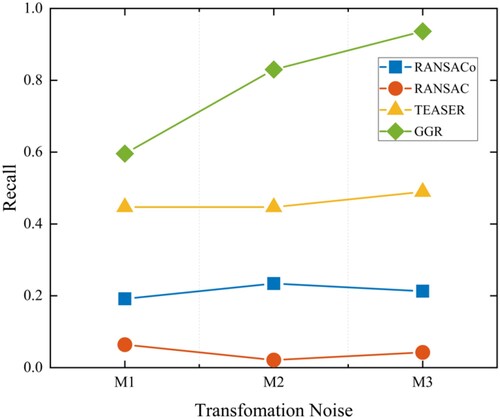
shows the registration recall of the different methods. RANSACo, RANSAC, and TEASER showed slight fluctuations in performance at the three noise levels due to the invariance of their descriptors, which makes them insensitive to the orientation of the point cloud. However, in M1, the registration recall in RANSACo, RANSAC, and TEASER was lower (at 19%, 6%, and 44%, respectively) than in GGR, which achieved a recall of 60%. As shown in , there is an increasing trend in GGR's recall, with higher recall in M2 and M3. A better initial location makes the corresponding grids more comparable, improving GGR's registration recall. However, despite being sensitive to grid orientation, GGR does not require an accurate initial location estimation to operate effectively. Overall, GGR outperforms other techniques in terms of registration recall, while our technique performs well in both registration recall and registration accuracy on a real-world dataset.
Figure 11. Registration recall comparison.
4.3. Evaluation on real outdoor data: WHU-TLS
The WHU-TLS dataset, which comprises LIDAR scans, is utilized to assess the effectiveness of our GGR in typical outdoor scenes. The obtained results from registering the WHU-TLS dataset are presented in this section. Real-world scenarios are used to showcase the benefits of GGR, with registration accuracy being measured by the deviation between estimated and ground-truth values. To demonstrate the superiority of our approach, we compared GGR against various state-of-the-art methods. We employed a voxel-based subsampling operation with a voxel size of 0.8 for the dataset. In order to ensure fairness in comparison, all methods used the same FPFH descriptor provided by MATLAB to extract correspondences. shows the registration outcomes for all analyzed methods.
Table 1. Against the state-of-the-art registration methods on WUH-TLS.
Pairwise registration: we selected feature-based registration methods such as RANSAC (Martin and Robert Citation1981), RANSACo (Zhou, Park, and Koltun Citation2018), FGR (Zhou, Park, and Koltun Citation2016), TEASER (Yang, Jingnan, and Carlone Citation2021), and ANN (Marius and Lowe Citation2009) for comparison. RANSAC was used to estimate 6DOF pose by employing 3-point samples, with a probability of finding a valid sample set set to 0.99. presents the registration evaluation metrics of all six algorithms.
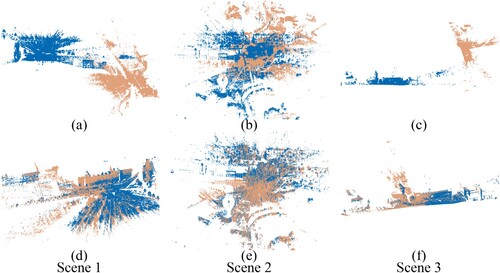
Based on the quantitative evaluation results, RANSAC exhibited poorer registration performance with a registration recall of only 6.4%, rotation error exceeding 0.03 rad, and translation error surpassing 4 m. However, the variant provided by the OPNE3D Library (Zhou, Park, and Koltun Citation2018) achieved better results compared to the original RANSAC method. FGR also displayed a tendency to fail in the dataset, especially with data having rotation errors greater than 0.03 rad and translations errors over 3 m. Among the evaluated methods, TEASER demonstrated overall higher alignment accuracy than RANSAC, FGR, and ANN. Nevertheless, through experimentation, we discovered that TEASER collapses when handling high correspondence numbers, resulting in a success rate up to 19.2% worse than GGR. Other methods performed poorly due to the absence of optimality guarantees. GGR achieved the highest recall rate and possessed remarkable translation and rotation registration accuracy. It is worth noting that ICP and 4PCS were unable to align the WHU-TLS dataset; hence they were omitted from the experiments. The result of GGR as shown in .
Figure 12. Example visualization of our registration result. (a), (b) and (c) are original datas; (d), (e) and (f) are the registration results.
Correspondence extraction: As mentioned previously, a high outlier rate can cause feature-based methods to fail. We evaluated the performance of our method and other methods using the WHU-TLS dataset. RANSAC, FGR, and TEASER generate initial correspondences by retrieving the closest point in feature space, with an inlier threshold set to 10 m based on experimental results. presents the feature matching outcomes.
Table 2. Comparisons of the FMR (%) of our method against the state-of-the-art methods.
We numerically demonstrated the registration versus high outlier dilemma in prior works. Our grid-graph matching strategy achieved the highest FMR. When the outlier rate exceeded 98%, RANSAC struggled to complete the registration task within the allotted iterations. Despite having a greater FMR than TEASER, ANN's registration accuracy is still inferior to that of TEASER. As shown in , the mean FMR of our method reached 12.6%, while that of TEASER was only 2.5%. RANSAC and FGR performed poorly under extreme outlier rates. Our grid-graph matching strategy achieved high registration recall by increasing the FMR.
As demonstrated in , registration methods that rely on outlier rejection can fail under high outlier rates. In contrast, the grid-graph matching technique can reliably extract corresponding points to achieve accurate registration. As mentioned before, there is no clear difference between the matching method and the outlier filter. The removal of outliers is a factor in the robustness of the matching method.
Performance on ETH dataset and iQmulus dataset: To evaluate the generalizability of GGR to datasets with varying scales, we conducted evaluations on both the ETH dataset and iQmulus dataset. The ETH dataset was captured using a ground-based LiDAR scanner, while the iQmulus dataset was obtained from the IQmulus & TerraMobilita Contest using a monofiber Riegl LMS-Q120i LiDAR. The pairwise point cloud for the iQmulus dataset was obtained through simulation. For the ETH dataset, we used a voxel grid size of 3.5 m, whereas for the iQmulus dataset, the voxel grid size was set to 10 m. The translation and rotation errors are presented in .
Table 3. Against the state-of-the-art registration methods on WUH-TLS.
presents the performance comparison of GGR, FGR, and TEASER on both the ETH dataset and iQmulus dataset. Experiments indicate that GGR outperforms FGR and TEASER on the ETH dataset, with significant improvements in both rotation and translation errors. On the other hand, TEASER slightly outperforms GGR on the iQmulus dataset, demonstrating better registration performance with a modest increase of 0.001 m in translation error, while rotations errors are equally matched between the two methods. Nevertheless, despite the slight advantage of TEASER over GGR on the iQmulus dataset, the latter method's effectiveness is still demonstrated by its exceptional performance on the ETH dataset.
5. Conclusion
In this article, we present a certifiable feature-based point cloud registration algorithm that can handle extreme outlier rates. Our experiments demonstrate that the grid-graph matching technique reliably extracts corresponding points, achieving accurate registration. Additionally, we propose a more adaptable method that directly enhances matching to increase the number of inliers and reduce failures caused by high outlier rates. We also evaluate GGR's performance on benchmarks and show that it outperforms state-of-the-art methods, such as RANSAC and TEASER, while remaining robust against underperforming descriptors. Our experiments suggest that optimizing the matching strategy can improve registration results when dealing with outdoor TLS point clouds with outlier rates below 2.0%. However, since GGR's voting strategy module is sensitive to the spatial transformation of the point cloud, future work should focus on exploring grid similarity calculation methods that are insensitive to spatial transformations. This will further enhance the method's practicality.
Disclosure statement
No potential conflict of interest was reported by the author(s).
Data availability statement
The data that support the findings of this study are openly available at http://doi.org/10.1016/j.isprsjprs.2020.03.013.
References
- Aiger, D., N. J. Mitra, and D. Cohen-Or. 2008. “4-points Congruent Sets for Robust Pairwise Surface Registration.” ACM Transactions on Graphics 27 (3): 1. https://doi.org/10.1145/1360612.1360684.
- Bai, X., Z. Luo, L. Zhou, H. Chen, L. Li, Z. Hu, H. Fu, and C.-L. Tai. 2021. “PointDSC: Robust Point Cloud Registration Using Deep Spatial Consistency.” Paper presented at the Proceedings of the IEEE Conference Computer Vision and Pattern Recognition, June, 15854–15864, 15859–15869. https://doi.org/10.1109/CVPR46437.2021.01560.
- Besl, P. J., and N. D. McKay. 1992. “A Method for Registration of 3-D Shapes.” IEEE Transactions on Pattern Analysis and Machine Intelligence 14 (2): 239–256. https://doi.org/10.1109/34.121791.
- Bradski, G. 2000. “The OpenCV Library.” Dr. Dobb’s Journal of Software Tools. https://docs.opencv.org/4.7.0/.
- Cai, Z., T. J. Chin, A. P. Bustos, and K. Schindler. 2019. “Practical Optimal Registration of Terrestrial LiDAR Scan Pairs.” ISPRS Journal of Photogrammetry and Remote Sensing 147: 118–131. https://doi.org/10.1016/j.isprsjprs.2018.11.016.
- Chetverikov, D., D. Stepanov, and P. Krsek. 2005. “Robust Euclidean Alignment of 3D Point Sets: The Trimmed Iterative Closest Point Algorithm.” Image and Vision Computing 23 (3): 299–309. https://doi.org/10.1016/j.imavis.2004.05.007.
- Cho, M., J. Lee, and K. M. Lee. 2010. “Lecture Notes in Computer Science” Paper presented at the European Conference on Computer Vision, 492–505. https://doi.org/10.1007/978-3-642-15555-0_36.
- Choy, C., W. Dong, and V. Koltun. 2020. “Deep Global Registration.” Paper presented at the Proceedings of the IEEE Conference Computer Vision and Pattern Recognition, August 5, 2511–2520. https://doi.org/10.1109/CVPR42600.2020.00259.
- Choy, C., J. Park, and V. Koltun. 2019. “Fully Convolutional Geometric Features.” Paper presented at the Proceedings of the IEEE/CVF International Conference on Computer Vision, 8957–8965. https://doi.org/10.1109/ICCV.2019.00905.
- Deng, H., T. Birdal, and S. Ilic. 2018. “PPFNet: Global Context Aware Local Features for Robust 3D Point Matching.” Paper presented at the Proceedings of the IEEE Conference Computer Vision and Pattern Recognition, December 16, 195–205. https://doi.org/10.1109/CVPR.2018.00028.
- Dong, Z., F. Liang, B. Yang, Y. Xu, and U. Stilla. 2020. “Registration of Large-Scale Terrestrial Laser Scanner Point Clouds: A Review and Benchmark.” ISPRS Journal of Photogrammetry and Remote Sensing 163: 327–342. https://doi.org/10.1016/j.isprsjprs.2020.03.013.
- Dong, Z., B. Yang, P. Hu, and S. Scherer. 2018. “An Efficient Global Energy Optimization Approach for Robust 3D Plane Segmentation of Point Clouds.” ISPRS Journal of Photogrammetry and Remote Sensing 137: 112–133. https://doi.org/10.1016/j.isprsjprs.2018.01.013.
- Enqvist, O., K. Josephson, and F. Kahl. 2009. “Optimal Correspondences from Pairwise Constraints.” Paper presented at the 2009 IEEE 12th International Conference on Computer Vision, 1295–1302. https://doi.org/10.1109/ICCV.2009.5459319.
- Fredriksson, J., V. Larsson, C. Olsson, and F. Kahl. 2016. “Optimal Relative Pose with Unknown Correspondences.” Paper presented at the Proceedings of the IEEE Conference Computer Vision and Pattern Recognition, June 27–30,1728–1736. https://doi.org/10.1109/CVPR.2016.191.
- Gower, J. C. 1975. “Generalized Procrustes Analysis.” Psychometrika 40 (1): 33–51. https://doi.org/10.1007/BF02291478.
- Johnson, A., and M. Hebert. 1999. “Using Spin Images for Efficient Object Recognition in Cluttered 3D Scenes.” IEEE Transactions on Pattern Analysis and Machine Intelligence 21 (5): 433–449. https://doi.org/10.1109/34.765655.
- Khoshelham, K., C. Nardinocchi, E. Frontoni, A. Mancini, and P. Zingaretti. 2010. “Performance Evaluation of Automated Approaches to Building Detection in Multi-Source Aerial Data.” ISPRS Journal of Photogrammetry and Remote Sensing 65 (1): 123–133. https://doi.org/10.1016/j.isprsjprs.2009.09.005.
- Lee, J., S. Kim, M. Cho, and J. Park. 2021. “Deep Hough Voting for Robust Global Registration.” Paper presented at the Proceedings of the IEEE/CVF International Conference on Computer Vision, October, 15974–15983, 15994–16003. https://doi.org/10.1109/ICCV48922.2021.01569.
- Li, J., Q. Hu, and M. Ai. 2021. “Point Cloud Registration Based on One-Point RANSAC and Scale-Annealing Biweight Estimation.” IEEE Transactions on Geoscience and Remote Sensing 59 (11): 9716–9729. https://doi.org/10.1109/TGRS.2020.3045456.
- Li, J., P. Zhao, Q. Hu, and M. Ai. 2020. “Robust Point Cloud Registration Based on Topological Graph and Cauchy Weighted lq-norm.” ISPRS Journal of Photogrammetry and Remote Sensing 160: 244–259. https://doi.org/10.1016/j.isprsjprs.2019.12.008.
- Lowe, D. G. 2004. “Distinctive Image Features from Scale-Invariant Keypoints.” International Journal of Computer Vision 60: 91–110. https://doi.org/10.1023/B:VISI.0000029664.99615.94.
- Marius, M., and D. G. Lowe. 2009. “Fast Approximate Nearest Neighbors with Automatic Algorithm Configuration.” Paper presented at the Proceedings of the Fourth International Conference on Computer Vision Theory and Applications, 331–40.
- Martin, F., and B. Robert. 1981. “Random Sample Consensus.” Communications of the ACM 24 (6): 381–395. https://doi.org/10.1145/358669.358692.
- Mellado, N., D. Aiger, and N. J. Mitra. 2014. “Super 4PCS Fast Global Pointcloud Registration via Smart Indexing.” Computer Graphics Forum 33 (5): 205–215. https://doi.org/10.1111/cgf.12446.
- Montuori, A., G. Luzi, S. Stramondo, G. Casula, C. Bignami, E. Bonali, M. G. Bianchi, and M. Crosetto. 2014. “Combined use of Ground-Based Systems for Cultural Heritage Conservation Monitoring.” Paper presented at the IEEE International Geoscience and Remote Sensing Symposium, 4086–4089. https://doi.org/10.1109/IGARSS.2014.6947384.
- Munkres, J. 1957. “Algorithms for the Assignment and Transportation Problems.” Journal of the Society for Industrial and Applied Mathematics 5 (1): 32–38. https://doi.org/10.1137/0105003.
- Pais, G. D., P. Miraldo, S. Ramalingam, V. M. Govindu, J. C. Nascimento, and R. Chellappa. 2020. “3DRegNet: A Deep Neural Network for 3D Point Registration.” Paper presented at the Proceedings of the IEEE Conference Computer Vision and Pattern Recognition, August 5, 7191–7201. https://doi.org/10.1109/CVPR42600.2020.00722.
- Pomerleau, F., M. Liu, F. Colas, and R. Siegwart. 2012. “Challenging Data Sets for Point Cloud Registration Algorithms.” The International Journal of Robotics Research 31 (14): 1705–1711. https://doi.org/10.1177/0278364912458814.
- Rusu, R. B., N. Blodow, and M. Beetz. 2009. “Fast Point Feature Histograms (FPFH) for 3D Registration” Paper presented at the 2009 IEEE International Conference on Robotics and Automation, May, 3212–3217, 1050–4729. https://doi.org/10.1109/ROBOT.2009.5152473.
- Salti, S., F. Tombari, and L. D. Stefano. 2014. “SHOT: Unique Signatures of Histograms for Surface and Texture Description.” Computer Vision and Image Understanding 125: 251–264. https://doi.org/10.1016/j.cviu.2014.04.011.
- Theiler, P. W., J. D. Wegner, and K. Schindler. 2014. “Keypoint-based 4-Points Congruent Sets – Automated Marker-Less Registration of Laser Scans.” ISPRS Journal of Photogrammetry and Remote Sensing 96: 149–163. https://doi.org/10.1016/j.isprsjprs.2014.06.015.
- Vallet, B., M. Bredif, A. Serna, B. Marcotegui, and N. Paparoditis. 2015. “TerraMobilita/IQmulus Urban Point Cloud Analysis Benchmark.” Computers & Graphics 49: 126–133. https://doi.org/10.1016/j.cag.2015.03.004.
- Xiao, J., J. Zhang, B. Adler, H. Zhang, and J. Zhang. 2013. “Three-dimensional Point Cloud Plane Segmentation in Both Structured and Unstructured Environments.” Robotics and Autonomous Systems 61 (12): 1641–1652. https://doi.org/10.1016/j.robot.2013.07.001.
- Xu, Y., R. Boerner, W. Yao, L. Hoegner, and U. Stilla. 2017. “Automated Coarse Registration of Point Clouds in 3D Urban Scenesusing Voxel Based Plane Constraint.” ISPRS Annals of the Photogrammetry, Remote Sensing and Spatial Information Sciences IV-2/W4: 185. https://doi.org/10.5194/isprs-annals-IV-2-W4-185-2017.
- Xu, Y., R. Boerner, W. Yao, L. Hoegner, and U. Stilla. 2019. “Pairwise Coarse Registration of Point Clouds in Urban Scenes Using Voxel-Based 4-Planes Congruent Sets.” ISPRS Journal of Photogrammetry and Remote Sensing 151: 106–123. https://doi.org/10.1016/j.isprsjprs.2019.02.015.
- Yang, B., Z. Dong, F. Liang, and Y. Liu. 2016. “Automatic Registration of Large-Scale Urban Scene Point Clouds Based on Semantic Feature Points.” ISPRS Journal of Photogrammetry and Remote Sensing 113: 43–58. https://doi.org/10.1016/j.isprsjprs.2015.12.005.
- Yang, H., S. Jingnan, and L. Carlone. 2021. “Teaser: Fast and Certifiable Point Cloud Registration.” IEEE Transactions on Robotics 37 (2): 314–333. https://doi.org/10.1109/TRO.2020.3033695.
- Yang, J., H. Li, D. Campbell, and Y. Jia. 2016. “Go-ICP: A Globally Optimal Solution to 3D ICP Point-set Registration.” IEEE Transactions on Pattern Analysis and Machine Intelligence 38 (11): 2241–2254. https://doi.org/10.1109/TPAMI.2015.2513405.
- Zeng, A., S. Song, M. Nießner, F. Matthew, and J. Xiao. 2017. “3DMatch: Learning the Matching of Local 3D Geometry in Range Scans.” Paper presented at the Proceedings of the IEEE Conference Computer Vision and Pattern Recognition. https://doi.org/10.48550/arXiv.1603.08182.
- Zhou, Q., J. Park, and V. Koltun. 2016. “Lecture Notes in Computer Science” Paper presented at the European Conference on Computer Vision, 766–782. https://doi.org/10.1007/978-3-319-46475-6_47.
- Zhou, Q., J. Park, and V. Koltun. 2018. “Open3D: A Modern Library for 3D Data Processing.” USA: Cornell University. Accessed 13 February 2023. http://www.open3d.org/.