
 ?Mathematical formulae have been encoded as MathML and are displayed in this HTML version using MathJax in order to improve their display. Uncheck the box to turn MathJax off. This feature requires Javascript. Click on a formula to zoom.
ABSTRACT
Holographic projection technology can provide a more intuitive and efficient visualization effect for a digital twin bridge construction scene. However, pre-rendering methods in the existing research work are usually used to implement holographic visualization, which is static display. The above-mentioned methods for static display have many shortcomings, such as poor adaptability, low rendering efficiency and lack of real-time. A dynamic holographic modelling approach is proposed for the augmented visualization of digital twin scenes for bridge construction. Firstly, a dynamic segmentation algorithm with adaptive screen size was designed to high-efficiently generate holographic scenes. Secondly, a motion blur control method was designed to improve the rendering efficiency of holographic scenes according to human visual characteristics. Finally, a prototype system was developed, and the corresponding experimental analysis was completed. The experimental results show that the method proposed in this article can support adaptive screen size image segmentation and real-time generation of holographic scenes for bridge construction. The amount of scene data can be reduced to more than 30%, which significantly improves rendering efficiency and reduces glare.
1 Introduction
With the development of science and technology in the field of engineering, bridge engineering faces new opportunities for innovation. The innovation and application of intelligent and informational technology are one of the important directions for the development of bridge engineering (Ning et al. Citation2006; Jiang et al. Citation2012; Le and Andrews Citation2016; Tokody, Holicza, and Schuster Citation2016; Tokody and Flammini Citation2017; Zhou and Zhang Citation2019; Huang et al. Citation2020). Digital twin is an important method to realize the intellectualization of bridge engineering (Dang et al. Citation2018; Ye et al. Citation2019; Jones et al. Citation2020; Zhu et al. Citation2021). A digital twin is a digital replica of physical objects (processes, systems, assets, etc.). It is composed of real space, virtual space, and connected data or information that links real and virtual space. It aims to realize a seamless connection between a physical system and its corresponding virtual system throughout its lifecycle (Shim et al. Citation2019; Fuller et al. Citation2020; Liu et al. Citation2021a; Liu et al. Citation2021c; Leng et al. Citation2021a; Leng et al. Citation2021b; Sepasgozar Citation2021). Since it was proposed, the digital twin has been applied in many fields, such as aerospace, transportation, infrastructure, management, etc. (Marai, Taleb, and Song Citation2021; Ma et al. Citation2020; Liu et al. Citation2021b; Phanden, Sharma, and Dubey Citation2021; Martínez-Gutiérrez et al. Citation2021; Rudskoy, Ilin, and Prokhorov Citation2021). Most existing research on digital twins are mainly about engineering applications and system design (Leng et al. Citation2020; Leng et al. Citation2021c; Leng et al. Citation2022), which less research on the application of visual display. However, realistic and reliable visualization can provide a clear and intuitive information representation for digital twin (Fan et al. Citation2021; Li et al. Citation2021a; Li et al. Citation2021b; Botín-Sanabria et al. Citation2022; Michalkova, Machova, and Carter Citation2022; Li et al. Citation2022a).
Existing visualization methods for digital twin scene display include electronic large screen, virtual reality, augmented reality, hybrid reality, etc. (Ke et al. Citation2019; Kuts et al. Citation2019; Havard et al. Citation2019; Qiu et al. Citation2019; Zhu, Liu, and Xu Citation2019). These methods have greatly enriched the expression forms of the scene. Holographic projection technology is considered as one of the best 3D visualization methods, because of the virtue of its advantages, such as comprehensively presenting 3D object effects, displaying the content of the screen in an all-round and 3D manner (Javon et al. Citation2014; Bovier et al. Citation2016; Bruckheimer et al. Citation2016; Ciobanu et al. Citation2017; Haleem, Javaid, and Khan Citation2020; Li and Lefevre Citation2020; Zhang et al. Citation2020; Christou et al. Citation2022; Li et al. Citation2022b). Compared with the electronic large screen, it has more realistic visual effect and better visual experience, and compared to XR and other technologies, it allows for convenient observation of multi-angle and all-around 3D scenes with the naked eye(Li et al. Citation2023; Dang et al. Citation2023; Dang et al. Citation2021; Fu et al. Citation2021). This provides a new visual and interactive method for multi-person focused discussions and decision-making (Pedersen et al. Citation2017; Cerezo, Calderón, and Romero Citation2019; Yoo et al. Citation2022). With its unique display effect, holographic projection technology provides a new 3D visualization method for the digital twin (Saddik Citation2018; Shuguang and Lin Citation2020; Gallala et al. Citation2022).
The following are some of the primary holographic 3D display method studies. Yamaguchi and Yoshikawa (Citation2011) investigate computer-generated holograms with full parallax which can be reconstructed with white light. Although a holographic effect is achieved in Yamaguchi's method, only a monochromatic light effect is displayed. Chlipala et al. (Citation2021) proposes a color LED holographic 3D display method to achieve high-resolution holographic 3D displays. However, Chlipala's method only applies to single-frame holographic displays. Guo et al. (Citation2022) propose a full-color holographic display method based on LED metasurfaces to provide a versatile platform for lightweight 3D display and AR/VR applications. Li et al. (Citation2022) designed a 3D display system based on holographic technology with wide viewing angle and large size, and the proposed system breaks through the limitations of narrow viewing angle and small size of holographic 3D display. Although the above study achieved a full-color 3D display, it was poorly adapted because the viewing window was fixed, and the size of the screen determined the imaging effect. Doronin and Barsi (Citation2018) provide a method to evaluate the global luminance level for a particular type of horizontal-parallax light held display, which works well for static synthetic scenes holographic display. Doronin's method has good display effect for static scenes, but it has a low rendering efficiency, which cannot be applied to dynamic scenes. Liu et al. (Citation2021d) proposed an optical-based holographic display method to apply to the construction of digital art museums and digital media art exhibitions, which have a good 3D visualization. Christou et al. (Citation2022) proposed a pseudo-holographic visualization for the presentation of teaching content, and the results show that the visualization method can improve the efficiency of student information reception. However, these methods can only display static content and cannot visualize dynamic objects. In summary, existing research on holographic visualization focuses on the display of static content, and there are problems such as poor adaptability, low rendering efficiency, and lack of real-time, which make it difficult to meet the demand for dynamic information display change for digital twin scenes and accurate and efficient scene descriptions.
In response to the above problems, this article focuses on dynamic holographic scene visualization research, proposing a dynamic holographic modelling method for digital twin scenes in bridge construction. The proposed method solves the problems of poor adaptability, and lack of real-time of capability the existing holographic visualization technology in displaying dynamic scenes. It can support the holographic display of dynamic change information of digital twin scenes, dynamic construction of holographic scenes with adaptive screen size, and efficient rendering of digital twin scene for bridge construction. The remainder of this article is organized as follows. Section 2 provides an overview of the proposed method. Section 2.1 describes the dynamic hologram segmentation algorithm with adaptive screen size. Section 2.2 describes the optimization of holographic scene rendering based on motion blur control. Section 3 provides insight into the implementation of the prototype system and experiment analysis, and sections 4 and 5 present the discussion and conclusion, respectively.
2 Methodology
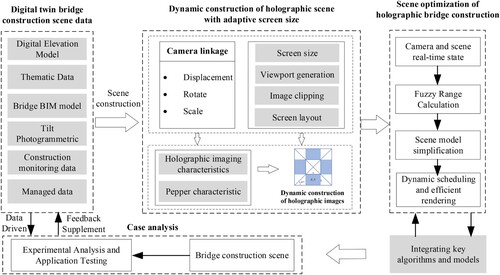
shows the proposed method of holographic modelling. First, the bridge virtual scene is displayed through four virtual cameras in the scene, a dynamic camera linkage algorithm is generated to ensure the unity of the screen images, then a dynamic hologram segmentation algorithm with adaptive screen size is designed to realize the dynamic modelling of holographic scenes with adaptive screen size. Second, according to the human visual characteristics, based on the motion blur algorithm corresponding to different scene motion characteristics, an optimization method for holographic scene rendering based on motion blur control is designed to optimize scene rendering efficiency. Lastly, a case study is carried out based on the above approach, a prototype system is designed, and the experimental results are analysed.
Figure 1. Overview of the research framework.
2.1 Dynamic hologram segmentation algorithm with adaptive screen size
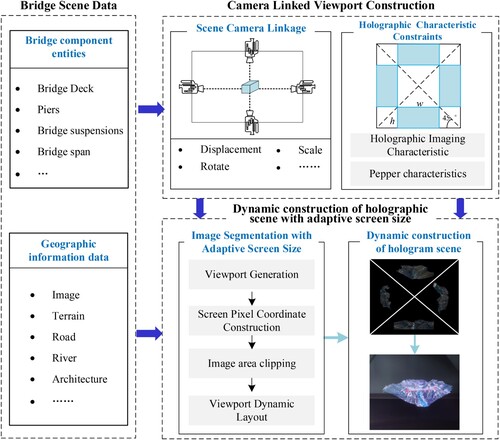
As an excellent three-dimensional visualization method, holographic projection technology provides a highly efficient and intuitive visualization method for digital twin scene display. shows the overview of the dynamic hologram segmentation algorithm with adaptive screen size.
Figure 2. Dynamic hologram segmentation algorithm with adaptive screen size concept diagram.
When the geographic scene and bridge BIM model data in the digital twin platform are loaded, the scene is rendered in real-time by four cameras in the scene. The four cameras always aim at the same area with the same action, that is, they are linked, to ensure that the acquired images are correctly aligned and avoid overlapping. Taking the plane where the camera is located as the XY-plane, the vertical direction as the Z-axis, and the center of the scene as the origin, a coordinate system can be established to calculate the transformation relationship between the cameras. This ensures that the cameras in the scene are aligned with the same object with the same attitude, as shown in .
Figure 3. Virtual camera linkage.
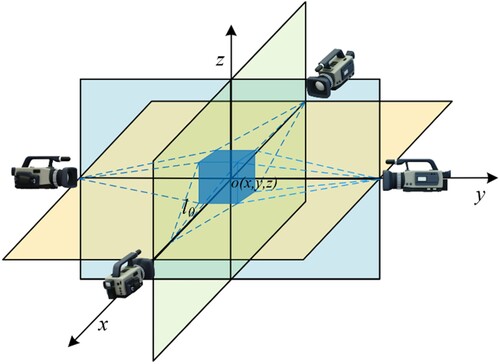
Assuming that the distance from each camera to the origin is , if the central model moves to point
, the camera is transformed in the Y-axis direction as follows:
(1)
(1) The scale in the Y-axis direction is:
(2)
(2) where
. Similarly, the camera transformation in the X-axis direction is:
(3)
(3) where
After determining the image rendered by each camera in the scene, it is necessary to consider the imaging position of the holographic source. Considering the principle of holographic projection imaging, the layout of the four imaging sources needs to be standardized in a square. The screen is regarded as a pixel coordinate system, and the coordinates of the four vertices of the screen can be determined to be a(0,0), b(0,n), c(m,0) and d(m,n), where m and n are the resolution of the screen. It can be determined that the screen center o coordinate is (m/2, n/2). To ensure that the constructed holographic picture is always in the center of the screen and conforms to the holographic projection imaging principle, a square with side length n is constructed with point o as the center, and the four vertices of the square are a’(m/2-n/2,0), b’(m/2-n/2,n), c’(m/2 + n/2,0), and d’(m/2 + n/2,n), thus determining the area of the holographic imaging, as shown in .
Figure 4. Adaptive screen size holographic scene dynamic construction concept diagram.
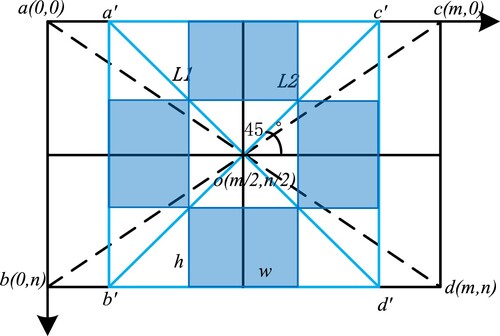
At the same time, the four cameras in the scene dynamically generate four visual windows. To ensure the integrity of the holographic display effect, it is necessary to dynamically and reasonably layout the four visual windows in the cropped screen area, and the maximum value of the frame range should be the shortest side of the screen as the bottom edge length l. That is, n = l, which can be based on the principle of holographic projection:
(4)
(4) where h/w = n/m, then:
(5)
(5)
(6)
(6) where n and m are the resolution of the screen, w is the width of the visible window, and h is the height of the visible window.
The front view position of the visual window layout drawing is:
(7)
(7) The rear view position is:
(8)
(8) The position of the left view is:
(9)
(9) The position of the right view is:
(10)
(10) Considering the principle of Pepper's ghost, a visual window with an adaptive screen resolution size is built dynamically, a reasonable dynamic layout is applied according to the characteristics of the hologram to achieve a real-time holographic visualization display with an adaptive screen size.
2.2 Optimization of holographic scene rendering based on motion blur control
The construction of holographic scenes involves rendering with four cameras simultaneously, which will inevitably present significant rendering challenges. Considering that the interaction of holographic scene exploration is dominated by humans, it is necessary to integrate the physiological characteristics of humans and the needs for efficient rendering. According to human visual characteristics, an optimization method of holographic scene rendering based on motion blur control is designed to optimize scene rendering efficiency.
Due to visual persistence, when an object is moving rapidly, it will form a blurred scene of motion as seen by the human eye (Wooding Citation2002; Atchison and Thibos Citation2016). Taking the bridge as the center position, that is, the position where the camera is aligned in the scene, the motion blurred area formed with the bridge as the center is calculated. Fewer resources are allocated to the blurred area to reduce the resolution rendering, which can greatly reduce the rendering data and minimize the loss of perceptual details.
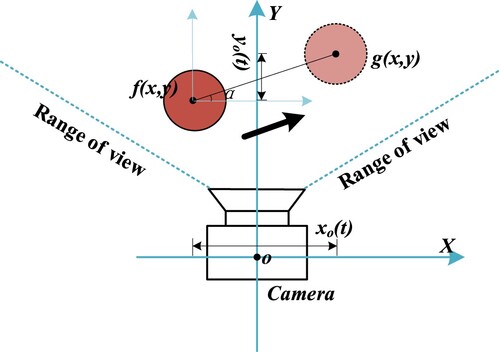
In the scene, the camera is aimed at the scene object in real time to simulate the state when the human eye observes the scene. The point spread function of linear motion blur includes two parameters: blur length and motion direction, as shown in . It is assumed that the blurred picture g (x, y) is composed of the original image f (x, y) in the direction of the α angle with the X-axis; then, the value of any point in the blurred image is:
(11)
(11) Where
is the motion component of the scene in the X-direction and
is the motion component of the scene in the Y-direction. If the total displacement of the object is a and the overall time is T, then the rate of motion is
,
, and then:
(12)
(12) After discretization, it becomes:
(13)
(13) where L is the number of pixels a scene object moves, that is, the blur scale,
, and
. The result of motion blur is an image formed by superimposing the scene after a series of distance delays according to a certain angle.
Figure 5. Linear motion blur schematic.
Rotational motion blur is different from linear motion blur. Rotational motion blur is a kind of spatially variable motion blur. The blur parameters are different on different blur paths. The farther away from the rotation center, the larger the blur scale. The blurring degree of the points at the same distance from the rotation center is the same, that is, the blurring degree of the image on the same ring is not different, and the rotational motion blur is distributed along different rotation paths, as shown in .
Figure 6. Rotational motion blur schematic.
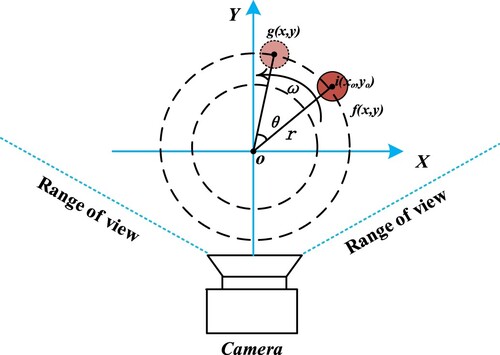
If the center of rotation is the origin (0,0), the distance between any point i(x,y) in the image from the center of rotation is , the exposure time (object rotation time) is T, and the rotation angular velocity is ω, then the relationship between the blurred image g(x,y) and the original image f(x,y) is:
(14)
(14) Expressed in polar coordinate vertex form:
(15)
(15) Let
and
. Then, the point spread function at the distance r from the rotation center is
, then:
(16)
(16) where:
(17)
(17) After discretizing the above formula, it is possible to obtain:
The displayed equation is:
(18)
(18)
where
,
and
are the fuzzy pixel value and the original grey value sequence on the fuzzy path, respectively, the period is
and
is the fuzzy scale, expressed as the number of pixels.
Therefore, the point spread function in the form of the rotational motion blur matrix is:
(19)
(19) By calculating the point spread function of linear motion blur and rotational motion blur, the range of blur of a scene object during interaction can be obtained. That is, the blurry region is constructed, and fewer resources are allocated to the blurry region to reduce the resolution rendering. This centralized rendering can reduce the rendering data, improve the rendering efficiency, and reduce user dizziness, all while ensuring high-fidelity rendering of important areas in the holographic scene of bridge construction.
3 Experiment and analysis
To verify the effectiveness and feasibility of the method proposed in this article, an experimental case study is first introduced, followed by system development, and finally the experimental results and analysis. This includes the real-time construction efficiency and holographic scene rendering efficiency.
3.1 Case study
The case study was selected a large-scale bridge under construction located in Luding County (101° 46′∼ 102° 25′, 29° 54′∼ 30° 10′) of Ganzi Tibetan Autonomous Prefecture, Sichuan Province, which includes bridges, buildings, rivers, hills, and other elements ().
3.2 Prototype system development
The equipment used in the experiment is shown in .
Figure 7. Overview of the research framework experimental area.
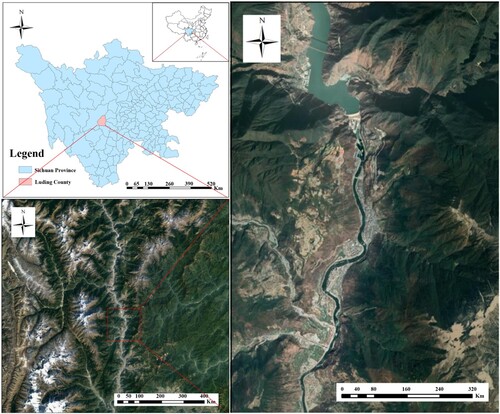
Table 1. System development environment configuration
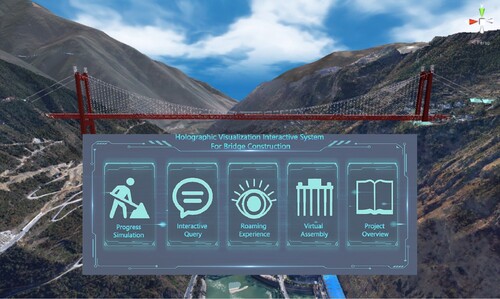
Based on the above development environment, a holographic interaction and query analysis system was developed to manage digital twin scene of bridge construction. is the main interface of the system. The primary functions encompass the following: digital twin overview of the bridge construction scene: displaying of bridge construction scenes; project profile: providing an introduction to the basic construction of the project; bridge component attribute query: enabling users to query the attribute information of bridge construction components; bridge progress simulation: simulating the bridge construction process based on the construction plan scheme.
Figure 8. Prototype system interface.
3.3 Experimental results and analysis
3.3.1 Experimental analysis of dynamic segmentation of a holographic scene
The rendering time between each frame of the holographic scene reflects the real-time efficiency of modelling, and it also determines the user experience with the holographic scene. In the experiment, the construction time of the holographic scene with different screen resolutions was recorded. The experimental results are shown in .
Figure 9. The time of holographic scene dynamic construction with adaptive screen size.
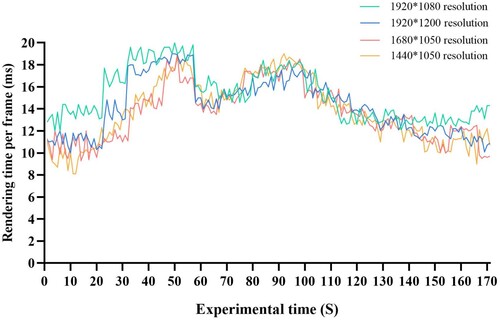
During the whole test, the average time of the holographic scene building at 1920*1080 resolution was 15.306 mpf, at 1920*1200 resolution was 14.287 mpf, at 1680*1050 resolution was 13.653 mpf, at 1440*1050 resolution was 13.758 mpf. The overall experimental results show an average build time of 15.48 mpf and an average rendering efficiency of 65.46 fps for holographic scenes at different screen resolutions.
Gap analysis can assist in understanding the disparity between experimental results and the expected standard, as well as evaluating the effectiveness of the proposed method in dynamically segmenting holographic scenes. Studies have shown that the human eye can perceive frames ranging from 24 to 30 frames per second. Considering 60 fps as the evaluation standard, ten time periods of holographic scene construction were randomly selected from four different resolution display terminals. Subsequently, a gap analysis model was established based on the rendering frame rate of these ten time periods and the designated evaluation index. Defined the evaluation index be Xi, where i = (1,2, 3, … ,k), and the evaluation criterion be denoted as ρ. In this article, ρ is set to 60, and the rendering efficiency at different resolutions are denoted as XAi, XBi, XCi, XDi.
The difference between the rendering efficiency and the evaluation criteria for holographic scene construction at different resolution display terminals is defined as D.
(20)
(20) shows the gap evaluation result, and shows the gap analysis of the rendering efficiency of holographic scene construction under four different resolution display terminals. In general, the rendering efficiency of the holographic scene construction under the four different resolution display terminals has a relatively large gap compared to the established index, and most are higher than the index value, with only a few time periods being lower, but not much different from it. The main reason for this occurrence is that data is accessed during holographic scene construction, which increases the rendering load, but there is not much of an impact on the overall rendering efficiency. The gap analysis shows that the method proposed in this article can satisfy the smooth rendering and real-time construction of holographic scenes at different resolutions.
Figure 10. Scenario building efficiency gap evaluation chart.
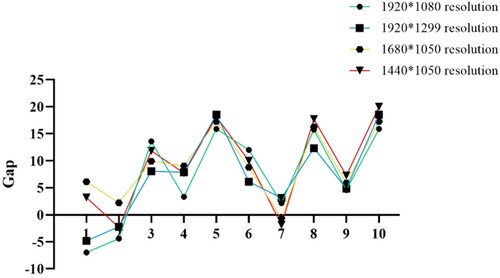
Table 2. Gap analysis evaluation form.
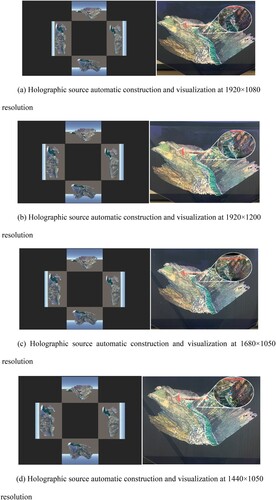
In the experiment, the holographic visualization effect of different resolution display terminals was tested. Selected four different resolution display terminals and constructed the holographic scene by adaptive screen visualization method, and the experimental results are shown in .
Figure. 11. Dynamic holographic scene-building at different screen resolutions. (a) Holographic source automatic construction and visualization at 1920 × 1080 resolution; (b) Holographic source automatic construction and visualization at 1920 × 1200 resolution; (c) Holographic source automatic construction and visualization at 1680 × 1050 resolution; (d) Holographic source automatic construction and visualization at 1440 × 1050 resolution.
To verify the superiority of the dynamic construction method’s visualization effect, a static holographic effect display of the same scene was prepared. The automatic construction and visualization effect of the holographic source at 19201080 resolution were selected to compare with the static holographic visualization effect. The results are shown in .
Figure 12. Dynamic and static holographic display comparison. (a) Dynamic; (b) Static display.
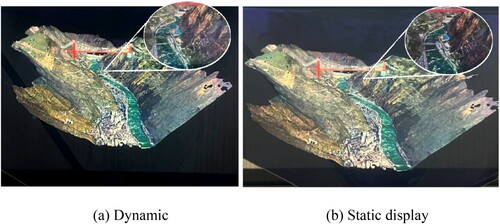
The experimental results show that through the adaptive screen visualization holographic scene construction method, the dynamic construction of holographic images can be carried out for display terminals with different screen sizes and resolutions. Visual display can be implemented, and compared with static display, the dynamic display effect does not deteriorate due to dynamic real-time construction.
3.3.2 Experimental analysis of holographic scene rendering optimization
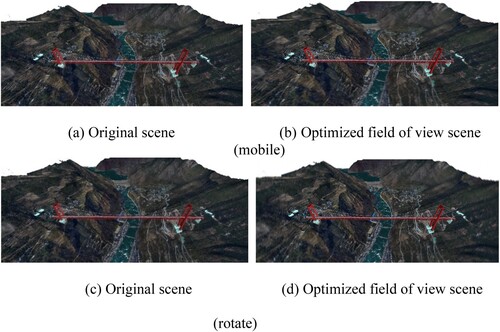
In the experiment, the rendering efficiency of the holographic scene was compared before and after optimization. The scene optimization effect based on motion blur is shown in .
Figure 13. Motion blur optimization effect. (a) Original scene; (b) Optimized field of view scene (mobile); (c) Original scene; (d) Optimized field of view scene (rotate).
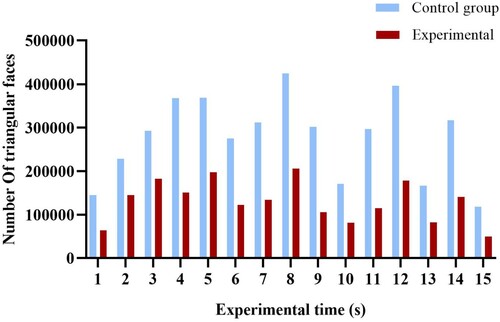
presents an analysis of the amount of data rendered by the holographic scene of bridge construction. The experiment randomly selected 15 moments of interactive browsing in the scene. From , it can be seen that the number of triangular surfaces required to be drawn based on the scene rendering optimization method of motion blur is reduced by approximately 30% to 45% compared to the original scene.
Figure 14. Scene triangular face ratio analysis before and after optimization.
The rendering frame rate of the holographic scene and the number of triangles rendered in the scene were recorded every 1s before and after optimization, and the results are shown in .
Figure 15. Frame rate comparison and analysis before and after optimization.
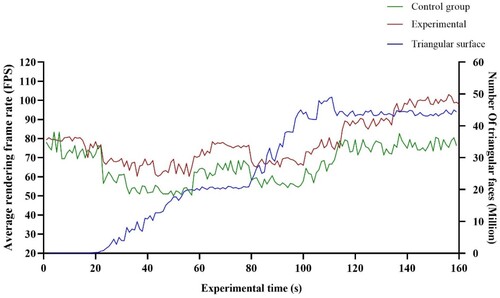
After optimization, the average render frame rate in the entire test process was 77.79 fps, which was approximately 17.7% higher than that before optimization, and the difference between the frame rate of the experimental group and the frame rate of the control group was statistically significant (4.28E-15 < 0.05). The standard deviation of the experimental group was 9.57, and the standard deviation of the control group was 11.85, which reflected that the frame rate stability of the experimental group was better than that of the control group. The frame rate improvement is mainly because in the blurred area, the data accuracy is reduced by means of mesh simplification and texture compression for complex scene objects. The scene data are greatly reduced under the premise of ensuring high rendering quality of important areas, and the rendering efficiency is improved. The data in the latter part of the experiment are mainly building data, and unlike the mountain data in the previous part of the experiment, the building data have more vertices and triangular faces in the same area, resulting in a decrease in the rendering frame rate of both the experimental group and the control group after 80s. According to Pearson's correlation coefficient calculation method, the correlation coefficient between the experimental frame rate and the number of triangular faces was −0.89, and the correlation coefficient between the frame rate and the number of triangular faces in the control group was −0.91. This further indicates that the rendering frame rate is negatively correlated with the number of triangular faces. Reducing the number of triangular polygons in the scene increases rendering efficiency.
3.3.3 Comparison with other holographic display
shows the advantages of dynamic holographic modelling method adopted in this article compared with modelling methods in other articles. The results show that the method proposed in this article has the advantages of are stable imaging, a strong 3D visualization effect, real-time dynamic rendering, and small implementation difficulty.
Table 3. Advantages of dynamic holographic modelling method.
4 Discussion
This article attempts to introduce holographic technology into a bridge construction of the digital twin method. This section highlights the strengths and limitations of this article's research, while proposing some suggestions with the hope that readers will further apply creative thinking to address the challenges raised here.
4.1 Strengths
This article innovatively introduces holographic technology into a bridge construction digital twin method, intending to provide a new and efficient means of information expression for the scene. The significant contribution of this article is the proposal of a dynamic holographic modelling method of digital twin scenes for bridge construction. This method can solve the difficulties of unstable imaging effect, poor adaptability, and insufficient dynamic visualization of current holographic technology, to support the holographic display of dynamic change information of digital twin scene. The specific contributions are in two aspects. First, the dynamic hologram segmentation algorithm with adaptive screen size is designed to realize real-time visualization of bridge construction holographic scenes; Second, considering human visual characteristics, a motion blur control method was designed to improve the rendering efficiency of holographic scenes.
First, the experimental results of adaptive screen holographic scene construction efficiency show that the proposed method can build holographic scenes for different display terminals. At the same time, by constructing the gap analysis model and formulating an evaluation index, the results show that more than 90% of the ten randomly selected time periods were above the evaluation index. This demonstrates that the method proposed in this article can achieve real-time and smooth visualization for different resolution visualization terminals in the dynamic construction of adaptive screen holographic scenes.
Second, selected visualization terminals of different resolution sizes were selected to conduct a dynamic construction experiment for the holographic scene. Through the comparison of the overall and local effects, the scene can be well visualized. At the same time, the dynamic and static holographic visualization effects were compared, and the results show that the color restoration and detail processing of the dynamic holographic effect are relatively good, providing a stable 3D visualization effect. The reason is that a static display needs to prepare the video source in advance, and the reproduction of the video source will inevitably cause color distortion and resolution reduction.
Third, compared with the method before optimization, the holographic scene optimization method proposed in this article, which considers the visual characteristics of human eyes, improves the rendering efficiency by approximately 17.7%, and the number of triangles to be drawn is reduced by approximately 30%∼45% compared with the original scene. Considering the particularity of holographic scene rendering and the characteristics of human vision, under the premise of ensuring the minimum loss of image details, this article constructs fuzzy areas, reduces the rendering pressure, and seldom exhibits image jamming and tearing. This method meets the real-time and efficient display requirements of a bridge construction holographic scene using a digital twin.
Finally, the dynamic holographic modelling method in this article is compared with other methods, the result shows that the proposed method can perfectly meet the needs of digital twin bridge construction. At the same time, a case of a digital twin holographic system for bridge construction has been developed, which can provide a reference for future research.
4.2 Limitations
After optimization, the number of triangles in the scene is reduced and the rendering efficiency is significantly improved. However, overall, real-time dynamic data access causes the rendering efficiency to change greatly during the scene construction process, and the data dispersion is large. Although the scene rendering meets the requirements of smoothness, the sudden change in rendering efficiency will inevitably lead to a lack of visual perception. Therefore, this study considers the design of a rendering optimization method suitable for holographic scene rendering and that can easily cope with large amounts of data access.
Due to the limitations of the experimental equipment, the experiment only selected four widely used display terminals with different resolutions to evaluate the feasibility of the method. However, as digitalization and intelligence become increasingly prominent and relied upon by the public, digital twins will also be utilized in more diverse contexts. This expansion will be a long-term process. Therefore, it is essential to conduct further testing with additional visualization equipment and experimental case studies to verify the generalization of the methods.
4.3 Suggestions
The realization of interaction in a digital twin holographic scene allows user to obtain information more effectively. Interaction with digital twin holographic scenes offers the advantages of gesture recognition as a natural mode of interaction mode. This approach reduces the learning cost of human-computer interaction and enhances user cognitive efficiency. Conducting interactive analysis in a digital twin holographic scene through gesture interaction holds great potential for improving user's scene cognitive ability, enhancing information acquisition efficiency, and further refining the design of a digital twin holographic system.
Specific practical application of the system is a crucial consideration. While research results reveal the significant potential of holographic technology holographic technology in the field of engineering construction, its actual use in this context remains uncertain. Most research is still in the experimental stage, lacking large-scale applications in terms of performance and usability. Digital twins have high requirements for two-way feedback and real-time data visualization. This article represents the first application of holography to digital twin bridges, highlighting the need for its application in real digital twin projects. Implementing these tasks will undoubtedly present challenges, but they are essential steps towards achieving dynamic construction and large-scale application of holographic scenes driven by digital twins.
5 Conclusion
This article innovatively introduces holographic technology into digital twin scenes for bridge construction, providing a new and efficient method of expressing information in the construction of digital twin bridges. To address the problems of unstable imaging effects, poor adaptability, and lack of real-time capabilities in holographic expression, this article proposes a dynamic holographic modelling method for digital twin scenes in bridge construction. First, based on the characteristics of camera linkage and holographic imaging, a dynamic hologram segmentation algorithm with adaptive screen size has been designed to achieve real-time dynamic generation of bridge construction holographic scenes. Second, considering human visual characteristics, a motion blur algorithm is designed to optimize scene visualization efficiency and improve rendering efficiency. Lastly, a case study of a mega suspension bridge under construction is conducted for experimental analysis. The results show that the proposed method supports holographic display of dynamic change information in the digital twin scene, accurately depicting the construction scene in a clear and intuitive manner. It provides a more effective means for scene diagnosis, analysis, prediction, exploration, and other visualization tasks.
In the future, two main tasks need to be prioritized, in addition to the suggestions proposed in the discussion section. First, a digital twin bridge construction system based on holography should be designed rigorously. Second, exploration of holographic visual enhance expression for information description in digital twin scenes should be explored.
Author Contributions
Conceptualization, Jun Zhu; Methodology, Jianlin Wu; Resources, Jinbin Zhang, Jigang You, Yukun Gou, Jianbo Lai, Lin Fu and Ce Liang; Software, Jianlin Wu, Jinbin Zhang and Pei Dang; Validation, Jun Zhu, Weilian Li, Yakun Xie; Writing – original draft, Jianlin Wu; Writing – review & editing, Jun Zhu and Weilian Li. All authors have read and agreed to the published version of the manuscript.
Data Availability Statement
The data that support the findings of this study are available from the corresponding author, Zhu, upon reasonable request.
Disclosure statement
No potential conflict of interest was reported by the author(s).
Additional information
Funding
References
- Atchison, D. A., and L. N. Thibos. 2016. “Optical Models of the Human eye.” Clinical and Experimental Optometry 99 (2): 99–106. https://doi.org/10.1111/cxo.12352.
- Botín-Sanabria, D. M., A. S. Mihaita, R. E. Peimbert-García, M. A. Ramírez-Moreno, R. A. Ramírez-Mendoza, and J. D. J. Lozoya-Santos. 2022. “Digital Twin Technology Challenges and Applications: A Comprehensive Review.” Remote Sensing 14 (6): 1335. https://doi.org/10.3390/rs14061335.
- Bovier, F., Caggianese, G., De Pietro, G., Gallo, L., & Neroni, P. 2016. “An Interactive 3D Holographic Pyramid for Museum Exhibition”. In 2016 12th International Conference on Signal-Image Technology & Internet-Based Systems (SITIS 2016). Naples, Italy: 428-434. https://doi.org/10.1109/SITIS.2016.73.
- Bruckheimer, E., C. Rotschild, T. Dagan, G. Amir, A. Kaufman, S. Gelman, and E. Birk. 2016. “Computer-generated Real-Time Digital Holography: First Time use in Clinical Medical Imaging.” European Heart Journal – Cardiovascular Imaging 17 (8): 845–849. https://doi.org/10.1093/ehjci/jew087.
- Cerezo, R., V. Calderón, and C. Romero. 2019. “A Holographic Mobile-Based Application for Practicing Pronunciation of Basic English Vocabulary for Spanish Speaking Children.” International Journal of Human-Computer Studies 124: 13–25. https://doi.org/10.1016/j.ijhcs.2018.11.009.
- Chlipala, M., and T. Kozacki. 2019. “Color LED DMD Holographic Display with High Resolution Across Large Depth.” Optics Letters 44 (17): 4255–4258. https://doi.org/10.1364/OL.44.004255.
- Chlipała, Maksymilian, Tomasz Kozacki, Han Ju Yeom, Juan Martinez Carranza, Rafał Kukołowicz, Jinwoong Kim, Jong Heon Yang, Ji Hun Choi, Jae Eun Pi, and Chi Sun Hwang. 2021. “Wide angle holographic video projection display.” Optics Letters 46 (19): 4956. https://doi.org/10.1364/OL.430275.
- Christou, A., Y. Gao, W. T. Navaraj, H. Nassar, and R. Dahiya. 2022. “3D Touch Surface for Interactive Pseudo-Holographic Displays.” Advanced Intelligent Systems 4 (2): 2000126. https://doi.org/10.1002/aisy.202000126.
- Ciobanu, M., A. Naaji, I. Dascal, and I. Virag. 2017. “Pseudo-holographic Displays as Teaching Tools in Mathematics. BRAIN.” Broad Research in Artificial Intelligence and Neuroscience 8 (3): 108–118. https://doi.org/10.5281/zenodo.1045377.
- Dang, N., Kang, H., Lon, S., & Shim, C. 2018. “3D Digital Twin Models for Bridge Maintenance.” In Proceedings of the 10th International Conference on Short and Medium Span Bridges. Quebec City, Canada, 31. ww.researchgate.net/publication/331314334.
- Dang, Pei, Jun Zhu, Saied Pirasteh, Weilian Li, Jigang You, Bingli Xu, and Ce Liang. 2021. “A chain navigation grid based on cellular automata for large-scale crowd evacuation in virtual reality.” International Journal of Applied Earth Observation and Geoinformation 103: 102507. https://doi.org/10.1016/j.jag.2021.102507.
- Dang, Pei, Jun Zhu, Xiaoqi Qiao, Jianlin Wu, Weilian li, Jigang You, and Lin Fu. 2023. “How does spatial cognitive style affect indoor fire evacuation wayfinding in mobile virtual reality?.” Cartography and Geographic Information Science 50 (3): 272–288. https://doi.org/10.1080/15230406.2023.2176928.
- Doronin, O., and Barsi, A. 2018. “Estimation of Global Luminance for HoloVizio 3D Display.” In 2018 International Conference on 3D Immersion (IC3D). Brussels, Belgium:1-8. https://doi.org/10.1109/IC3D.2018.8657834.
- Fan, Y., J. Yang, J. Chen, P. Hu, X. Wang, J. Xu, and B. Zhou. 2021. “A Digital-Twin Visualized Architecture for Flexible Manufacturing System.” Journal of Manufacturing Systems 60: 176–201. https://doi.org/10.1016/j.jmsy.2021.05.010.
- Fu, Lin, Jun Zhu, Wei-lian Li, Ji-gang You, and Zhang-yu Hua. 2021. “Fast estimation method of volumes of landslide deposit by the 3D reconstruction of smartphone images.” Landslides 18 (9): 3269–3278. https://doi.org/10.1007/s10346-021-01702-9.
- Fuller, A., Z. Fan, C. Day, and C. Barlow. 2020. “Digital Twin: Enabling Technologies, Challenges and Open Research.” IEEE Access 8: 108952–108971. https://doi.org/10.1109/ACCESS.2020.2998358.
- Gallala, A., A. A. Kumar, B. Hichri, and P. Plapper. 2022. “Digital Twin for Human–Robot Interactions by Means of Industry 4.0 Enabling Technologies.” Sensors 22 (13): 4950. https://doi.org/10.3390/s22134950.
- Guo, X., J. Zhong, B. Li, S. Qi, Y. Li, P. Li, D. Wen, S. Liu, B. Wei, and J. Zhao. 2022. “Full-Color Holographic Display and Encryption with Full-Polarization Degree of Freedom” Advanced Materials 34 (3): 2103192. https://doi.org/10.1002/adma.202103192.
- Haleem, A., M. Javaid, and I. H. Khan. 2020. “Holography Applications Toward Medical Field: An Overview.” Indian Journal of Radiology and Imaging 30 (03): 354–361. https://doi.org/10.4103/ijri.IJRI_39_20.
- Havard, V., B. Jeanne, M. Lacomblez, and D. Baudry. 2019. “Digital Twin and Virtual Reality: A co-Simulation Environment for Design and Assessment of Industrial Workstations.” Production & Manufacturing Research 7 (1): 472–489. https://doi.org/10.1080/21693277.2019.1660283.
- Huang, W., M. Pei, X. Liu, and Y. Wei. 2020. “Design and Construction of Super-Long Span Bridges in China: Review and Future Perspectives.” Frontiers of Structural and Civil Engineering 14: 803–838. https://doi.org/10.1007/s11709-020-0644-1.
- Inoue, N., Kawakita, M., and Yamamoto, K. 2013. “200-Inch Glasses-Free 3D Display and Electronic Holography Being Developed at NICT.” In 2013 Conference on Lasers and Electro-Optics Pacific Rim (CLEOPR). Kyoto, Japan: 1-2. https://doi.org/10.1109/CLEOPR.2013.6600199.
- Javon, E., A. Lubk, R. Cours, S. Reboh, N. Cherkashin, F. Houdellier, C. Getal, and M. J. Hÿtch. 2014. “Dynamical Effects in Strain Measurements by Dark-Field Electron Holography.” Ultramicroscopy 147: 70–85. https://doi.org/10.1016/j.ultramic.2014.06.005.
- Jiang, C., J. Yang, J. Yuan, and F. Xu. 2012. “Overview of Intelligent Railway Transportation Systems in China.” Intelligent Automation & Soft Computing 18 (6): 627–634. https://doi.org/10.1080/10798587.2012.10643272.
- Jones, D., C. Snider, A. Nassehi, J. Yon, and B. Hicks. 2020. “Characterising the Digital Twin: A Systematic Literature Review.” CIRP Journal of Manufacturing Science and Technology 29: 36–52. https://doi.org/10.1016/j.cirpj.2020.02.002.
- Ke, S., F. Xiang, Z. Zhang, and Y. Zuo. 2019. “A Enhanced Interaction Framework Based on VR, AR and MR in Digital Twin.” Procedia Cirp 83: 753–758. https://doi.org/10.1016/j.procir.2019.04.103.
- Kuts, V., T. Otto, T. Tähemaa, and Y. Bondarenko. 2019. “Digital Twin Based Synchronised Control and Simulation of the Industrial Robotic Cell Using Virtual Reality.” Journal of Machine Engineering 19 (1): 128–144. https://doi.org/10.5604/01.3001.0013.0464.
- Le, B., and J. Andrews. 2016. “Petri net Modelling of Bridge Asset Management Using Maintenance-Related State Conditions.” Structure and Infrastructure Engineering 12 (6): 730–751. https://doi.org/10.1080/15732479.2015.1043639.
- Leng, J., Z. Chen, W. Sha, Z. Lin, J. Lin, and Q. Liu. 2022. “Digital Twins-Based Flexible Operating of Open Architecture Production Line for Individualized Manufacturing.” Advanced Engineering Informatics 53: 101676. https://doi.org/10.1016/j.aei.2022.101676.
- Leng, J., Q. Liu, S. Ye, J. Jing, and X. Chen. 2020. “Digital Twin-Driven Rapid Reconfiguration of the Automated Manufacturing System via an Open Architecture Model.” Robotics and Computer-Integrated Manufacturing 63: 101895. https://doi.org/10.1016/j.rcim.2019.101895.
- Leng, J., D. Wang, W. Shen, X. Li, Q. Liu, and X. Chen. 2021a. “Digital Twins-Based Smart Manufacturing System Design in Industry 4.0: A Review.” Journal of Manufacturing Systems 60: 119–137. https://doi.org/10.1016/j.jmsy.2021.05.011.
- Leng, J., D. Yan, Q. Liu, H. Zhang, G. Zhao, L. Wei, D. Zhang, A. Yu, and X. Chen. 2021b. “Digital Twin-Driven Joint Optimisation of Packing and Storage Assignment in Large-Scale Automated High-Rise Warehouse Product-Service System.” International Journal of Computer Integrated Manufacturing 34 (7-8): 783–800. https://doi.org/10.1080/0951192X.2019.1667032.
- Leng, J., M. Zhou, Y. Xiao, H. Zhang, Q. Liu, W. Shen, Q. Su, and L. Li. 2021c. “Digital Twins-Based Remote Semi-Physical Commissioning of Flow-Type Smart Manufacturing Systems.” Journal of Cleaner Production 306: 127278. https://doi.org/10.1016/j.jclepro.2021.127278.
- Li, N., and D. Lefevre. 2020. “Holographic Teaching Presence: Participant Experiences of Interactive Synchronous Seminars Delivered via Holographic Videoconferencing.” Research in Learning Technology 28. https://doi.org/10.25304/rlt.v28.2265.
- Li, Y. L., N. N. Li, D. Wang, F. Chu, S. D. Lee, Y. W. Zheng, and Q. H. Wang. 2022. “Tunable Liquid Crystal Grating Based Holographic 3D Display System with Wide Viewing Angle and Large Size.” Light: Science & Applications 11 (1): 188. https://doi.org/10.1038/s41377-022-00880-y.
- Li, Weilian, Jun Zhu, Pei Dang, Jianlin Wu, Jinbin Zhang, Lin Fu, and Qing Zhu. 2023. “Immersive virtual reality as a tool to improve bridge teaching communication.” Expert Systems with Applications 217: 119502. https://doi.org/10.1016/j.eswa.2023.119502.
- Li, Weilian, Jun Zhu, Lin Fu, Qing Zhu, Yukun Guo, and Yuhang Gong. 2021a. “A rapid 3D reproduction system of dam-break floods constrained by post-disaster information.” Environmental Modelling & Software 139: 104994. https://doi.org/10.1016/j.envsoft.2021.104994.
- Li, Weilian, Jun Zhu, Lin Fu, Qing Zhu, Yakun Xie, and Ya Hu. 2021b. “An augmented representation method of debris flow scenes to improve public perception.” International Journal of Geographical Information Science 35 (8): 1521–1544. https://doi.org/10.1080/13658816.2020.1833016.
- Li, Weilian, Jun Zhu, Yuhang Gong, Qing Zhu, Bingli Xu, and Min Chen. 2022b. “An optimal selection method for debris flow scene symbols considering public cognition differences.” International Journal of Disaster Risk Reduction 68: 102698. https://doi.org/10.1016/j.ijdrr.2021.102698.
- Li, Weilian, Jun Zhu, Saied Pirasteh, Qing Zhu, Lin Fu, Jianlin Wu, Ya Hu, and Youness Dehbi. 2022a. “Investigations of disaster information representation from a geospatial perspective: Progress, challenges and recommendations.” Transactions in GIS 26 (3): 1376–1398. https://doi.org/10.1111/tgis.v26.3.
- Liu, S., J. Bao, Y. Lu, J. Li, S. Lu, and X. Sun. 2021c. “Digital Twin Modeling Method Based on Biomimicry for Machining Aerospace Components” Journal of Manufacturing Systems 58: 180–195. https://doi.org/10.1016/j.jmsy.2020.04.014.
- Liu, M., S. Fang, H. Dong, and C. Xu. 2021a. “Review of Digital Twin About Concepts, Technologies, and Industrial Applications.” Journal of Manufacturing Systems 58: 346–361. https://doi.org/10.1016/j.jmsy.2020.06.017.
- Liu, Q., J. Leng, D. Yan, D. Zhang, L. Wei, A. Yu, R. Zhao, H. Zhang, and X. Chen. 2021b. “Digital Twin-Based Designing of the Configuration, Motion, Control, and Optimization Model of a Flow-Type Smart Manufacturing System.” Journal of Manufacturing Systems 58: 52–64. https://doi.org/10.1016/j.jmsy.2020.04.012.
- Liu, Y., Wu, S., Xu, Q., & Liu, H. 2021d. “Holographic Projection Technology in the Field of Digital Media art.” Wireless Communications and Mobile Computing 2021, 1-12. https://doi.org/10.1155/2021/9997037.
- Ma, J., H. Chen, Y. Zhang, H. Guo, Y. Ren, R. Mo, and L. Liu. 2020. “A Digital Twin-Driven Production Management System for Production Workshop” The International Journal of Advanced Manufacturing Technology 110: 1385–1397. https://doi.org/10.1007/s00170-020-05977-5.
- Marai, O. E., T. Taleb, and J. S. Song. 2021. “Roads Infrastructure Digital Twin: A Step Toward Smarter Cities Realization.” IEEE Network 35 (2): 136–143. https://doi.org/10.1109/MNET.011.2000398.
- Martínez-Gutiérrez, A., J. Díez-González, R. Ferrero-Guillén, P. Verde, R. Álvarez, and H. Perez. 2021. “Digital Twin for Automatic Transportation in Industry 4.0.” Sensors 21 (10): 3344. https://doi.org/10.3390/s21103344.
- Michalkova, L., V. Machova, and D. Carter. 2022. “Digital Twin-Based Product Development and Manufacturing Processes in Virtual Space: Data Visualization Tools and Techniques, Cloud Computing Technologies, and Cyber-Physical Production Systems.” Economics, Management, and Financial Markets 17 (2): 37–51. https://doi.org/10.22381/emfm17220222.
- Ning, B., T. Tang, Z. Gao, F. Yan, F. Y. Wang, and D. Zeng. 2006. “Intelligent Railway Systems in China.” IEEE Intelligent Systems 21 (5): 80–83. https://doi.org/10.1109/MIS.2006.99.
- Pedersen, I., N. Gale, P. Mirza-Babaei, and S. Reid. 2017. “More Than Meets the Eye: The Benefits of Augmented Reality and Holographic Displays for Digital Cultural Heritage” Journal on Computing and Cultural Heritage 10 (2): 1–15. https://doi.org/10.1145/3051480.
- Phanden, R. K., P. Sharma, and A. Dubey. 2021. “A Review on Simulation in Digital Twin for Aerospace, Manufacturing and Robotics.” Materials Today: Proceedings 38: 174–178. https://doi.org/10.1016/j.matpr.2020.06.446.
- Qiu, C., S. Zhou, Z. Liu, Q. Gao, and J. Tan. 2019. “Digital Assembly Technology Based on Augmented Reality and Digital Twins: A Review.” Virtual Reality & Intelligent Hardware 1 (6): 597–610. https://doi.org/10.1016/j.vrih.2019.10.002.
- Rudskoy, A., I. Ilin, and A. Prokhorov. 2021. “Digital Twins in the Intelligent Transport Systems.” Transportation Research Procedia 54: 927–935. https://doi.org/10.1016/j.trpro.2021.02.152.
- Saddik, A. E. 2018. “Digital Twins: The Convergence of Multimedia Technologies.” IEEE Multimedia 25 (2): 87–92. https://doi.org/10.1109/MMUL.2018.023121167.
- Sepasgozar, S. M. E. 2021. “Differentiating Digital Twin from Digital Shadow: Elucidating a Paradigm Shift to Expedite a Smart, Sustainable Built Environment.” Buildings 11 (4): 151. https://doi.org/10.3390/buildings11040151.
- Shim, C. S., N. S. Dang, S. Lon, and C. H. Jeon. 2019. “Development of a Bridge Maintenance System for Prestressed Concrete Bridges Using 3D Digital Twin Model.” Structure and Infrastructure Engineering 15 (10): 1319–1332. https://doi.org/10.1080/15732479.2019.1620789.
- Shuguang, L. I. U., and Lin, B. A. 2020. “Holographic Classroom Based on Digital Twin and its Application Prospect.” In 2020 IEEE 3rd International Conference on Electronics and Communication Engineering (ICECE). Xi'An, People’s Republic of China: 122-126. https://doi.org/10.1109/ICECE51594.2020.9352884.
- Tokody, D., and F. Flammini. 2017. “The Intelligent Railway System Theory.” International Transportation 69 (1): 38–40.
- Tokody, D., Holicza, P., and Schuster, G. 2016. “The Smart Mobility Aspects of Intelligent Railway.” In 2016 IEEE 11th International Symposium on Applied Computational Intelligence and Informatics (SACI). Timisoara, Romania, 323-326. https://doi.org/10.1109/SACI.2016.7507394.
- Wooding, D. S. 2002. “Eye Movements of Large Populations: II. Deriving Regions of Interest, Coverage, and Similarity Using Fixation Maps.” Behavior Research Methods, Instruments, & Computers 34 (4): 518–528. https://doi.org/10.3758/BF03195481.
- Yamaguchi, T., and H. Yoshikawa. 2011. “Computer-generated Image Hologram.” Chinese Optics Letters 9 (12): 120006. https://doi.org/10.3788/COL201109.120006.
- Ye, C., Butler, L., Calka, B., Iangurazov, M., Lu, Q., Gregory, A., Girolami, M & Middleton, C. 2019. “A Digital Twin of Bridges for Structural Health Monitoring.” Structural Health Monitoring. 1, 24-30. https://doi.org/10.12783/shm2019/32287.
- Yoo, H. W., J. H. Jang, H. J. Oh, and I. W. Park. 2022. “The Potentials and Trends of Holography in Education: A Scoping Review.” Computers & Education 186), 104533 https://doi.org/10.1016/j.compedu.2022.104533.
- Zhang, Yunhao, Jun Zhu, Qing Zhu, Yakun Xie, Weilian Li, Lin Fu, Junxiao Zhang, and Jianmei Tan. 2020. “The construction of personalized virtual landslide disaster environments based on knowledge graphs and deep neural networks.” International Journal of Digital Earth 13 (12): 1637–1655. https://doi.org/10.1080/17538947.2020.1773950.
- Zhou, X., and X. Zhang. 2019. “Thoughts on the Development of Bridge Technology in China.” Engineering 5 (6): 1120–1130. https://doi.org/10.1016/j.eng.2019.10.001.
- Zhu, Z., Liu, C., and Xu, X. 2019. “Visualisation of the Digital Twin Data in Manufacturing by Using Augmented Reality.” Procedia Cirp 81, 898-903. https://doi.org/10.1016/j.procir.2019.03.223.
- Zhu, Q., Q. Shang, H. Hu, H. Yu, and R. Zhong. 2021. “Structure-aware Completion of Photogrammetric Meshes in Urban Road Environment.” ISPRS Journal of Photogrammetry and Remote Sensing 175: 56–70. https://doi.org/10.1016/j.isprsjprs.2021.02.010.