
 ?Mathematical formulae have been encoded as MathML and are displayed in this HTML version using MathJax in order to improve their display. Uncheck the box to turn MathJax off. This feature requires Javascript. Click on a formula to zoom.
ABSTRACT
Salinity is an essential factor of lake water environments and aquatic systems. It is also sensitive to climatic changes and human activities based on concentration variations of solved minerals. However, there are few consecutively temporal studies on lake salinity variations on the Tibetan Plateau because the harsh environmental conditions make it difficult to carry out in-situ observations for several lakes. In this study, we constructed a remote sensing retrieval model for lake salinity based on 87 in-situ lake investigations; moreover, interannual lake salinity and associated variations from 152 lakes larger than 50 km2 were analyzed on the Tibetan Plateau. A significant decreasing trend in lake salinity was observed between 2000 and 2019 (p < 0.01). The spatial variation of lake salinity was negatively correlated with lake area changes, and the optical characteristics of salt mineral solutions were generally positively correlated with mineral concentration based on the absorption coefficients of ionic solutions. The decreasing trend of lake salinity was not directly affected by the precipitation, but was potentially dominated by the expanding lake water volume. This study improves the understanding of regional water environmental changes and management efficacy of water resources.
1. Introduction
Salinity is an essential factor of the lake water environment and aquatic systems. It is also sensitive to climatic changes and human activities due to the concentration variations of solved minerals and is of considerable importance in the monitoring and management of regional water environments, water resources, and mineral resources. The TP represents the largest and highest lake area on Earth, and most of its lakes are closed (Zhu et al. Citation2019). The intensive changes of lakes have caused lake salinity to become an important indicator reflecting lake physical and chemical qualities (Zhu et al. Citation2020) and influencing lake water plankton (Lin et al. Citation2017). A large spatial–temporal scale investigation on lake salinity on the TP is a key component of regional aquatic studies. In-situ investigations of lake salinity on the TP began with the first scientific expedition to the plateau in the 1970s (Guan, Chen, and Qu Citation1984). Subsequent studies on lake hydrochemistry in the TP have mainly focused on investigating individual lakes (Mitamura et al. Citation2003; Murakami et al. Citation2007; Z. J. Yao et al. Citation2015; Q. G. Zhang et al. Citation2008; Zhu et al. Citation2010a; Citation2010b; J. B. Wang, Ju, and Zhu Citation2013). The in-situ measured data of more than 100 lakes show that the salinities of lakes in the TP exhibit a vast variation, ranging from freshwater lakes to brine lakes and salt lakes (Liu et al. Citation2021a). However, there are few large-scale consecutive time series studies on regional lake salinity variations owing to the area’s harsh environmental conditions and relative lack of accessible sites.
Regarding large-scale water salinity monitoring, studies have shown that optical remote sensing data can be used to retrieve surface water salinity in near-shore areas of the ocean (Bai et al. Citation2013; Ferrari and Dowell Citation1998; Harvey, Kratzer, and Andersson Citation2015; Zaitseva, Konyukhov, and Kazimirko Citation2018). These studies indicate that there is a correlation between salinity and other water parameters, such as colored dissolved organic matter (CDOM), that can be retrieved by optical remote sensing. However, minimal quantitative remote sensing inversion research have been conducted for lake salinity in interior areas owing to a lack of in-situ measured data and an incomplete understanding between lake salinity and the reflective or optical absorption spectrum.
In this study, based on obtained in-situ salinity data of 87 lakes from the TP, we investigate the quantitative relationship between the lake salinity and the annual maximum lake clarity retrieved by moderate-resolution imaging spectroradiometer (MODIS) remote sensing data. The large spatial–temporal scale of the lake salinity and variation characteristics in the TP is then analyzed. In addition, we analyzed the optical characteristics of water bodies with different salinities based on laboratory data to further supports the reliability of the salinity inversion based on satellite remote sensing data.
2. Study area
There are more than 1,400 lakes of greater than 1 km2 on the TP, with a total area of approximately 50,000 km2 (G. Q. Zhang et al. Citation2019). These lakes are situated in an extreme environment with minimal human activity, as most of these lakes are at an average elevation exceeding 4000 m above sea level. Studies have shown that human influence is low across most regions of TP (Sanderson et al. Citation2002). TP lakes are diverse in terms of area, depth, salinity, structural types, and water supply conditions (Guan, Chen, and Qu Citation1984). They mostly have a maximum water depth greater than 30 m (Liu et al. Citation2017; Zhu et al. Citation2017) and few aquatic vascular plants for large lakes (Wang Citation2005). In TP lakes, measured water clarity (Secchi Depth, SD for short) in the open water areas was 3–10 (Liu et al. Citation2021a).
Studies have shown that under climate change, the physical, chemical, and biological properties of lakes on the Tibetan Plateau (TP) have undergone prominent changes in recent years (Zhu et al. Citation2019; G. Q. Zhang et al. Citation2022). The number of lakes, the total lake area and the average water level of lakes increased in the past several decades (Qiao and Zhu Citation2017; Lhakpa et al. Citation2022; Zhu, Xie, and Wu Citation2010c; G. Zhang et al. Citation2020; G. Q. Zhang et al. Citation2019). The water storage of lakes rapidly increased (Yang et al. Citation2017; Zhu et al. Citation2017) by approximately 170 Gt from 1976 to 2019 (G. Q. Zhang et al. Citation2021). The lakes’ water clarity (Liu et al. Citation2021a), surface temperature (G. Q. Guo et al. Citation2022; Huang et al. Citation2017; Song et al. Citation2016; Zhang et al. Citation2014), and lake ice phenology (Cai et al. Citation2019; Qiu et al. Citation2019; X. Wang et al. Citation2022) are generally changing as well. In the case analysis (Guo, Zhang, and Ma Citation2019), the lake changes on the TP were affected by changes in glacial meltwater caused by precipitation, evaporation, and temperature increases, and lake evaporation was closely related to surface water temperature and wind speed. The magnitudes of these factors varied significantly from region to region (Yang et al. Citation2017). In addition, study showed that the zooplankton species composition was most sensitive to changes in salinity in lakes (Lin et al. Citation2017).
3. Data and methods
3.1. In-situ lake salinity data
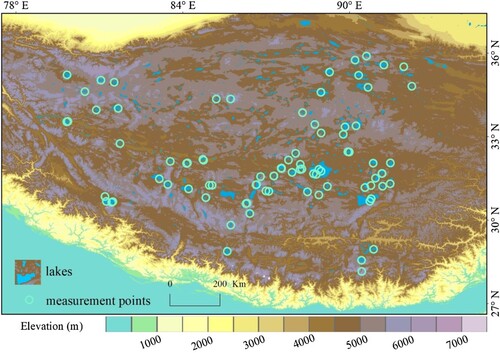
In-situ lake salinity data were collected nearly covering all parts of TP from 2009 to 2019 (Liu et al. Citation2021b; ). These data were measured using practical salinity units (psu), which was transformed from the specific conductivity (SpC) using a conductivity sensor. The data were measured on widely used YSI EXO or HACH multi-parameter water quality instruments. During the measurements, the data were obtained from approximately 10 to 20 cm below the lake surface. The data were measured in a near-center or open area of the individual lakes to reduce the uncertainty of the lakeshore and input runoff. Thus, the measured data represent the basic status of the water quality of TP lakes, which rarely varies in open areas within the individual lakes (Liu et al. Citation2021b; T. D. Yao Citation2019).
Figure 1. Distribution of lakes and lakes with in-situ salinity measurements across the Tibetan Plateau.
3.2. Laboratory measurement of absorption coefficient of different salinity solutions
The absorbances of different salinity solutions were measured using a Shimadzu UV-1900 UV-Vis recording spectrophotometer with 10 cm quartz cells. The solution samples were first filtered at low pressure through a 25 mm Millipore membrane cellulose filter (0.22 μm), and then the absorption spectra were obtained between 200 and 800 nm at 1 nm intervals. Milli-Q water was used as a reference. Absorption coefficients were corrected by subtracting the minimum value among mean values for each consecutive 10 nm.
3.3. Remote sensing data processing, modeling, salinity extraction and analysis
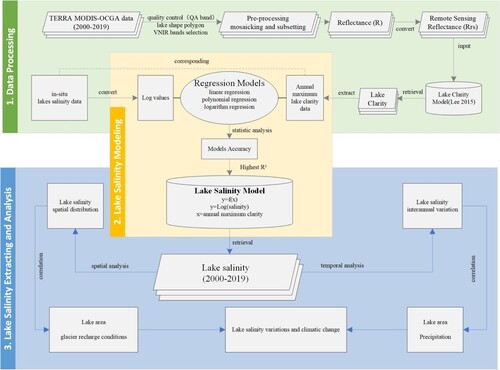
The data and analysis process of this study can be divided into three parts: remote sensing data processing, model establishment, and salinity information extraction and analysis. In data processing, the remotely sensed surface reflectance was provided by the MODIS ocean reflectance product MODIS-OCGA (Vermote and Wolfe Citation2015). Lake range and visible and near-infrared band data extractions were performed to obtain the reflectivity data required for this study. The spatial resolution of MODIS-OCGA was 1 km × 1 km, and at least one image was obtained daily from Terra. Data quality was ensured via calibration, quality assurance, and validation (Nightingale, Nickeson, and Justice Citation2008). The corresponding quality assessment data band (QA band) information was used to eliminate low-quality data caused by clouds, cloud shadows, and pixel noise. The surface reflectance data obtained from MODIS-OCGA were converted to fit remote sensing reflectance. A comparison of the measured and satellite data indicated that the blue to green wavelengths of the MODIS-OCGA product has a high precision in displaying TP lakes (Liu et al. Citation2021a). This study processed the remote sensing data using the Google Earth Engine (Gorelick et al. Citation2017).
In establishing the salinity model, an inverse relationship was established based on the measured salinity data of the lake and the corresponding annual maximum of lake clarity. Linear, logarithmic, and polynomial regressions were used to obtain the relationship between the annual maximum of clarity and the measured salinity. The statistical accuracy parameters were obtained, and the model with the highest R² was selected to determine the salinity inversion model in this study.
In the process of salinity information extraction and analysis, the salinity inversion model established in the previous step was used to obtain images of the salinity of 152 lakes on the TP from 2000 to 2019. The annual maximum clarity values of 152 lakes were calculated and input into the salinity inversion model, then outputting the inter-annual salinity values for each lake. The spatial distribution characteristics of lake salinity and the characteristics of inter-annual variation were analyzed on this basis. The relationship between lake salinity change and climate change was further analyzed by combining lake area, glacier recharge conditions, and precipitation data ().
Figure 2. Remote sensing data processing, modeling, salinity extraction, and analysis flowchart.
3.4. Lake water clarity (SD) data
In this study, the semi-analytical retrieval model proposed by Lee et al. (Citation2015) was used to derive SD from remote sensing data. This model was established based on an optical radiation transmission model of the water body, and its effectiveness has been verified in several studies (Rodrigues et al. Citation2017; Tiwari et al. Citation2018) and our previous study wherein R² = 0.89 in the TP (Liu et al. Citation2021a). SD is calculated using input parameters that can be obtained from remote sensing data or regarded as constants. As one of the key parameters in this model, was obtained using the widely used quasi-analytical algorithm (QAA) method; the original version was used because it was most appropriate for evaluating clear and oligotrophic waters (Lee, Carder, and Arnone Citation2002). In this study, we constructed the quantitative relationship between the lake salinity and the annual maximum lake clarity because the clarity value is an essential optical parameter, and the annual maximum value contains less information on the other optical components in lake water.
3.5. Statistical analysis and model accuracy assessment
Statistical analysis was performed using IBM SPSS Statistics 22 and OriginPro 9.1 for Windows. Pearson’s product-moment correlation or Spearman rank correlation coefficients (r) were calculated, with student t-tests (t-test, two-tailed) applied to obtain the level of significance (p-value). The ordinary least squares (OLS) was applied for the change rates (the slope of OLS regression) that were calculated as the trend, using a t-test to determine whether the slope differed significantly from zero.
The accuracy of the salinity model was evaluated by comparing the predicted and measured salinity with statistical parameters. The comparison was expressed in terms of coefficient of determination (R2) and root mean square error (RMSE); the 95% confidence intervals (CI) and prediction intervals (PI) were also determined. The R² and RMSE are computed as follows:
(1)
(1)
(2)
(2) where n is the number of observations, xobs,i is the observed value of salinity,
obs,i is the average of the observed values, and xmod,i is the predicted salinity value.
4. Results
4.1. Retrieval model of lake salinity based on optical remote sensing features
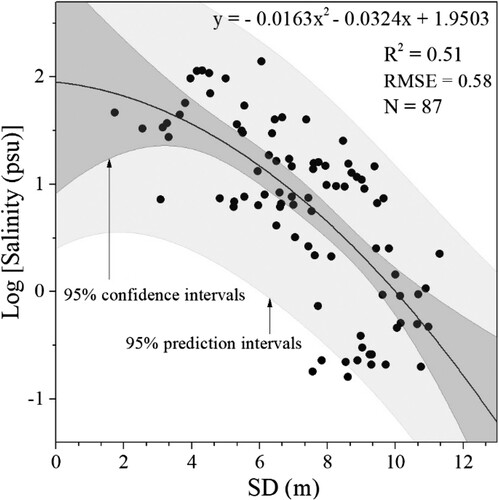
Although the lake water color changes with dissolved mineral density, it also varies with dissolved mineral types. However, total lake salinity has a close relation with lake water plankton (Lin et al. Citation2017), which is linked to optical remote sensing retrieve parameters such as CDOM or water clarity. Therefore, the lake salinity retrieval model based on the correlation between the in-situ lake salinity data (N = 87) and the MODIS-calculated clarity data (SD value) was determined in this study. In data processing and salinity model establishment, we obtained the lake clarity data (SD value) based on the universal lake clarity model. Further, we calculated the SD value of the daily clarity of the lakes. Then the annual maximum values were selected to be correlated with the in-situ salinity data. The results show a significant correlation between the in-situ salinity of the lakes and the corresponding annual maximum SD values. The higher the SD value, the lower the salinity of the lake, and vice versa. The relationship between the lake salinity and clarity values was further fitted using the statistical model (). The results showed that the polynomial has a better fit (R² = 0.51, p < 0.01) with an increasingly stable response to avoid extreme values. Therefore, the polynomial quasi-formula (EquationEquation 3(3)
(3) ) was used as the salinity retrieval model in this study region.
(3)
(3) where SDmax is the annual maximum value of lake clarity.
Figure 3. Relationship between the measured salinity of the lake and the maximum clarity (SD value) in the corresponding year.
4.2. Variation characteristics of lake salinity
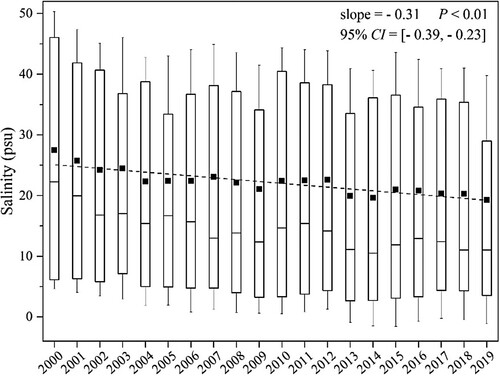
The interannual salinity values for 152 lakes greater than 50 km2 on the TP were obtained based on the salinity inversion model (EquationEquation 3(3)
(3) ) with inputting annual maximum clarity values calculated from remote sensing data between 2000 and 2019. Then we analyzed the interannual variation characteristics of lake salinity. (). In general, the salinity showed a significant decreasing trend (p < 0.01) from 2000 to 2019. The average salinity in 2000 was 27.5 psu, and in 2019 it decreased to 19.3 psu. Although there was a slight increase in some individual stages during this period, the overall trend was a significant step-like decrease, with a decline rate of −0.31 psu/year (95% CI: −0.39–−0.23). Among them, the first rapid decline stage occurred in 2000–2004, with salinity values dropping from 27.5 psu to 22.3 psu (p < 0.01, mean comparison t-test); in 2004–2007, the lake salinity was relatively stable. In 2007–2012, the lake salinity first decreased and then increased, then dropped to 20.0 psu in 2013 (p < 0.01, t-test for mean comparison); from 2014 to 2015, the lake salinity increased slightly and then decreased slightly to 2019. The standard deviation of lake salinity in each year is similar, and there is no sizable interannual change. This was consistent with the mean value trend, showing that the decline in lake salinity is an overall trend rather than signaling the dominance of several individual lakes.
Figure 4. Changes in retrieval values of salinity of 152 lakes of greater than 50 km2 on the Tibetan Plateau from 2000 to 2019.
5. Discussion
5.1. Optical characteristics of different salinity solutions
Understanding the optical characteristics of salinity solutions is vital in constructing the relationship between lake salinity and optical remote sensing data. In the 1970s, an investigation of lakes on the TP clearly described the differences in water color between lakes with different salinities (Guan, Chen, and Qu Citation1984). However, this study was limited to qualitative visual descriptions owing to limitations in research conditions. Afterwards, no additional in-depth quantitative research was carried out. Relevant studies have investigated the optical difference between pure fresh water and seawater (Morel Citation1974; Smith and Baker Citation1981). However, such studies, especially those with detailed discussions of the optical characteristics of water bodies with different salinity, were rarely published in the following decades.
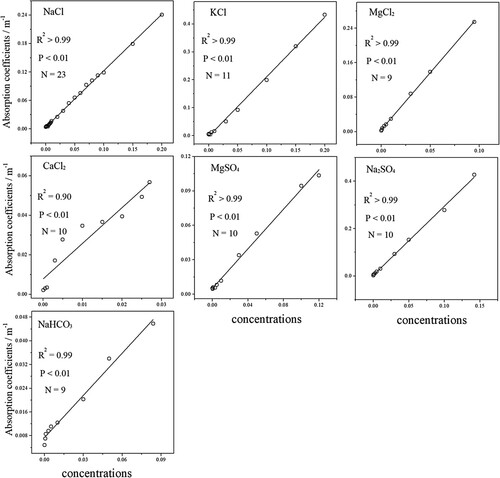
To explore the optical characteristics of water bodies with different salinities, we analyzed the optical characteristics of standard water samples with different ion concentrations to obtain optical parameters of water bodies with different salinities. Absorbance measurements were obtained for different types of ion solutions with different concentrations. shows that the absorbance of different ionic solutions is positively correlated with the ion concentration. A high salinity solution generally shows a high absorbance, and vice versa. This further describes the quantitative relationship between the ion concentration and absorption coefficient. The correlation between different types of ion concentrations and the absorption coefficient was very high (R² > 0.9), further indicating a robust linear relationship between the two factors.
Figure 5. Absorbance characteristics of different concentrations of inorganic salt solutions based on laboratory standard control measurement.
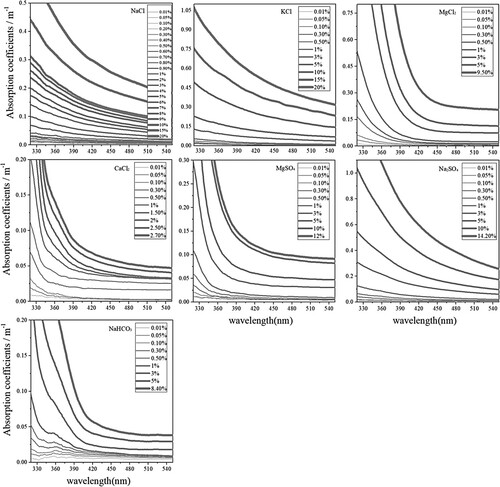
shows that there were also specific differences in the absorption coefficient curves of different ionic solutions. These differences are mainly reflected in the change in the slope of the absorption curve at different wavelengths. For example, the absorption coefficient of the NaCl solution showed a apparent downward trend with an increase in wavelength, whereas the change trend of the MgSO4 solution was relatively gentle. The absorbance ratios of NaCl, KCl, and Na2SO4 solutions in the blue–green band changed significantly with the ion concentration with a positive correlation. The higher the ion concentration, the greater the difference in the absorption coefficient of the blue–green band. However, the changing characteristics of the remaining solutions were relatively weak and did not show a significant trend. All the ionic solutions exhibited stronger optical absorption with increased ion concentration. Concurrently, with an increase in ion concentration, the absorption of blue light wavelengths in some solutions was more significant than that of green light wavelengths.
Figure 6. Relationship between absorption coefficients (average in 400–550 nm) and concentration of different inorganic salt solutions.
Although pure mineral solution does not contain sediment, plankton, or suspended matter, the difference in optical properties among different mineral solutions with varying densities provides a reference and theoretical basis for remote sensing inversions of lake salinity.
5.2. Spatial variations in lake salinity
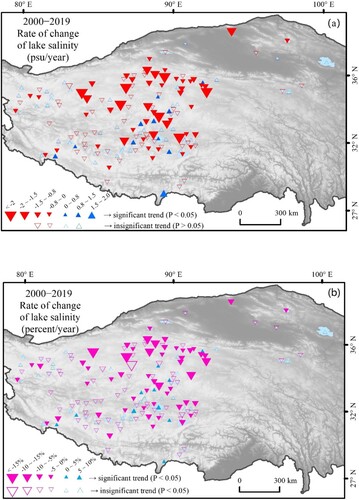
presents the interannual variation and spatial distribution of lake salinity in the 152 studied lakes. From 2000 to 2019, there were more lakes with a decreasing trend in salinity than those with an increasing trend. Among them, 53 lakes showed a statistically significant downward trend (p < 0.05), accounting for 35% of all lakes, and only 11 lakes showed a statistically significant upward trend (p < 0.05), accounting for 7% of all lakes. Most of the lakes showed a significant decrease of −2–0 psu/year, but some lakes also decreased with a rate of faster than −2 psu/year. For lakes with a significant increase in salinity, the increase rates were generally lower than 1.5 psu/year, and only a few lakes increased by more than 1.5 psu/year, with none higher than 2.0 psu/year. The change range of lakes with decreasing salinity was mainly between −10% and 0%/year, and for some lakes, it was faster than −10%/year. The salinity values of lakes with rising salinity were mostly below 5%/year, and those of individual lakes were between 5%–10%/year. In addition, from the perspective of the spatial distribution of multi-year salinity changes, the lakes with significant salinity changes were mainly concentrated in the central and northern parts of the plateau. In contrast, the western, southern, and eastern lakes showed no significant changes.
Figure 7. Spatial distribution of interannual changes (psu value and percent value) in retrieved salinity from 2000 to 2019 in 152 lakes with an area greater than 50 km2 on the Tibetan Plateau.
5.3. Lake salinity variations and climatic change
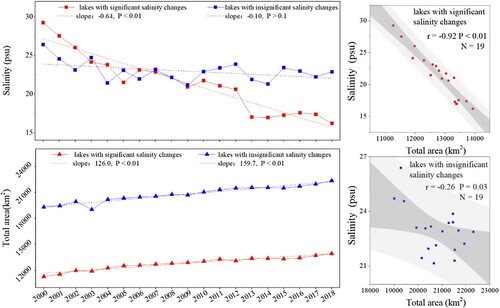
The lake area within the TP has shown a significant expansion trend in recent decades, associated increases or decreases in lake area represent the manifestation of lake water volume change (Lhakpa et al. Citation2022; Qiao and Zhu Citation2017; Yang et al. Citation2017; Zhu et al. Citation2017; Zhu, Xie, and Wu Citation2010c; G. Zhang et al. Citation2020; G. Q. Zhang et al. Citation2019; Citation2021). Changes in lake water volume may directly affect changes in lake salinity. Therefore, this study analyzed the relationship between lake salinity and area and its interannual variation. compares the average salinity of lakes and the change in total lake area on the TP from 2000 to 2019. The results showed a statistically significant negative correlation between lake salinity and lake area (R2 = 0.17, p < 0.01), indicating that the salinity of plateau lakes was generally affected by the lake size. Specifically, lakes with relatively large areas had a relatively low salinity, whereas those with relatively small areas had a relatively high salinity. compares the interannual salinity changes of lakes on the TP from 2000 to 2018 and the corresponding changes in the total lake area. The total area of the lakes showed an obvious trend of expansion. However, the correlation between salinity and the area of lakes with significant salinity changes (r = −0.92, p < 0.01) was significantly stronger than that of lakes with insignificant changes in salinity (r = −0.26, p = 0.03). This indicates that in the lakes whose salinity decreased significantly, the changes in salinity were more obviously controlled by the changes in lake water volume. Hence, the change in lake salinity on the TP was significantly related to the change in lake water volume, and an increase in lake water volume could lead to a decline in lake salinity.
Figure 8. Relationship between retrieved salinity and lake area (converted to a log value for improved visualization).
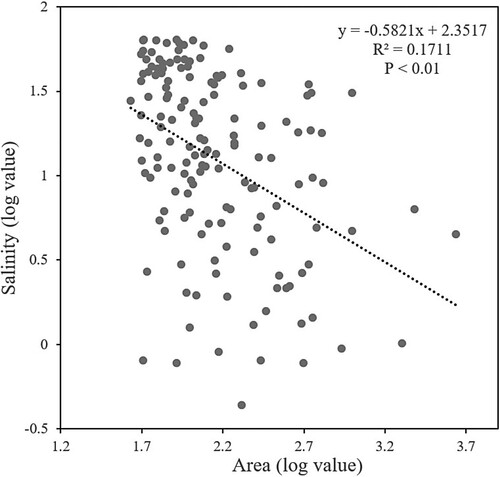
Figure 9. Relationship between interannual change in retrieved salinity data (divided into significant/insignificant changes in lakes) and interannual change in lake area on the Tibetan Plateau.
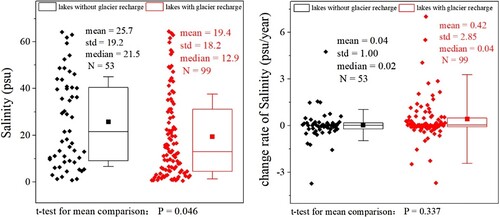
To investigate the relationship between lake salinity and glacier recharge conditions, compares lake salinity under different glacier recharge conditions in the study area. We calculated the average salinity values (152 lakes from 2000 to 2019), and the interannual change rate correspond to the two types of lakes recharged by glaciers and those not recharged by glaciers (or are slightly affected by glaciers). There was a significant difference between the two groups of lakes in different glacier recharge conditions. The average salinity of lakes recharged by glaciers was 19.4 ± 18.2 psu, and that of lakes without glacier recharge was 25.7 ± 19.2 psu; the latter was significantly higher than the former (p < 0.05). Concurrently, the average interannual change rate of salinity corresponding to lakes recharged by glaciers was 0.42 ± 2.85 psu, and that corresponding to lakes without glacier recharge was 0.04 ± 1.00 psu. There was no statistically significant difference between them (p > 0.05). This shows that the distribution of glaciers on the TP specifically influenced the distribution of lake salinity. Owing to the replenishment of fresh water from glaciers, the salinity of lakes with glacial water reception was relatively low. By contrast, lakes without glacial water showed a relatively high salinity, but this effect was not apparent in the interannual rate of change in lake salinity. Therefore, this study concludes that the distribution of glaciers significantly influenced the average salinity value for several years in a relatively stable state.
Figure 10. Comparison of changes in salinity and salinity of lakes between glacier recharge and non-recharge regions.
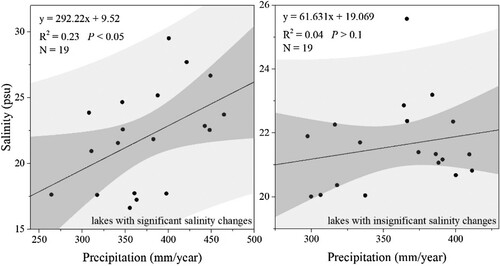
Precipitation is a key element of climate change and an essential factor affecting lake changes. This study further analyzed the relationship between the interannual variation of lake salinity from 2000 to 2018 and corresponding precipitation rates. Based on the salinity change of the 152 lakes studied from 2000 to 2018, the lakes were divided into significant and non-significant lake groups, we analyzed the relationship between the average salinity values of the two and the corresponding lake basin precipitation. During 2000–2018, for the lakes with significant salinity changes, both salinity and the precipitation showed a significant downward trend (p < 0.01), and the interannual data showed that there was a significant correlation between the two (R² = 0.23, p < 0.05) (). However, for lakes with insignificant changes in salinity, the corresponding precipitation values did not show a significant trend (p > 0.1), and the interannual data showed that there was insignificant correlation between the two (R² = 0.04, p > 0.1). These results show that decreased lake salinity was accompanied by decreased (but not increased)precipitation in the lake basin. Therefore, we conclude that the decreasing trend in lake salinity on the TP was not directly affected by the precipitation in the lake basin but was potentially dominated by the lake area, which was controlled by lake water volume.
Figure 11. Relationship between interannual changes in salinity and precipitation of 152 studied lakes with an area greater than 50 km2 on the Tibetan Plateau in 2000–2019.
6. Conclusions
This study established a retrieval model for lake salinity on the TP (R² = 0.51, p < 0.01) using optical remote sensing data based on measured salinity data (N = 87) and MODIS-derived annual maximum lake water clarity (SD values) data. Then, this model was used to analyze the temporal characteristics of lake salinity on the TP. There was a significant decreasing trend in lake salinity between 2000 and 2019 (p < 0.01). The lakes with significant salinity changes were mainly concentrated in the central and northern parts of the plateau. By contrast, the salinity changes of lakes in the western, southern, and eastern parts of the plateau were generally not significant. The optical characteristics of different salinity solutions based on laboratory analysis showed that the absorption coefficients of ionic solutions were generally positively correlated with the concentration at different wavelengths, indicating the existing optical diversity of different water salinity. The spatial variation of lake salinity was negatively correlated with lake area changes. The decreasing trend of lake salinity on the TP was not directly affected by the precipitation, which showed a decreasing trend, but was potentially dominated by the expanding lake area, which was controlled by lake water volume.
Disclosure statement
No potential conflict of interest was reported by the author(s).
Data availability statement
The data that support the findings of this study are available from the corresponding author upon reasonable request.
Additional information
Funding
References
- Bai, Y., D. L. Pan, W. J. Cai, X. Q. He, D. F. Wang, B. Y. Tao, and Q. K. Zhu. 2013. “Remote Sensing of Salinity from Satellite-derived CDOM in the Changjiang River Dominated East China Sea.” Journal of Geophysical Research-Oceans 118 (1): 227–243. https://doi.org/10.1029/2012JC008467.
- Cai, Y., C. Q. Ke, X. G. Li, G. Q. Zhang, Z. Duan, and H. Lee. 2019. “Variations of Lake Ice Phenology on the Tibetan Plateau From 2001 to 2017 Based on MODIS Data.” Journal of Geophysical Research-Atmospheres 124 (2): 825–843. https://doi.org/10.1029/2018JD028993.
- Ferrari, G. M., and M. D. Dowell. 1998. “CDOM Absorption Characteristics with Relation to Fluorescence and Salinity in Coastal Areas of the Southern Baltic Sea.” Estuarine, Coastal and Shelf Science 47 (1): 91–105. https://doi.org/10.1006/ecss.1997.0309.
- Gorelick, N., M. Hancher, M. Dixon, S. Ilyushchenko, D. Thau, and R. Moore. 2017. “Google Earth Engine: Planetary-scale Geospatial Analysis for Everyone.” Remote Sensing of Environment 202:18–27. https://doi.org/10.1016/j.rse.2017.06.031.
- Guan, Z. H., C. Y. Chen, and Y. X. Qu. 1984. Rivers and Lakes of Xizang (Tibet) [in Chines]. Beijing: Science Press.
- Guo, Y., Y. Zhang, and N. Ma. 2019. “Long-term Changes in Evaporation Over Siling Co Lake on the Tibetan and its Impact on Recent Rapid Lake Expansion.” Atmospheric Research 216: 141–150. https://doi.org/10.1016/j.atmosres.2018.10.006.
- Guo, L. A., H. X. Zheng, Y. H. Wu, L. X. Fan, M. X. Wen, J. S. Li, F. F. Zhang, L. P. Zhu, and B. Zhang. 2022. “An Integrated Dataset of Daily Lake Surface Water Temperature Over the Tibetan Plateau.” Earth System Science Data 14 (7): 3411–3422. https://doi.org/10.5194/essd-14-3411-2022.
- Harvey, E. T., S. Kratzer, and A. Andersson. 2015. “Relationships between Colored Dissolved Organic Matter and Dissolved Organic Carbon in Different Coastal Gradients of the Baltic Sea.” Ambio 44 (S3): S392–S401. https://doi.org/10.1007/s13280-015-0658-4.
- Huang, L., J. B. Wang, L. P. Zhu, J. T. Ju, and G. Daut. 2017. “The Warming of Large Lakes on the Tibetan Plateau: Evidence from a Lake Model Simulation of Nam Co, China, during 1979–2012.” Journal of Geophysical Research-Atmospheres 122 (24): 13095–13107. https://doi.org/10.1002/2017JD027379.
- Lee, Z. P., K. L. Carder, and R. A. Arnone. 2002. “Deriving Inherent Optical Properties from Water Color: A Multiband Quasi-analytical Algorithm for Optically Deep Waters.” Applied Optics 41 (27): 5755–5772. https://doi.org/10.1364/AO.41.005755.
- Lee, Z. P., S. L. Shang, C. M. Hu, K. P. Du, A. Weidemann, W. L. Hou, J. F. Lin, and G. Lin. 2015. “Secchi Disk Depth: A New Theory and Mechanistic Model for Underwater Visibility.” Remote Sensing of Environment 169:139–149. https://doi.org/10.1016/j.rse.2015.08.002.
- Lhakpa, D., Y. Qiu, P. Lhak, L. Shi, M. Cheng, and B. Cheng. 2022. “Long-term Records of Glacier Evolution and Associated Proglacial Lakes on the Tibetan Plateau (1976‒2020).” Big Earth Data 6 (4): 435–452. https://doi.org/10.1080/20964471.2022.2131956.
- Lin, Q. Q., L. Xu, J. Z. Hou, Z. W. Liu, E. Jeppesen, and B. P. Han. 2017. “Responses of Trophic Structure and Zooplankton Community to Salinity and Temperature in Tibetan Lakes: Implication for the Effect of Climate Warming.” Water Research 124:618–629. https://doi.org/10.1016/j.watres.2017.07.078.
- Liu, C., L. P. Zhu, J. S. Li, J. B. Wang, J. T. Ju, B. J. Qiao, Q. F. Ma, and S. L. Wang. 2021a. “The Increasing Water Clarity of Tibetan Lakes Over Last 20 Years According to MODIS Data.” Remote Sensing of Environment 253:15. https://doi.org/10.1016/j.rse.2020.112199.
- Liu, C., L. P. Zhu, J. B. Wang, J. T. Ju, Q. F. Ma, B. J. Qiao, Y. Wang, et al. 2021b. “In-situ Water Quality Investigation of the Lakes on the Tibetan Plateau.” Science Bulletin 66 (17): 1727–1730. https://doi.org/10.1016/j.scib.2021.04.024.
- Liu, C., L. P. Zhu, J. B. Wang, B. J. Qiao, J. T. Ju, and L. Huang. 2017. “Remote Sensing Based Estimation of Lake Water Clarity on the Tibetan Plateau” [in Chinese]. Progress Geography 36 (5): 597–609. https://doi.org/10.18306/dlkxjz.2017.05.007.
- Mitamura, O., Y. Seike, K. Kondo, N. Goto, K. Anbutsu, T. Akatsuka, M. Kihira, T. Qung, and T. M. Nishimura. 2003. “First Investigation of Ultraoligotrophic Alpine Lake Puma Yumco in the Pre-Himalayas, China.” Limnology 4 (3): 167–175. https://doi.org/10.1007/s10201-003-0101-6.
- Morel, A. 1974. “Optical Properties of Pure Water and Pure Sea Water.” In Optical Aspects of Oceanography, edited by N. G. Jerlov and E. S. Nielsen, 1–24. New York: Academic Press.
- Murakami, T., H. Terai, Y. Yoshiyama, T. Tezuka, L. Zhu, T. Matsunaka, and M. Nishimura. 2007. “The Second Investigation of Lake Puma Yum Co Located in the Southern Tibetan Plateau, China.” Limnology 8 (3): 331–335. https://doi.org/10.1007/s10201-007-0208-2.
- Nightingale, J., J. Nickeson, and C. Justice. 2008. “Global Validation of EOS Land Products, Lessons Learned and Future Challenges: A MODIS Case Study.” In Proceedings of 33rd International Symposium on Remote Sensing of Environment: Sustaining the Millennium Development Goals, Stresa, Italy. http://landval.gsfc.Nasa.gov/pdf/ISRSE_Nightingale.pdf.
- Qiao, B. J., and L. P. Zhu. 2017. “Difference and Cause Analysis of Change in Lakes of Different Supply Types in the Northwestern Tibetan Plateau.” Hydrological Processes 31 (15): 2752–2763. https://doi.org/10.1002/hyp.11215.
- Qiu, Y., P. Xie, M. Leppäranta, X. Wang, J. Lemmetyinen, H. Lin, and L. Shi. 2019. “MODIS-based Daily Lake Ice Extent and Coverage Dataset for Tibetan Plateau.” Big Earth Data 3 (2): 170–185. https://doi.org/10.1080/20964471.2019.1631729.
- Rodrigues, T., E. Alcantara, F. Watanabe, and N. Imai. 2017. “Retrieval of Secchi Disk Depth from a Reservoir Using a Semi-analytical Scheme.” Remote Sensing of Environment 198:213–228. https://doi.org/10.1016/j.rse.2017.06.018.
- Sanderson, E. W., M. Jaiteh, M. A. Levy, K. H. Redford, A. V. Wannebo, and G. Woolmer. 2002. “The Human Footprint and the Last of the Wild.” Bioscience 52 (10): 891–904. https://doi.org/10.1641/0006-3568(2002)052[0891:THFATL]2.0.CO;2.
- Smith, R. C., and K. S. Baker. 1981. “Optical-properties of the Clearest Natural-Waters (200–800 nm).” Applied Optics 20 (2): 177–184. https://doi.org/10.1364/AO.20.000177.
- Song, K. S., M. Wang, J. Du, Y. Yuan, J. H. Ma, M. Wang, and G. Y. Mu. 2016. “Spatiotemporal Variations of Lake Surface Temperature across the Tibetan Plateau Using MODIS LST Product.” Remote Sensing 8 (10): 20. https://doi.org/10.3390/rs8100854.
- Tiwari, S. P., Y. V. B. Sarma, B. Kurten, M. Ouhssain, and B. H. Jones. 2018. “An Optical Algorithm to Estimate Downwelling Diffuse Attenuation Coefficient in the Red Sea.” Ieee Transactions on Geoscience and Remote Sensing 56 (12): 7174–7182. https://doi.org/10.1109/TGRS.2018.2849026.
- Vermote, E., and R. Wolfe. 2015. “MODOCGA MODIS/Terra Ocean Reflectance Daily L2G-Lite Global 1 km SIN Grid V006.” NASA EOSDIS Land Processes DAAC.
- Wang, D. 2005. .“The Geography of Aquatic Vascular Plants of Qinghai-Xizang (Tibet) Plateau.” [Ph. D thesis] [in Chinese]. Wuhan University, Wuhan. https://kns.cnki.net/KCMS/detail/detail.aspx?dbname=CDFD9908&filename=2004111412.nh.
- Wang, J. B., J. T. Ju, and L. P. Zhu. 2013. “Water Chemistry Variations of Lake and Inflowing Rivers between Pre- and Post-monsoon Season in Nam Co, Tibet” [in Chines]. Scientia Geographica Sinica 33 (1): 90–96. https://doi.org/10.13249/j.cnki.sgs.2013.01.90.
- Wang, X., Y. Qiu, Y. Zhang, J. Lemmetyinen, B. Cheng, W. Liang, and M. Leppäranta. 2022. “A Lake Ice Phenology Dataset for the Northern Hemisphere Based on Passive Microwave Remote Sensing.” Big Earth Data 6 (4): 401–419. https://doi.org/10.1080/20964471.2021.1992916.
- Yang, R. M., L. P. Zhu, J. B. Wang, J. T. Ju, Q. F. Ma, F. Turner, and Y. Guo. 2017. “Spatiotemporal Variations in Volume of Closed Lakes on the Tibetan Plateau and their Climatic Responses from 1976 to 2013.” Climatic Change 140 (3–4): 621–633. https://doi.org/10.1007/s10584-016-1877-9.
- Yao, T. D. 2019. “Tackling on Environmental Changes in Tibetan Plateau with Focus on Water, Ecosystem and Adaptation.” Science Bulletin 64 (7): 417–417. https://doi.org/10.1016/j.scib.2019.03.033.
- Yao, Z. J., R. Wang, Z. F. Liu, S. S. Wu, and L. G. Jiang. 2015. “Spatial-temporal Patterns of Major Ion Chemistry and its Controlling Factors in the Manasarovar Basin, Tibet.” Journal of Geographical Sciences 25 (6): 687–700. https://doi.org/10.1007/s11442-015-1196-5.
- Zaitseva, A. F., I. V. Konyukhov, and Y. V. Kazimirko. 2018. “Optical Characteristics and Distribution of Chromophoric Dissolved Organic Matter in Onega Bay (White Sea) during the Summer Season (Findings from an Expedition from June 22 to 26, 2015).” Oceanology 58 (2): 233–239. https://doi.org/10.1134/S0001437018020169.
- Zhang, G. Q., T. Bolch, W. F. Chen, and J. F. Crétaux. 2021. “Comprehensive Estimation of Lake Volume Changes on the Tibetan Plateau during 1976–2019 and Basin-wide Glacier Contribution.” Science of the Total Environment 772:145463. https://doi.org/10.1016/j.scitotenv.2021.145463.
- Zhang, Q. G., S. C. Kang, F. Y. Wang, C. L. Li, and Y. W. Xu. 2008. “Major Ion Geochemistry of Nam Co Lake and its Sources, Tibetan Plateau.” Aquatic Geochemistry 14 (4): 321–336. https://doi.org/10.1007/s10498-008-9039-y.
- Zhang, G. Q., W. Luo, W. F. Chen, and G. X. Zheng. 2019. “A Robust But Variable Lake Expansion on the Tibetan Plateau.” Science Bulletin 64 (18): 1306–1309. https://doi.org/10.1016/j.scib.2019.07.018.
- Zhang, G. Q., M. M. Wang, T. Zhou, and W. F. Cheng. 2022. “Progress in Remote Sensing Monitoring of Lake Area, Water Level, and Volume Changes on the Tibetan Plateau.” National Remote Sensing Bulletin 26 (1): 115–121. https://doi.org/10.11834/jrs.20211171.
- Zhang, G. Q., T. D. Yao, H. J. Xie, J. Qin, Q. H. Ye, Y. F. Dai, and R. F. Guo. 2014. “Estimating Surface Temperature Changes of Lakes in the Tibetan Plateau Using MODIS LST Data.” Journal of Geophysical Research-Atmospheres 119 (14): 8552–8567. https://doi.org/10.1002/2014JD021615.
- Zhang, G., T. Yao, H. Xie, K. Yang, L. P. Zhu, C. K. Shum, T. Bolch, et al. 2020. “Response of Tibetan Plateau Lakes to Climate Change: Trends, Patterns, and Mechanisms.” Earth-Science Reviews 208:103269. https://doi.org/10.1016/j.earscirev.2020.103269.
- Zhu, L. P., J. T. Ju, B. J. Qiao, R. M. Yang, C. Liu, and B. P. Han. 2019. “Recent Lake Changes of the Asia Water Tower and their Climate Response: Progress, Problems and Prospects” [in Chines]. Chinese Science Bulletin 64 (27): 2796–2806. https://doi.org/10.1360/TB-2019-0185.
- Zhu, L. P., J. T. Ju, J. B. Wang, M. P. Xie, M. Nishimura, T. Matsunaka, and H. Terai. 2010a. “Further Discussion about the Features of Lake Puma Yum Co, South Tibet, China.” Limnology 11 (3): 281–287. https://doi.org/10.1007/s10201-010-0313-5.
- Zhu, L. P., J. T. Ju, Y. Wang, M. P. Xie, J. B. Wang, P. Peng, X. L. Zhen, and X. Lin. 2010b. “Composition, Spatial Distribution, and Environmental Significance of Water Ions in Pumayum Co Catchment, Southern Tibet.” Journal of Geographical Sciences 20 (1): 109–120. https://doi.org/10.1007/s11442-010-0109-x.
- Zhu, L. P., P. Peng, G. Q. Zhang, B. J. Qiao, C. Liu, R. M. Yang, and J. B. Wang. 2020. “The Role of Tibetan Plateau Lakes in Surface Water Cycle Under Global Changes” [in Chines]. Journal of Lake Science 32 (3): 597–608. https://doi.org/10.18307/2020.0301.
- Zhu, L. P., B. J. Qiao, R. M. Yang, C. Liu, J. B. Wang, and J. T. Ju. 2017. “New Recognition of Water Storages and Physicochemical Property of the Lakes on the Tibetan Plateau” [in Chines]. Chinese Journal of Nature 39 (3): 166–172. https://doi.org/10.3969/j.issn.0253-9608.2017.03.002.
- Zhu, L. P., M. P. Xie, and Y. H. Wu. 2010c. “Quantitative Analysis of Lake Area Variations and the Influence Factors from 1971 to 2004 in the Nam Co Basin of the Tibetan Plateau.” Chinese Science Bulletin 55:1294–1303. https://doi.org/10.1007/s11434-010-0015-8.