
ABSTRACT
Based on the two most recent assessments of Chinese higher plants in 2013 and 2020, of 34,450 and 39,330 species, respectively, we analysed the threatened status of Chinese higher plants. In 2020, around 4,088 (10.39%) of the assessed species in China are threatened, 2,875 (7.31%) Near Threatened, 27,593 (70.16%) not currently threatened and categorised as Least Concern and 4,752 (12.08%) categorised as Data Deficient. While in 2013, 3,767 (10.93%) of the assessed higher plants in China are threatened, 2,723 (7.90%) Near Threatened, 24,296 (70.53%) Least Concern and 3,612 (10.48%) Data Deficient. Estimates of the Red List Index in the two years show different patterns when using different weighting methods with the equal steps weighting method showing a slight decrease (0.91675–0.91495) and the extinction risk weighting method showing a slight increase (0.98792–0.98797). We inferred that China’s threatened plant species were likely / relatively effectively protected. However, attention should also be given to the non-threatened species in the future as an additional strategy for their conservation, to maintain their non-threatened status.
1. Introduction
1.1 The Chinese assessments
The International Union for Conservation of Nature (IUCN) Red List of Threatened Species (hereafter IUCN Red List) is a compilation of species assessments in which species are assigned to categories based on criteria including population size, structure, geographic range and trends (IUCN Citation2012). The IUCN Red List is central to biodiversity conservation (Cazalis et al. Citation2022) and is also used in other contexts, for example, in the identification of High Conservation Value areas in forestry or agricultural systems (Texier et al. Citation2021).
In 1991, Chinese experts published the China Plant Red Data Book: Rare and Endangered Plants Volume 1 (Fu and Jin Citation1991) which includes 388 species and was the first attempt to assess large numbers of plant species that occur in China. Subsequently, applying the Categories and Criteria of the IUCN Red List of Threatened Species (IUCN Citation2001; Citation2012), China conducted three systematic plant assessments. The first assessment preliminarily assessed 4,408 species (Wang and Xie Citation2004). The second and third national assessments fully assessed almost all the higher plants recorded as native to China (Qin Citation2020; Qin and Zhao Citation2017). More recently, assessments of the most important medicinal plants were published (Huang, Zhang, and Qin Citation2022).
1.2 The red list index (RLI)
The Red List Index (RLI) measures change in the extinction risk of species and is a key indicator for tracking progress toward some global biodiversity conservation targets, e.g. Aichi Target 12 on preventing extinctions and conserving species (Raimondo et al. Citation2023). The RLI is recommended by IUCN as an indicator of changes in the threatened status of species (Bubb et al. Citation2009). It is also used as an indicator of progress towards the United Nations Sustainable Development Goals (SDGs). For example, an upward RLI trend would indicate that the SDG Target 15.5 of reducing the degradation of natural habitats and protecting threatened species is on track (https://sdg.data.gov/15-5-1/). To facilitate comparison of biodiversity trends between nations, a disaggregated global RLI for each country has been calculated from selected assessments published on the IUCN Red List (Raimondo et al. Citation2023). National RLIs can also be calculated based on repeated assessments of all species within selected taxonomic groups (Bubb et al. Citation2009; Raimondo et al. Citation2023).
The RLI for seed plants in China was estimated by Mi et al. (Citation2021) using assessments of 3,835 species of angiosperm and gymnosperm, about one tenth of the total Chinese higher plants, based on the assessment results of 2004 and 2013 (Qin and Zhao Citation2017; Wang and Xie Citation2004). The 2013 and 2020 assessments are full assessments of all known native Chinese higher plants which provide not only a more comprehensive overview of the species but also an opportunity to compare the values of RLI over the interval 2013–2020 to see changes to the threat status of plants across the whole of China.
1.3 The threats to plants
The IUCN Threats Classification Scheme (Version 3.3, https://www.iucnredlist.org/resources/threat-classification-scheme), recognises 12 main types of threat. Land and sea use change, followed by direct exploitation of organisms and climate change are considered the main threats across all groups of organisms (Nic Lughadha et al. Citation2020). Climate change is and will continue to be a major challenge for some plants in China (Zhang et al. Citation2014) and also Europe (Thuiller et al. Citation2005), inducing distribution range shifts. Altitudinal range is an indicator for species’ climatic niche (temperature and precipitation). In a Chinese context, altitude can also provide a useful indication of the potential intensity of anthropogenic pressures as human population densities are highest in the southeast of China at lower altitudes (Liu et al. Citation2022).
The aim of this study is to analyse the threat status of Chinese higher plants, their basic distributions, main threats and to eventually provide new insights into how effectively species are protected, which could inform future strategies for species conservation.
2. Materials and methods
2.1. Data sources
The Chinese assessments were conducted within the framework of IUCN methods (IUCN Citation2012). The assessment result of 2013 was from the Chinese government (Ministry of Environmental Protection of the People's Republic of China and Chinese Academy of Sciences Citation2013) released on September 2013 and refined through further research (Qin and Zhao Citation2017). In total, 34,450 species were assessed in 2013. The assessment result of 2020 and the species endemism status was from the Chinese government (Ministry of Ecology and Environment of the People's Republic of China and Chinese Academy of Sciences Citation2023) released on May 2023, the species altitudinal ranges, the distributions of species in Chinese provinces, and the threats of species were mainly from the monographs (Qin Citation2020), Haining Qin’s personal data and the Chinese Virtual Herbarium (https://www.cvh.ac.cn/). In total, 39,330 species were assessed in 2020.
The IUCN assessments of plants distributed in China were searched and downloaded from the official website of IUCN Red List of Threatened Species (www.iucnredlist.org, searched on 11 April 2022). A total of 3,587 assessments for species with native distributions fully / partly in China were downloaded (IUCN Citation2022). The plant names were checked in the R package ‘plantlist’ (Zhang et al. Citation2023).
2.2. Data analysis
Basic statistics were conducted for threatened species numbers, their distribution in each province of China and at each altitudinal interval. Based on the altitudinal range information of threatened species, the altitude intervals were classified as ≤1,000 m, 1,000 m-2,000 m, 2,000 m-3,000 m, and above 3,000 m. Species occurs in each interval was summed. Threats were classified according to the IUCN scheme ().
Table 1. IUCN threats classification scheme (Version 3.3).
The RLI was calculated according to the recommended method of IUCN (Bubb et al. Citation2009; Butchart et al. Citation2004; Citation2007). Species which had been assessed in 2013 and again in 2020 were included. Species not assessed in both years were excluded from the analysis. Two alternative weighting schemes were used to calculate the RLI: equal steps weights and extinction risk weights () (Butchart et al. Citation2007).
Table 2. The IUCN Red List and two types of weights.
Changes of species status were influenced not only by the species situations alone, but also the information available. Only genuine changes in status should be included in the calculation of the RLI. We evaluated what proportion of the assessment results represented genuine changes using a randomly selected sample of 150 species (around 10% of all those for which category changes were reported). We sent the species list to experts and compiled their responses as to whether the changes were genuine or not for 84 species. The file was shared with experts in the IUCN Species Survival Commission China Plant Specialist Group (CPSG) via a URL allowing them to view and edit a shared document simultaneously. The CPSG members had distinct taxonomic and geographic areas of expertise and provided views on those species they were familiar with. In the very few instances where experts disagreed, a short discussion was undertaken to reach a final consensus. See Supporting File (Table S1) for the details. We compared the proportions of changes to higher and lower risk categories considered genuine by the experts using chi-square test.
3. Results
3.1. The assessments of 2013 and 2020
3.1.1. The assessment results
The Chinese assessment of higher plants encompassed 34,450 species assessments in 2013 and 39,330 in 2020. Of these, 32,054 species were assessed in both years, of which 29,829 species were vascular plants, including 217 gymnosperms and 27,909 angiosperms (). In total, 51.5% of these species were endemic to China. The species assessed in both years were analysed in this study.
Table 3. The assessed species and endemic species.
The assessment results of species assessed in both 2013 and 2020 are presented in . In total, there were 3,515 (11.0%) and 3,679 (11.5%) species assessed as threatened, i.e. categorised as Critically Endangered (CR), Endangered (EN), and Vulnerable (VU), in 2013 and 2020, respectively, while 3,819 (11.9%) species were assessed as Data Deficient (DD) in 2013 and 3,534 (11.0%) in 2020. Species categorised as Near Threatened (NT) were 2,549 (7.95%) and 2,565 (8.0%), and Least Concern (LC) 22,121 (69.0%), and 22,256 (69.4%) for 2013 and 2020, respectively.
Of the 50 species assessed as Extinct (EX), Extinct in the wild (EW) or Regional Extinct (RE) in 2013, 34 were rediscovered and assessed in 2020 ( and ). The vast majority of the species, 29,683 (92.6%), were assessed in the same category in these two years (). Omitting the species assessed as DD, 733 species were assessed as less threatened, i.e. above the diagonal line, while 753 species were assessed more threatened, i.e. below the diagonal line ().
Table 4. The assessment results of species assessed in both 2013 and 2020.
Table 5. The transformation matrix of the IUCN Red List categories of species assessed in both 2013 and 2020.
Criterion A was most frequently cited for the threatened species across all major groups in both 2013 and 2020, followed by criteria B, D and C ().
Table 6. The IUCN criteria used of the higher plants assessed in both 2013 and 2020.
3.1.2. The assessed species distributions in China
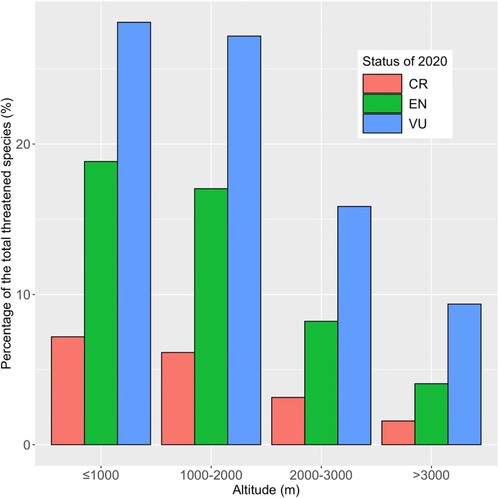
According to the assessment results of 2020 (), about half of the threatened species occurred at altitudes lower than 1,000 m and about 80% of threatened species occurred at altitudes lower than 2,000 m. Only 15% of the threatened species occurred at altitudes higher than 3,000 m.
Figure 1. Altitudinal distributions of threatened species.
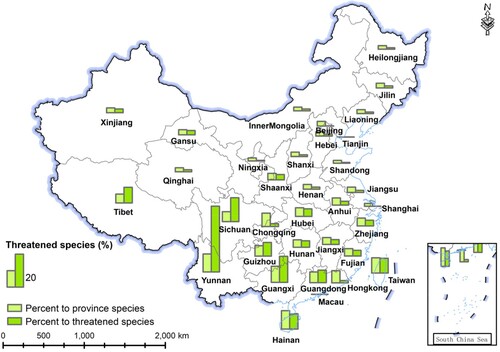
A greater proportion of China’s threatened species occurs in Yunnan province than in any other province, while Guangxi and Sichuan ranked second and third (). In contrast, Hainan is the province with the greatest proportion of its species assessed as threatened, followed by Yunnan and Guangxi.
Figure 2. The percentage of threatened species in each province. The two columns indicate, respectively, the percentage of the species recorded for that province which are assessed as threatened (left) and the proportion of all China’s threatened species which are recorded for that province (right).
3.2. Red list index (RLI)
To determine the true trend of the species status changes, i.e. reliable RLI values, it is necessary to distinguish between category changes resulting from genuine status changes of assessed species between 2013 and 2020, and changes resulting from new knowledge of species status, e.g. new knowledge, taxonomic alteration etc. From our evaluation of the assessment results (Table S1), we found that only 43 of the 84 species whose category changes were reviewed were considered by experts to represent genuine changes (51.2%), and among them, only 13 (30.2%) species had changed to a lower risk category, while 30 (69.8%) species had changed to a higher risk category. Of the 41 (48.8%) species for which category changes were considered by experts to represent change in knowledge rather than genuine change in status, 29 (70.7%) species had changed to a lower risk category, while 12 (29.3%) had changed to a higher risk category. Species assessments reporting an increase in extinction risk were significantly more likely to be confirmed by the experts as representing genuine change than those reporting a decrease in extinction risk (p < 0.05, Table S1). Species assessments reporting a category change indicating a decrease in extinction risk were over-represented among assessments flagged as representing non-genuine change.
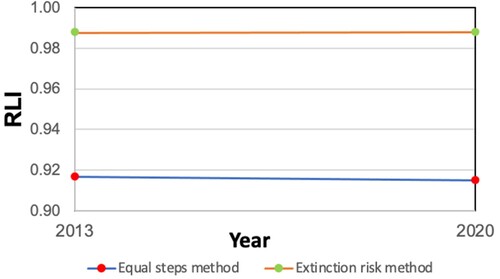
We excluded from our analysis the species assessed as extinct (EX (Extinct), EW (Extinct in the wild) and RE (Regional Extinct)) in 2013 and the species where category change had been judged not to be genuine. Application of the equal steps weighting method resulted in an RLI of higher plants as 0.91675 and 0.91495 in 2013 and 2020, respectively. With the extinction risk weighting method, which gives relatively higher weights to threatened species, the RLIs of higher plants are 0.98792 and 0.98797 in 2013 and 2020, respectively ().
Figure 3. Red List Index (RLI) of 2013 and 2020 for higher plants with equal steps method and extinction risk method.
3.3. Chinese species assessed globally
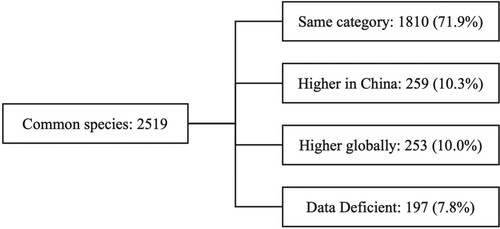
Of the 62,592 global assessments of higher plants published on the IUCN Red List website, 3,587 are assessments of species recorded in China, which were assessed over the period 1998 ∼ 2021. Among these assessments, we found 2,519 for species in the 2020 Chinese assessed species database, including 2,323 angiosperms and 152 gymnosperms. Of these 2,519 species, which were common between the IUCN Red List and the 2020 China assessment, 1,810 (71.9%) species have the same category for the global and Chinese assessment, 259 (10.3%) species have a higher threat status in the Chinese assessment and 253 (10.0%) species have a higher threat status globally; the other 197 (7.8%) species were DD in either IUCN or Chinese assessments ().
Figure 4. The status of species assessed both globally and in China.
There were 11,922 threat records listed for individual species in the 2020 Chinese assessments and 6,934 threat records listed in 2013. The threats cited in 2013 Chinese assessments were mainly Agriculture & aquaculture (2, 29.4%) and Biological resource use (5, 25.7%), followed by Invasive & other problematic species, genes & diseases (8, 10.7%) and Residential & commercial development (1, 8.3%). For the Chinese assessments of 2020, threats of Agriculture & aquaculture (2, 14.3%), Biological resource use (5, 17.6%), Invasive & other problematic species, genes & diseases (8, 0.17%) and Residential & commercial development (1, 5.12%) were less frequently cited than 2013, while Human intrusions & disturbance (6, 16.0%) and Natural system modifications (7, 12.3%) were more frequently cited than 2013. Other options (12, 18.3%) and Transportation & service corridors (4, 11.5%) were also frequently reported in the 2020 Chinese assessments (A).
Figure 5. The percentage of threats of species for China and IUCN. A. the percentage of threats of Chinese assessments in 2013 and 2020; B. the percentage of threats of Chinese assessments in 2020 and IUCN. The threats are: 1. Residential & commercial development, 2. Agriculture & aquaculture, 3. Energy production & mining, 4. Transportation & service corridors, 5. Biological resource use, 6. Human intrusions & disturbance, 7. Natural system modifications, 8. Invasive & other problematic species, genes & diseases, 9. Pollution, 10. Geological events, 11. Climate change & severe weather, 12. Other options.
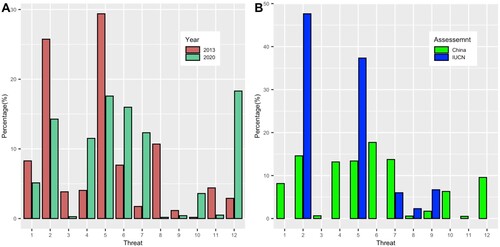
In order to contextualise these results, we also compared the threats reported for species which had assessments in both the 2020 Chinese assessments and global IUCN Red List. 1,412 and 2,611 threat records were listed in the Chinese and global assessments, respectively. For the species common to global assessments and 2020 Chinese assessments, the cited threats in the global assessments were predominantly Agriculture & aquaculture (2, 47.6%) and Biological resource use (5, 37.3%), while in the 2020 Chinese assessments threat citations were more evenly distributed with more than 10% for Agriculture & aquaculture (2), Transportation & service corridors (4), Biological resource use (5), Human intrusions & disturbance (6) and Natural system modifications (7). (B).
4. Discussion
4.1. The Chinese assessments
The Chinese government has paid great attention to species diversity research and conservation. Indeed, hundreds of experts in China were assembled to contribute to the species red list assessment work, from the early China Plant Red Data Book: Rare and Endangered Plants Volume 1 (Fu and Jin Citation1991) in the 1990s, to the latest assessment in 2020 (Qin Citation2020). All known higher plants were assessed in the last two assessments in 2013 and 2020 and as a result, available knowledge of the threatened status of Chinese plants is clearly documented to a much greater extent than previously.
Predictions based on assessments published in the IUCN Red List, but correcting for known biases (over-representation of woody perennials and useful plants and under-representation of single-country endemics) suggest that 39% of all vascular plant species are threatened with extinction (Nic Lughadha et al. Citation2020). For the Chinese assessments of 2020 of the 39,330 species, 4,088 (10.39%) of the higher plants is threatened with CR (602, 1.53%), EN (1,365, 3.47%), VU (2,121, 5.39%). While for the 2013 assessment of the 34,450 species, 3,767 (10.93%) of the higher plants is threatened with CR (583, 1.69%), EN (1,297, 3.76%), VU (1,887, 5.48%). The percentages of threatened species of China are, therefore, much lower than the overall global prediction. The additional information included in the 2020 assessments resulted in a reduction in the percentage of DD species of 0.9% (from 11.9% in 2013 to 11.0% for species assessed both in 2013 and 2020). This represents a substantial contribution by China, a mega-diverse country, to the evaluation and protection of plant diversity globally. Furthermore, half of the Chinese species are endemic to China () which means the Chinese assessments for them are indicative of their global status. The assessment results have been frequently applied in conservation research (Chi et al. Citation2017; Feng et al. Citation2017; Shan et al. Citation2022). Improved documentation of these assessments in an international language, i.e. English, is needed to make this invaluable knowledge available to the international society to further enhance strategies for plant conservation.
Expert evaluation of the Chinese assessment results of 2013 and 2020 presented here shows that around half of the category changes reported are due to knowledge availability rather than genuine change. This means that concrete conclusions could not be drawn in relation to changes in species status between the two assessments. Nevertheless, as the first attempt to analyse the RLI for all Chinese plants, our research is still useful and informative for conservation practitioners and future scientific research.
The disaggregated global RLI of China, calculated by UNEP-WCMC (United Nations Environment Programme – World Conservation Monitoring Centre), and based primarily on mammals, birds, and amphibians, provides one example of an analysis that the China Plant RLI will help to inform. The results showed that the RLI of China declined from 0.824 in 1993 to 0.758 in 2020 at an annual changing rate equating to −0.313% (https://www.bipindicators.net/, https://bipdashboard.natureserve.org/map.html?ind=RedListIndex&iso=CHN, searched in May 2023). This result reveals a greater contribution to increased global extinction risk by Chinese species as compared to our results. The differences may be because of the method itself (Han et al. Citation2017; Raimondo et al. Citation2023), and also the fact that the recent Chinese assessment was not fully reflected in the global dataset and corresponding analysis. Just 20 assessments of Chinese plants were included in the calculation of the disaggregated global RLI for China and all were for cycad species. Globally, cycads are one of the most threatened groups of plants and 66% of the Chinese cycad species which have an assessment on the IUCN Red List are assessed as threatened (IUCN Citation2022). Ensuring that more assessments of Chinese species are published on the IUCN Red list will be vital to reconciling these differences. Given the high proportion of China’s plant species which are endemic, adding more of their assessments to the IUCN Red list should result in increasing convergence of the disaggregated global RLI for China and the National RLI (Raimondo et al. Citation2023), with benefits for science and conservation policy, planning and action on the ground.
4.2. RLI and the implications for conservation
RLI ensures effective target- and contributions- tracking and has potential to provide accurate feedback on a country’s conservation investments. Indeed, it is one of the most commonly proposed indicators for tracking global progress for species conservation (Raimondo et al. Citation2023). Due to the limited data on plant assessments in China, there were very few studies focused on plant RLI, while the RLI is not fully representative, being based on only a subset of species. Zhang and Gao (Citation2016) comprehensively analysed the RLI of both animals and plants of China. Only 162 Chinese endemic plants were included which did not fully represent all documented Chinese plants. Mi et al. (Citation2021) summarised the assessments of China and included 3,835 seed plants and compared the RLI of 2004 and 2013 which is a big step forward, but this is still only accounts for 1 in 10 Chinese plants. Our study included almost all Chinese species of 32,054 in 2013 and 2020 and made the RLI results more comprehensive and representative. The slight decreasing pattern of RLI with the equal steps weighting method suggests a slight decline in populations of plant species occurring in China over the past seven years, especially for species assessed as not threatened. We found that 570 species assessed as LC in 2013 were assessed as threatened in 2020. In contrast, the slight increasing pattern of RLI with the extinction risk weighting method could be interpreted as showing that China’s plant conservation efforts may have halted and even reversed the deterioration of some species assessed as threatened. 112 species assessed as CR in 2013 were assessed in a less threatened category in 2020, as were 174 EN species, and 184 VU species. In contrast, only 86 species assessed as threatened in 2013 were assessed in a more threatened category in 2020. We suggest that besides the threatened species, attention should also be given to the common / non-threatened species in the future conservation planning. This approach aligns with a proposed strategy to prioritise Chinese medicinal plants for conservation, which includes the prioritisation of species not only in threatened categories according to IUCN Red List criteria, but also certain species (one in five) not qualifying as threatened or even near threatened under such criteria (Howes et al. Citation2020). The medicinal plant species in the latter group were still categorised as being of Conservation Concern (CC) either because they are key species with a long history of use in traditional Chinese medicine, or species that are popular and undergoing heavy collection pressure in the wild (Howes et al. Citation2020; Huang, Zhang, and Qin Citation2022). This approach for Chinese medicinal plants, and that which we propose here, is in the context that prioritising species for conservation before they are categorised as threatened (according to IUCN Red List criteria) could be a more effective conservation strategy, rather than waiting until they reach a threatened status. Most of the threatened species (80%) appear at altitudes lower than 2,000 m which is also the area with the higher population density in China. Strategic scientific and economic planning is needed to resolve the conflicting interests between plant conservation and economic development. The fact that the threatened species are located mainly in the southern provinces which have high plant richness may represent good news for effective conservation planning, as nature reserves could protect more species, both threatened and non-threatened in such high diversity regions. Biological resource use is the most-cited threat to plants in Chinese assessments in both 2013 and 2020, but was nonetheless shown to be greatly under-estimated, for example, in the Chinese orchids (Liu et al. Citation2020).
For a robust interpretation of the significance of the category changes analysed here, it would be necessary to evaluate whether each category change is genuine, reflecting an actual change in the status of the species on the ground, rather than resulting from changes in our understanding of the situation. Our results, based on a small expert-evaluated sample, suggest that only about half of the status changes reported are genuine, and that changes to a lower risk category are over-represented among the non-genuine changes. This could be a further reason for the differences between our results and others as discussed above.
Once more non-genuine changes are detected and eliminated from the analysis, the changes to higher risk categories will likely outnumber those to lower risk categories. To determine the genuine situation for plant species in China rather than waiting until they are threatened and require assessment as such, work should be conducted in: (1) Basic data management, for example, building a well-designed database to manage these data and encourage more experts to contribute to the database. (2) Developing better assessment tools and associated training (Bachman et al. Citation2019), for example, the newly developed automated assessment method (Walker et al. Citation2023) and ‘preliminary assessment’ proposed by Ribeiro et al. (Citation2022) could largely speed up the assessment, i.e. tackle the slow and resource-intensive nature of the full assessment process.
Species richness and threatened species richness etc. are very frequently used in nature reserve / national park planning (Lu et al. Citation2022; Zhao et al. Citation2016). However, due to limited data availability, the temporal changes of species and threatened species have been described (Xie Citation2022) but not fully applied in conservation planning and strategy making, except for a limited number of studies. For example, Xia et al. (Citation2022) predicted the future suitable habitat area changes for medicinal plants under climate change as the basis for conservation priority network planning. Such information is also useful in the context that certain useful species, such as medicinal plants, may produce different levels of useful bioactive constituents under climate change (Borrell et al. Citation2020), thus prediction of suitable habitat area changes for species is relevant from both the conservation and human use perspectives.
4.3. Challenges with the Chinese assessments and the methodological suggestions
More than 30 thousand plant species have been assessed in China and a database has been populated with the relevant species information. However, for these assessments, a detailed, data-stamped document was not compiled for each species, which as a result, does not meet the requirements of the IUCN. Thus, more work is needed in this respect to maximise the value of future assessments, so to facilitate and enhance conservation action planning and monitoring. Specifically, a detailed, date-stamped record of the evidence and rationale used for the assignment of a category to each assessed species is vital for the integrity of the assessment process. Moreover, such a record is essential to enable future assessors to understand the many potential reasons for category changes over time, that is, to distinguish between non-genuine category changes, due simply to change in knowledge of the species, and genuine category changes, due to change in the status of the species on-the-ground. Only the latter changes should be used in the compilation of the RLI, and experience shows that they are usually only a minority of all the changes between successive assessments. Expert evaluation of a sample of the Chinese assessment results indicated that genuine changes comprised about half of all category changes which could be resolved.
An additional challenge is that due to the shortage of detailed history data, models could not be built for the future, so Criterion E was not applied in the Chinese assessment for most of the species. We recommend that a targeted database consisting of the long-term species information changes is a priority to address the urgent need to document such data, and such a database could form part of the ‘IUCN Knowledge Hub & Capacity Development’ in China.
During the assessments, we found that more and more data could be used to generate assessment file. With advances in the development of species distribution modelling, increasing numbers of modelled species ranges are published as part of the ecological research. MaxEnt was used to generate the extent of occurrence (EOO), an IUCN assessment metric for distribution, of some shorebird species, and researchers found the modelled distributions were more precise than using the IUCN methodology which depends mainly on topological methods (Duan et al. Citation2022). With habitat and population-density models, Santini et al. (Citation2019) assessed nonpelagic birds and terrestrial mammals globally (∼15,000 species) and the periodic updates of landcover information readily provide an early-warning system to identify species potentially warranting changes in their extinction-risk category. More broadly applicable methods could be developed and proposed by experts of various taxa or regions and those considered reasonable by the IUCN Standards and Petitions Committee could be adopted and included in future versions of Categories and Criteria or Guidelines.
To reduce the taxonomic bias and minimise the time and resources required to develop and remeasure RLIs, Baillie et al. (Citation2008) and Henriques et al. (Citation2020) suggested that a planned dataset, e.g. 1,000∼1,500 species, that are more representative, could be selected to detect changes in the slope of Index values. In South Africa, as capacity and resources are not available for repeat assessments of full plant taxa (representing more than 20,000 species), 900 sampled plants have been repeatedly assessed to generate a national RLI (Raimondo et al. Citation2023). We suggest that a similar approach could be conducted for plant taxa in China. In addition to the full assessment, the assessment process could be conducted more frequently (e.g. every 2 years) on the selected species subset to get a more accurate view of plant species status. This should facilitate better taxonomic representation, and more timely and efficient results for dissemination.
5. Conclusions
Our study systematically analysed the two most recent Red List assessments of higher plants in China and compared the threatened status of plants in 2013 and 2020 by using RLI. It provides an important scientific basis for the evaluation of indicator SDG15.5.1 in China and thereby of progress towards supporting action plans to reduce the degradation of natural habitats and to protect threatened species.
Supplemental Material
Download MS Excel (31.6 KB)Acknowledgements
We thank Malin C. Rivers from Botanic Gardens Conservation International (BGCI), Steven P. Bachman from Royal Botanic Gardens Kew, UK, the anonymous reviewers and editors for the comments and suggestions on the manuscript.
Disclosure statement
No potential conflict of interest was reported by the author(s).
Additional information
Funding
References
- Bachman, S. P., R. Field, T. Reader, D. Raimondo, J. Donaldson, G. E. Schatz, and E. Nic Lughadha. 2019. “Progress, Challenges and Opportunities for Red Listing.” Biological Conservation 234: 45–55. https://doi.org/10.1016/j.biocon.2019.03.002.
- Baillie, J. E. M., B. Collen, R. Amin, H. R. Akcakaya, S. H. M. Butchart, N. Brummitt, T. R. Meagher, M. Ram, C. Hilton-Taylor, and G. M. Mace. 2008. “Toward Monitoring Global Biodiversity.” Conservation Letters 1 (1): 18–26. https://doi.org/10.1111/j.1755-263X.2008.00009.x.
- Borrell, J. S., S. Dodsworth, F. Forest, O. A. Pérez-Escobar, M. A. Lee, E. Mattana, P. C. Stevenson, et al. 2020. “The Climatic Challenge: Which Plants Will People use in the Next Century?” Environmental and Experimental Botany 170: 103872. https://doi.org/10.1016/j.envexpbot.2019.103872.
- Bubb, P. J., S. H. M. Butchart, B. Collen, H. Dublin, V. Kapos, C. Pollock, S. N. Stuart, and J.-C. Vié. 2009. “IUCN Red List Index - Guidance for National and Regional Use (Version 1.1).” In Gland, Switzerland: IUCN.
- Butchart, S. H. M., H. R. Akcakaya, J. Chanson, J. E. M. Baillie, B. Collen, S. Quader, W. R. Turner, R. Amin, S. N. Stuart, and C. Hilton-Taylor. 2007. “Improvements to the Red List Index.” PloS One 2 (1): e140. https://doi.org/10.1371/journal.pone.0000140.
- Butchart, S. H. M., A. J. Stattersfield, L. A. Bennun, S. M. Shutes, H. R. Akcakaya, J. E. M. Baillie, S. N. Stuart, C. Hilton-Taylor, and G. M. Mace. 2004. “Measuring Global Trends in the Status of Biodiversity: Red List Indices for Birds.” Plos Biology 2 (12): e383. https://doi.org/10.1371/journal.pbio.0020383.
- Cazalis, V., M. D. Marco, S. H. M. Butchart, H. R. Akakaya, G.-S. Manuela, C. Meyer, V. Clausnitzer, et al. 2022. “Bridging the Research-Implementation gap in IUCN Red List Assessments.” Trends in Ecology & Evolution 37 (4): 359–370. 10.1016j.tree.2021.12.002.
- Chi, X. L., Z. J. Zhang, X. T. Xu, X. B. Zhang, Z. P. Zhao, Y. N. Liu, Q. G. Wang, et al. 2017. “Threatened Medicinal Plants in China: Distributions and Conservation Priorities.” Biological Conservation 210: 89–95. https://doi.org/10.1016/j.biocon.2017.04.015.
- Duan, H. L., X. B. Yu, S. X. Xia, and Y. Liu. 2022. “Comparison of IUCN and Species Distribution Modeling-Estimated Ranges of Shorebirds in Coastal Mainland China.” Global Ecology and Conservation 38: e02236. https://doi.org/10.1016/j.gecco.2022.e02236.
- Feng, G., L. F. Mao, B. M. Benito, N. G. Swenson, and J. C. Svenning. 2017. “Historical Anthropogenic Footprints in the Distribution of Threatened Plants in China.” Biological Conservation 210 (Part B): 3–8. https://doi.org/10.1016/j.biocon.2016.05.038.
- Fu, L. G., and J. M. Jin. 1991. China Plant Red Data Book: Rare and Endangered Plants Volume 1. Beijing: Science press.
- Han, X. M., C. Josse, B. E. Young, R. L. Smyth, H. H. Hamilton, and N. Bowles-Newark. 2017. “Monitoring National Conservation Progress with Indicators Derived from Global and National Datasets.” Biological Conservation 213: 325–334. https://doi.org/10.1016/j.biocon.2016.08.023.
- Henriques, S., M. Böhm, B. Collen, J. Luedtke, M. T. Hoffmann, C. Hilton-Taylor, P. Cardoso, S. H. M. Butchart, and R. Freeman. 2020. “Accelerating the Monitoring of Global Biodiversity: Revisiting the Sampled Approach to Generating Red List Indices.” Conservation Letters 13 (3): e12703. https://doi.org/10.1111/conl.12703.
- Howes, M.-J. R., C. L. Quave, J. Collemare, E. C. Tatsis, D. Twilley, E. Lulekal, A. Farlow, et al. 2020. “Molecules from Nature: Reconciling Biodiversity Conservation and Global Healthcare Imperatives for Sustainable use of Medicinal Plants and Fungi.” Plants People Planet 2 (5): 463–481. https://doi.org/10.1002/ppp3.10138.
- Huang, L. Q., B. G. Zhang, and H. N. Qin. 2022. Chinese Medicinal Plant Red Data Book. Beijing: Beijing Science and Technology Press.
- IUCN. 2001. “IUCN Red List Categories and Criteria, version 3.1.” In Gland, Switzerland and Cambridge, UK.
- IUCN. 2012. “IUCN Red List Categories and Criteria, version 3.1, second edition.” In Gland, Switzerland and Cambridge, UK.
- IUCN. 2022. “The IUCN Red List of Threatened Species. Version 2022-1.” https://www.iucnredlist.org, Accessed April 2022.
- Liu, H., Z. J. Liu, X. H. Jin, J. Y. Gao, Y. Chen, Q. H. Liu, and D.-Y. Zhang. 2020. “Assessing Conservation Efforts Against Threats to Wild Orchids in China.” Biological Conservation 243: 108484. https://doi.org/10.1016/j.biocon.2020.108484.
- Liu, T., R. X. Peng, Y. X. Zhuo, and G. Z. Cao. 2022. “China's Changing Population Distribution and Influencing Factors: Insights from the 2020 Census Data.” Acta Geographica Sinica 77 (2): 381–394. https://doi.org/10.11821/dlxb202202008.
- Lu, L. M., L. N. Zhao, H. H. Hu, B. Liu, Y. C. Yang, Y. C. You, D. X. Peng, R. L. Barrett, and Z. D. Chen. 2022. “A Comprehensive Evaluation of Flowering Plant Diversity and Conservation Priority for National Park Planning in China.” Fundamental Research, https://doi.org/10.1016/j.fmre.2022.08.008.
- Mi, X. C., G. Feng, Y. B. Hu, J. Zhang, L. Chen, R. T. Corlett, A. C. Hughes, et al. 2021. “The Global Significance of Biodiversity Science in China: An Overview.” National Science Review 8 (7), https://doi.org/10.1093/nsr/nwab032.
- Ministry of Ecology and Environment of the People's Republic of China, and Chinese Academy of Sciences. 2023. “Announcement on the Release of the “China Red List of Biodiversity - Vertebrates (2020)” and “China Red List of Biodiversity - Higher Plants (2020)”.” Announcement No. 15 of 2023. Accessed June 1, 2023. https://www.mee.gov.cn/xxgk18/xxgk/xxgk01/202305/t20230522_1030745.html.
- Ministry of Environmental Protection of the People's Republic of China, and Chinese Academy of Sciences. 2013. “Announcement on the Release of the “China Biodiversity Red List - Higher Plant Volume.” Announcement No. 54 of 2013. Accessed June 1, 2023. https://www.mee.gov.cn/gkml/hbb/bgg/201309/t20130912_260061.htm.
- Nic Lughadha, E., S. P. Bachman, T. C. C. Leao, F. Forest, J. M. Halley, J. Moat, C. Acedo, et al. 2020. “Extinction Risk and Threats to Plants and Fungi.” Plants People Planet 2 (5): 389–408. https://doi.org/10.1002/ppp3.10146.
- Qin, H. N. 2020. Seed Plants of China: Checklist, Uses and Conservation Status. 4 vols. Vol. 1-4. Shijiazhuang: Hebei Science and Technology Publishing House.
- Qin, H. N., and L. N. Zhao. 2017. “Evaluating the Threat Status of Higher Plants in China.” Biodiversity Science 25 (7): 689–695. https://doi.org/10.17520/biods.2017146.
- Raimondo, D., B. E. Young, T. M. Brooks, P. Cardoso, D. van der Colff, B. F. de Souza Dias, U. Vercillo, et al. 2023. “Using Red List Indices to Monitor Extinction Risk at National Scales.” Conservation Science and Practice 5 (1): e12854. https://doi.org/10.1111/csp2.12854.
- Ribeiro, B. R., K. Guidoni-Martins, G. Tessarolo, S. J. E. Velazco, L. Jardim, S. P. Bachman, and R. Loyola. 2022. “Issues with Species Occurrence Data and Their Impact on Extinction Risk Assessments.” Biological Conservation 273: 109674. https://doi.org/10.1016/j.biocon.2022.109674.
- Santini, L., S. H. M. Butchart, C. Rondinini, A. Benítez-López, J. P. Hilbers, A. M. Schipper, M. Cengic, J. A. Tobias, and M. A. J. Huijbregts. 2019. “Applying Habitat and Population-Density Models to Land-Cover Time Series to Inform IUCN Red List Assessments.” Conservation Biology 33 (5): 1084–1093. https://doi.org/10.1111/cobi.13279.
- Shan, Z. J., Q. Zhang, D. X. Peng, J. F. Ye, L. Cao, Z. D. Chen, and H. N. Qin. 2022. “Assessing Conservation Priorities of Threatened Medicinal Plants in China: A new Comprehensive Phylogenetic Scoring System.” Journal of Systematics and Evolution, https://doi.org/10.1111/jse.12903.
- Texier, N., G. Dauby, E. Bidault, P. P. Lowry, D. U. Ikabanga, and T. Stévart. 2021. “An Efficient Method for Defining Plant Species Under High Conservation Value (HCV) Criterion 1 Based on the IUCN Red List Criteria: A Case Study Using Species Endemic to Gabon.” Journal for Nature Conservation 62: 126027. https://doi.org/10.1016/j.jnc.2021.126027.
- Thuiller, W., S. Lavorel, M. B. Araujo, M. T. Sykes, and I. C. Prentice. 2005. “Climate Change Threats to Plant Diversity in Europe.” Proceedings of the National Academy of Sciences, USA 102 (23): 8245–8250. https://doi.org/10.1073/pnas.0409902102.
- Walker, B. E., T. C. C. Leo, S. P. Bachman, E. Lucas, and E. Nic Lughadha. 2023. “Evidence-based Guidelines for Automated Conservation Assessments of Plant Species.” Conservation Biology 37: e13992. https://doi.org/10.1111/cobi.13992.
- Wang, S., and Y. Xie. 2004. China Species Red List. Beijing: Higher Education Press.
- Xia, C. Y., Y. F. Huang, Y. D. Qi, X. D. Yang, T. T. Xue, R. C. Hu, H. P. Deng, R. W. Bussmann, and S. X. Yu. 2022. “Developing Long-Term Conservation Priority Planning for Medicinal Plants in China by Combining Conservation Status with Diversity Hotspot Analyses and Climate Change Prediction.” BMC Biology 20 (1): 89. https://doi.org/10.1186/s12915-022-01285-4.
- Xie, Y. 2022. “Progress and Application of IUCN Red List of Threatened Species.” Biodiversity Science 30 (10): 22445. https://doi.org/10.17520/biods.2022445.
- Zhang, M., and J. X. Gao. 2016. “Analysis of Biodiversity Variation Trend in China.” Environmental Protection Science 42 (6): 85–91. https://doi.org/10.16803/j.cnki.issn.1004-6216.2016.06.017.
- Zhang, J. L., B. Liu, S. Liu, Z. H. Feng, and K. W. Jiang. 2023. Plantlist: Looking Up the Status of Plant Scientific Names based on The Plant List Database, Searching the Chinese Names and Making checklists of plants.” R package.
- Zhang, Y. B., Y. Z. Wang, M. G. Zhang, and K. P. Ma. 2014. “Climate Change Threats to Protected Plants of China: An Evaluation Based on Species Distribution Modeling.” Chinese Science Bulletin 59 (34): 4652–4659. https://doi.org/10.1007/s11434-014-0642-6.
- Zhao, L. N., J. Y. Li, H. Y. Liu, and H. N. Qin. 2016. “Distribution, Congruence, and Hotspots of Higher Plants in China.” Scientific Reports 6: 19080. https://doi.org/10.1038/srep19080.