
 ?Mathematical formulae have been encoded as MathML and are displayed in this HTML version using MathJax in order to improve their display. Uncheck the box to turn MathJax off. This feature requires Javascript. Click on a formula to zoom.
ABSTRACT
Emergency communication networks play a vital role in disaster monitoring, transmission, and application during disaster emergency response (DER), however, the performance and stability of edge nodes in the emergency communication networks are often weak due to limited communication and computation resources. This weakness directly affects the quality of service (QoS) of the geospatial edge service (GES) chains involved in emergency monitoring. Existing research predominantly addresses service compositions in stable environments, neglecting the aggregation of efficient and robust GES chains in emergency communication networks. This study proposes an evolutionary particle swarm optimization (EPSO)-based emergency monitoring GES chain in an emergency communication network. It includes a GES chain model of emergency environment monitoring for tailing areas, as well as the designs of the particle chromosome encoding method, fitness evaluation model, and particle chromosome swarm update operators of the EPSO-based GES chain. Finally, the study conducts emergency environment monitoring experiments for tailing areas using the proposed method. Experiments results demonstrate that the proposed method significantly enhances the efficiency, stability, and reliability of emergency monitoring GES chains in the emergency communication network. This is crucial to providing fast and reliable services for DER during natural disasters.
1. Introduction
With the impact of global climate change, the frequency and intensity records of natural disasters are constantly being refreshed. On 31 October 2021, the World Meteorological Organization (WMO) reports indicate extreme disaster events, such as the Zhengzhou rainstorm, the Western European floods, and the Northwest ultra hot heat wave, will increase rapidly (WMO Citation2021). This alarming situation has prompted worldwide countries to prioritize the protection of the ecological environment and the development of effective methods and technologies for extreme disaster emergency response (DER). Though, large-scale public network damage or even blockage caused by natural disasters has posed great challenges to the implementation of DER (Xu, Ota, and Dong Citation2020a). An in-depth analysis of the application of geographic information services in natural DER demonstrates that infrastructures are severely damaged in extreme natural disaster events, such as mega floods, earthquakes, tsunamis, etc. (Ujjwal et al. Citation2019). In the case of the ‘7·20 Zhengzhou rainstorm’ disaster in 2021, water, electricity, and Internet access were lost in numerous disaster-prone areas (C. Li et al. Citation2022). The conventional method of building a geospatial service chain relying entirely on public network communication can no longer achieve the requirements of DER. This problem is especially prominent in on-site DER applications (Xu, Ota, and Dong Citation2020b), which has become a huge limitation for the application of geoinformation technology in DER. Fortunately, the development of various emergency communication network technologies (e.g. self-organized network technology) provides the ability to respond to such extreme disasters with emergency communications (Felice et al. Citation2014; Niyazi and Behnamian Citation2022). With the help of emergency communication network technology, temporary communication networks for DER can be quickly set up in disaster areas. Moreover, scholars have conducted substantial valuable research on the problem of how to collect and transmit DER data in heterogeneous emergency communication networks (Altintas et al. Citation2015; Tan et al. Citation2022).
Meanwhile, the development of edge computing technology provides a new way for geographic information services to support DER in emergency communication networks. Different from the centralized and unified processing model of cloud computing, edge computing is a new model that performs computing tasks decentralized at the edge nodes of the network (Shi et al. Citation2016). Without uploading all the data to the cloud computing center, edge computing has higher data processing efficiency and is more suitable for time-sensitive application scenarios. Moreover, edge computing well evades and solves the problems of over-reliance on communication capabilities and data security in the cloud computing model (Liao and Wu Citation2020; Wang et al. Citation2020). In emergencies, edge nodes in LAN can still operate in an orderly manner, and almost no communication with the cloud is required to complete the computing task, which is of great practical importance. However, how to build efficient and reliable geospatial edge service (GES) chains for emergency monitoring tasks in the edge computing environment based on emergency communication networks is still a big challenge because of the spatiotemporal dynamicity of the edge computing environment and the emergency communication networks.
To solve the challenges encountered in GES composition for emergency monitoring, the study proposes a GES composition algorithm based on evolutionary particle swarm optimization (EPSO), which seeks to improve the reliability, intelligence, and efficiency of GES chains running in the edge computing environment for DER and provides support for fast and reliable extreme DER services. Our contributions can be summarized as follows:
The study presents an emergency environment monitoring scenario and introduces a GES chain model specifically designed for monitoring and analyzing emergency situations in tailing areas. This model facilitates the collection of essential data and offers analytical support for effective emergency decision-making and response.
The study proposes an EPSO algorithm that designs the particle coding scheme and evolutionary operations based on the characteristics of the GES chain model in the edge computing environment, which optimizes the GES chain composition quickly and effectively. This algorithm improves the efficiency, stability, and reliability of the GES chain.
The study proposes a fitness evaluation model by considering multiple features of the GES services on the edge nodes; this model can more truly reflect the quality of service (QoS) of GES on edge nodes, thereby further optimizing the quality of GES chain composition.
The paper is structured as follows: Section 2 provides the related work of the study, while Section 3 discusses the emergency environment monitoring GES chain model for tailing areas and the EPSO algorithm for GES chains. In Section 4, the details of environmental settings involving emergency communication network and node configurations are first presented, followed by the emergency environment monitoring results of the EPSO-based GES chain. The section concludes with a comprehensive analysis of the experimental results of GES composition optimization. Finally, Section 5 summarizes the work.
2. Related work
2.1. Emergency communication network
Some disasters can completely wipe out communication infrastructures in the affected areas, and many studies have aimed at setting up emergency communication networks quickly (Ujjwal et al. Citation2019). With the help of vehicular or transportable network nodes, e.g. base stations (BSs) and access points, available emergency communication networks can be quickly established after a disaster (Gomes et al. Citation2016). Sakano et al. (Citation2016) implemented a vehicle-mounted Movable and Deployable Resource Unit (MDRU), which can carry all necessary equipment for establishing a disaster recovery network in a van. In addition, for the faultiness related to real-time communication and collaboration between the personnel taking part in the rescue operations, ad hoc networks can be a feasible solution (Reina et al. Citation2015). To enable the rapid and efficient deployment of an emergency communication network, Klaine et al. (Citation2018) proposed an intelligent solution based on reinforcement learning to find the optimal location for multiple unmanned aerial vehicle (UAV) units for emergency cellular networks. UAV-assisted networking is emerging as a promising method to establish emergency networks. Zhao et al. (Citation2019) established a unified framework for a UAV-assisted emergency network in disasters, realizing information exchange between the disaster areas and outside by optimizing the hovering positions of UAVs. However, despite significant research efforts to improve the capabilities of emergency communication networks, practical disaster situations continue to present challenges in communication quality. As a result, there is a need for further investigation into service composition in unstable networks.
2.2. Edge computing
With the development of manufacturing, the performance of end devices has been greatly enhanced, whereas the price has dropped, making the application of edge computing grow considerably (Wu et al. Citation2022). Certain less computation-intensive tasks can be assigned directly to edge computing nodes to decrease latency remarkably (C. Chen et al. Citation2023; Ujjwal et al. Citation2019). In 2014, the European Telecommunications Standards Institute introduced the concept of mobile edge computing (MEC), which enables mobile users to obtain services from nearby BSs (Khan et al. Citation2019). In the beginning, MEC mainly focused on task offloading in stable cellular or wireless networks. Furthermore, many researchers are concerned with providing edge computing services in constrained environments in remote or disaster areas. Based on the UAV MEC architecture, Cheng et al. (Citation2021) proposed a joint deep reinforcement learning framework to learn joint task unloading and energy allocation decisions. Z. Chen, Xiao, and Han (Citation2020) established a multilevel edge network resource optimization model to optimize the functional selection of UAVs in MEC networks and solved the optimal unloading mode and resource utilization plan based on a Markov decision process algorithm. Such research is crucial for the rapid establishment of an edge computing environment based on emergency communication networks and the provision of computing services after disasters.
2.3. Geographic information service composition
With the gradual transformation of traditional web geographic information systems to geographic information services (Li Citation2017; Zhang et al. Citation2019), geographic information services have shown enormous intelligent potential and advantages in DER applications (Gong Citation2013; Zhang et al. Citation2022). Numerous scholars have conducted substantial research on geographic information services, covering fields, such as quantitative quality evaluation of services (Řezník, Chudý, and Mičietová Citation2016), geographic model sharing and services (Huang, Li, and Li Citation2018; M. Chen et al. Citation2020), and service workflow construction (Tan et al. Citation2021; Yang, Xie, and Xu Citation2016). Among them, the intelligent geographic information service composition method based on QoS is of great relevance for building complex DER applications that adapt to multivariate disaster environments (D. Eiben and Smith Citation2015; Katoch, Chauhan, and Kumar Citation2021; Li et al. Citation2014). Hu et al. (Citation2019) proposed a QoS model for geographic information services under the OGC standard, which contains the QoS indicators of standard web services (e.g. execution time, cost, etc.) and two indicators of data accuracy and integrity unique to spatial data services. To generate a web service composition solution method, which is relevant not only to the problem constraints but also to the needs of the user environment, Fekih, Mtibaa, and Bouamama (Citation2016) proposed a new valued constraint satisfaction optimization approach based on particle swarm optimization (PSO) with metaheuristics. Sun et al. (Citation2018) proposed a time series prediction model and used the genetic algorithm to solve the web service composition problem; the model remarkably outperformed conventional methods in terms of response time and throughput. However, the studies mentioned above are designed for geographic information service composition in conventional network environments, and the unique features of edge computing environments based on emergency communication networks, such as equipment failure and inability to communicate, are not considered. Moreover, the execution of services is affected by the performance and condition of different nodes themselves. How to manage and coordinate the services in edge computing environments and construct service compositions with more efficient, reliable, and complex functions is the problem this study is trying to solve.
3. Methodology
3.1. Emergency environment monitoring GES chain model for tailing areas
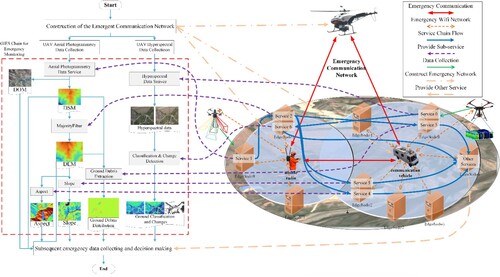
In DER, edge computing offers higher processing efficiency than centralized cloud computing. It has advantages like low transmission pressure and low latency. Additionally, edge computing eliminates the need for high public network communication capability. In emergency scenarios, nodes in the temporary emergency communication network can perform computing tasks without relying on the cloud center, which is highly practical. illustrates an emergency environment monitoring scenario in a tailing area. The DER process includes data collection, transmission, processing, and application. It starts with the collection and transmission of multimodal remote sensing data via diverse monitoring platforms (i.e. satellites, drones, Ground-based remote sensing platforms and etc.). By forming GES chains based on the edge computing nodes, these remote sensing monitoring data are processed.
Figure 1. Emergency environment monitoring scene at a tailing area.
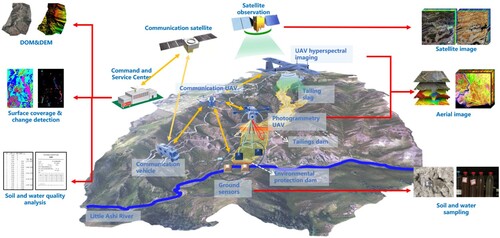
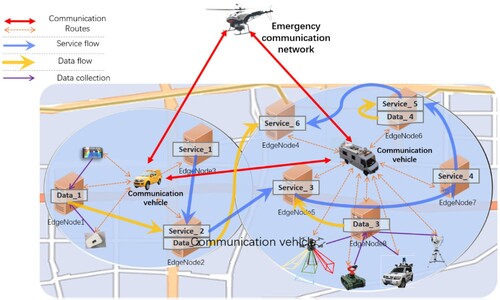
illustrates the scenario involving multiple emergency environment monitoring tasks and platforms, generating multimodal remote sensing data. These data, along with geographic processing models, form emergency environment monitoring and processing service chains through GES composition in the emergency communication network. These chains support emergency decisions and actions. The figure depicts distributed data collection terminals operating in various locations within the disaster area. Processed and published in edge nodes, the collected data serves the entire area covered by the emergency communication network, aiding emergency analysis and decision-making. shows the execution path of an emergency environment monitoring and analysis service chain involving multiple sensing terminals. In such an emergency scenario, the execution of the GES chain relies on the collaboration of distributed edge computing nodes. Node performance, communication load capacity, and resource competition impact the quality of the aggregated service chain. This study aims to coordinate emergency node resources and construct efficient and reliable emergency GES chains.
Figure 2. GES composition in an emergency communication network.
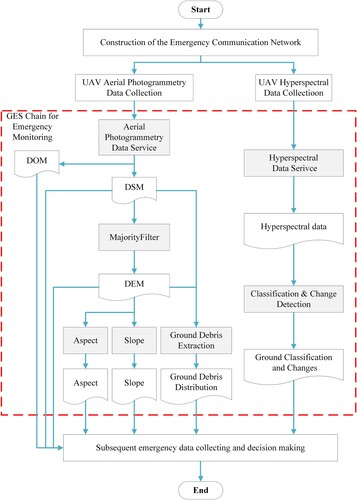
The GES chain model for emergency environment monitoring is depicted in . The experimental service chain model consists of GESs represented by the gray rectangle boxes, with input/output data indicated by the boxes with wavy lines at the bottom. As the DER is triggered, the emergency environment monitoring process starts with deploying communication vehicles and UAVs to establish the emergency communication network. The UAVs are sent to take photogrammetry and then process the data of the tailing area to generate the digital surface model (DSM) and orthophoto images, while the digital elevation model (DEM) is obtained through DSM filtering. After the slope and aspect processes, the debris distribution in the ground area can be obtained by integrating the ground DEM and DSM. Hyperspectral satellite images of the monitoring area are acquired and undergo classification and change detection, facilitating subsequent emergency data collection and decision-making. Within the monitoring process, the following key tasks must be completed in the GES nodes:
UAV aerial photogrammetry data service: Data collection results of UAV aerial photogrammetry, and the results are the DOM and DSM of the coverage area.
‘MajorityFilter’, i.e. mode filtering: The DSM of the monitoring area is inputted, and the processing result is the filtered DEM.
Aspect: The filtered DEM data can be input to obtain the aspect results.
Slope: The filtered DEM data can be input to obtain the slope results.
Ground debris extraction: DSM and filtered DEM are inputted, and filtered ground debris information is obtained through grid subtraction.
Hyperspectral data service: This service provides current and historical hyperspectral images of the monitoring area collected by UAVs.
Classification and change detection: ISO clustering, a typical unsupervised classification, and change detection combined with current and historical hyperspectral images, are conducted.
Figure 3. GES chain model for emergency environment monitoring.
3.2. EPSO algorithm for GES chain
As the algorithm is designed for DER, it should quickly converge to an acceptable service composition. Considering the global and individual effects, the PSO algorithm has advantages in terms of convergence efficiency but has limitations when dealing with composition optimization problems due to the need for discretization. Improper discretization may cause the slight displacement of particles to be discarded, affecting swarm convergence. The discrete chromosome coding in evolutionary algorithms can express the discrete composition optimization problems effectively and intuitively, where the algorithm has disadvantages in convergence performance. Therefore, this study proposes an EPSO algorithm that combines evolutionary and PSO algorithms for GES chain composition optimization. This approach effectively avoids the adverse effects of discrete operations and improves convergence speed by utilizing heuristic information from swarm optimal and historical optimal particles.
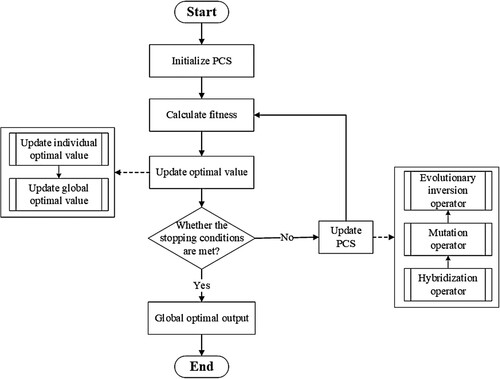
3.2.1. EPSO algorithm flow for GES chain
The EPSO algorithm for the GES chain, unlike the traditional PSO algorithm, updates the particles’ position by hybridization, mutation, and inversion operators commonly found in evolutionary algorithms. The algorithm process is described as follows, as shown in :
Initialize the PCS in a random manner.
Evaluate the fitness value of each individual according to the fitness function based on the QoS of the GES chain.
Update the historical optimal position of each individual and the global optimal position of the PCS.
Check whether the stopping condition is met (the preset maximum number of iterations of the PCS). If the stopping condition is met, then end the iteration, and proceed to step (6); otherwise, proceed to step (5) to continue the iteration.
Update the PCS using evolutionary operators.
Output the best solution.
Figure 4. EPSO algorithm flow for GES chain.
3.2.2. Particle chromosome encoding method
The effects of hybridization, mutation, and inversion operators on chromosome individuals largely depend on the coding methods of particle chromosomes, and the encoding strategies of particle chromosomes have a great effect on the fitness function and design of the three operators.
Given a set of edge computing nodes , where k is the serial number of each node and n is the total count of edge computing nodes. A specific DER task can be executed via a human-made or intelligently generated service chain, and it can be always formatted in the form of
, where i is the serial number of the abstract service of the service chain, and m is the total count of services of the chain. Let
represent the service instance of abstract service Si on edge computing node
. Consistent with the form of abstract service composition, e.g. a service chain instance
exists, where
is the service instance of abstract service Si on edge computing node
.
A PCS of a service chain can be represented as , where scq represents the particle chromosome of the service with serial number q, t refers to the generation number of PCS, and M is the swarm size (i.e. the total count of particle chromosomes of the swarm).
In the experiment, shows the mapping between gene locations and abstract services in the service chain (). There are seven abstract services (m = 7) involved in the chain, with each edge computing node having all service instances of these abstract services, which means n = 9.
Table 1. Service chain sequence.
presents the particle structure, consisting of four components: the current composition, the fitness value of the current composition, the particle's history optimal composition, and the particle's history optimal fitness.
Table 2. Particle structure.
3.2.3. Fitness evaluation model
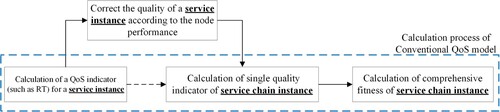
The study evaluates service quality based on the QoS model and introduces correction parameters for edge node computing power. Six typical QoS indicators are selected: running time (RT), reliability (Rel), availability (Ava), security (Sec), execution cost (Cost), and reputation (Rep). The calculation process of fitness value is depicted in , with the conventional QoS model shown in the blue dotted box.
Calculation of a QoS indicator (e.g. RT) for a service instance. It is derived from the historical QoS statistics of the service instance of each abstract service on the actual edge computing node.
The quality of a service instance is calculated in accordance with the node performance.
Figure 5. The calculation process of fitness.
Let be the i-th abstract service of the service composition SC and
be the j-th QoS indicator of service instance
; thus, the calculation formula of the QoS that introduces the node’s performance is.
(1)
(1) In Formula (1),
is the j-th QoS indicator of service instance
with node performance correction, and NW(Ek) is the performance weight of the node Ek where the service instance
exists. The performance weight of each node is calculated based on its comprehensive evaluation score, and it must be standardized due to its large dimension. In our case, the ‘min-max’ standardization method is chosen, as shown in Formula (2), where
is the performance score of the node Ek before standardization,
and
are the maximum and minimum node performance scores before standardization, respectively.
(2)
(2) In an emergency edge computing environment, the performance of each node can vary significantly. The optimization process may result in ‘node convergence’, where most selected service instances are concentrated on a single node. And it’s shown as multiple occurrences of a node in a service chain composition. This concentration of services can lead to excessive concurrency, negatively impacting the overall QoS and performance of the composition. To address this issue, a node balance operator is proposed. This operator aims to distribute the services more evenly among the nodes during the composition process. The calculation formula of the node balance weight BW(Ek) is shown in Formula (3), where Ek is the serial number of an edge computing node, and countsnodes(Ek) is the number of occurrences of edge computing node Ek. Taking sc = {6, 2, 6, 9, 8, 3, 2} as an example, countsnodes(2) = 2 and countsnodes(3) = 1.
(3)
(3) The quality calculation formula of a single service with a node balance operator is shown in Formula (4), where
is the j-th QoS indicator of service instance
with node performance correction and node balance operation.
(4)
(4)
(3) Calculation of a single QoS indicator of a service chain instance
After correcting the quality of individual service instances, the sub-services are composed according to specific process logic to form the service chain. The relationships among multiple services can be categorized into four basic models: sequential, parallel, branch, and circular. These models define the logical constraints among services as shown in .
Figure 6. Basic models of service composition. (a) sequential model: services are executed in sequence; (b) circular model: some services are repeatedly executed; (c) branch model: one and only one branch is executed; (d) parallel model: services start independently at the same time and move on to the next phase until all services are finished.
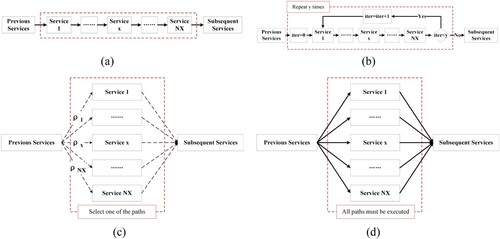
The composition calculation method of six typical QoS indicators of the service composition (RT, Rel, Ava, Sec, Cost, and Rep) is shown in . Each model has NX sub-services in total. are the corresponding six QoS indicators of sub-service Sx in the model;
is the probability that the x-th sub-service in the branch model is executed; and y is the number of loops.
Table 3. QoS calculation formula of service composition.
Then, the j-th QoS indicator of the service chain instance can be expressed as
(5)
(5) In Formula (5), QoSj(sc) is the j-th QoS indicator of service chain instance sc,
is the j-th QoS attribute of the service instance
, and fj() is the specific indicator calculation formula combined in the way described in for a specific service chain instance.
The composition formula for a single quality indicator of a service chain instance, considering node performance correction and node balance operation, is shown in Formula (6), where is the j-th QoS indicator of service chain instance sc and
is the corresponding j-th indicator of service instance
computed in accordance with Formula (4).
(6)
(6)
(4) Calculation of the comprehensive fitness of the service chain instance
Finally, the comprehensive fitness of the service chain instance is calculated by integrating six quality indicators of the service chain. The fitness calculation formula of a conventional QoS model is shown in Formula (7), where RT(sc), Rel(sc), Ava(sc), Sec(sc), Cost(sc), and Rep(sc) are the six QoS indicators of the service chain instance calculated by Formula (5). W = [w1, w2, w3, w4, w5, w6]T is the weight vector corresponding to each QoS indicator, and . F(sc) is the fitness value of service chain instance sc; the higher the fitness value, the higher the evaluation.
(7)
(7) The above model only refers to the historical QoS information of service chain composition and does not consider node performance. After incorporating node performance attributes based on Formulas (1)–(4) in this section, the comprehensive fitness calculation formula for the service chain instance takes into account both historical QoS information and node performance. The formula is as follows:
(8)
(8)
Furthermore, are the six quality indicators of the service chain instance sc calculated by Formula (6).
3.2.4. Evolutionary PCS update operators
The EPSO algorithm proposed in this study replaces the conventional velocity-position update formula with hybridization, mutation, and evolutionary inversion operators commonly found in evolutionary algorithms for updating particle positions in the PCS. Hybridization is a key search operator in evolutionary algorithms. It combines desirable features from two individuals to produce offspring that inherit those features. The offspring of parents with good performance are expected to be better in most cases. To utilize the heuristic information in the search process sufficiently, in the proposed EPSO algorithm, each individual successively undergoes hybridization with its own historical optimal position and the global optimal position. The hybridization process consists of two steps: (1) hybridization with the particle's historical optimal position and (2) hybridization with the global optimal position of the current PCS. A single-point hybridization operator is used, as shown in (a). Unlike in evolutionary algorithms where both parent chromosomes change, in this study, only the particle's current position changes, generating a single child individual while preserving the individual's historical optimal position and the global optimal position of the PCS.
Figure 7. Evolution operators. (a) Hybridization operator; (b) Inversion operator.
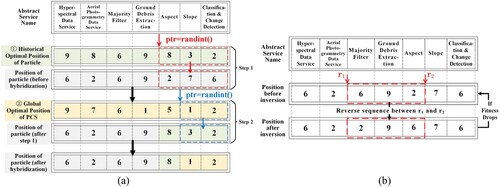
To avoid the problem of local optimization, a new PCS must be generated via mutation operation during the iterative process. The mutation operation of the evolutionary algorithm can increase the diversity of a swarm and improve the possibility of searching for the global optimal solution. The mutation operation is based on the integer sequence encoding mode, and the steps are as follows: (1) Generate a random number sequence ptrs of length Nparticles*Dim, where Nparticles is the number of particles in the PCS, and Dim is the dimension of a single particle. (2) Traverse ptrs, and compare ptr and p_mutation. When ptr < p_ mutation, proceed to step (3) to perform the mutation operation; otherwise, continue traversing ptrs. (3) Perform mutation operation on the particle position pointed by ptr, i.e. randomly refer to other service instances of the abstract service.
To enhance the convergence rate and improve convergence quality, the EPSO algorithm includes the evolutionary inversion operation following the mutation operation. The inversion operator randomly inverts a segment of genes in individuals. The evolutionary inversion operator builds upon the inversion operator and selectively accepts new individuals with improved fitness. This improves the algorithm's local search capability by focusing on individuals that show better performance. The evolutionary inversion operator is shown in (b): (1) Two random numbers, r1 and r2, are generated, where r1 < r2. (2) Reverse the sequence between r1 and r2. (3) Judge whether the fitness of the reversed service composition is improved, and if so, retain the reversed sequence; otherwise, restore the sequence before reversal.
4. Experiment
4.1. Experimental environment settings and emergency environment monitoring results
4.1.1. Experimental environment configuration and settings
In the edge computing environments, the bandwidth of the emergency communication network is ≧20 Mbps and ≦50 Mbps. In the experiment, there are nine GES servers which have different memory capacities, computing performances, and operating systems.
Each edge node is assigned a number and its performance is evaluated and ranked based on factors such as memory, processor, operating system, et al. The details of each edge node are shown in .
Table 4. Hardware configuration of edge nodes in the experiment.
Finally, software and toolkit, including Java 1.8, Tomcat 8, GeoServer, ODE, and ArcGIS10.2.2, are deployed on each service node. The services mentioned above are deployed on the ODE server for calling. The Tomcat server on each service node keeps on running; thus, the service nodes in the experiment can always provide service support.
4.1.2. Emergency environment monitoring results of EPSO-based GES chain
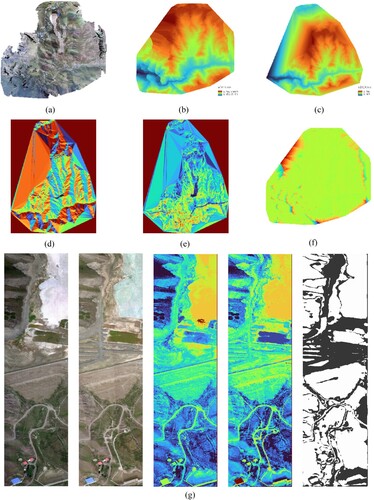
To test the feasibility of the proposed EPSO-optimized GES chain, in the experiment, 100 GES chains are called separately every 5 s. The GES composition result for emergency environment monitoring for a tailing area in the upstream region of the Yili River is shown in .
Figure 8. GES composition result for emergency environment monitoring.
As shown in , multiple GES nodes are organized in the emergency environment monitoring area. The service chain chooses corresponding nodes to provide the required sub-services according to the EPSO-optimized GES composition scheme and starts to execute. After the execution of the service chain, the emergency environment monitoring results are obtained and shown in . (a and b) show the DOM and DSM obtained from the processing of UAV collected images; (c) shows the results of the mode filtering of DSM, i.e. the DEM in the monitoring area; (d and e) show the results of the aspect and slope processing of the filtered DEM; (f) shows the extraction results of ground debris; (g) shows the classification results and land cover change in the monitoring area.
Figure 9. Emergency environment monitoring and processing result data. (a) DOM; (b) DSM; (c) DEM; (d) Aspect; (e) Slope; (f) ground debris distribution; (g) Historical and real-time hyperspectral images, along with classification and land cover change data.
4.2. Convergence performance analysis
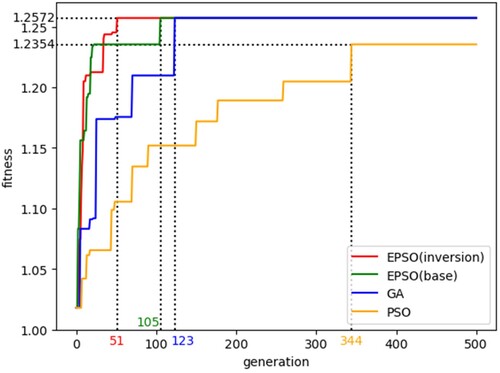
To examine the convergence performance of the EPSO algorithm, experiments were conducted on the service chain composition optimization using GA, PSO, and EPSO. The conventional PSO algorithm shows a disadvantage in the experiment. The fitness value of the conventional PSO algorithm experienced slow increases and converged to a worse service composition solution than the other three algorithms even after 500 iterations. The GA can converge to a better solution after 123 iterations than the conventional PSO. EPSO(base), the EPSO algorithm with only hybridization and mutation operations, converges slightly faster than GA. EPSO(base) remarkably improves the fitness value early in the iteration but is trapped in a local optimum solution for about 75 iterations. By contrast, the EPSO(inversion) algorithm with all hybridization, mutation, and evolutionary inversion operations converged to the same better solution in only 51 iterations; moreover, its fitness value increased more smoothly, demonstrating that the proposed EPSO method with the evolutionary inversion operator can improve the quality of the solutions and accelerate the convergence speed.
The study conducted the time complexity analyses of EPSO. Let M be the number of particles (or chromosomes) in the population, m the number of abstract services in the service chain, n the number of instances of each abstract service, and Max_Iter_EPSO, Max_Iter_GA, and Max_Ite_PSO refer respectively to the number of iterations at which EPSO, GA, and PSO converge. And the following analysis is based on the condition: M > n > m, which remains constant in the experiment. First, the time complexity of fitness value computation for each particle chromosome is O(n), as a result of computing BW in O(n) and QoS indicator values for each particle chromosome in O(m). Then, to initialize the PCS, the algorithm randomly generates M*m integers in O(M*m). Afterward, the algorithm improves the PCS quality through iteration. In each iteration, the algorithm evaluates the fitness value for all particle chromosomes in O(M*n), and conducts hybridization, mutation, and evolutionary inversion in O(M*m), respectively. Thus, the overall time complexity of EPSO is O(Max_Iter_EPSO*M*n). As comparisons, the genetic algorithm requires multiple iterations for selection (e.g. roulette wheel selection), crossover, and mutation, with a worst-case time complexity of O(Max_Iter_GA*M2) (Katoch, Chauhan, and Kumar Citation2021), whereas PSO needs multiple iterations to compute the fitness values of all particles, with a time complexity of O(Max_Iter_PSO*M*n) (Fang et al. Citation2022). shows Max_Iter_PSO > Max_Iter_GA > Max_Iter_EPSO, hence the proposed EPSO has better time complexity than GA and PSO algorithm.
Figure 10. Fitness value change in the optimization process. EPSO(inversion) is the EPSO algorithm that performs hybridization, mutation, and evolutionary inversion operations; EPSO(base) is the EPSO algorithm that performs hybridization and mutation operations; GA is the conventional genetic algorithm; PSO is the conventional particle swarm optimization algorithm.
4.3. Comparison of GES compositions
To demonstrate the proposed EPSO-optimized GES composition's superiority, we compare service compositions from three algorithms: (1) Random GES compositions generated randomly with varying QoS. (2) Static QoS-based GES compositions where the node maximizing each service's QoS is selected greedily. (3) EPSO-optimized GES compositions obtained using our proposed method, selecting the service chain with the highest fitness values. We evaluate the compositions’ quality by calling 100 service chains based on each algorithm every 5 s, counting their running time (RT) distribution and success rate.
4.3.1. Average RT analysis
The experiment evaluates the GES composition optimization results in terms of the running time (RT) through repeated tests. presents a histogram illustrating the average RT changes for random GES compositions, static QoS-based GES compositions, and EPSO-optimized GES compositions under different levels of concurrent calls. The results show that the EPSO method outperforms the other two methods in terms of efficiency. The average RT of EPSO-optimized GES compositions is significantly shorter than that of random compositions and static QoS-based compositions, with reductions of over 50% under different concurrency requests. Furthermore, while the RTs of random and static QoS-based compositions sharply increase with higher concurrent requests, the RT of the EPSO method exhibits a smoother increase. This can be attributed to certain edge nodes experiencing rapid performance degradation with increasing concurrent GES requests, resulting in higher RT for random and static QoS-based compositions. In contrast, the EPSO method tends to select edge nodes with better performance, thus mitigating the impact of such sharp RT increases. In the middle and later stages of the experiment, some concurrent GES chains are completed earlier, causing the average RT to no longer increase significantly when the number of requests exceeds 60.
Figure 11. Average RT and success rate of GES chains for emergency environment monitoring.
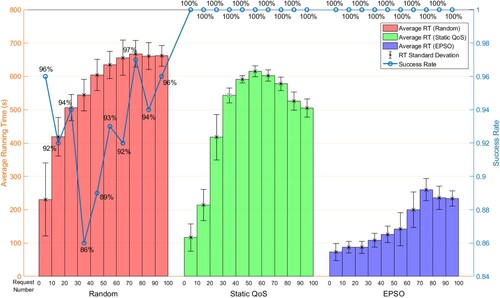
4.3.2. Stability analysis
The standard deviation of the RTs for repeated requests is tested to measure the stability of the GES compositions. shows that the largest standard deviation occurs at the stage when the average RT grows most rapidly, and the size of the standard deviation gradually decreases and stabilizes when the average RT stabilizes at a later stage. In addition, the standard deviation of RTs of random GES compositions and static QoS-based GES compositions varies considerably from phase to phase, whereas EPSO has a relatively small variation in standard deviation due to the more moderate change in the average RT. This result implies that the method of EPSO optimization possesses better stability.
4.3.3. Reliability analysis
The experiments also evaluate the reliability of the GES composition methods by testing the success rate. shows that the random GES compositions have the worst reliability as it has lower success rates, and the success rates of the static QoS-based and EPSO methods are 100%. This result indicates that QoS-based methods have a considerable effect on improving reliability. If only considering the success rate, the static QoS-based and the EPSO methods are expected to support disaster emergency monitoring. However, emergency monitoring requires fast executions; thus, the proposed EPSO method has a greater advantage than the conventional static QoS-based methods. also shows that the success rate of the random GES compositions is the lowest when 30–50 concurrent requests are made, with 86% and 89%, respectively, and that the RT of the random GES compositions increases considerably at the same stage. Moreover, the success rate of the random GES composition method changes drastically during the whole experiment; all these results show that the random GES composition method hardly meets the high-reliability requirements of emergency environment monitoring.
The experiments demonstrate that the EPSO method can effectively improve the execution efficiency, stability, and reliability of GES composition in the edge computing environment based on emergency communication networks, which is crucial for emergency environment monitoring.
5. Conclusions
Due to global meteorological changes, natural disasters are becoming more frequent and intense, posing significant challenges to DER development. Building geographic information service chains solely relying on public networks is inadequate for DER requirements. The emergence of edge computing offers a new approach to support DER in emergency communication networks. Urgent research is needed to develop efficient, stable, and reliable GES composition methods in emergency communication networks, particularly for extreme DER scenarios.
This study focuses on the instability of GES chains in edge computing environments within emergency communication networks and proposes an EPSO-based algorithm to optimize GES compositions’ efficiency, stability, and reliability. A practical GES chain model is designed for emergency environment monitoring in disaster scenarios, and the EPSO algorithm is utilized for DER GES composition in edge computing environments. Experimental tests are conducted to evaluate the optimization effects of the EPSO-optimized GES composition algorithm, considering its efficiency, stability, and reliability. This research contributes to the feasibility of GES composition for emergency monitoring in edge computing environments within emergency communication networks, particularly in areas with poor public communication conditions.
Future improvements in the GES composition method within emergency communication networks can focus on the following areas: (1) Edge computing nodes are more prone to node crashes or service request failures than conventional central servers, which will lead to the incomplete log records of GESs, for example, missing log attributes. Incomplete QoS information will lower the quality of GES chain aggregation. Therefore, it is necessary to research the methods for QoS log maintenance to further support GES chain aggregation optimization. (2) Dynamic prediction of GES’s QoS by analyzing spatiotemporal factors to provide accurate QoS data for dynamic and efficient GES aggregation. (3) Optimization of dynamic and concurrent heterogeneous GES chain aggregation to address multiple concurrent requests at edge computing nodes during emergency response situations. Efficient and intelligent aggregation algorithms are needed for dynamic and concurrent heterogeneous GES chains. Addressing these issues will significantly improve the reliability, efficiency, and processing capabilities of emergency GES chains in emergency communication networks.
Data and codes availability statement
The source code and the GES QoS datasets can be downloaded from https://github.com/peventcloud/epso_gies.git. The acquired geospatial dataset (e.g. DOM, DSM, DEM, and hyperspectral images) cannot be shared publicly due to data protection restrictions.
Acknowledgments
This research was funded by the National Natural Science Foundation of China (NSFC) [Grant ID: 42271425, 41871312, 42271431].
Disclosure statement
No potential conflict of interest was reported by the author(s).
Additional information
Funding
References
- Altintas, I., J. Block, R. de Callafon, D. Crawl, C. Cowart, A. Gupta, M. Nguyen, et al. 2015. “Towards an Integrated Cyberinfrastructure for Scalable Data-driven Monitoring, Dynamic Prediction and Resilience of Wildfires.” Procedia Computer Science 51:1633–1642. https://doi.org/10.1016/j.procs.2015.05.296.
- Chen, M., A. Voinov, D. P. Ames, A. J. Kettner, J. L. Goodall, A. J. Jakeman, M. C. Barton, et al. 2020. “Position Paper: Open Web-distributed Integrated Geographic Modelling and Simulation to Enable Broader Participation and Applications.” Earth-Science Reviews 207:103223. doi:https://doi.org/10.1016/j.earscirev.2020.103223.
- Chen, C., C. Wang, B. Liu, C. He, L. Cong, and S. Wan. 2023. “Edge Intelligence Empowered Vehicle Detection and Image Segmentation for Autonomous Vehicles.” IEEE Transactions on Intelligent Transportation Systems, 1–12. https://doi.org/10.1109/TITS.2022.3232153.
- Chen, Z., N. Xiao, and D. Han. 2020. “Multilevel Task Offloading and Resource Optimization of Edge Computing Networks Considering UAV Relay and Green Energy.” Applied Sciences 10 (7): 2592. https://doi.org/10.3390/app10072592.
- Cheng, Z., Z. Gao, M. Liwang, L. Huang, X. Du, and M. Guizani. 2021. “Intelligent Task Offloading and Energy Allocation in the UAV-aided Mobile Edge-cloud Continuum.” IEEE Network 35 (5): 42–49. https://doi.org/10.1109/MNET.010.2100025.
- Eiben, A. E., and J. E. Smith. 2015. “Representation, Mutation, and Recombination.” In Introduction to Evolutionary Computing, edited by A. E. Eiben and J. E. Smith, 49–78. Berlin, Heidelberg: Springer.
- Fang, Z., J. Wang, J. Du, X. Hou, Y. Ren, and Z. Han. 2022. “Stochastic Optimization-aided Energy-efficient Information Collection in Internet of Underwater Things Networks.” IEEE Internet of Things Journal 9 (3): 1775–1789. https://doi.org/10.1109/JIOT.2021.3088279.
- Fekih, H., S. Mtibaa, and S. Bouamama. 2016. “User-centric Web Services Composition Approach Based on Swarm Intelligence.” Paper presented at the 2016 IEEE 18th International Conference on High Performance Computing and Communications; IEEE 14th International Conference on Smart City; IEEE 2nd International Conference on Data Science and Systems (HPCC/SmartCity/DSS), 12–14 December 2016.
- Felice, M. D., A. Trotta, L. Bedogni, K. R. Chowdhury, and L. Bononi. 2014. “Self-organizing Aerial Mesh Networks for Emergency Communication.” Paper presented at the 2014 IEEE 25th Annual International Symposium on Personal, Indoor, and Mobile Radio Communication (PIMRC), 2–5 September 2014.
- Gomes, T., J. Tapolcai, C. Esposito, D. Hutchison, F. Kuipers, J. Rak, A. de Sousa, et al. 2016. “A Survey of Strategies for Communication Networks to Protect Against Large-Scale Natural Disasters.” Proceedings of 2016 8th International Workshop on Resilient Networks Design and Modeling (RNDM), 11–22. https://doi.org/10.1109/RNDM.2016.7608263.
- Gong, J. 2013. “The Development of GIS: From System to Service and from Static to Dynamic.” Geomatics World 20 (3): 3–4. https://doi.org/10.3969/j.issn.1672-1586.2013.06.002.
- Hu, K., Z. Gui, X. Cheng, H. Wu, and S. C. McClure. 2019. “The Concept and Technologies of Quality of Geographic Information Service: Improving User Experience of GIServices in a Distributed Computing Environment.” ISPRS International Journal of Geo-Information 8 (3): 118. https://doi.org/10.3390/ijgi8030118.
- Huang, Q., J. Li, and Z. Li. 2018. “A Geospatial Hybrid Cloud Platform Based on Multi-sourced Computing and Model Resources for Geosciences.” International Journal of Digital Earth 11 (12): 1184–1204. https://doi.org/10.1080/17538947.2017.1385652.
- Katoch, S., S. S. Chauhan, and V. Kumar. 2021. “A Review on Genetic Algorithm: Past, Present, and Future.” Multimedia Tools and Applications 80 (5): 8091–8126. https://doi.org/10.1007/s11042-020-10139-6.
- Khan, W. Z., E. Ahmed, S. Hakak, I. Yaqoob, and A. Ahmed. 2019. “Edge Computing: A Survey.” Future Generation Computer Systems 97:219–235. https://doi.org/10.1016/j.future.2019.02.050.
- Klaine, P. V., J. P. B. Nadas, R. D. Souza, and M. A. Imran. 2018. “Distributed Drone Base Station Positioning for Emergency Cellular Networks Using Reinforcement Learning.” Cognitive Computation 10 (5): 790–804. https://doi.org/10.1007/s12559-018-9559-8.
- Li, D. 2017. “From Geomatics to Geospatial Intelligent Service Science.” Acta Geodaetica et Cartographica Sinica 46 (10): 1207–1212. https://doi.org/10.11947/j.AGCS.2017.20170263.
- Li, C., T. Lu, B. Fu, S. Wang, and J. Holden. 2022. “Sustainable City Development Challenged by Extreme Weather in a Warming World.” Geography and Sustainability 3 (2): 114–118. https://doi.org/10.1016/j.geosus.2022.04.001.
- Li, D., L. Zeng, N. Chen, J. Shan, L. Liu, Y. Fan, and W. Li. 2014. “A Framework Design for the Chinese National Disaster Reduction System of Systems (CNDRSS).” International Journal of Digital Earth 7 (1): 68–87. https://doi.org/10.1080/17538947.2013.783634.
- Liao, J. X., and X. W. Wu. 2020. “Resource Allocation and Task Scheduling Scheme in Priority-Based Hierarchical Edge Computing System.” Paper Presented at the 2020 19th International Symposium on Distributed Computing and Applications for Business Engineering and Science (DCABES), 16–19 October 2020.
- Niyazi, M., and J. Behnamian. 2022. “Application of Emerging Digital Technologies in Disaster Relief Operations: A Systematic Review.” Archives of Computational Methods in Engineering 30 (3): 1579–1599. https://doi.org/10.1007/s11831-022-09835-3.
- Reina, D. G., M. Askalani, S. L. Toral, F. Barrero, E. Asimakopoulou, and N. Bessis. 2015. “A Survey on Multihop Ad Hoc Networks for Disaster Response Scenarios.” International Journal of Distributed Sensor Networks 11 (10): 647037. https://doi.org/10.1155/2015/647037.
- Řezník, T., R. Chudý, and E. Mičietová. 2016. “Normalized Evaluation of the Performance, Capacity and Availability of Catalogue Services: A Pilot Study Based on INfrastruture for SPatial InfoRmation in Europe.” International Journal of Digital Earth 9 (4): 325–341. https://doi.org/10.1080/17538947.2015.1019581.
- Sakano, T., S. Kotabe, T. Komukai, T. Kumagai, Y. Shimizu, A. Takahara, T. Ngo, Z. M. Fadlullah, H. Nishiyama, and N. Kato. 2016. “Bringing Movable and Deployable Networks to Disaster Areas: Development and Field Test of MDRU.” IEEE Network 30 (1): 86–91. https://doi.org/10.1109/MNET.2016.7389836.
- Shi, W., J. Cao, Q. Zhang, Y. Li, and L. Xu. 2016. “Edge Computing: Vision and Challenges.” IEEE Internet of Things Journal 3 (5): 637–646. https://doi.org/10.1109/JIOT.2016.2579198.
- Sun, X., J. Chen, Y. Xia, Q. He, Y. Wang, X. Luo, R. Zhang, W. Han, and Q. Wu. 2018. “A Fluctuation-aware Approach for Predictive Web Service Composition.” Paper presented at the 2018 IEEE International Conference on Services Computing (SCC), 2–7 July 2018.
- Taalas, P., ed. 2021. “High-impact events in 2021.” In State of the Global Climate 202124–27. Geneva Switzerland: World Meteorological Organization (WMO).
- Tan, X., J. Jiao, N. Chen, F. Huang, L. Di, J. Wang, Z. Sha, and J. Liu. 2021. “Geoscience Model Service Integrated Workflow for Rainstorm Waterlogging Analysis.” International Journal of Digital Earth 14 (7): 851–873. https://doi.org/10.1080/17538947.2021.1898686.
- Tan, X., J. Jiao, Y. Zhong, A. Ma, Y. Xu, Z. Sha, F. Huang, Y. Wan, and W. Hu. 2022. “The CNRIEEEMC: A Communication-Navigation-remote Sensing-integrated Ecological Environment Emergency Monitoring Chain for Tailings Areas.” International Journal of Applied Earth Observation and Geoinformation 108:102710. https://doi.org/10.1016/j.jag.2022.102710.
- Ujjwal, K. C., S. Garg, J. Hilton, J. Aryal, and N. Forbes-Smith. 2019. “Cloud Computing in Natural Hazard Modeling Systems: Current Research Trends and Future Directions.” International Journal of Disaster Risk Reduction 38:101188. https://doi.org/10.1016/j.ijdrr.2019.101188.
- Wang, Y., K. L. Man, K. Lee, D. Hughes, S.-U. Guan, and P. Wong. 2020. “Application of Wireless Sensor Network Based on Hierarchical Edge Computing Structure in Rapid Response System.” Electronics 9 (7). https://doi.org/10.3390/electronics9071176.
- Wu, Y., H. Guo, C. Chakraborty, M. Khosravi, S. Berretti, and S. Wan. 2022. “Edge Computing Driven Low-light Image Dynamic Enhancement for Object Detection.” IEEE Transactions on Network Science and Engineering, 1. https://doi.org/10.1109/TNSE.2022.3151502.
- Xu, J., K. Ota, and M. Dong. 2020a. “Big Data on the Fly: UAV-mounted Mobile Edge Computing for Disaster Management.” IEEE Transactions on Network Science and Engineering 7 (4): 2620–2630. https://doi.org/10.1109/TNSE.2020.3016569.
- Xu, J., K. Ota, and M. Dong. 2020b. “Fast Deployment of Emergency Fog Service for Disaster Response.” IEEE Network 34 (6): 100–105. https://doi.org/10.1109/MNET.001.1900671.
- Yang, C., Z. Xie, and Z. Xu. 2016. “An Asynchronous Geoprocessing Workflow and its Application to an Antarctic Ozone Monitoring and Mapping Service.” International Journal of Digital Earth 9 (2): 156–170. https://doi.org/10.1080/17538947.2014.967318.
- Zhang, C., L. Di, Z. Sun, L. Lin, E. G. Yu, and J. Gaigalas. 2019. “Exploring Cloud-based Web Processing Service: A Case Study on the Implementation of CMAQ as a Service.” Environmental Modelling & Software 113:29–41. https://doi.org/10.1016/j.envsoft.2018.11.019.
- Zhang, C., Z. Yang, H. Zhao, Z. Sun, L. Di, R. Bindlish, P.-W. Liu, et al. 2022. “Crop-CASMA: A Web Geoprocessing and Map Service Based Architecture and Implementation for Serving Soil Moisture and Crop Vegetation Condition Data Over U.S. Cropland.” International Journal of Applied Earth Observation and Geoinformation 112:102902. https://doi.org/10.1016/j.jag.2022.102902.
- Zhao, N., W. Lu, M. Sheng, Y. Chen, J. Tang, F. R. Yu, and K. K. Wong. 2019. “UAV-assisted Emergency Networks in Disasters.” IEEE Wireless Communications 26 (1): 45–51. https://doi.org/10.1109/MWC.2018.1800160.