
 ?Mathematical formulae have been encoded as MathML and are displayed in this HTML version using MathJax in order to improve their display. Uncheck the box to turn MathJax off. This feature requires Javascript. Click on a formula to zoom.
ABSTRACT
High resolution satellite images are becoming increasingly available for urban multi-temporal semantic understanding. However, few datasets can be used for land-use/land-cover (LULC) classification, binary change detection (BCD) and semantic change detection (SCD) simultaneously because classification datasets always have one time phase and BCD datasets focus only on the changed location, ignoring the changed classes. Public SCD datasets are rare but much needed. To solve the above problems, a tri-temporal SCD dataset made up of Gaofen-2 (GF-2) remote sensing imagery (with 11 LULC classes and 60 change directions) was built in this study, namely, the Wuhan Urban Semantic Understanding (WUSU) dataset. Popular deep learning based methods for LULC classification, BCD and SCD are tested to verify the reliability of WUSU. A Siamese-based multi-task joint framework with a multi-task joint loss (MJ loss) named ChangeMJ is proposed to restore the object boundaries and obtains the best results in LULC classification, BCD and SCD, compared to the state-of-the-art (SOTA) methods. Finally, a large spatial-scale mapping for Wuhan central urban area is carried out to verify that the WUSU dataset and the ChangeMJ framework have good application values.
1. Introduction
The urbanization process reflects the symbiosis between human activities and the ecological environment (Manoli et al. Citation2019). The rapid urbanization in the twenty-first century has resulted in several environmental problems, such as the degradation of arable land and forest land (Tong et al. Citation2020) and the expansion of cities (Reba and Seto Citation2020). Remote sensing semantic understanding, including land-use/land-cover (LULC) extraction and change analysis is emerging as an effective way to better characterize urban environments, which is conducive to promoting the sustainable development of human society (Huang et al. Citation2020; Smith et al. Citation2016). Semantic change detection (SCD), cannot only locate change regions but also identify change directions related to LULC types. Therefore, SCD is usually regarded as an integration of binary change detection (BCD) which answers ‘where changes occur’ (Singh Citation1989), and LULC classification which aims to designate each pixel in an image with a predefined LULC label (Zhao et al. Citation2016).
After decades of methodological development, the era of deep learning for remote sensing big data has started since the 2010s, allowing the exploration of deeper spectral-spatial features (Hua, Mou, and Zhu Citation2019; Xing et al. Citation2020). Deep learning based semantic segmentation models, as an important basis for LULC classification and change detection, nowadays have two main categories. One is based on convolutional neural network (CNN) architecture and the other is based on transformer architecture. CNN-based models, including U-Net (Ronneberger, Fischer, and Brox Citation2015), the DeepLab series of networks (Chen et al. Citation2014, Citation2018), the feature pyramid network (FPN) (Lin et al. Citation2017), and HRNet (Sun et al. Citation2019), reduce the image resolution by pooling and convolution with a fixed-size convolutional kernel. While transformer-based methods, including the Shifted Window (Swin) Transformer (Liu et al. Citation2021) and SegFormer (Xie et al. Citation2021), require more computational resources, albeit with powerful modeling ability.
The siamese architecture has been widely used in change detection by extracting features from two independent inputs with a shared structure, except for the early fusion (EF) strategy, where different images are treated as concatenated input channels and fed together into a network (Daudt, Le Saux, and Boulch Citation2018). Recently, the attention mechanism has also been introduced into Siamese frameworks to extract more discriminative features. Bitemporal image transformer (BIT) introduces transformer into BCD (Chen, Qi, and Shi Citation2021). ChangeFormer puts a transformer encoder into a Siamese framework so that details and robust semantic features can be reserved (Bandara and Patel Citation2022).
Recently, deep learning based Siamese frameworks have tried to combine BCD and LULC classification for SCD such as the spatially and semantically enhanced Siamese network (SSESN) (Zhao et al. Citation2022) and the Bi-temporal Semantic Reasoning Network (Bi-SRNet) (Ding et al. Citation2022). A weight-shared encoder is used to extract bitemporal features and multiple headers support mapping for multiple tasks. This solves the problems of the traditional SCD methods, where the direct comparison (DC) strategy that treats SCD as a multi-temporal LULC classification requires a large number of ‘from-to’ labels, while the post-classification comparison (PCC) strategy that obtains semantic changes by comparing co-registered LULC classification maps, requires more parameters and results in error accumulation. However, Siamese-based SCD frameworks are difficult to balance on three tasks, focusing on improving the contribution of BCD to LULC classification and SCD and ignoring the influence of LULC mapping quality on change detection mapping.
All deep learning based methods are data driven. Well-annotated datasets are one of the most crucial factors facilitating training models with the generalization capability. However, single-temporal LULC datasets are incapable of training models to learn about change information. BCD datasets are unable to capture the variety of changed LULC types because only the range of changes are labeled. Although several SCD datasets have been released recently, they still have some limitations. For instance, the High Resolution Semantic Change Detection (HRSCD) dataset (Daudt et al. Citation2019) lacks the subdivision of artificial surfaces, thus limiting the potential for analyzing urban structural changes. The popular SECOND dataset (Yang et al. Citation2022), does not annotate unchanged areas, leading to the same problem of neglecting LULC mapping for unchanged regions. What’s more, most datasets are collected in the form of unified patches, without geographic continuity over a large area.
To address the above problems, a multi-temporal large-scale geographically continuous urban semantic dataset named the Wuhan Urban Semantic Understanding (WUSU) dataset made up of multi-band Gaofen-2 (GF-2) remote sensing imagery with a 1-m spatial resolution was built in this study. The WUSU dataset was annotated with a refined class system of 11 LULC classes over the entire study area, covering three time phases, and 60 change directions were generated. Global-wide annotations are useful for LULC mapping and global assessments.
In order to verify the reliability of WUSU and sufficiently exploit the relationship between LULC classification and BCD to better complete the SCD mapping, a multi-task joint change detection framework (abbreviated by ChangeMJ) was proposed. A multi-task joint loss (MJ loss) was embedded in ChangeMJ to recover the building boundaries. In order to evaluate the effectiveness of ChangeMJ for building extraction more rationally, a multi-task joint F1 score (MJF1) was proposed.
The two major contributions of this paper are summarized as follows:
A multi-temporal multi-task dataset for urban semantic understanding named the WUSU dataset is presented. The WUSU dataset made up of GF-2 images with 1-m spatial resolution has the most LULC classes and time phases among the public SCD datasets, and the semantic annotations cover the whole study area with large-scale geographic continuity. The WUSU dataset has the finest class system for urban construction among public change detection datasets.
The popular deep learning networks for LULC classification, BCD and SCD are tested to provide a benchmark for further studies. A Siamese framework named ChangeMJ framework is proposed for LULC mapping, BCD mapping and SCD mapping simultaneously and its generalization and validity is confirmed on WUSU and another SCD dataset. The MJ loss is introduced in ChangeMJ to obtain refined mapping results by recovering building boundary information. The MJF1 is proposed for result evaluation, considering the building refinement.
The rest of the paper is organized as follows. Section 2 presents the related public datasets. The proposed WUSU dataset is introduced in Section 3. Section 4 describes the proposed ChangeMJ framework with a MJ loss, and a metric MJF1 for refined mapping. Section 5 gives the experimental analysis. The generalization and reliability of ChangeMJ, and the benefits of WUSU are discussed in Section 6. Finally, the conclusions are drawn in Section 7.
2. Public datasets for land-use/land-cover classification and change detection
Several public datasets with spatial resolution better than 10 m for LULC classification, BCD and SCD are reviewed and listed in chronological order in and (More information can be found in https://github.com/AngieNikki/openWUSU).
Table 1. The publicly available remote sensing based LULC datasets.
Table 2. The publicly available remote sensing based CD datasets
As shown in , the LULC classification dataset with the largest area is GID, which has five classes labeled at the pixel level and lacks spatial details due to the 4-m spatial resolution. Some datasets made up of high resolution images and with a refined class system, such as DLRSD and LoveDA, have a small field of view that neglects the large-scale spatial dependence. In addition, the images are mostly of only three bands, which ignores the significance of other bands for feature extraction, especially the near-infrared band. Most of all, all the LULC datasets have only one time phase.
Both temporal information and LULC information are important for analyzing urban development. However, change detection datasets mostly focus on BCD. The SECOND dataset contains temporal and LULC information, but has no LULC annotations in unchanged areas. The Hi-UCD mini dataset, which is the only public tri-temporal SCD dataset equipped with global-wide LULC annotations, has a small receptive field in each patch, and the geographical area is about only 30 km2.
Therefore, a multi-temporal dataset with global-wide semantic annotation based on multi-band high resolution imagery is urgently needed to support the technological development for LULC classification, BCD and SCD tasks.
3. Study areas and the proposed WUSU dataset
For better integrating spectral and spatial information, GF-2 images with an effective spatial resolution of 1 m in panchromatic mode and 4 m in multispectral mode were adopted to construct the dataset. Two Chinese urban regions with great potential and speed of development were selected as the study area and a detailed class system of urban LULC was then established.
3.1. Study areas
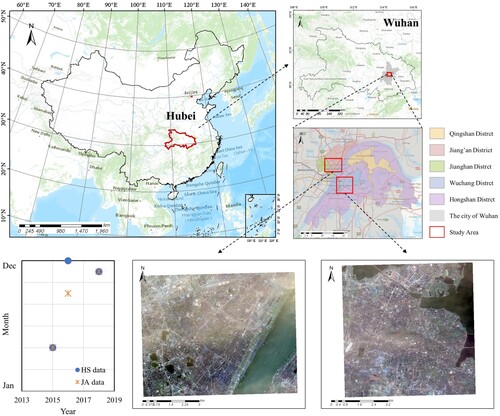
Wuhan is the main city of the Yangtze River Economic Belt. During the past ‘13th Five-Year Plan’, Jiang’an District has been committed to building a new spatial development pattern and Hongshan District has been focusing on improving the urban functional quality. These two central urban districts are still key development areas in the ‘14th Five-Year Plan’. Therefore, the two districts covering a total geographic area of nearly 80 km2 were chosen as the study areas ().
Figure 1. The study areas in the city of Wuhan, Hubei province, China.
3.2. WUSU dataset
The construction of the WUSU dataset is shown in and the specific procedures are detailed as following.
Figure 2. The construction workflow of the WUSU dataset.
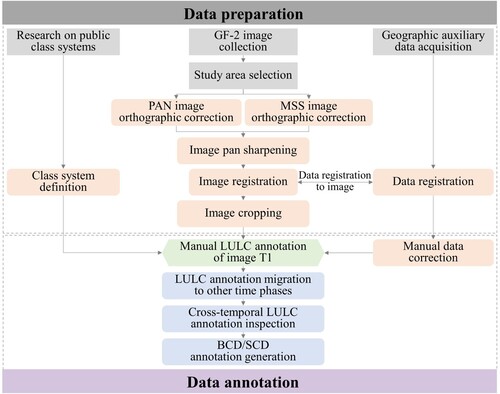
3.2.1. Image pre-processing for the WUSU dataset
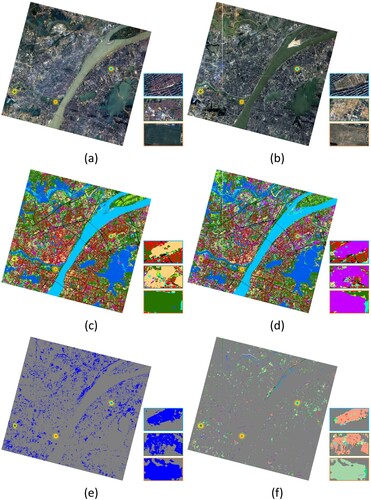
First, the available GF-2 images were screened for cloud cover less than 5% in an image. Candidate images then underwent pre-processing, including PAN image orthographic correction, MSS image orthographic correction and image pan sharpening. Multi-temporal image registration was performed for change detection tasks, requiring the root-mean-square error (RMSE) of less than 1 pixel. Finally, through image cropping, images for Hongshan District with pixels were obtained for April 22, 2015, September 1, 2016, and November 23, 2018 (a–c), and images for Jiang’an District with
pixels were obtained for April 22, 2015, December 8, 2016, and November 23, 2018 (d–f). Hence, 4-band fusion satellite images with 1-m spatial resolution were formed for the construction of the WUSU dataset.
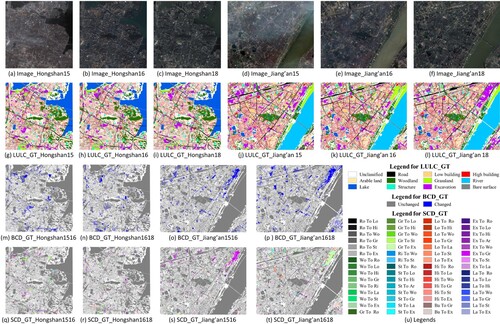
Figure 3. The WUSU dataset. GT represents the ground truth. (a)–(f) Images of Hongshan District and Jiang’an District taken in 2015, 2016 and 2018. (g)–(l) LULC_GT annotations for images (a)–(f). (m)–(p) BCD_GT annotations for the two districts between 2015 and 2016 and between 2016 and 2018. (q)–(t) SCD_GT annotations for the two districts between 2015 and 2016 and between 2016 and 2018. (u) Legends where the abbreviation in the legend for SCD_GT is the first two letters of each LULC class name.
3.2.2. Label generation for the WUSU dataset
Class system definition. The WUSU class system refers to the Chinese Land Use Classification Criteria (GB/T21010-2017) and the Contents and Indicators of the Chinese Geographical Conditions Census (GDPJ 01-2013). As shown in , the first-level classes in the two documents are listed and their correspondences are indicated by arrows. The classes of natural surfaces in the two documents are the same, such as ‘Arable land’ and ‘Woodland’, so they were inherited in WUSU. There are some intersections between the classes of artificial surfaces of the two documents. For example, ‘Structure’ or ‘Excavation’ can occur in various land use areas such as ‘Commercial land’ or ‘Residential land’. Therefore, the classes of artificial surfaces in two documents were adjusted according to the characteristics of the study area. Eleven classes are consequently included in the class system of WUSU: 1-Road, 2-Low building, 3-High building, 4-Arable land, 5-Woodland, 6-Grassland, 7-River, 8-Lake, 9-Structure, 10-Excavation, and 11-Bare surface. Areas not containing any of the above 11 classes are labeled as ‘unclassified’, and are marked as 0. Examples and detailed descriptions of all the classes are provided in . The distinction of ‘River’ (referring specifically to the Yangtze River in WUSU) and ‘Lake’ mainly considers the special geographical location of Wuhan. The 11 LULC classes lead to 60 change directions which can be find in .
Figure 4. Examples and descriptions of each class in the WUSU dataset.
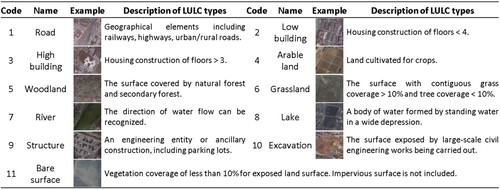
Table 3. The class systems used in Chinese public documents.
Label annotation. The building outlines were derived from the open-source building vectors and registered to the co-registered images. Other classes were manually annotated by the expert group RSIDEA to ensure high accuracy. High buildings have different tilt angles in multi-temporal images, so building annotations are snapped to the building footprints. Building annotations were then modified to match images at different time phases. As a result, WUSU is unique in that the building classes are fully annotated with accurate boundaries while other classes are partially annotated due to the challenges of shadow obscuration for low impervious surfaces and indistinct boundaries for natural surfaces. A cross-temporal inspection was performed on the LULC annotations to ensure that annotations for unchanged areas were not shifted. Finally, the proportion of annotated pixels is 54.31%, 56.75%, and 56.14% for the images from 2015, 2016, and 2018 respectively.
3.2.3. Characteristics and challenges of the WUSU dataset
The WUSU dataset has the most LULC classes, bands, and time phases among the publicly available change detection datasets, as shown in and . WUSU contains richer urban structure information than HRSCD and has twice the geographical area of Hi-UCD mini. LULC annotations are provided in the unchanged areas, providing more training data. The notable characteristics of WUSU are as follows:
Figure 5. The characteristics of WUSU compared with popular SCD datasets. The closer to the pole, the higher the ranking.
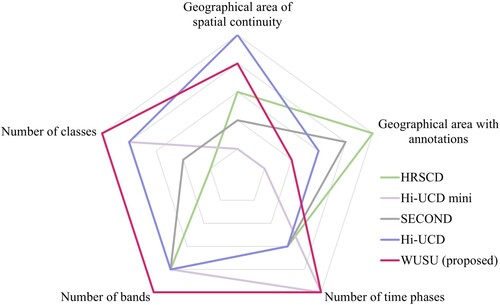
Geographic-temporal continuity. The tri-temporal high resolution WUSU dataset has a large spatial scale, and is not composed of small patches, allowing model training to explore spatial–temporal correlations over a continuous geographic area.
Refined class system. The WUSU dataset has the most LULC classes and change directions, compared to the public SCD datasets. The proportions of annotated pixels for different LULC classes in three years are shown in .
Figure 6. Pixel statistics for the LULC distribution of WUSU in 2015, 2016, and 2018.
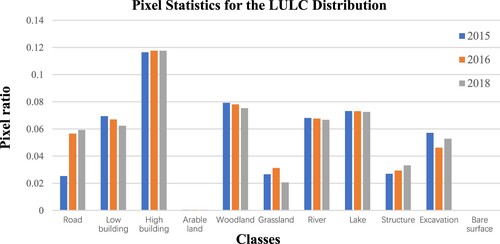
Urbanization process. The WUSU dataset focuses on urban areas, so ‘Structure’ and ‘Excavation’ areas with a high potential for change are annotated. For urban development, building reconstruction has become a major trend in recent years, so ‘High building’ and ‘Low building’ are distinguished.
4. A multi-task joint change detection framework for refined mapping
For Siamese-based SCD framework, the problem of modeling the temporal dependency remains when the semantic and change features are introduced into the decoder structure simultaneously. Commonly used temporal dependency representations are concatenation and difference of temporal features. However, there are problems of temporal order restriction and weak feature representation separately. ChangeMask (Zheng et al. Citation2022) introduced a temporal-symmetric transformer (TST) into a Siamese-based framework to guarantee the change representation with temporal symmetry and strong discrimination. TST, consisting of spatial–temporal interaction and symmetric fusion, computes the temporal relationship embedded in the encoded features layer by layer.
To further optimize semantic features, a multi-task joint change detection framework named ChangeMJ () was proposed based on ChangeMask. ChangeMJ is an end-to-end weight-shared Siamese-based framework where any SOTA deep network can be chosen as the semantic encoder. The semantic decoder and the change decoder use the decoder proposed in U-Net.
Figure 7. The flowchart of the proposed ChangeMJ framework.
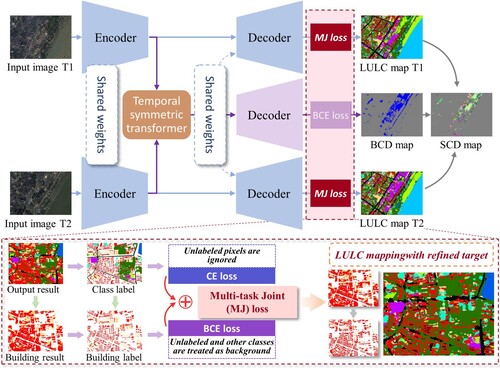
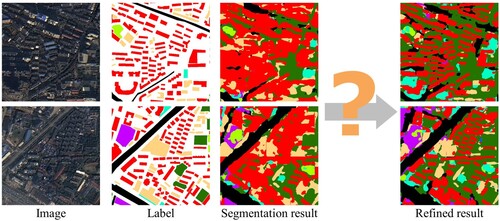
Cross Entropy loss (CE loss) is usually chosen for semantic segmentation. But the unclassified pixels in WUSU can blur the object boundaries as shown in . Unclassified pixels surrounding the buildings are easily classified as buildings, which is not consistent with the true land surfaces. Therefore, a multi-task joint loss (MJ loss) was put forward for the semantic branch of ChangeMJ to obtain refined LULC and change detection maps.
Figure 8. The problem of fuzzy boundaries.
Finally, Binary Cross Entropy loss (BCE loss) for the change branch and MJ loss for the semantic branch constitute the total loss. The expression of total loss is shown in Equation (1).
(1)
(1) where
and
separately represents the MJ loss to supervise semantic branches for the two time phases.
is BCE loss to supervise the change branch.
MJ loss effectively restored the shape of the buildings. A multi-task joint F1 score (MJF1) was consequently proposed to quantitatively evaluated the mapping refinement.
4.1. The multi-task joint loss function (MJ loss)
The MJ loss distinguishes ‘Low building’ and ‘High building’ from other LULC classes which are partially labeled. As seen in , the MJ loss is the integration of CE loss for all classes and BCE loss for two building-related classes. In the part of CE loss for all classes, the unlabeled pixels are ignored. The BCE loss for ‘Low building’ and ‘High building’ is calculated in Equation (2). For example, when calculating the BCE loss for ‘Low building’, ‘High building’ and other classes are treated as background so that the building boundaries can be defined.
(2)
(2) where
is the number of classes,
and
is respectively the target and predict value,
is the set of class codes for which the BCE loss is to be calculated separately. Here,
where the correspondence between the class code and class name can refer to .
is the length of set
.
is the one-hot encoding of all the
classes excluding the ‘unclassified’.
is the binary map, where pixels of class
(
) are marked as 1 and pixels of other classes including ‘unclassified’ are marked as 0.
4.2. The multi-task joint F1 score (MJF1)
Considering the characteristics of WUSU that the buildings are fully labeled with accurate boundaries, a multi-task joint F1 score (MJF1) was proposed to evaluate the semantic branch. MJF1 which is more suitable for urban areas, aims to evaluate the extraction accuracy of building boundaries. MJF1 is a separated F1 score where one part is designed for classes other than the two building classes and the other part is calculated for ‘Low building’ and ‘High building’. Therefore, the MJF1 is defined as Equation (3).
(3)
(3) where
is the element of the
th column and the
th row in the confusion matrix
. For classes except the building classes, unclassified pixels are ignored when evaluating. But the other classes including ‘unclassified’ are considered as the negative class when evaluating for ‘Low building’ or ‘High building’.
5. Experiments and results
5.1. Experimental settings and accuracy assessment
Representative methods of three tasks were tested on WUSU (). Considering similarity in parameter quantity and balance in simplicity and computational efficiency, ResNet-50 (He et al. Citation2016), HRNet-w32, a tiny Swin Transformer Swin-T (Liu et al. Citation2021) and Mix Transformer Mit-B2 (Xie et al. Citation2021) were chosen as the backbones. For ChangeMask and ChangeMJ, HRNet-w32 and ResNet-50 were chosen as backbones for contrast experiments. The PCC strategy is based on FPN and HRNet due to their good performance. All backbones are pre-trained with ImageNet. The top halves of the six images were used as the testing set, and the bottom halves were combined to form the training set. The parameters for the tested models are set as .
Table 4. The comparison methods for LULC classification, BCD and SCD.
Table 5. Parameter settings for deep learning models.
Evaluation metrics introduced for different tasks are shown in . The missed alarms (MA), false alarms (FA) and changed F1-score (cF1) for BCD treated ‘Change’ as the positive class. The mean intersection over union (mIoU) gives the same weights for ‘No change’ and the rest class(es) in both BCD and SCD tasks. The mIoU for SCD and the separated kappa (SeK) coefficient (Yang et al. Citation2022) aim to evaluate SCD results by escaping the impact of class imbalance.
Table 6. Metrics for the quantitative analysis.
5.2. Experimental results for land-use/land-cover classification
The LULC mapping results and details are shown in and separately. Transformer-based methods balance the completeness and detail compared with CNN-based methods. Siamese-based frameworks show better visualization than single-task segmentation models due to the temporal interaction. SSESN and Bi-SRNet best differentiate ‘River’ and ‘Lake’ due to their additional modules to enhance the semantic features using change features but such strategies also introduce the overfitting problem, which will be shown in the next section. For most comparison methods, each building is well distinguished if there are other class annotations around the buildings (yellow boxes in ), otherwise the buildings stick together (cyan boxes in ). ChangeMJ restores the building shapes, so that other classes, such as ‘Structure’, can be extracted more accurately in ChangeMJ results.
Figure 9. LULC maps for Hongshan and Jiang’an Districts. Notes (R) or (H) separately means setting ResNet-50 or HRNet-w32 as the backbone.
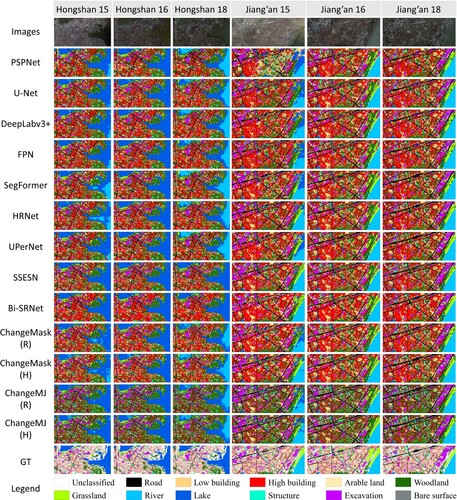
Figure 10. Detailed 2016 LULC maps for WUSU.
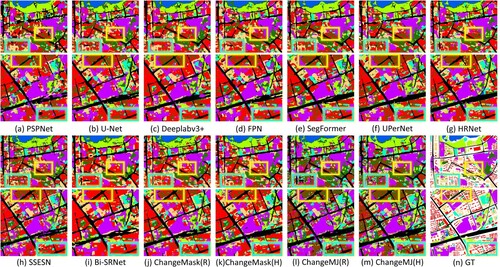
The quantitative results () are consistent with the above conclusions. FPN achieves the best scores among the CNN-based methods with ResNet-50 as the backbone. HRNet shows abundant details and a higher continuity for ‘Road’ even than SegFormer and UPerNet, proving that the high spatial resolution is mantained in HRNet.
Table 7. Quantitative results of LULC classification for WUSU.
5.3. Experimental results for change detection
The BCD and SCD results are separately shown in and , and the quantitative results are listed in and . Details of BCD and SCD from 2016 to 2018 are shown in and .
Figure 11. BCD maps for Hongshan and Jiang’an Districts.
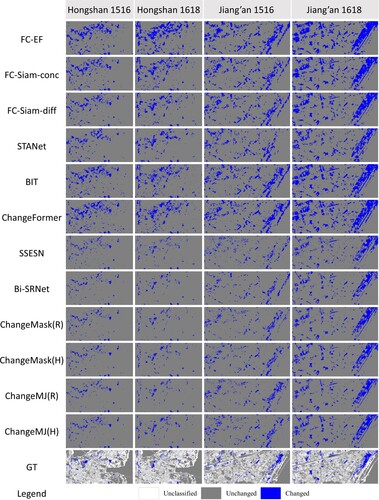
Figure 12. SCD maps for Hongshan and Jiang’an Districts.
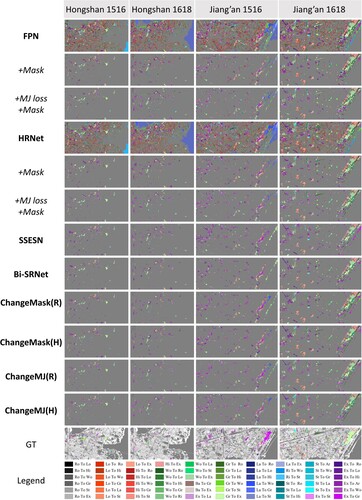
Figure 13. Detailed BCD maps from 2016 to 2018 for the WUSU dataset.
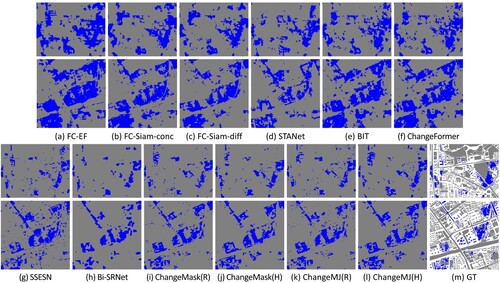
Figure 14. Detailed SCD maps from 2016 to 2018 for the WUSU dataset.
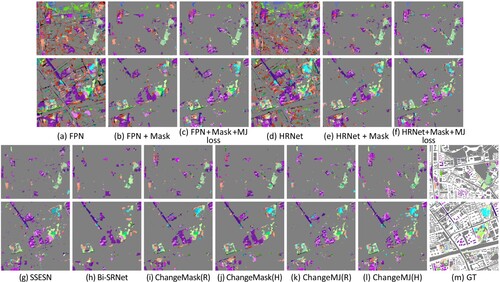
Table 8. Quantitative results of BCD for WUSU.
Table 9. Quantitative results of SCD for WUSU.
For BCD, stacking images in FC-EF brings a high FA. STANet eliminates the noise in unchanged areas but results in a high MA. BIT and ChangeFormer also bring high FA. FC-Siam-diff obtains the best results and keeps a good balance between FA and MA, indicating that a simple network may be appropriate for WUSU. Overdrawing the semantic features of different time phases in SSESN leads to a lot of MA in BCD results. Bi-SRNet has the similar problem to SSESN and brings the highest MA.
ChangeMask and ChangeMJ have significant advantages over the other methods due to a balance between the use of semantic and change information. HRNet-w32 that leads to better LULC classification performance than ResNet-50 also leads to a better BCD result in ChangeMask and ChangeMJ. This is further evidence of the importance of semantic branches for BCD. It can be found that using MJ loss not only improves the LULC classification accuracy but also benefits BCD by comparing the results of ChangeMJ and ChangeMask with the same backbone.
Masked by the best BCD maps, the SCD results based on PCC have significant improvement (). Introducing the MJ loss to PCC-mask based methods, the visualization results and the metric scores have further advanced. SSESN and Bi-SRNet overfit the semantic features and ignore the change branch, which also results in poor SCD results. A similar conclusion still comes that better semantic features promote to better BCD and SCD results by comparing ChangeMask and ChangeMJ. Therefore, annotations in unchanged areas are proved to have a positive influence for the three tasks.
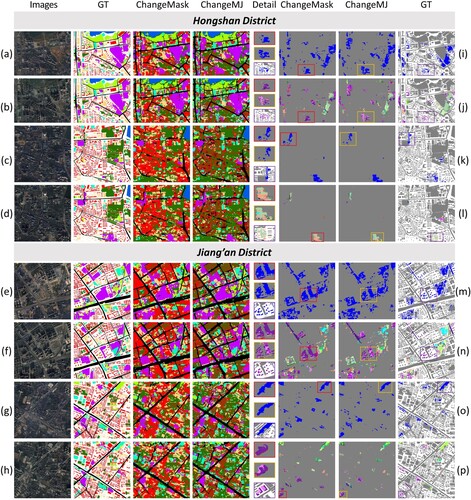
To better demonstrate the effectiveness of the MJ loss, the detailed maps of two regions are demonstrated in . By using the MJ loss, the mapping quality and precision are improved and the building classes especially the stand-alone buildings are separated from each other. The LULC maps from ChangeMJ show that the buildings are surrounded by ‘Woodland’, reflecting the high degree of urbanization to some extent. Whether in the LULC maps or in the change detection maps, ChangeMJ mantains more refined boundaries than ChangeMask.
Figure 15. Detailed LULC, BCD, SCD mapping results for WUSU. (a)-(h) Image, LULC_GT, ChangeMask result and ChangeMJ result in 2016 and 2018. (i)-(p) Corresponding BCD/SCD ChangeMask result, ChangeMJ result and GT in 2016 and 2018.
6. Discussion
6.1. Validity of the proposed ChangeMJ framework on Hi-UCD mini dataset
Experiments on Hi-UCD mini were conducted to assess the generalization of ChangeMJ. Hi-UCD mini uses aerial images with 0.1 m to construct tri-temporal semantic changes in urban area of Tallinn, the capital of Estonia. The data division of training and testing is consistent with the scheme provided by the authors, with 2017 and 2018 used as training. The experimental settings are the same as those on WUSU. The quantitative results for three tasks are separately listed in .
Table 10. Quantitative results of LULC classification for Hi-UCD mini.
Table 11. Quantitative results of BCD for Hi-UCD mini.
Table 12. Quantitative results of SCD for Hi-UCD mini.
Although the spatial resolution of Hi-UCD mini is extremely higher than that of WUSU, ChangeMJ still achieves the best results. ChangeMJ outperforms most single-task LULC classification models and all BCD models. ChangeMJ achieves superior BCD and SCD accuracies, surpassing SSESN and Bi-SRNet, while maintaining a balanced performance across different tasks.
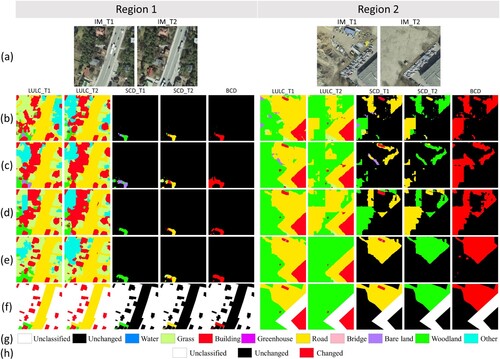
In terms of visualization, ChangeMJ can find building instances and their changes more accurately and in finer detail than other methods ( left). In other classes, ChangeMJ also learns features with generalization better and the LULC classification, BCD and SCD results are more accurate ( right).
Figure 16. The LULC classification, BCD and SCD results for the test set of Hi-UCD mini. (a) Images. (b) SSESN. (c) Bi-SRNet. (d) ChangeMask(H). (e) ChangeMJ(H). (f) GT. (g) Legend for LULC_GT and SCD_GT. (h) Legend for BCD_GT.
6.2. Comparison of multi-task frameworks
The results of these multi-task frameworks on LULC classification, BCD and SCD for WUSU and Hi-UCD mini datasets are aggregated to better demonstrate the characteristics of each framework. MJF1, cF1, SeK was separately selected for three tasks to create a bar chart to represent the effects of these frameworks ().
Figure 17. Accuracy comparison chart of multi-task frameworks.
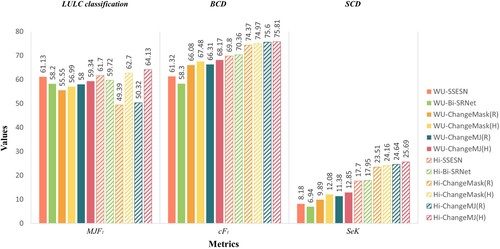
According to the Average Kappa in , all frameworks achieved higher values on Hi-UCD mini with higher spatial resolution and less classes, which illustrates the challenges of WUSU. SSESN and Bi-SRNet present slightly better results than the other frameworks for LULC classification and significantly worse results for BCD and SCD on both datasets, suggesting that they overfit semantic features of two branches, resulting in MA of changes. ChangeMJ(H) achieved optimal results on all indicators except the LULC classification index of WUSU. It can also be seen from that SSESN and Bi-SRNet optimize the results of LULC to some extent, but are inferior to ChangeMJ (H) in terms of generalization and reliability.
Table 13. Quantitative results of different Siamese-based frameworks on three tasks for WUSU and Hi-UCD mini datasets.
6.3. Change analysis for Wuhan central urban area
By training ChangeMJ with the whole WUSU dataset, the mapping in the central urban area of Wuhan has been realized. The LULC maps for 2016 and 2018 and the BCD and SCD maps are shown in . Some local regions are enlarged to show more details. The mapping results show that WUSU with refined annotations can be used to achieve a wide range of multi-task mapping and works in a larger spatial and temporal dimension.
Figure 18. The LULC classification, BCD and SCD maps for Wuhan central urban area in 2016 and 2018.
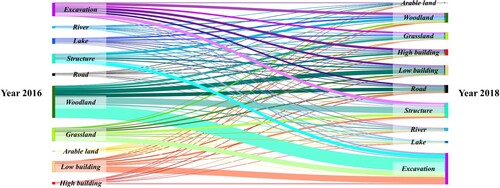
As shown in , the data flow shown in the Sankey map for Wuhan central urban area represents the change directions. Many changes are from ‘Low building’ to ‘Excavation’ and from ‘Grassland’ or ‘Woodland’ to ‘Excavation’, indicating a high speed of urbanization. The ‘High building’ and ‘Structure’ are increasing from year to year, reflecting the acceleration of urbanization. The inflows of ‘Structure’ and ‘Road’ are greater than the outflows respectively, which is closely related to Wuhan's increased investment in urban construction and transportation construction at that time, indicating that the urban landscape and transportation conditions are improving.
Figure 19. The Sankey map of the change from 2016 to 2018 in Wuhan central urban area.
6.4. Further uses and benefits of the WUSU dataset
WUSU is the first publicly available SCD dataset in Chinese urban areas with the most fine-grained feature classes and annotations. Researchers can use WUSU to train and evaluate algorithms, discover new associations and trends, and drive advances in remote sensing academia and industry.
WUSU can be used for a higher level of functional zoning in the urban scene dimension. By analyzing WUSU, differences of land use structure in different urban functional zones can be identified, which is of great significance for urban management and planning due to the rapid urban change (Feng et al. Citation2021; Huang et al. Citation2020). As shown in , vegetation and buildings have different densities in different functional zones. Educational land uses appear to have more structures such as playgrounds. Vacant land uses are often covered by excavations and vegetation. WUSU can also further depict the residential lands.
Figure 20. Schematic of the WUSU dataset guiding the perception of urban functional areas.
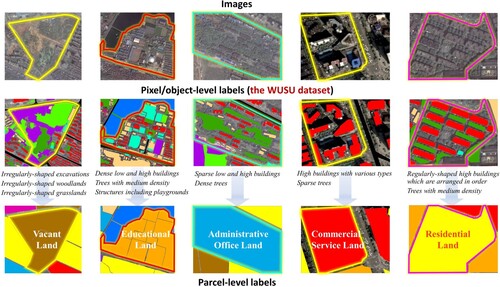
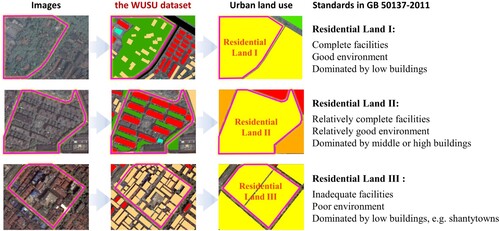
According to the Chinese Code for Classification of Urban Land Use and Planning Standards of Development Land (GB 50137-2011), residential lands can be classified into three levels based on factors such as the environment, facilities and architectural characteristics. These elements can be depicted using WUSU, as illustrated in .
Figure 21. Examples of the WUSU dataset guiding the more detailed classification of ‘Residential Land’.
These analyses combined WUSU and urban functional zones are helpful for urban planning departments to monitor and make decisions on urban development to improve the quality of urban development, and will be one of our future research.
7. Conclusion
The WUSU dataset is a tri-temporal remote sensing dataset made up of GF-2 remote sensing imagery with high spatial resolution, which is appropriate for LULC classification, BCD, and SCD. WUSU has distinctive characteristics, i.e. geographic-temporal continuity, a refined class system, and rich urban structure information. In this study, 7 public deep learning based LULC classification methods, 6 BCD methods and 3 multi-task frameworks are selected to tested for WUSU. To complete refined LULC classification maps as well as more accurate change detection maps, MJ loss was introduced to the proposed ChangeMJ framework to recover the building boundaries. MJF1 was therefore proposed to evaluate the degree of mapping refinement and boundary retention. The experimental results showed that the ChangeMJ framework achieved the best results in all the three tasks and confirmed the importance of multi-temporal semantic features for change detection tasks. The generalization and validity of ChangeMJ was also confirmed on another SCD datasets. The WUSU dataset is the only tri-temporal semantic annotation dataset for China based on high resolution GF-2 images. In our future work, the WUSU dataset will be expanded and applied to other tasks.
Disclosure statement
No potential conflict of interest was reported by the author(s).
Data availability statement
The proposed WUSU dataset and other mentioned public datasets can be accessible at: https://github.com/AngieNikki/openWUSU.
Additional information
Funding
References
- Bandara, Wele Gedara Chaminda, and Vishal M. Patel. 2022. “A Transformer-Based Siamese Network for Change Detection.” Paper presented at the IGARSS 2022-2022 IEEE International Geoscience and Remote Sensing Symposium.
- Benedek, C., and T. Sziranyi. 2009. “Change Detection in Optical Aerial Images by a Multilayer Conditional Mixed Markov Model.” IEEE Transactions on Geoscience and Remote Sensing 47 (10): 3416–3430. https://doi.org/10.1109/TGRS.2009.2022633.
- Chen, Liang-Chieh, George Papandreou, Iasonas Kokkinos, Kevin Murphy, and Alan Yuille. 2014. “Semantic Image Segmentation with Deep Convolutional Nets and Fully Connected CRFs.” CoRR. arXiv.
- Chen, Hao, Zipeng Qi, and Zhenwei Shi. 2021. “Remote Sensing Image Change Detection with Transformers.” IEEE Transactions on Geoscience and Remote Sensing 60: 1–18. https://doi.org/10.1109/TGRS.2020.3034752.
- Chen, Hao, and Zhenwei Shi. 2020. “A Spatial-Temporal Attention-Based Method and a New Dataset for Remote Sensing Image Change Detection.” Remote Sensing 12 (10), https://doi.org/10.3390/rs12101662.
- Chen, L. C. E., Y. K. Zhu, G. Papandreou, F. Schroff, and H. Adam. 2018. “Encoder-Decoder with Atrous Separable Convolution for Semantic Image Segmentation.” Paper presented at the 15th European Conference on Computer Vision (ECCV), Munich, Germany, September 8–14.
- Daudt, R. C., B. Le Saux, and A. Boulch. 2018. “Fully Convolutional Siamese Networks for Change Detection.” Paper presented at the 25th IEEE International Conference on Image Processing (ICIP), Athens, Greece, October 7–10.
- Daudt, R. C., Bertrand Le Saux, Alexandre Boulch, and Yann Gousseau. 2019. “Multitask Learning for Large-Scale Semantic Change Detection.” Computer Vision and Image Understanding 187: 102783. https://doi.org/10.1016/j.cviu.2019.07.003.
- Demir, I., K. Koperski, D. Lindenbaum, G. Pang, J. Huang, S. Bast, F. Hughes, D. Tuia, and R. Raskar. 2018. “DeepGlobe 2018: A Challenge to Parse the Earth through Satellite Images.” Paper presented at the IEEE/CVF Conference on Computer Vision and Pattern Recognition (CVPR), Salt Lake City, UT, June 18–22.
- Ding, L., H. Guo, S. Liu, L. Mou, J. Zhang, and L. Bruzzone. 2022. “Bi-Temporal Semantic Reasoning for the Semantic Change Detection in HR Remote Sensing Images.” IEEE Transactions on Geoscience and Remote Sensing 60: 1–14. https://doi.org/10.1109/TGRS.2022.3154390.
- Feng, Y., Z. Huang, Y. L. Wang, L. Wan, Y. Liu, Y. Zhang, and X. Shan. 2021. “An SOE-Based Learning Framework Using Multisource Big Data for Identifying Urban Functional Zones.” IEEE Journal of Selected Topics in Applied Earth Observations and Remote Sensing 14: 7336–7348. https://doi.org/10.1109/JSTARS.2021.3091848.
- Fujita, A., K. Sakurada, T. Imaizumi, R. Ito, S. Hikosaka, and R. Nakamura. 2017. “Damage Detection from Aerial Images via Convolutional Neural Networks. Paper presented at the 15th IAPR International Conference on Machine Vision Applications (MVA), Nagoya Univ, Nagoya, Japan, May 8–12.
- He, Kaiming, Xiangyu Zhang, Shaoqing Ren, and Jian Sun. 2016. “Deep Residual Learning for Image Recognition.” Paper presented at the Proceedings of the IEEE Conference on Computer Vision and Pattern Recognition.
- Hua, Y. S., L. C. Mou, and X. X. Zhu. 2019. “Recurrently Exploring Class-Wise Attention in a Hybrid Convolutional and Bidirectional LSTM Network for Multi-Label Aerial Image Classification.” ISPRS Journal of Photogrammetry and Remote Sensing 149: 188–199. https://doi.org/10.1016/j.isprsjprs.2019.01.015.
- Huang, Z., H. J. Qi, C. G. Kang, Y. L. Su, and Y. Liu. 2020. “An Ensemble Learning Approach for Urban Land Use Mapping Based on Remote Sensing Imagery and Social Sensing Data.” Remote Sensing 12 (19), https://doi.org/10.3390/rs12193254.
- Ji, S. P., S. Q. Wei, and M. Lu. 2019. “Fully Convolutional Networks for Multisource Building Extraction from an Open Aerial and Satellite Imagery Data Set.” IEEE Transactions on Geoscience and Remote Sensing 57 (1): 574–586. https://doi.org/10.1109/TGRS.2018.2858817.
- Kaiser, P., J. D. Wegner, A. Lucchi, M. Jaggi, T. Hofmann, and K. Schindler. 2017. “Learning Aerial Image Segmentation from Online Maps.” IEEE Transactions on Geoscience and Remote Sensing 55 (11): 6054–6068. https://doi.org/10.1109/TGRS.2017.2719738.
- Lebedev, M., Yu Vizilter, Oleg Vygolov, V. Knyaz, and A. Rubis. 2018. “Change Detection in Remote Sensing Images Using Conditional Adversarial Networks.” ISPRS - International Archives of the Photogrammetry, Remote Sensing and Spatial Information Sciences XLII-2: 565–571. https://doi.org/10.5194/isprs-archives-XLII-2-565-2018.
- Li, Xue, Guo Zhang, Hao Cui, Shasha Hou, Shunyao Wang, Xin Li, Yujia Chen, Zhijiang Li, and Li Zhang. 2022a. “MCANet: A Joint Semantic Segmentation Framework of Optical and SAR Images for Land use Classification.” International Journal of Applied Earth Observation and Geoinformation 106), https://doi.org/10.1016/j.jag.2021.102638.
- Li, H., F. Zhu, X. Zheng, M. Liu, and G. Chen. 2022b. “MSCDUNet: A Deep Learning Framework for Built-Up Area Change Detection Integrating Multispectral, SAR, and VHR Data.” IEEE Journal of Selected Topics in Applied Earth Observations and Remote Sensing 15: 5163–5176. https://doi.org/10.1109/JSTARS.2022.3181155.
- Lin, T. Y., P. Dollar, R. Girshick, K. M. He, B. Hariharan, and S. Belongie. 2017. “Feature Pyramid Networks for Object Detection.” Paper presented at the 30th IEEE/CVF Conference on Computer Vision and Pattern Recognition (CVPR), Honolulu, HI, July 21–26.
- Liu, Mengxi, Zhuoqun Chai, Haojun Deng, and Rong Liu. 2022. “A CNN-Transformer Network with Multiscale Context Aggregation for Fine-Grained Cropland Change Detection.” IEEE Journal of Selected Topics in Applied Earth Observations and Remote Sensing 15: 4297–4306. https://doi.org/10.1109/JSTARS.2022.3177235.
- Liu, Ze, Yutong Lin, Yue Cao, Han Hu, Yixuan Wei, Zheng Zhang, Stephen Lin, and Baining Guo. 2021. “Swin Transformer: Hierarchical Vision Transformer Using Shifted Windows.” Paper presented at the Proceedings of the IEEE/CVF International Conference on Computer Vision.
- Manoli, G., S. Fatichi, M. Schlapfer, K. L. Yu, T. W. Crowther, N. Meili, P. Burlando, G. G. Katul, and E. Bou-Zeid. 2019. “Magnitude of Urban Heat Islands Largely Explained by Climate and Population.” Nature 573 (7772): 55. https://doi.org/10.1038/s41586-019-1512-9.
- Peng, D. F., L. Bruzzone, Y. J. Zhang, H. Y. Guan, H. Y. Ding, and X. Huang. 2021. “SemiCDNet: A Semisupervised Convolutional Neural Network for Change Detection in High Resolution Remote-Sensing Images.” IEEE Transactions on Geoscience and Remote Sensing 59 (7): 5891–5906. https://doi.org/10.1109/TGRS.2020.3011913.
- Reba, M., and K. C. Seto. 2020. “A Systematic Review and Assessment of Algorithms to Detect, Characterize, and Monitor Urban Land Change.” Remote Sensing of Environment, https://doi.org/10.1016/j.rse.2020.111739.
- Ronneberger, Olaf, Philipp Fischer, and Thomas Brox. 2015. U-Net: Convolutional Networks for Biomedical Image Segmentation.Paper presented at the Medical Image Computing and Computer-Assisted Intervention–MICCAI 2015: 18th International Conference, Munich, Germany, October 5-9, 2015, Proceedings, Part III 18.
- Rottensteiner, F., G. Sohn, J. Jung, M. Gerke, C. Baillard, S. Benitez, and U. Breitkopf. 2012. “The ISPRS Benchmark on Urban Object Classification and 3D Building Reconstruction.” ISPRS Annals of the Photogrammetry, Remote Sensing and Spatial Information Sciences I-3: 293–298. https://doi.org/10.5194/isprsannals-I-3-293-2012.
- Shao, Ruizhe, Chun Du, Hao Chen, and Jun Li. 2021. “SUNet: Change Detection for Heterogeneous Remote Sensing Images from Satellite and UAV Using a Dual-Channel Fully Convolution Network.” Remote Sensing 13 (18), https://doi.org/10.3390/rs13183750.
- Shao, Z. F., K. Yang, and W. X. Zhou. 2018. “Performance Evaluation of Single-Label and Multi-Label Remote Sensing Image Retrieval Using a Dense Labeling Dataset.” Remote Sensing 10 (6), https://doi.org/10.3390/rs10060964.
- Shao, Z. F., W. X. Zhou, X. Q. Deng, M. D. Zhang, and Q. M. Cheng. 2020. “Multilabel Remote Sensing Image Retrieval Based on Fully Convolutional Network.” IEEE Journal of Selected Topics in Applied Earth Observations and Remote Sensing 13: 318–328. https://doi.org/10.1109/JSTARS.2019.2961634.
- Shen, L., Y. Lu, H. Chen, H. Wei, D. H. Xie, J. B. Yue, R. Chen, S. Y. Lv, and B. T. Jiang. 2021. “S2Looking: A Satellite Side-Looking Dataset for Building Change Detection.” Remote Sensing 13 (24), https://doi.org/10.3390/rs13245094.
- Shi, Q., M. Liu, S. Li, X. Liu, F. Wang, and L. Zhang. 2022. “A Deeply Supervised Attention Metric-Based Network and an Open Aerial Image Dataset for Remote Sensing Change Detection.” IEEE Transactions on Geoscience and Remote Sensing 60: 1–16. https://doi.org/10.1109/TGRS.2021.3085870.
- Singh, A. 1989. “Review Article Digital Change Detection Techniques Using Remotely-Sensed Data.” International Journal of Remote Sensing 10 (6): 989–1003. https://doi.org/10.1080/01431168908903939.
- Smith, P., J. I. House, M. Bustamante, J. Sobocka, R. Harper, G. X. Pan, P. C. West, et al. 2016. “Global Change Pressures on Soils from Land use and Management.” Global Change Biology 22 (3): 1008–1028. https://doi.org/10.1111/gcb.13068.
- Sun, K., B. Xiao, D. Liu, and J. D. Wang. 2019. “Deep High-Resolution Representation Learning for Human Pose Estimation.” Paper presented at the 32nd IEEE/CVF Conference on Computer Vision and Pattern Recognition (CVPR), Long Beach, CA, June 16–20.
- Tian, Shiqi, Ailong Ma, Zhuo Zheng, and Yanfei Zhong. 2020. “Hi-UCD: A Large-scale Dataset for Urban Semantic Change Detection in Remote Sensing Imagery.” arXiv preprint arXiv:.03247.
- Tian, Shiqi, Yanfei Zhong, Zhuo Zheng, Ailong Ma, Xicheng Tan, and Liangpei Zhang. 2022. “Large-scale Deep Learning Based Binary and Semantic Change Detection in Ultra High Resolution Remote Sensing Imagery: From Benchmark Datasets to Urban Application.” ISPRS Journal of Photogrammetry and Remote Sensing 193: 164–186. https://doi.org/10.1016/j.isprsjprs.2022.08.012.
- Tong, X. Y., G. S. Xia, Q. K. Lu, H. F. Shen, S. Y. Li, S. C. You, and L. P. Zhang. 2020. “Land-cover Classification with High-Resolution Remote Sensing Images Using Transferable Deep Models.” Remote Sensing of Environment 237), https://doi.org/10.1016/j.rse.2019.111322.
- Volpi, M., and V. Ferrari. 2015. “Semantic Segmentation of Urban Scenes by Learning Local Class Interactions.” Paper presented at the IEEE Conference on Computer Vision and Pattern Recognition (CVPR), Boston, MA, June 7–12.
- Wang, Junjue, Zhuo Zheng, Ailong Ma, Xiaoyan Lu, and J. Zhong. 2021. “LoveDA: A Remote Sensing Land-cover Dataset for Domain Adaptive Semantic Segmentation.” arXiv preprint arXiv:.08733.
- Xiao, Tete, Yingcheng Liu, Bolei Zhou, Yuning Jiang, and Jian Sun. 2018. “Unified Perceptual Parsing for Scene Understanding.” Paper presented at the Proceedings of the European Conference on Computer Vision (ECCV).
- Xie, Enze, Wenhai Wang, Zhiding Yu, Anima Anandkumar, Jose M. Alvarez, and Ping Luo. 2021. “SegFormer: Simple and Efficient Design for Semantic Segmentation with Transformers.” Advances in Neural Information Processing Systems 34: 12077–. https://doi.org/10.48550/arXiv.2105.15203.
- Xing, X. Y., Z. Huang, X. M. Cheng, D. Zhu, C. G. Kang, F. Zhang, and Y. Liu. 2020. “Mapping Human Activity Volumes through Remote Sensing Imagery.” IEEE Journal of Selected Topics in Applied Earth Observations and Remote Sensing 13: 5652–5668. https://doi.org/10.1109/JSTARS.2020.3023730.
- Yang, K. P., G. S. Xia, Z. C. Liu, B. Du, W. Yang, M. Pelillo, and L. P. Zhang. 2022. “Asymmetric Siamese Networks for Semantic Change Detection in Aerial Images.” IEEE Transactions on Geoscience and Remote Sensing, https://doi.org/10.1109/tgrs.2021.3113912.
- Zhang, M., X. Y. Hu, L. K. Zhao, Y. Lv, M. Luo, and S. Y. Pang. 2017. “Learning Dual Multi-Scale Manifold Ranking for Semantic Segmentation of High-Resolution Images.” Remote Sensing 9 (5), https://doi.org/10.3390/rs9050500.
- Zhao, H. S., J. P. Shi, X. J. Qi, X. G. Wang, and J. Y. Jia. 2017. “Pyramid Scene Parsing Network.” Paper presented at the 30th IEEE/CVF Conference on Computer Vision and Pattern Recognition (CVPR), Honolulu, HI, July 21–26.
- Zhao, M., Z. Zhao, S. Gong, Y. Liu, J. Yang, X. Xiong, and S. Li. 2022. “Spatially and Semantically Enhanced Siamese Network for Semantic Change Detection in High-Resolution Remote Sensing Images.” IEEE Journal of Selected Topics in Applied Earth Observations and Remote Sensing 15: 2563–2573. https://doi.org/10.1109/JSTARS.2022.3159528.
- Zhao, J., Y. F. Zhong, H. Shu, and L. P. Zhang. 2016. “High-Resolution Image Classification Integrating Spectral-Spatial-Location Cues by Conditional Random Fields.” IEEE Transactions on Image Processing 25 (9), https://doi.org/10.1109/TIP.2016.2577886.
- Zheng, Zhuo, Yanfei Zhong, Shiqi Tian, Ailong Ma, and Liangpei Zhang. 2022. “ChangeMask: Deep Multi-Task Encoder-Transformer-Decoder Architecture for Semantic Change Detection.” ISPRS Journal of Photogrammetry and Remote Sensing 183: 228–239. https://doi.org/10.1016/j.isprsjprs.2021.10.015.