
 ?Mathematical formulae have been encoded as MathML and are displayed in this HTML version using MathJax in order to improve their display. Uncheck the box to turn MathJax off. This feature requires Javascript. Click on a formula to zoom.
ABSTRACT
Building structural type information is the foundation for seismic risk assessment and management since it reflects the behavior of buildings under seismic load. However, in earthquake-prone regions, most of this information is out-of-date or nonexistent. This paper proposes a deep learning-based method for automatically identifying building structural types from unmanned aerial vehicle (UAV) oblique images. The method consists of four steps: (1) collect facades of buildings with different structural types by web crawler technology as a sample set; (2) construct a convolutional neural network with a facade prior knowledge attention branch and train the model using the sample set; (3) extract building facades from UAV oblique images based on the georeferencing results of feature points as the test set; (4) identify building structural types by inputting the test set into the trained model. Three cases have been selected to verify the feasibility and applicability of the method. The average recall rate of 85% and the average F1 score of 83% have been achieved in areas with regular building distribution. This method integrates multidisciplinary knowledge to provide a solution for rapid collection of building vulnerability information, and expands the role of oblique photography data in urban management and disaster prevention planning.
1. Introduction
Buildings, as the primary disaster-bearing body in seismic disasters, are the main factors causing casualties and heavy losses (Ruggieri et al. Citation2021). Therefore, vulnerability and risk assessments of buildings are the main means of reducing seismic disasters (Oh and Seon Park Citation2022; Zhang, Tao, and Wang Citation2022). Regional building earthquake damage simulation based on building structural types, construction age, and geometric information is now employed in urban disaster preventive planning, seismic reinforcement, and earthquake emergency management (Xiong et al. Citation2019; Zhang et al. Citation2021). However, due to the rapid development of urbanization and historical factors, most cities, particularly in developing countries, lack building information databases. As a result, collecting building vulnerability information has become the most time-consuming and costly element of calculating earthquake loss risk and developing earthquake catastrophe preventive plans (Geiß et al. Citation2015). The traditional method of obtaining building information is to perform field research by professionals with measurement tools (Kechidi et al. Citation2021), which requires great time and capital consumption. Therefore, several researchers have applied remote sensing technology and image processing techniques to collect building information on a large scale and have obtained effective results in building footprint detection (Zhao, Persello, and Stein. Citation2021), geometric size extraction (Zhang, Wang, and Sun Citation2022), building types (Belgiu et al. Citation2014),and age estimation (Zeppelzauer et al. Citation2018). However, due to the complexity of the structures, it is challenging to identify the building structural types using artificially defined external observation features.
The existing methods for identifying building structural types mainly rely on empirical relationships or machine learning algorithms to classify external features (texture, color, size, and spatial distribution characteristics) collected from remote sensing data (An, Nie, and Hu Citation2021; Geiß and Taubenböck Citation2013). These methods require a lot of human interaction when selecting features, and only utilize the texture and shape information of the building roof. In actuality, buildings' facades have more important information worth extracting and researching (Stepinac and Gašparović. Citation2020; Sun et al. Citation2022). Due to their superior texture perception and high artificial intelligence, deep convolutional neural networks (DCNNs) have been widely applied in the study of building facades (Zhang, Pan, and Zhang Citation2022). Aravena Pelizari et al. (Citation2021) proposed using the facade of buildings in Google Street View combined with deep learning to automatically obtain the building structural types, demonstrating the potential of building facades and deep learning in building information extraction. However, the street view only covers buildings along the streets of large cities. Xiao et al. (Citation2020) proposed to utilize the three-dimensional (3D) model established by oblique images of UAV to extract the facade of buildings and identify the building function. This method can solve the limitation of spatial location, but the deviation between the texture of the 3D model and the actual image will seriously affect the subsequent deep learning results. Additionally, a major issue with deep learning-based approaches is the difficulty in obtaining enough training samples and the time-consuming label classification and labeling (Weng et al. Citation2019).
To address the aforementioned issues, we developed a novel deep learning-based method for automatically identifying building structure types from UAV oblique photography images. First, a sample set of different building facades was established using web crawler technology based on the picture search feature. Then, a deep convolutional network with the building facades prior knowledge attention branch (PKAB) was proposed to classify building structural types, and the network's parameters were trained using the sample set. Subsequently, a method for automatically extracting building facades from UAV oblique images and building cadastral maps was developed. Finally, the facade set of each building was used as the test set in the trained classification model to predict the building structural types. The effectiveness and robustness of the method in practical application were evaluated and verified by flight experiments in two different time periods of winter and summer in the same experimental area, and its applicability to different regions was proved by the third flight experiment in another area. It requires only UAV oblique images to automatically identify building structural types, which expands the application of UAV oblique photography and provides a new solution for the rapid and efficient extraction of building information.
2. Related work
2.1. Identification of building structural types
Traditionally, building structural types can only be identified by blueprints or direct expert observations, which is impossible for large-scale urban buildings. Therefore, some researchers propose estimating the type of building structure through other basic building data and some auxiliary information that can be easily collected. Su et al. (Citation2015) proposed a threshold approach for inferring building structural types by using the floor and area information of buildings combined with the existing knowledge of the study area. Yepes-Estrada et al. (Citation2017) established a statistical model based on census data to determine building attributes. Following that, the model was further developed as a data gathering method that first used survey data from sample areas to generate a statistical model and then predicted building information of the entire region (Acevedo et al. Citation2017; Liuzzi et al. Citation2019). Xu et al. (Citation2020) utilized machine learning to establish the relationship between building age, floor number, height, area and building structural types, which reduces the demand for auxiliary information and the limitation of prior knowledge. All of these methods require a lot of basic data, which promotes another type of identification method based on remote sensing data. Geiß et al. (Citation2015) proposed a machine learning-based method for estimating the building structural types utilizing auxiliary information and external features extracted from multiple remote sensing data. Sulzer et al. (Citation2018) simplified the types of remote sensing data required, and proposed to use laser point clouds, cadastral map and field data to calculate the Laplace operator of the roof as the building feature to identify the building structural types. After that, deep learning was introduced into the processing of remote sensing data, simplifying the requirements for extracting specific feature attributes. Wu, Nie, and Fan (Citation2020) proposed a simple framework for classifying building structure types by deep neural network using UAV optical images. Gonzalez et al. (Citation2020) demonstrated the potential of convolutional neural networks (CNN) to automatically identify building materials and building structural types from building facade textures using manually labeled Google Street View photos as data.
Despite the fact that approaches based on building facades and deep learning have been proven to have great potential, there is a lack of building structural types recognition methods at any regional scale. This paper aims to propose a practical, intelligent and accurate method for automatic identification of building structural types using UAV oblique photography technology.
2.2. Deep learning methods for UAV oblique photography
Deep learning methods have been widely utilized in the field of UAV remote sensing (Osco et al. Citation2021), and the research on oblique photography according to data types can be classified into two categories: (i) processing derived data ( 3D models, point clouds) generated by oblique images and (ii) directly analyzing convolution features of oblique images. The first one mainly uses geometric feature information in derived data. Vetrivel et al. (Citation2018) proposed using the combination of CNN features and 3D point cloud features obtained from oblique pictures to improve the performance of building damage detection. Gong et al. (Citation2021) made full use of the geometric information of the model, first performing deep learning semantic segmentation on the image, and then mapping it to a 3D model to detect the area and volume of building damage. The other is to focus only on the convolution features of oblique images. Cai et al. (Citation2020) realized the function of automatically detecting the location of buildings from UAV oblique images by optimizing YOLO v4 (Bochkovskiy, Wang, and Liao Citation2020). Liu et al. (Citation2021) proposed a lightweight neural network model with fewer parameters to solve the problem of semantic segmentation of UAV oblique images. Ding et al. (Citation2022) developed a dense context distillation network (DCDNet) to learn distortion-robust feature representations for precise semantic segmentation of UAV tilt images.
3. Method
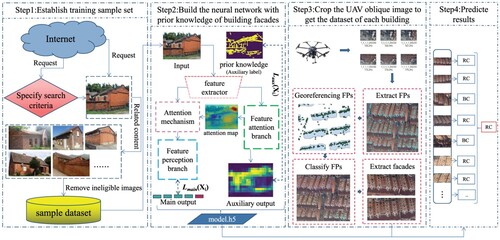
The workflow of the method proposed in this paper for automatically identifying building structural types from UAV oblique photography images is shown in . It consists of four steps: (1) establishing a sample set by web crawler technology; (b) building a deep learning network with prior knowledge of building facades as the attention branch; (c) cropping the UAV oblique image to obtain the building facade as a test set; (d) using trained models to predict the building structural types.
Figure 1. The workflow for automatically identifying building structural types from UAV oblique photography images based on deep learning.
3.1. Establish building facade sample set for model training
Sufficient training data sets are required before training an excellent deep learning model. Web crawler technology is currently widely utilized to collect data, the most important of which is to have clear search conditions (Weng et al. Citation2019). For the crawling task of classified pictures of building structural types, there are the following challenges: (a) the search conditions are ambiguous because there is only one criterion (building structural type); (b) the pictures require high professionalism, and the results obtained by text search have a large number of wrong pictures that do not belong to the same type. Therefore, we proposed a web crawling solution using images as search conditions, as shown in .
Figure 2. Data flow chart and web crawling object diagram for establishing the sample set.
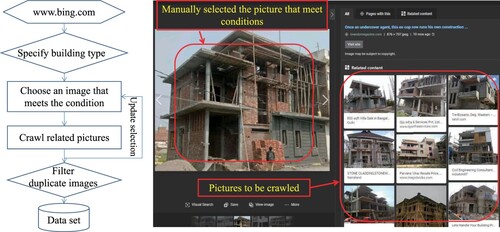
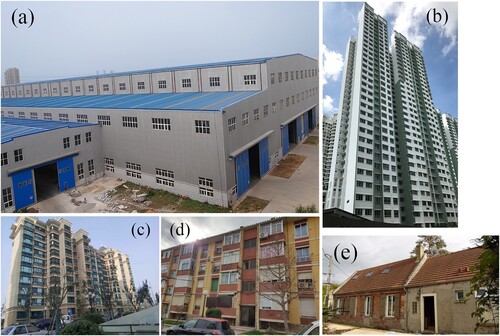
Considering the existing situation of buildings in China and the relevant literature on the vulnerability of building seismic damage in the past(Xiong et al. Citation2017; Xu et al. Citation2020), the common structural types of urban buildings are divided into five categories: steel frame (SF), reinforced concrete (RC) shear wall, reinforced concrete (RC) frame, reinforced masonry (RM), and unreinforced masonry (URM). As a supplement to the classification, we present an example image catalog of various buildings, as shown in . Each category of picture is collected separately and placed in a folder named after the category name so that the label classification of the data set is completed. Taking reinforced masonry structure as an example, first enter ‘reinforced masonry building’ in the Bing image search. Then, select the picture (main picture) that matches the characteristics of the reinforced masonry structure in the search results, as shown in . Currently, a large number of pictures that fit the conditions can be obtained by using the web crawler to crawl the relevant pictures displayed on the right side of the page. Until the required number of training sets is reached, repeat the aforementioned processes while choosing various primary images and crawling the relevant associated images. For repeatedly crawled pictures using picture size sorting can be quickly found and then manually deleted them. Approximately 2100 pictures were collected for each category in this paper, and the dataset and crawl code have been shared to https://dx.doi.org/10.17632/dwn7rb8ghf.2.
Figure 3. Examples of common classification of building structure types in China: (a) steel frame; (b) reinforced concrete shear wall; (c) reinforced concrete frame; (d) reinforced masonry; (e) unreinforced masonry.
3.2. Build the deep learning network with prior knowledge attention branch (PKAB)
The CNN's final output is produced by convolving different features extracted from the receptive field, hence it has the drawback that it is difficult to control the network attention area. Tree occlusion and sky foreground in UAV images might easily lead to a deviation in the neural network's focus area. We believe that regular line segments on building facades can assist the network in paying greater attention to the facade. Therefore, a deep learning network with prior knowledge of building facades as an attention branch was constructed specifically for identifying building structural types from aerial oblique images, as illustrated in .
Figure 4. Structure of deep convolution network with building facade prior knowledge attention branch (PKAB) for identifying seismic building structural types.
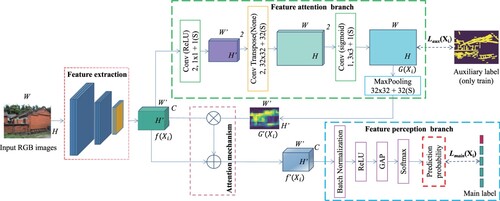
As seen in , the network is composed of three modules: feature extraction module, attention branch module, and prediction branch. The Xception model is used as the basic layer to extract the underlying features of the image, and some parameters are retrained to ensure that the network adapts to the current task. The attention branch module has a structure similar to FCN-32s (Shelhamer, Long, and Darrell Citation2017) and provides the attention position weight depending on prior knowledge in the image. The prediction branch gives the probability distribution of each class by accepting the weighted feature map obtained through the attention mechanism operation.
The attention branch module is used to capture the long-range dependencies on the feature layer space and provide the local position that the prediction branch should pay attention to. Specifically, the feature map is fed into the
convolution operation to produce a binary classification feature map after information fusion along the channel direction. Subsequently, the
feature map is deconvoluted and upsampled to 32 times the original size to get the same size (
) as the input image. Then, using the sigmoid function as the activation function, a
convolution layer is used to perform semantic segmentation and output the attention weight distribution map. Finally, the weight map is scaled to
through a maximum pooling layer for the operation of the attention mechanism. The auxiliary label used to train the attention branch comes from the straight line segment distribution map detected by the Edge Drawing algorithm (Akinlar and Topal Citation2011) in the input image. Due to windows or exterior decorations, building facades have a lot of straight lines, which provides a priori knowledge for the controllability of neural networks. The Sigmoid loss function of pixel-by-pixel classification prediction is used to segment the region of interest, and the prediction score is fed back to the prediction branch as the attention weight. Therefore, the auxiliary label of the attention branch is only needed during training to ensure that the model pays attention to the building facade, rather than as an additional input to the model.
The prediction branch module is mainly composed of a global average pooling layer and a fully connected output layer with Softmax as the activation function. In addition, a batch normalization layer and a ReLU activation function layer have been added to reduce the problem of gradient disappearance or explosion at the beginning of training. Before that, the attention map is applied to the feature map through an attention mechanism. Equation (Equation1(1)
(1) ) shows the operating rule of this attention mechanism.
(1)
(1) Where,
is the output of the attention mechanism operation,
is the weight distribution map of the attention branch output, and
is the feature map output by the feature extraction module. The operation rule can highlight the peak of the attention map while preventing the low-value area of the feature map from degenerating to zero, which ensures the gradient of training.
The total training loss of the proposed PKAB network is a combination of losses on two branches, as indicated in Equation (Equation2
(2)
(2) ), which can be used for end-to-end training.
(2)
(2) Here,
represents the training loss of the main output prediction branch of the network with input sample
, and
represents the training loss of the auxiliary output attention branch. The auxiliary output is only used for regularization to make the main output network more focused on key areas, so we give the loss of the main a greater weight
,
. The prediction branch actually belongs to the image classification task, so the combination of softmax function and cross-entropy is used as the loss function. The attention branch belongs to the binary classification image segmentation task, and the sigmoid function combined with binary entropy loss as the loss function not only meets the task requirements but also directly normalizes the probability of the key area of the image. If the PKAB network is applied to other image classification tasks, the training loss can also be appropriately changed according to the baseline model.
3.3. Building facade extraction from UAV oblique images
The 3D point cloud of the building with geographic information can be obtained from the UAV oblique image through aerial triangulation or structure from motion. Based on this, the corresponding relationship between oblique image pixels and 3D points is established, and a method for automatically extracting building facades by using the geographic topological relationship between the building cadastral map and the 3D points is proposed. The flowchart is depicted in .
Figure 5. Flow chart of the method of automatically extracting building facades from the oblique image.
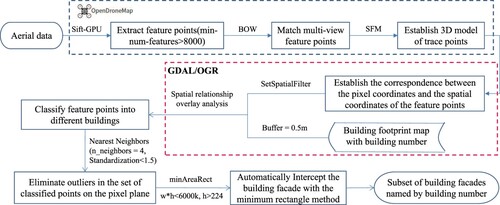
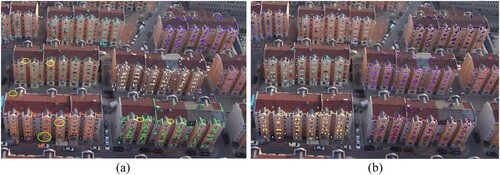
Firstly, the aerial images are used for feature point extraction and 3D modeling with OpenDroneMap (an open-source toolkit for processing aerial images). The Sift-GPU operator was used to extract feature points in this work, and the minimum number of feature points per image was set at 8000. In practical applications, the appropriate operator and the minimum number of feature points should be selected according to the calculation equipment. Then, overlay analysis is performed between the feature points after georeferencing and the building cadastral map, and the feature points contained in different buildings are automatically classified according to the spatial relationship between point and polygon. To show the results of feature point classification, feature points of different classes were randomly drawn in different colors in the corresponding UAV oblique aerial images, as shown in (a). However, there are mismatches in the 3D modeling of feature points, which may lead to misclassification of individual points, as shown in the yellow circle in (a),. To solve the misclassification, outliers are detected by standardizing the maximum k-nearest neighbor distance between each point in the same classification in the pixel coordinate system of the feature points. After removing the detected outliers, the distribution of each classified feature point is distinguished by random color as shown in (b). It can be seen that outlier filtering ensures the integrity and accuracy of feature point classification. Finally, the facade of each building is automatically extracted from the oblique image with the minimum circumscribed rectangle of the classified feature points as the boundary.
Figure 6. Extracting building facades from oblique images using feature points distribution. (a)Classification of feature points and distribution of outliers; (b)Classification of feature points after removing outliers. (The figure uses random different colors to show the feature points of different classifications, and uses a yellow circle to indicate that there are misclassification points.)
3.4. Data optimization and evaluation metrics
The facade extraction method is based on the aerial image as the original image, so there are a large number of roofs in the captured images, which are different from the sample sets collected in Section 3.1. Therefore, to ensure that the test set is more suitable for the trained network, it is necessary to optimize the extracted data to remove images with a small proportion of building facades. Considering that the image will be affected by the intensity of light and shadow, a method for determining the proportion of building facades by calculating the image structure tensor is proposed. As shown in , the x and y gradients of the image are binarized with eight as the threshold to get the result of edge detection. It can be seen that the gradient of different directions can well describe a large number of edge lines in the building facade, and the distribution of edge lines in both directions has certain characteristics due to the existence of windows or doors. Then, the existence of the facade is estimated by calculating the pixel percentage statistics of the two directional gradients, using the following three conditions as the criterion:
| (1) | Ensure that there is a certain number of edge pixels in the region : | ||||
| (2) | Ensure the proportion of x-direction edge pixels in the region : | ||||
| (3) | Ensure the proportion of y-direction edge pixels in the region : | ||||
Figure 7. Direction gradient map of building facade. (a) The building facade extracted by the proposed method; (b) The binarized distribution map of x-direction gradient; (c) The binarized distribution map of y-direction gradient.
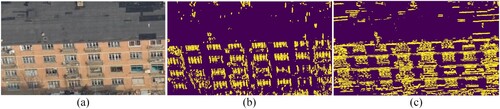
Where and
represent the number of pixels marked as edge lines in the x and y gradient distribution respectively, and
represents the number of all pixels in the image. Referring to the threshold given by Xiao, Gerke, and Vosselman. (Citation2012), this paper sets
,
to ensure the integrity of building facade. The images that meet the conditions are retained, and the others are removed from the image subset. This not only reduces the impact of building roofs but also improves the speed of identification. After the optimization, all images in each building subset are used to identify the building structural types, and the prediction probability is summed to obtain the result with the maximum probability. This can make full use of the building facade information obtained from different angles or orientations.
Overall accuracy, precision, recall, and F1-score are common evaluation metrics in deep learning methods. Overall accuracy is the most commonly used evaluation indicator, but when there is sample imbalance in multi-classification tasks, it may not reasonably reflect the predictive ability of the model due to ignoring a small number of sample classes. Precision is the proportion of correct prediction in the predicted positive examples, and recall is the proportion of correct prediction in the actual positive examples, so the two are a pair of contradictory measures. F1-score considers both precision and recall to achieve the highest level at the same time. Overall accuracy (OA), Precision (P), Recall (R), and F1 – score (F1) can be obtained from the following equations, respectively:
(3)
(3)
(4)
(4)
(5)
(5)
(6)
(6) where TP, FP, FN, and TN represent true positive, false positive, false negative, and true negative, respectively. For multi-classification tasks, the values of TP, FP, and FN for each class are first obtained, and then the mean values of Precision, Recall, and F1 – score in multiple classes are used as evaluation metrics to evaluate the performance of the model.
4. Experiment
The effectiveness and accuracy of the proposed method in practical applications are evaluated and verified by three flight tests in two experimental areas. Each experimental area contains a variety of building structural types covering the general situation of urban buildings. Finally, the ablation experiments under different parameters are carried out, and the results fully prove the superiority and robustness of this method.
4.1. Overview of experimental datasets
The experimental data set is obtained from the teaching area and the teacher's residential area of Dalian University of Technology by the 4-rotor UAV and the 3-camera oblique photography system shown in (a,b). lists the statistical information on the number of buildings of various structural types included in the two regions. The teaching area (Area 1) has dense trees and buildings, and due to the large construction period, there are various types of seismic building structures, as shown in (c). The teacher residential area (Area 2) is representative of urban residential buildings, and the orthoimage is shown in (d). For the above dataset, we obtained detailed building structure types through consulting archives and verified them on-site, which ensured the reliability of the data.
Figure 8. Devices used for obtaining the data and the orthoimage of datasets from the 3D high-resolution building model. (a) Four-rotor unmanned aerial vehicle (UAV); (b) Three-camera photography system; (c) The orthoimage of Area 1; (d) The orthoimage of Area 2.
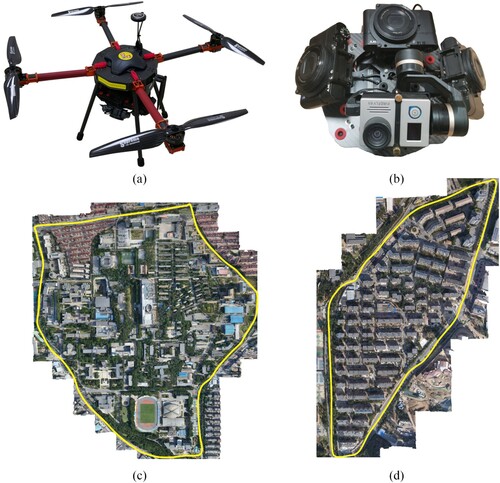
Table 1. Statistical table of the number of buildings of different building structure types in each area.
4.2. Extraction of building facades
shows the specific settings of the three flight cases and the number of buildings of each structural type that can be identified by the building façade extraction method. In the process of 3D reconstruction of feature points, only aerial pictures and the position and orientation system (POS) data are used, which shows the feasibility of the proposed method for general UAVs with tilt cameras and POS. Both Case 1 and Case 2 were conducted in the summer to verify the applicability of the method to different regions. Case 3 is a winter flight experiment of the Area 1 to verify the feasibility of the method for different periods. Comparing , it is clear that the proposed method can stably extract building facades of various structural types, which provides data guarantee for the following identification of building structural types. The main omitted extraction error is a small number of unreinforced masonry buildings in Case 2, which is because these buildings are low warehouses that have been completely blocked by trees.
Table 2. The number of buildings of various structural types extracted by the building facade extraction metohd in different flight experiment cases.
4.3. Model training and result analysis
During the training process, Adam is employed to optimize networks. The ReduceLROnPlateau callback function is used to adjust the learning rate according to the improvement of the verification accuracy, and the initial learning rate is 0.005. In this paper, Keras is used for programming, and the device configuration is NVIDIA GeForce GTX 1060 5G. The early stop method is applied to model training, and its tolerance round is set to 8. The ModelCheckpoint callback function is used to save the model checkpoint, which is set to save the model only when the model performance on the validation set reaches the best. This makes it unnecessary to worry about overfitting due to too long training time. In addition, online data augmentation is used to expand the training data set, including random flipping, random rotation, and random scaling. The training set and validation set were divided according to the ratio of 80%/20% using the 10,000 images collected in Section 3.1.
To verify the effectiveness of data optimization and model structure in the proposed method, ablation experiments were performed on three flight cases. – show the research results of the proposed method under different image processing methods and model structures. It can be seen that the data optimization processing mainly helps to improve the accuracy of building structure type identification. Specifically, the overall accuracy of data-optimized cases are improved by at least 5% compared to without any data processing, while their average F1 – score does not change significantly. The effectiveness of the developed PKAB network has been verified in three cases. Under the same data optimization conditions, the PKAB_net increased the average F1 – score for building structure type identification by 10% compared to the benchmark model, reaching 0.74, 0.83, and 0.75 in three different cases, respectively. Therefore, it can be concluded that adding the prior knowledge of building facades to the network and optimizing data greatly improves the performance of building structural types identification.
Table 3. Evaluation results of building structural types based on different processing methods and model structures on Case 1. ().
Table 4. Evaluation results of building structural types based on different processing methods and model structures on Case 2. ().
Table 5. Evaluation results of building structural types based on different processing methods and model structures on Case 3. ().
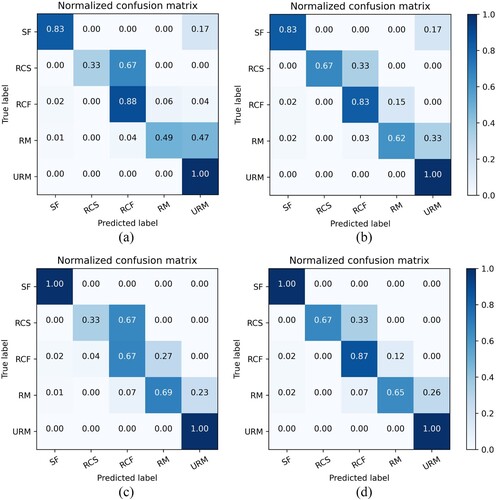
– show the confusion matrix of building structural types identification using the proposed method in three cases. The confusion matrix is a measurement of the classification performance of the model, which can deeply understand the shortcomings of the model. High values on the diagonal indicate the high recall and precision of the developed model. Obviously, when using the PKAB_net combined with image optimization processing, the diagonal value of the confusion matrix becomes larger and more robust. (d) shows the confusion matrix of building structure type identification using the proposed method for the summer data of Area 1 (Case 1). It can be seen that except for reinforced masonry structure, the accuracy of other structure types is more than 80%. The main error comes from the fact that 27% of the reinforced masonry is identified as unreinforced masonry. Similar results also appear in the identification of winter data (Case3) in this area, as shown in , which verifies the feasibility of the proposed method to different time periods and the robustness to tree occlusion. shows the confusion matrix of Area 2 (Case2). The recognition accuracy of the three structural types contained in this region is above 80%, which indicates that the proposed method is feasible for the identification of reinforced masonry structures, and verifies the applicability of the method in different regions. To investigate the reason for the high misidentification rate of reinforced masonry in Area 1, we specifically observed the misclassified reinforced masonry buildings in Area 1 and found that due to the obstruction of trees and other buildings, only a small part of the building facades of these buildings were extracted. The extracted facade is almost the same as that of the single-layer unreinforced masonry building, which leads to the identification error of the model.
Figure 9. Confusion matrix of building structural types identification using different processing methods and model structures on Case 1. (a) Xception + unprocess; (b) Xception + PKAB-net + unprocess; (c) Xception + process; (d) Xception + PKAB-net + process
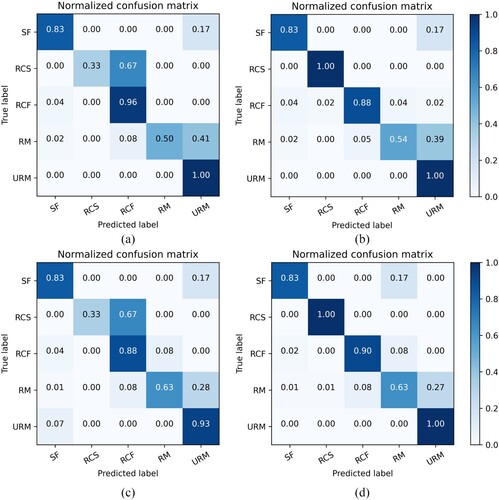
Figure 10. Confusion matrix of building structural types identification using different processing methods and model structures on Case 2. (a) Xception + unprocess; (b) Xception + PKAB-net + unprocess; (c) Xception + process; (d) Xception + PKAB-net + process.
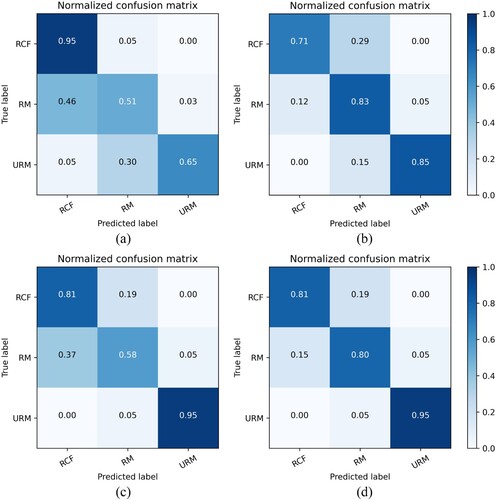
Figure 11. Confusion matrix of building structural types identification using different processing methods and model structures on Case 3. (a) Xception + unprocess; (b) Xception + PKAB-net + unprocess; (c) Xception + process; (d) Xception + PKAB-net + process
4.4. Results of different benchmark models
To determine the benchmark model, we compared the commonly used ResNet50, ResNet101, Inception V3, MobileNet, and Xception. The above models are trained using the same training set, and the evaluation results of each model on building structure types are shown in . Unless otherwise specified, all neural networks are trained at an initial learning rate of 0.005, and the training is completed using the early stop method and the learning rate callback function. In , Param. represents the total number of parameters in the network. With comparable parameters, the Precision, Recall, and F1 – score of the Xception model are significantly superior to those of others. Moreover, comparing the results of each model before and after adding PKAB_net, it can be concluded that taking the texture characteristics of building facade as the attention branch can effectively improve the identification ability of convolutional neural network ( CNN ) for building facade information. ResNet is a classic deep convolution model. Comparing the identification results of ResNet50 and ResNet101, we can found that deepening the network layer will not lead to better results. Inception V3 and Xception achieve relatively good results because both basic models added convolution kernels of different sizes, making image features more complex and increasing spatial characteristics. MobileNet also shows considerable identification results due to the use of deep separable convolution, which also proves the potential of the proposed method in mobile applications.
Table 6. Performance comparison of different benchmark models and attention mechanisms in three cases.
4.5. Comparisons with the existing attention mechanisms
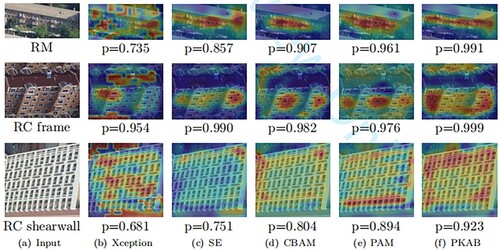
The prior knowledge attention branch network (PKAB_net) proposed in this paper actually belongs to the research of attention mechanism in deep learning. Currently, attention mechanisms have been extensively studied, such as SE_net (Hu, Shen, and Sun Citation2018), CBAM_net (Woo et al. Citation2018), and PAM_net (He et al. Citation2022). To verify the superiority of the proposed method, we conducted comparative experiments on various attention mechanisms, and the results are shown in . By comparison, the PKAB_net considering the facade texture characteristics proposed in this paper achieves the best classification results. Some of the existing attention mechanisms (SE_net, PAM_net) can increase the effect of building structure type recognition, but some (CBAM_net) also have a negative effect, which shows that different tasks have different requirements for the attention mechanism. To explore the significance of the proposed PKAB_net for this task, we visualized the class activation maps (CAM) (Zhou et al. Citation2016) of various attention mechanisms, as shown in . The CAM is the visualization of the discriminative region of a certain category in convolution layer, which can clearly display the specific positions and features that the network model focuses on. Comparing the visualization results, it can be shown that the existing attention mechanisms will locate more prominent feature locations and the PKAB_net cover the target facade regions better than other methods.
Figure 12. The CAM visualization results of integrated network based on the Xception model combined with each attention mechanism. The ground-truth label is displayed below each input image, and P represents the predicted score of each network for the ground-truth class.
5. Discussion
The proposed method achieves the function of automatically extracting building facades of regional clusters using drone images and cadastral maps, as shown in Table ref tab2, with an extraction rate exceeding 90% (Case 1, Case 3 = 100%, Case 2 = 90%). Meanwhile, the proposed data processing method and the prior knowledge attention network considering the texture characteristics of building facades show good performance in automatically identifying building structure types using building facades, with an average F1 score and average precision of over 75%, and an average recall rate of over 80%. Compared with the method of using Google Street View to extract building facades for identification (Aravena Pelizari et al. Citation2021), our method greatly expands the application scope of building structure identification based on building facades. Different from the existing methods that both the training set and the test set are composed of street view building facades, the proposed new approach uses the building facades collected by network technology and obtained from UAV oblique image as training set and test set, respectively, which solves the difficulties of data collection and label labeling in deep learning training mentioned at the beginning of this paper. However, compared with street view images, the test set obtained from UAV images contains textures of building roofs, ground, and trees, which results in benchmark models such as Xception that are suitable for existing recognition methods (Gonzalez et al. Citation2020) no longer achieving satisfactory results, as shown in . As shown in (b), in the case of only using the benchmark model, some attention positions of the network may be located on the roof or other positions that are not building facades, resulting in recognition errors. Compared to the widely used channel and spatial attention mechanisms (SE_net, PAM_net, CBAM_net), the attention branching network considering prior knowledge of building facades first performs texture analysis on the test image to determine the area formed by line features such as windows and doors in the image, and then feeds back into the network to achieve enhanced attention to that area. From the class activation maps of different attention mechanisms, the proposed PKAB_net can effectively direct the attention of the neural network to the building facade, which can become a network of attention mechanisms specifically used to pay attention to the building facade area and provide help for other related facade research.
The main error of the proposed approach is that the reinforced masonry structure is mistakenly identified as unreinforced masonry structure. This is because some reinforced masonry structures are relatively low in height and are blocked by other buildings or trees, resulting in incomplete building facades, which makes the model confuse them with unreinforced masonry structures. In the future, introducing the elevation obtained from the 3D model as an auxiliary discriminant condition will be a solution to this problem. Limited by the difficulty of obtaining on-site flight data, this method is currently only tested on common buildings in China, resulting in geographical limitations of the currently trained model. However, the results have proved the feasibility of directly using UAV tilt images to identify building structure types. Subsequently, the scope of application of the method can be expanded by adding corresponding building facades to the training set according to the building conditions of different countries. Moreover, the proposed method can continue to develop, such as increasing the type of building structure according to the specific research area, and continuously enriching the diversity of building facades of the same type of structure in the training set to make the model more generalized.
6. Conclusions
This paper develops a method based on deep learning to automatically identify structural types of buildings from UAV oblique photography images. Specifically, A data collection method for establishing training sets by using the web crawler technology with the function of graph search is proposed, which solves the difficult problem of obtaining datasets and the heavy workload of label classification in deep learning. More importantly, the PKAB_net considering the texture of building facades is proposed to specifically identify building structural types from aerial oblique images. This is a module that adaptively emphasizes the building facade area to improve the robustness of the network to different oblique aerial images. Additionally, the approach for automatically extracting building facades from oblique images is developed by using open-source GIS and image processing tools with UAV oblique images and building cadastral maps as data.
Three experimental cases were conducted to verify the feasibility and practicality of the proposed method. From the results, the proposed approach has achieved the level of existing methods for identifying building structural types in different regions and different periods, and even reached an average Recall of 85%, an average F1 score of 83%, and a Precision of 83% in the area of building rule distribution. The use of building facades from different sources as training sets and test sets for identifying building structure types has been proved to be feasible, which greatly simplifies the cost of building seismic structure information identification and expands the scope of application of the method. The comparison results with the existing methods show the advantages of the PKAB_net for building facade texture feature recognition, which makes various evaluation indicators increase by about 10%. As a method that only uses low-altitude UAV remote sensing data to identify building structure types based on building facade texture, this method greatly enriches the means of building information extraction, but is not suitable for buildings with large area occlusion of building facades.
In future work, we will introduce the elevation information provided by the 3D model into the network to improve the learning ability for certain categories (reinforced masonry structure, unreinforced masonry structure), which are difficult to distinguish due to the occlusion of trees using only the texture in the image. In addition, the proposed method needs to be applied to more practical cases to optimize the database and parameters, which can achieve potential social security significance and industrial benefits for urban managers and disaster prevention departments.
Data and codes availability statement
The data and codes that support the findings of this study are available with the identifier(s) at the private link https://dx.doi.org/10.17632/dwn7rb8ghf.2
Acknowledgments
This article is very grateful to the students in the research group for their contributions to the flight experiment.
Disclosure statement
No potential conflict of interest was reported by the author(s).
Additional information
Funding
References
- Acevedo, Ana B., Juan D. Jaramillo, Catalina Yepes, Vitor Silva, Fernando A. Osorio, and Mabé Villar. 2017. “Evaluation of the Seismic Risk of the Unreinforced Masonry Building Stock in Antioquia, Colombia.” Natural Hazards 86 (1): 31–54. https://doi.org/10.1007/s11069-016-2647-8.
- Akinlar, Cuneyt, and Cihan Topal. 2011. “EDLines: A Real-Time Line Segment Detector with a False Detection Control.” Pattern Recognition Letters 32 (13): 1633–1642. https://doi.org/10.1016/j.patrec.2011.06.001.
- An, Jiwen, Gaozhong Nie, and Bin Hu. 2021. “Area-Wide Estimation of Seismic Building Structural Types in Rural Areas by Using Decision Tree and Local Knowledge in Combination.” International Journal of Disaster Risk Reduction 60:102320. https://doi.org/10.1016/j.ijdrr.2021.102320.
- Aravena Pelizari, Patrick, Christian Geiß, Paula Aguirre, Hernán Santa María, Yvonne Merino Peña, and Hannes Taubenböck. 2021. “Automated Building Characterization for Seismic Risk Assessment Using Street-Level Imagery and Deep Learning.” ISPRS Journal of Photogrammetry and Remote Sensing 180:370–386. https://doi.org/10.1016/j.isprsjprs.2021.07.004.
- Belgiu, Mariana, Ivan Tomljenovic, Thomas J. Lampoltshammer, Thomas Blaschke, and Bernhard Höfle. 2014. “Ontology-Based Classification of Building Types Detected From Airborne Laser Scanning Data.” Remote Sensing 6 (2): 1347–1366. https://doi.org/10.3390/rs6021347.
- Bochkovskiy, Alexey, Chien-Yao Wang, and Hong-Yuan Mark Liao. 2020. YOLOv4: Optimal Speed and Accuracy of Object Detection. ArXiv:2004.10934.
- Cai, Yiming, Yalin Ding, Hongwen Zhang, Jihong Xiu, and Zhiming Liu. 2020. “Geo-Location Algorithm for Building Targets in Oblique Remote Sensing Images Based on Deep Learning and Height Estimation.” Remote Sensing 12 (15): 2427. https://doi.org/10.3390/rs12152427.
- Ding, Youli, Xianwei Zheng, Yiping Chen, Shuhan Shen, and Hanjiang Xiong. 2022. “Dense Context Distillation Network for Semantic Parsing of Oblique UAV Images.” International Journal of Applied Earth Observation and Geoinformation 114:103062. https://doi.org/10.1016/j.jag.2022.103062.
- Geiß, Christian, Patrick Aravena Pelizari, Mattia Marconcini, Wayan Sengara, Mark Edwards, Tobia Lakes, and Hannes Taubenböck. 2015. “Estimation of Seismic Building Structural Types Using Multi-Sensor Remote Sensing and Machine Learning Techniques.” ISPRS Journal of Photogrammetry and Remote Sensing 104:175–188. https://doi.org/10.1016/j.isprsjprs.2014.07.016.
- Geiß, Christian, and Hannes Taubenböck. 2013. “Remote Sensing Contributing to Assess Earthquake Risk: From a Literature Review Towards a Roadmap.” Natural Hazards 68 (1): 7–48. https://doi.org/10.1007/s11069-012-0322-2.
- Gong, Yiping, Fan Zhang, Xiangyang Jia, Xianfeng Huang, Deren Li, and Zhu Mao. 2021. “Deep Neural Networks for Quantitative Damage Evaluation of Building Losses Using Aerial Oblique Images: Case Study on the Great Wall (China).” Remote Sensing 13 (7): 1321. https://doi.org/10.3390/rs13071321.
- Gonzalez, Daniela, Diego Rueda-Plata, Ana B. Acevedo, Juan C. Duque, Raúl Ramos-Pollán, Alejandro Betancourt, and Sebastian García. 2020. “Automatic Detection of Building Typology Using Deep Learning Methods on Street Level Images.” Building and Environment 177:106805. https://doi.org/10.1016/j.buildenv.2020.106805.
- He, Zhili, Shang Jiang, Jian Zhang, and Gang Wu. 2022. “Automatic Damage Detection Using Anchor-Free Method and Unmanned Surface Vessel.” Automation in Construction 133:104017. https://doi.org/10.1016/j.autcon.2021.104017.
- Hu, Jie, Li Shen, and Gang Sun. 2018. Squeeze-and-Excitation Networks.” In 2018 IEEE/CVF Conference on Computer Vision and Pattern Recognition, 7132–7141.https://doi.org/10.1109/cvpr.2018.00745.
- Kechidi, Smail, José Miguel Castro, Ricardo Monteiro, Mário Marques, Karim Yelles, Nouredine Bourahla, and Mohamed Hamdache. 2021. “Development of Exposure Datasets for Earthquake Damage and Risk Modelling: The Case Study of Northern Algeria.” Bulletin of Earthquake Engineering 19 (12): 5253–5283. https://doi.org/10.1007/s10518-021-01161-6.
- Liu, Siyu, Jian Cheng, Leikun Liang, Haiwei Bai, and Wanli Dang. 2021. “Light-Weight Semantic Segmentation Network for UAV Remote Sensing Images.” IEEE Journal of Selected Topics in Applied Earth Observations and Remote Sensing 14:8287–8296. https://doi.org/10.1109/JSTARS.2021.3104382.
- Liuzzi, Mariangela, Patrick Aravena Pelizari, Christian Geiß, Angelo Masi, Valerio Tramutoli, and Hannes Taubenböck. 2019. “A Transferable Remote Sensing Approach to Classify Building Structural Types for Seismic Risk Analyses: The Case of Val D'Agri Area (Italy).” Bulletin of Earthquake Engineering17 (9): 4825–4853. https://doi.org/10.1007/s10518-019-00648-7.
- Oh, Byung Kwan, and Hyo Seon Park. 2022. “Urban Safety Network for Long-term Structural Health Monitoring of Buildings Using Convolutional Neural Network.” Automation in Construction 137:104225. https://doi.org/10.1016/j.autcon.2022.104225.
- Osco, Lucas Prado, José Marcato Junior, Ana Paula Marques Ramos, Lúcio André de Castro Jorge, Sarah Narges Fatholahi, Jonathan de Andrade Silva, Edson Takashi Matsubara, et al. 2021. “A Review on Deep Learning in UAV Remote Sensing.” International Journal of Applied Earth Observation and Geoinformation 102:102456. https://doi.org/10.1016/j.jag.2021.102456.
- Ruggieri, Sergio, Angelo Cardellicchio, Valeria Leggieri, and Giuseppina Uva. 2021. “Machine-learning Based Vulnerability Analysis of Existing Buildings.” Automation in Construction 132:103936. https://doi.org/10.1016/j.autcon.2021.103936.
- Shelhamer, Evan, Jonathan Long, and Trevor Darrell. 2017. “Fully Convolutional Networks for Semantic Segmentation.” IEEE Transactions on Pattern Analysis and Machine Intelligence 39 (4): 640–651. https://doi.org/10.1109/TPAMI.2016.2572683.
- Stepinac, Mislav, and Mateo Gašparović. 2020. “A Review of Emerging Technologies for An Assessment of Safety and Seismic Vulnerability and Damage Detection of Existing Masonry Structures.” Applied Sciences 10 (15): 5060. https://doi.org/10.3390/app10155060.
- Su, Guiwu, Wenhua Qi, Suling Zhang, Timothy Sim, Xinsheng Liu, Rui Sun, Lei Sun, and Yifan Jin. 2015. “An Integrated Method Combining Remote Sensing Data and Local Knowledge for the Large-Scale Estimation of Seismic Loss Risks to Buildings in the Context of Rapid Socioeconomic Growth: A Case Study in Tangshan, China.” Remote Sensing 7 (3): 2543–2601. https://doi.org/10.3390/rs70302543.
- Sulzer, R., P. Nourian, M. Palmieri, and J. C. van Gemert. 2018. “Shape Based Classification of Seismic Building Structural Types.” The International Archives of the Photogrammetry, Remote Sensing and Spatial Information SciencesXLII-4/W10:179–186. https://doi.org/10.5194/isprs-archives-XLII-4-W10-179-2018.
- Sun, Maoran, Fan Zhang, Fabio Duarte, and Carlo Ratti. 2022. “Understanding Architecture Age and Style Through Deep Learning.” Cities 128:103787. https://doi.org/10.1016/j.cities.2022.103787.
- Vetrivel, Anand, Markus Gerke, Norman Kerle, Francesco Nex, and George Vosselman. 2018. “Disaster Damage Detection Through Synergistic Use of Deep Learning and 3D Point Cloud Features Derived From Very High Resolution Oblique Aerial Images, and Multiple-Kernel-Learning.” ISPRS Journal of Photogrammetry and Remote Sensing 140:45–59. https://doi.org/10.1016/j.isprsjprs.2017.03.001.
- Weng, Yuchen, Xiujuan Wang, Jing Hua, Haoyu Wang, Mengzhen Kang, and Fei-Yue Wang. 2019. “Forecasting Horticultural Products Price Using ARIMA Model and Neural Network Based on a Large-Scale Data Set Collected by Web Crawler.” IEEE Transactions on Computational Social Systems6 (3): 547–553. https://doi.org/10.1109/TCSS.6570650.
- Woo, Sanghyun, Jongchan Park, Joon-Young Lee, and In So Kweon. 2018. “Cbam: Convolutional Block Attention Module.” In Proceedings of the European Conference on Computer Vision (ECCV), 3–19.
- Wu, Haolin, Gaozhong Nie, and Xiwei Fan. 2020. “Classification of Building Structure Types Using UAV Optical Images.” In IGARSS 2020-2020 IEEE International Geoscience and Remote Sensing Symposium, 1193–1196.
- Xiao, Jing, Markus Gerke, and George Vosselman. 2012. “Building Extraction From Oblique Airborne Imagery Based on Robust Façade Detection.” ISPRS Journal of Photogrammetry and Remote Sensing68:56–68. https://doi.org/10.1016/j.isprsjprs.2011.12.006.
- Xiao, C., X. Xie, L. Zhang, and B. Xue. 2020. “Efficient Building Category Classification with Façade Information From Oblique Aerial Images.” The International Archives of the Photogrammetry, Remote Sensing and Spatial Information Sciences XLIII-B2-2020:1309–1313. https://doi.org/10.5194/isprs-archives-XLIII-B2-2020-1309-2020.
- Xiong, Chen, Xinzheng Lu, and Jin Huang, and Hong Guan. 2019. “Multi-LOD Seismic-damage Simulation of Urban Buildings and Case Study in Beijing CBD.” Bulletin of Earthquake Engineering17 (4): 2037–2057. https://doi.org/10.1007/s10518-018-00522-y.
- Xiong, Chen, Xinzheng Lu, Xuchuan Lin, and Zhen Xu, and Lieping Ye. 2017. “Parameter Determination and Damage Assessment for THA-Based Regional Seismic Damage Prediction of Multi-Story Buildings.” Journal of Earthquake Engineering 21 (3): 461–485. https://doi.org/10.1080/13632469.2016.1160009.
- Xu, Zhen, Yuan Wu, Ming-zhu Qi, Ming Zheng, Chen Xiong, and Xinzheng Lu. 2020. “Prediction of Structural Type for City-Scale Seismic Damage Simulation Based on Machine Learning.” Applied Sciences 10 (5): 1795. https://doi.org/10.3390/app10051795.
- Yepes-Estrada, Catalina, Vitor Silva, Jairo Valcárcel, Ana Beatriz Acevedo, Nicola Tarque, Matías A. Hube, Gustavo Coronel, and Hernán Santa María. 2017. “Modeling the Residential Building Inventory in South America for Seismic Risk Assessment.” Earthquake Spectra 33 (1): 299–322. https://doi.org/10.1193/101915eqs155dp.
- Zeppelzauer, Matthias, Miroslav Despotovic, Muntaha Sakeena, David Koch, and Mario Döller. 2018. Automatic Prediction of Building Age From Photographs.” Proceedings of the 2018 ACM on International Conference on Multimedia Retrieval ,126–134. https://doi.org/10.1145/3206025.3206060.
- Zhang, Gaowei, Yue Pan, and Limao Zhang. 2022. “Deep Learning for Detecting Building Façade Elements From Images Considering Prior Knowledge.” Automation in Construction 133:104016. https://doi.org/10.1016/j.autcon.2021.104016.
- Zhang, Leilei, Zhengru Tao, and Guoxin Wang. 2022. “Assessment and Determination of Earthquake Casualty Gathering Area Based on Building Damage State and Spatial Characteristics Analysis.” International Journal of Disaster Risk Reduction 67:102688. https://doi.org/10.1016/j.ijdrr.2021.102688.
- Zhang, Leilei, Guoxin Wang, and Weijian Sun. 2022. “Automatic Extraction of Building Geometries Based on Centroid Clustering and Contour Analysis on Oblique Images Taken by Unmanned Aerial Vehicles.” International Journal of Geographical Information Science 36 (3): 453–475. https://doi.org/10.1080/13658816.2021.1937632.
- Zhang, Yixin, Shansuo Zheng, Longfei Sun, Li Long, Wei Yang, and Lei Li. 2021. “Developing GIS-based Earthquake Loss Model: A Case Study of Baqiao District, China.” Bulletin of Earthquake Engineering19 (5): 2045–2079. https://doi.org/10.1007/s10518-020-01039-z.
- Zhao, Wufan, Claudio Persello, and Alfred Stein. 2021. “Building Outline Delineation: From Aerial Images to Polygons with An Improved End-to-End Learning Framework.” ISPRS Journal of Photogrammetry and Remote Sensing 175:119–131. https://doi.org/10.1016/j.isprsjprs.2021.02.014.
- Zhou, Bolei, Aditya Khosla, Agata Lapedriza, Aude Oliva, and Antonio Torralba. 2016. “Learning Deep Features for Discriminative Localization.” In 2016 IEEE Conference on Computer Vision and Pattern Recognition (CVPR), 2921–2929. https://doi.org/10.1109/cvpr.2016.319.