
 ?Mathematical formulae have been encoded as MathML and are displayed in this HTML version using MathJax in order to improve their display. Uncheck the box to turn MathJax off. This feature requires Javascript. Click on a formula to zoom.
ABSTRACT
Urban landscape forms can be effective in reducing increasing PM2.5 concentrations due to urbanization in China, making it crucially important to accurately quantify the spatiotemporal impact of urban landscape forms on PM2.5 variations. Three landscape indices and six control variables were selected to assess these impacts in 362 Chinese cities during different time scales from 2001 to 2020, using a spatiotemporal geographically weighted regression model, random forest models and partial dependence plots. The results show that there are spatiotemporal differences in the impacts of landscape indices on PM2.5. the proportion of urban green infrastructure (PLAND-UGI) and the fractal dimension of urban green infrastructure (FRACT-UGI) exacerbate PM2.5 concentrations in the northwest, the proportion of impervious surfaces (PLAND-Impervious) mitigates air pollution in northwest and southwest China, and shannon’s diversity index (SHDI) has seasonal differences in the northwest. PLAND-UGI is the landscape index with the largest contribution (30%) and interpretable range. The relationship between FRACT and PM2.5 was more complex than for other landscape indices. The results of this study contribute to a deeper understanding of the spatial and temporal differences in the impact of urban landscape patterns on PM2.5, contributing to clean urban development and sustainable development.
1. Introduction
PM2.5 (particulate matter radius less than 2.5 microns) is an important pollutant in the atmosphere and poses a substantial challenge to human health. A report from the State of the World’s Air 2019 showed that air pollution causes approximately 4.9 million deaths worldwide each year (Health Effects Institute Citation2019). As the largest developing country, its fast-growing economy has also brought serious air pollution to China (Guo, Zhang, et al. Citation2021). Approximately 975 million people in China are affected by air pollution, most seriously air pollution in the middle and lower reaches of the Yangtze River and the North China Plain (NCP) (Liu, Wu, and Yu Citation2017).
Impervious surfaces and urban green infrastructure (UGI) (Li et al. Citation2021), which form common landscape types in cities, have a significant role in the regulation of PM2.5. There is a significant correlation between impervious surfaces, UGI and PM2.5 (Bi et al. Citation2022; Fan et al. Citation2022; Tao et al. Citation2020). Reduction of PM2.5 concentrations through a rational layout of landscape spatial forms has been demonstrated to be effective. For example, Li and Zhou (Citation2019) analyzed the relationship between urban form and air quality in China based on a spatial autoregressive model, and they concluded that smaller, dispersed cities have better air quality. The same conclusion was verified in the Yangtze River Delta region (Tao et al. Citation2020). Cai et al. (Citation2020) found significant potential for UGI to reduce PM2.5 concentrations at urban and community scales using redundancy analysis and correlation analysis, while the relationship between UGI and PM2.5 concentrations varies by range (Li et al. Citation2021). In addition, some scholars have further quantified regional differences in the impact of urban landscape on PM2.5 using local regression models based on global regression (Liu et al. Citation2022). Previous researches have also demonstrated that incorporating spatial heterogeneity into regression models can improve the fitting accuracy and make the independent variables more reliable in explaining the dependent variable (Li et al. Citation2017; Tu et al. Citation2019). For example, geographically weighted regression (GWR) was successfully used by Tu et al. (Citation2019) to eliminate the impact of spatial autocorrelation of variables with significantly higher accuracy than traditional global regression models. Fan et al. (Citation2022) also found significant spatial differences in the impacts of green and blue spaces on PM2.5, with mitigating effect in one space while aggravating effect in another.
Previous researches have typically explored the relationship of urban landscapes with PM2.5 from a global perspective (Li and Zhou Citation2019), such as using correlation analysis to explore the correlation between landscape indices and PM2.5 and using simple linear regression to explore the extent to which landscape indices affect PM2.5 concentrations (Lu et al. Citation2018). Although some results have been achieved, it is not possible to take targeted measures for specific regions (Bi et al. Citation2022). To address this situation, some studies analyzed the influence of the landscape on PM2.5 in the nearby areas centered on the site (Cai, Zhuang, and Ren Citation2020; Li et al. Citation2021). For example, Li et al. (Citation2021) argue that UGI has a limited ability to reduce particulate matter and more is needed to reduce anthropogenic emission sources. Meanwhile, at a small regional scale, enhancing landscape richness and connectivity is a feasible measure to enhance air quality. However, it is not representative for the study area because only a limited number of sites were considered (Cheng et al. Citation2020). There are also studies from spatial heterogeneity perspective to investigate the relationship between landscape index and PM2.5 (Bi et al. Citation2022; Fan et al. Citation2022). There are differences or even opposite effects of landscape on PM2.5 in different regions (Fan et al. Citation2022). This has not been seen in previous global regression models. The practical implication of this is that targeted mitigation measures should be taken for different regions. However, previous works have generally studied small areas, such as urban areas or urban clusters (Li et al. Citation2019; Tao et al. Citation2020), or individual points in time (Li and Zhou Citation2019; Wang et al. Citation2022). While these works contribute to the understanding of how urban landscapes affect PM2.5, we are aware of no studies that have discussed the relationship between urban landscapes and PM2.5 at large scale scales for long time series. Although spatial heterogeneity has previously been discussed, temporal and spatial heterogeneity have not been used simultaneously to investigate the relationship between landscape patterns and PM2.5.
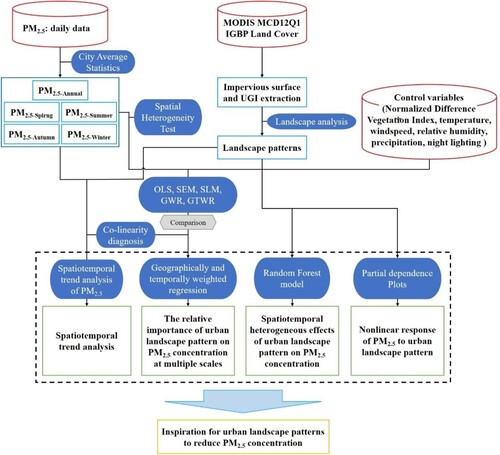
Overall, previous researches have not sufficiently addressed spatial and temporal variation of landscape pattern effects on PM2.5 and the nonlinear relationship between them. Therefore, in this study, we performed regression analysis and interpretation of PM2.5 with three landscape indices (calculated from MODIS data) and six control variables (meteorological and nighttime lighting data) for 362 cities in China during the period 2001–2020. First, we visualized the spatiotemporal trends of PM2.5 concentration. Second, we compared ordinary least squares (OLS) models, spatial error models (SEM), spatial lag models (SLM), GWR and spatiotemporal geographically weighted regression (GTWR) models, to find out the most appropriate model to represent the relationship between PM2.5 and landscapes. Finally, we used the selected GTWR, random forest (RF) models and partial dependence plots (PDP) to analyze the spatiotemporal variability and non-linear relationship of landscape indices with PM2.5 effects at different scales (). The main objectives of this research are: 1) to quantify the spatial and temporal variation of the impact of different landscape indices on PM2.5 in China at different time scales, and 2) what are the patterns of nonlinear responses of PM2.5 to landscape indices, and how and to what extent landscape indices might be adapted regarding to reduce PM2.5 concentration.
Figure 1. Experimental flowchart.
2. Data and methods
2.1. Study area
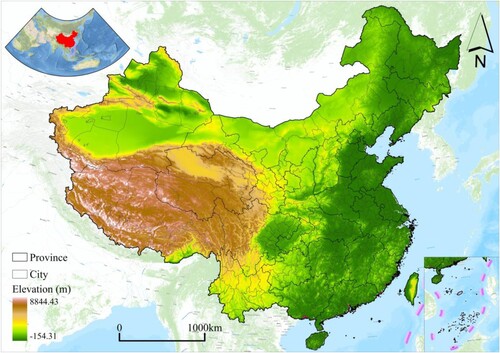
China is the largest developing country (Cao et al. Citation2023). As of 2020, China had a population of 1.4 billion, with about two-thirds of them residing in cities (China Statistics Press Citation2021). Air pollution caused by urban development is not only detrimental to the green development of cities, but also poses serious health hazards to people (Peng et al. Citation2016). In this work, the relationship between PM2.5 levels and various landscape types was investigated across 362 cities in China ().
Figure 2. Study area location.
2.2. Data source
The PM2.5 concentration data was obtained from ChinaHighAirPollutants (CHAP), with a spatial resolution of 1 km and a temporal resolution of days (He et al. Citation2021). Land-use data were obtained from the MODIS satellite (https://modis.gsfc.nasa.gov/). The control variables used in this research include normalized difference vegetation index (NDVI), relative humidity (RH), nighttime light (NL), wind speed (WS), precipitation (Pre), and temperature (Tem). Control variables were obtained from the National Earth System Science Data Center (http://www.geodata.cn/) at a spatial resolution of 1 km and a temporal resolution of months, where the NL temporal resolution is year. All raster data were calculated in city units and the mean value was considered as the value for that city.
2.3. Urban landscape indices
Impervious surfaces (based on MODIS_IGBP Land Cover, classification code: 13) and UGI (consisting of natural landscapes such as forests, grasslands and water bodies) are closely related to human activities and constitute significant sources and sinks of PM2.5 (Xie and Wu Citation2017). Based on MODIS MCD12Q1 IGBP land cover data, we extracted impervious surface and UGI cover for our study areas. In selecting from among the many indices used to describe landscape, we followed the following three principles: landscape indices should 1) involve the three aspects of landscape quantity, shape, and diversity; 2) avoid the use of too many variables to reduce variable redundancy; and 3) have been commonly used in previous studies and proven to be descriptive of PM2.5 distribution. Based on these criteria, we chose the proportion of landscape (PLAND-Impervious, PLAND-UGI) indices, fractal dimension (FRACT-Impervious, FRACT-UGI) indices, and Shannon’s diversity index (SHDI) to characterize the investigated landscapes. The landscape indices of each grid at the common 1-km resolution were calculated using fragstats4.2. presents the specific formula and interpretation of each landscape index.
Table 1. Data summary.
2.4. Covariate
The influence of the landscape index on PM2.5 was further diluted by adding covariates to the model to obtain more accurate results. According to previous studies, PM2.5 concentrations in China are influenced by meteorological, natural and socioeconomic factors (Li and Zhou Citation2019), and we consequently selected NL (Xu et al. Citation2015), NDVI (He et al. Citation2021; Huang et al. Citation2021), Pre (Yao et al. Citation2019), WS (Huang et al. Citation2021), Tem (Li and Zhou Citation2019) and RH (Li et al. Citation2021) as control variables.
2.5. Statistical models
The equations of the OLS, SLM, SEM and GWR models are shown in the supplementary material in equations S1–S4.
Spatial heterogeneity in the dependent variable is a prerequisite for using spatial econometric methods. Before constructing the GTWR model, the Moran index was used to test whether PM2.5 concentrations were spatially autocorrelated. then, employed variance inflation factor (VIF) to remove factors with strong correlation. Finally, the GTWR model, RF model and PDP were used for analysis.
2.5.1. Spatial heterogeneity test
The presence of spatial heterogeneity indicates the presence of a significant state of spatial aggregation of low or high values in the data (Anselin Citation1995; Dong et al. Citation2019). The presence of spatial heterogeneity was tested by passing through the Moran’s index. the Moran’s I statistic was expressed as:
(1)
(1) where zi is the deviation of sample i from the mean, wi,j is the spatial weight between samples i and j, n is the total number of samples, and So is the sum of spatial weights.
2.5.2 Co-linearity diagnosis
Multicollinearity arises because of distortions in model estimates or model accuracy as a result of strong correlations between explanatory variables. We used the VIF to test for multicollinearity, using the following equations:
(2)
(2) where c is the coefficient of determination, reflecting the degree of change in the dependent variable explained by the regression equation. A larger VIF indicates a greater possibility of cointegration between the explanatory variables. Values <10 are considered to indicate the absence of a concerning degree of cointegration (Ji et al. Citation2018).
2.5.3. GTWR model
The GTWR model was developed by Huang et al. (Citation2010) based on the GWR model by incorporating temporal information, using the formula:
(3)
(3) where (ui, vi, ti) is the spatiotemporal coordinate of the ith sample, β0(ui, vi, ti) is the constant term of the ith sample, βk (ui, vi, ti) is the kth regression parameter at the ith sampling point as a function of spatial geographic location, and ϵi is the cumulative error term.
2.5.4. Random forest (RF) model
RF models derive from ensemble learning, a major branch of machine learning that consists of multiple decision trees that are then used to predict the outcome. This method is advantageous in quantifying nonlinear relationships in geosciences and remote sensing and has been broadly applied in PM2.5 modeling studies (Mao et al. Citation2021). Previous comparative studies of multiple machine learning models found that the RF algorithm proved to be the most accurate (Guo et al. Citation2021; Jian et al. Citation2023; Logan et al. Citation2020). Both the characteristic contribution and PDP are among the methods used to interpret RF. This is one of the reasons why we used PDP to explore the nonlinear relationship between PM2.5 and the landscape index. In addition, PDP can show more details of the relationship between variables than the smoothed curves fitted by generalized additive models and curve fitting analysis.
3. Results
3.1. Spatiotemporal heterogeneity of PM2.5
The grading scale of the Chinese National Air Quality Standards was used to classify air pollution into five levels: Level-1 (excellent, 0∼35 μg/m3), Level-2 (good, 35∼75 μg/m3), Level-3 (light pollution, 75∼115 μg/m3), Level-4 (moderate pollution, 115∼150 μg/m3), and Level-5 (heavy pollution, 150∼250 μg/m3). We calculated the air pollution level for each pixel, and then classified the data by season to calculate the number of occurrences for the ith pixel from 2001 to 2020.
There was significant spatiotemporal heterogeneity in the distribution of PM2.5 concentrations in China. Temporally, 2014 was a watershed year for PM2.5 concentrations (Figure S1 in supplemental material) with an increasing phase before and a decreasing phase after this point (Liu et al. Citation2020; Zhang and Cheng Citation2022). The reason for this phenomenon may be the strict implementation of pollution prevention and control policies (Geng et al. Citation2021). By 2016, Level-1 occurred on 50% of areas in spring, summer, autumn, and annually (Figure S2). The regions with better air quality were distributed in Northeast China, Southwest China, and the Altai Mountains. The worst air quality was found in Northwest and North China. Furthermore, PM2.5 concentrations showed a decreasing trend in most of China (90% of the total area), with only Northwest China and the NCP showing an increasing trend (Figure S4).
3.2. Comparative analysis of multi-model results
We performed a spatial autocorrelation test on the dependent variable to determine whether it was suitable for the spatial econometric model. Second, the VIF test was used to remove factors with strong covariance (VIF >10). All independent variables had VIF <10 and were thus retained (Figure S5 and Table S1 in supplemental material). We then compared the results of OLS, SLM, SEM, GWR and GTWR models to determine the most suitable final regression model. Table S2 lists the experimental results for the various models. The OLS model had the lowest accuracy (0.303 < R²-Adjusted < 0.402), while that of the SLM and SEM models was greater (0.355 < R²-Adjusted < 0.594). The GWR and GTWR models performed best.
In the OLS, SEM and SLM models, the regression coefficients of most variables were statistically significant (p < 0.01). Among the landscape indices, SHDI, FRACT-Impervious, FRACT-UGI, and PLAND-UGI were negatively associated with PM2.5, indicating that urban greening, land diversification, and urban fragmentation contribute to reduction of PM2.5 concentration. The control variables also have significant effects on PM2.5. RH, NDVI, Pre, WS, and NL all contributed to the spread and reduction of PM2.5 concentration, while higher temperature exacerbated air pollution. The impacts of Pre and Tem were not significant in winter, presumably driven by low temperatures and low precipitation. The global regression model can only indicate the overall relationship between variables, while possible spatiotemporal heterogeneity is ignored; in contrast, the GTWR models exhibited higher fitting accuracies (Table S2). Therefore, the GTWR model is used to investigate the spatial and temporal variation of the impact of landscape index on PM2.5.
3.3. Response of PM2.5 to landscape index
3.3.1. Response of PM2.5 to PLAND
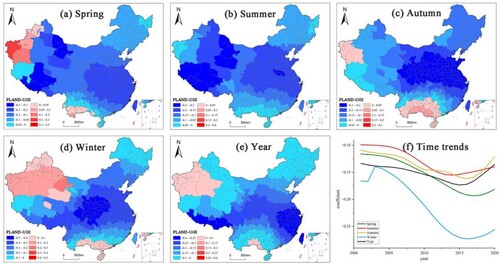
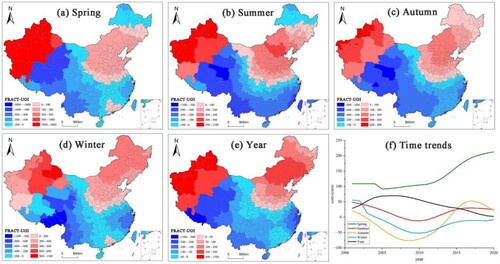
We calculated the mean regression coefficients of each city from 2001 to 2020, and the temporal trend of the average regression coefficient for the entire study area. Regional differences in PLAND-UGI regression coefficients at different time scales are shown in . In summer, PLAND-UGI helps mitigate PM2.5 concentrations at the national scale. During other periods, the mitigation effect is also dominant in most regions, except for certain regions in northwest and south China. In terms of temporal trends ((f)), the regression coefficients were negative for each year, implying that green space reduces PM2.5 (Cai, Zhuang, and Ren Citation2020). However, in southern and northwestern China, green space exacerbated particulate matter pollution ( and Figure S6). The regression coefficients were decreasing annually, reflecting a trend of enhanced PM2.5 removal by PLAND-UGI, which may be the result of afforestation in China in recent years (Guo et al. Citation2022). The PLAND-UGI effect was significantly stronger in the winter than in other seasons, and this trend gradually widened over time.
Figure 3. Spatial distribution (a-e) and temporal trend (f) of PLAND-UGI regression coefficients.
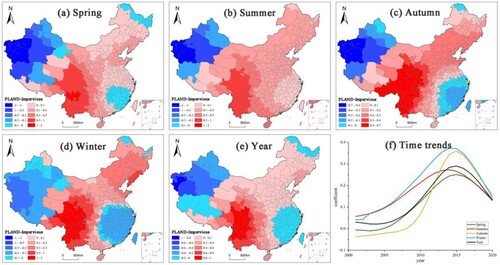
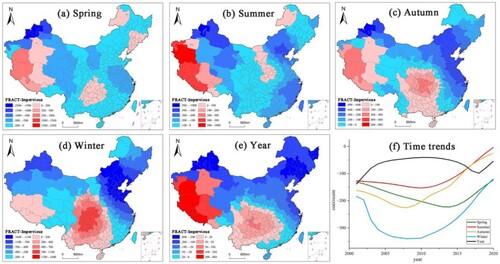
The impact of PLAND-Impervious on PM2.5 shows obvious spatiotemporal differences (). The effect gradually changes from positive to negative from the southwest outward and are approximately symmetrically distributed along the Hu Line. Over the years, the trend in change of the regression coefficient of PLAND-Impervious underwent a shift from increasing to decreasing, proving the environmental Kuznets curve theory (Gong, Ke, and He Citation2022), which states that socioeconomic development initially causes damage to the environment, and after developing to a certain level, economic development promotes the improvement of environmental quality ((f)). In addition, we found that the mitigating effect in the northwest gradually increased and the aggravating effect in the southwest gradually decreased over time, which was more obvious in winter and at the annual scale (Figure S7). This suggests that the increase in the proportion of impervious areas in both regions contributed to the reduction of PM2.5 concentration.
Figure 4. Spatial distribution (a-e) and temporal trend (f) of PLAND-Impervious regression coefficients.
3.3.2. Response of PM2.5 to FRACT
shows the spatial and temporal differences in the relationship between FRACT-UGI and PM2.5. FRACT-UGI has a positive correlation with PM2.5 concentrations in northwest, northeast, and the NCP, exhibiting strongest effect on northwest China. In contrast, FRACT-UGI was negative with PM2.5 concentrations in Tibetan Plateau (TP) and southern China, especially showing the strongest effect on the TP and southwest China in particular. Notably, in spring, summer and annual scale, the increase of FRACT-UGI led to an increase in PM2.5 concentrations, whereas it reduced PM2.5 concentrations in autumn and winter ((f)). Another interesting observation is that in Xinjiang, the positive effect of FRACT-UGI on PM2.5 concentrations diminished over time, and this phenomenon was evident at the autumn and annual scales (Figure S8).
Figure 5. Spatial distribution (a-e) and temporal trend (f) of FRACT-UGI regression coefficients.
FRACT-Impervious has contributed significantly to the reduction of PM2.5 concentrations in most parts of China, especially in the northeast (). However, in northwestern and parts of south-central China, the situation was different, with FRACT-Impervious exacerbating air pollution. The TP was most strongly response to FRACT-Impervious at summer and annual scales, while the Sichuan Basin was most affected in winter. From a temporal perspective, the regression coefficient of FRACT-Impervious was negative in all periods, but this negative effect has diminished in recent years. This mitigating effect has been two to three times greater in winter than in summer ((f)). Moreover, spatial and temporal differences in the relationship between FRACT-Impervious and summer PM2.5 concentrations were evident in central China, whereas they were small on other time scales (Figure S9).
Figure 6. Spatial distribution (a-e) and temporal trend (f) of FRACT-Impervious regression coefficients.
3.3.3. Response of PM2.5 to SHDI
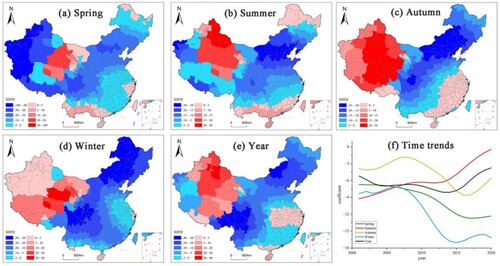
The impact of SHDI on PM2.5 showed significant seasonal variation, most prominent in northwest China (). In northwest China, PM2.5 concentrations decrease with SHDI in spring, but increase with SHDI in fall and winter, with exacerbating and mitigating effects coexisting in summer and annual scales. In addition to northwest China, the mitigation effect of SHDI is also strong in northeast and southwest China. Temporally, the regression coefficient of SHDI was negative, with the strongest effect in winter. The mitigating effect gradually weakened at summer and annual scales, with opposite trends in spring, autumn and winter ((f)). In the Northwest, the regression coefficients of SHDI changed from negative to positive, with the most pronounced effect at summer, fall and annual scales (Figure S10). This indicates that the northwestern region became less susceptible to diversified land production activities over time.
Figure 7. Spatial distribution (a-e) and temporal trend (f) of SHDI regression coefficients.
3.3.4. Relative importance of characteristic variables
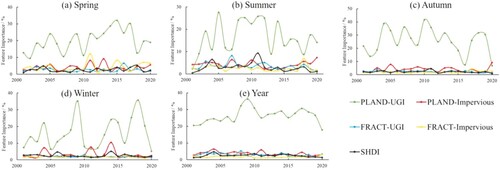
The contribution of the landscape indices to PM2.5 was further explored using RF, and we maintained the modeling accuracy above 0.9 throughout the RF modeling process to obtain a more accurate landscape contribution. As shown in , the indices explained about 30% of the information. The explanatory power of PLAND-UGI was the strongest among all landscape indices, with the greatest contribution at the annual scale and the weakest in winter (annual = 26.32%, autumn = 25.72%, spring = 20%, summer = 16.5%, and winter = 15.97%). The contribution of the other four landscape indices was much weaker (0∼5%).
Figure 8. Contribution of urban landscape composition indices to PM2.5 concentrations during 2001–2020.
3.3.5. Marginal effect of landscape index
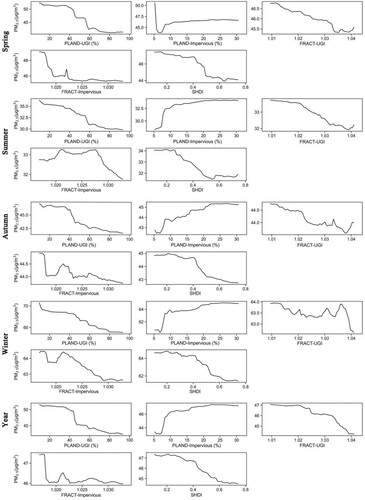
The marginal effects of the landscape indices can be explored using PDPs. These are calculated by holding the mean of all other variables constant to observe the trend of nonlinear response of the dependent variable to the independent variable (Li et al. Citation2020). The marginal effect of PLAND-Impervious differed strongly from those of other landscape variables (). PM2.5 concentrations increased with PLAND-Impervious, indicating that increased impervious area led to deteriorating air quality. SHDI showed a negative correlation, indicating that the mixed distribution of landscape types promoted the decrease of PM2.5 concentration. The relationship between FRACT and PM2.5 was complex, but increases in both FRACT-UGI and FRACT-Impervious generally were connected with decreases in PM2.5. Overall, it was obvious that the impact of landscape indices describing shape on PM2.5 was more complex than that of landscape indices describing area.
Figure 9. Marginal effects of urban landscape on PM2.5 concentration.
4. Discussion
4.1. Response of PM2.5 to landscapes characteristics
The global and local connections between PM2.5 and urban landscapes have been widely discussed (Bi et al. Citation2022; Bi, Chen, and Dai Citation2022; Fan et al. Citation2022; Li et al. Citation2021). However, few studies have incorporated both temporal and spatial heterogeneity. There will also be seasonal differences in the relationship between urban landscape and PM2.5 (Li et al. Citation2021; Liu et al. Citation2018). This seasonal variation is mainly reflected in the specific landscape type associated with PM2.5 and in the strength of this correlation. Vegetation can effectively reduce PM2.5, as illustrated in this and previous researches (Lei et al. Citation2021; Li et al. Citation2021). However, in parts of northwest and south China, we found that UGI did not reduce PM2.5 concentrations (). This may be related to the combined effects of grazing-exposed sandy soils in the northwest, dust storms caused by high winds, and rapid urbanization development in the south (Fan et al. Citation2022; Qin et al. Citation2022; Zhang et al. Citation2010) ().
UGI is effective in reducing PM2.5 levels. Vegetation can reduce 4.7 tons of PM2.5 per city per year in the United States (Nowak et al. Citation2013). Further studies found that when the vegetation cover was below 40%, the ecological benefits of vegetation depended on its spatial pattern and internal structure (Wei, Wang, and Zhang Citation1997). For example, a larger edge density (ED), indicative of a larger contact area between landscapes, is more beneficial for PM2.5 reduction (Xie and Wu Citation2017). There are tree species differences and scale effects in the dust reduction effect of plants (Beckett, Freer-Smith, and Taylor Citation2000; Chen et al. Citation2019). In addition, studies from a spatial heterogeneity perspective found that vegetation may also increase PM2.5 as a result of a combination of multiple factors (high construction intensity, increased building density, growing population and heavy traffic congestion) in rapidly developing urban areas (Fan et al. Citation2022).
The PM2.5 concentration mitigation effect of PLAND-UGI in our study was higher in winter and spring than at other time scales ((f)); winter and spring are high pollution seasons in China (Figure S1). Previous studies have found that the ability of green space to mitigate PM2.5 varies with pollution levels (Chen et al. Citation2019). Specifically, vegetation growth in spring is effective in mitigating air pollution (Nguyen et al. Citation2015; Yao et al. Citation2021). Although vegetation has a weaker pollutant uptake capacity in winter, higher vegetation volume helps to block PM2.5 transport when precipitation and wind speed are low. Compared with PLAND-UGI, the spatial and temporal relationship between FRACT-UGI and PM2.5 showed a complex dynamic. In the northeast and northwest regions, it has an aggravating effect on PM2.5, while in the south, it is mainly a mitigating effect. In northern China, industrialization (Zhou et al. Citation2021), coal heating (Wang et al. Citation2020), and dust storms (Qin et al. Citation2022), have led to high pollution, making it difficult for vegetation to absorb additional PM2.5 after reaching a the saturation stage (Janhäll Citation2015).
Urban construction elevated urban PM2.5 concentrations (Liu et al. Citation2022; Tao et al. Citation2020; Tu et al. Citation2019). However, different regions exhibit variations in this effect (Liu et al. Citation2022). Notably, in Northwest and South China, the increase in PLAND-Impervious promoted a decrease in PM2.5 concentrations, which is consistent with the findings of Liu et al. (Citation2022). Northwest China features a harsh ecological environment with a high number of windy days; the development of cities provides financial and human resources to combat desertification in these areas. For example, wind and sand control projects can effectively reduce PM2.5 (Zhang and Wang Citation2020). Ground hardening also reduces bare soil exposure and curbs dust to some extent (Jiang et al. Citation2019). The economically developed southern region of China and the people’s desire for economic development along with a beautiful natural environment have led to a greater focus on improving air quality during urban development (Gong, Ke, and He Citation2022). For example, the use of green building materials and environmentally friendly materials (Liu et al. Citation2022), the promotion of green travel (Zheng et al. Citation2019) and the implementation of a series of environmental protection measures (e.g. the use of urban sprinklers and the closure of highly polluting enterprises). Decentralized and complex urban construction can help reduce PM2.5 concentrations in the eastern coastal areas (). This is because these regions are economically developed and have high urban density, and proper development of polycentric cities can increase the mix of urban and green space to achieve a reduction of PM2.5 concentration (Tao et al. Citation2020). In Sichuan Basin region and parts of northwest China, the construction of dispersed and complex cities is not feasible. The damage and pollution generated by urban construction are not conducive to local diffusion, thus exacerbating local air pollution, as confirmed in the study by Shi et al. (Citation2019). Overall, FRACT-Impervious was found to significantly reduces PM2.5 emissions ((f)).
Further analysis of the contribution and marginal effects of landscape composition based on RF and PDP. PLAND-UGI is among the strongest contributing factors, further underlining the ability of UGI to reduce PM2.5 (Li et al. Citation2021) (). Urban development inevitably generates air pollution, and increasing the proportion of UGI is a necessary measure to improve air quality (Yu Citation2020). However, in rapidly growing urban areas, the dust reduction effect of vegetation saturates due to the abundance of particulate matter sources, which leads to higher pollutant levels. Appropriate reduction of population density and the number of urban buildings can help reduce PM2.5 levels (Guo et al. Citation2019). Conducting industrial upgrading (Liu et al. Citation2019), promoting green transportation (Zheng et al. Citation2019) and using green building materials (Liu et al. Citation2022) can effectively lower PM2.5 concentrations. Further, ground hardening inhibits the upward diffusion of pollutants to some extent (Jiang et al. Citation2019). PM2.5 concentrations in winter are most explained by PLANGD (). PLAND-UGI interpretation of PM2.5 saturates at around 60%, and this already occurred at 20% for PLAND-Impervious. This indicates that air pollution increases along with urban development; when the development reaches a certain level, a preference for high-quality development takes over, which includes increased efforts to combat persistent urban problems such as air pollution to ensure sustainable development (Gong, Ke, and He Citation2022). FRACT is a landscape index indicative of landscape patch shape. How the shape of the landscape affects the distribution of PM2.5 is still open to discussion, so FRACT shows large fluctuations in the downward trend (). On the one hand, decentralized cities can add more green space and water within their boundaries (Tao et al. Citation2020); on the other hand, a compact urban form reduces transportation travel distance (Fan et al. Citation2018). Both of these forms have been connected with reduced pollutant emissions.
4.2. Comparison between models
We compared five regression models (Liu et al. Citation2022; Tu et al. Citation2019). As can be seen from Table S2, the models that account for spatial heterogeneity have higher fitting accuracy (Liu et al. Citation2022). The OLS model possessed lower modeling accuracy in spring; in contrast, the accuracy of the SLM and SEM models was lower in summer and winter. Similar seasonal differences have been found in other research (Liu et al. Citation2022; Shi et al. Citation2019).
The regression coefficients for most variables were statistically significant, which is consistent with previous findings (Li et al. Citation2021; Tao et al. Citation2020). PM2.5 was significantly correlated with SHDI, PLAND-UGI and PLAND-Impervious in all seasons (p < 0.01). SHDI, FRACT-UGI, FRACT-Impervious, and PLAND-UGI significantly reduced PM2.5 levels, indicating that increasing the proportion of UGI and land-use diversity further decentralizing cities are beneficial for PM2.5 concentration reduction (McCarty and Kaza Citation2015). In contrast, PLAND-Impervious had a positive effect on PM2.5, indicating that urban construction causes deterioration in air quality.
The regression coefficients for most of the control variables were also statistically significant. Relative humidity, NDVI, nightlight, precipitation, and wind speed had negative correlations, while temperature was positively correlated. Vegetation, wind speed, and rainfall have previously been shown to be able to significantly reduce PM2.5 levels (Liu et al. Citation2022; Shi et al. Citation2019), while increased temperature generates updrafts that drive surface particulate matter upward, thus increasing atmospheric particulate matter levels (Shi et al. Citation2019; Zhang and Cheng Citation2022).
The results of our multi-model comparison are consistent with earlier findings. For example, Liu et al. (Citation2022) concluded that the GWR model had advantages in quantifying the impact of urban morphology on PM2.5. GWR models produce more reliable estimates than global regression models by eliminating the spatial autocorrelation state of the dependent variable (Tu et al. Citation2019).
4.3. Contributions and limitations
In this study, the influence of landscape indices on PM2.5 at different time scales while incorporating spatiotemporal heterogeneity in PM2.5 concentrations, based on a GTWR model. We found that the correlation of different landscape indices with pollution concentration varied with different spatiotemporal scales. The main practical implication of our findings is that different each city should adopt different construction programs. The contribution of each independent variable was explored based on RF model, which indicated that PLAND-UGI had the strongest contribution to explanatory power among landscape indices, which together explained approximately 30% of total variation. This suggests that planners should focus on increasing the proportion of UGI in urban construction. The marginal effect of landscape indices on PM2.5 was explored using PDP analysis. There are differences in the range of landscape explanations for PM2.5. PM2.5 is negatively correlated with PLAND-UGI, FRACT-UGI, FRACT-Impervious, and SHDI, and positively correlated with PLAND-Impervious. The relationship between FRACT and PM2.5 is negatively, and is positively correlated in the local range. However, the study was subject to several limitations. Many variables affect PM2.5, and the next step can be to screen the elements that have a strong influence on PM2.5, using principal component analysis and stepwise regression analysis. Moreover, the spatiotemporal heterogeneity of the PM2.5 concentration prompted us to choose a local regression model. Although GTWR has a better fitting accuracy than a global regression model, its shortcomings lie in the fixed choice of bandwidth, which makes it impossible to obtain the best fitting ‘scale’ for each variable. In subsequent research, we will therefore expand the investigation of the relationship between landscape and PM2.5 by improving model, such as by using multiscale spatiotemporal geographically weighted regression (MGTWR) or improved spatiotemporal geographically weighted regression (IGTWR) models.
5. Conclusions
This paper investigates the influence of landscape composition on PM2.5 at different time scales and found the following main results: 1) PM2.5 concentrations in China have been continuously decreasing over the last 20 years, with 90% of the national territory in a concentration range of 0–75 μg/m3 as of 2020. 2) There are spatial and temporal differences in the impact of urban landscape indices on PM2.5. Under the combined effect of natural elements and human activities, the impact of the same urban landscape on PM2.5 will change with time and space, and even produce opposite effects. 3) PLAND-UGI had the greatest explanatory effect among landscape indices, explaining about 25% of variation in PM2.5 spatial distribution, while the contribution of other landscape indices was below 5%. 4) PLAND had the strongest marginal effect on PM2.5 and could explain the largest concentration range. The relationship between FRACT and PM2.5 was complex, as reflected by the finding that the marginal effect shows both an overall decrease and a local increase.
Chinese cities have varying levels of development and vastly different natural conditions, and the same urban landscape can have differential effects depending on the city’s own circumstances. In addition to relying on a rational layout of the urban landscape form to improve air quality, it is crucial to strengthen the management of pollution sources. This study can provide reference value for cities in other countries that are developing at a fast pace.
Supplemental Material
Download MS Word (69.3 MB)Acknowledgments
We thank Changhui Peng, Xiaolu Zhou, Peng Li, Zelin Liu, Cicheng Zhang, Ziyin Zhou, and Tong Li for helpful discussions. All authors contributed critically to the draft and gave final approval for publication. We thank all the reviewers for their valuable comments and suggestions.
Disclosure statement
No potential conflict of interest was reported by the author(s).
Data availability statement
Relevant data used for this study are available from the corresponding authors upon request.
Additional information
Funding
References
- Anselin, Luc. 1995. “Local Indicators of Spatial Association-LISA.” Geographical Analysis 27 (2): 93–115. https://doi.org/10.1111/j.1538-4632.1995.tb00338.x.
- Beckett, K. Paul, Peter H. Freer-Smith, and Gail Taylor. 2000. “The Capture of Particulate Pollution by Trees at Five Contrasting Urban Sites.” Arboricultural Journal 24 (2-3): 209–230. https://doi.org/10.1080/03071375.2000.9747273.
- Bi, Shibo, Ming Chen, and Fei Dai. 2022. “The Impact of Urban Green Space Morphology on PM2.5 Pollution in Wuhan, China: A Novel Multiscale Spatiotemporal Analytical Framework.” Building and Environment 221, https://doi.org/10.1016/j.buildenv.2022.109340.
- Bi, Shibo, Fei Dai, Ming Chen, and Shen Xu. 2022. “A new Framework for Analysis of the Morphological Spatial Patterns of Urban Green Space to Reduce PM2.5 Pollution: A Case Study in Wuhan, China.” Sustainable Cities and Society 82, https://doi.org/10.1016/j.scs.2022.103900.
- Cai, Longyan, Mazhan Zhuang, and Yin Ren. 2020. “A Landscape Scale Study in Southeast China Investigating the Effects of Varied Green Space Types on Atmospheric PM2.5 in mid-Winter.” Urban Forestry & Urban Greening 49, https://doi.org/10.1016/j.ufug.2020.126607.
- Cao, Qilin, Anhong Hou, Xiang Li, and Chunxue Jiang. 2023. “Spatial Impact of Government Venture Capital on Urbanization and Its Path – Evidence from the Yangtze River Delta Urban Agglomeration in China.” Land 12 (1), https://doi.org/10.3390/land12010053.
- Chen, Ming, Fei Dai, Bo Yang, and Shengwei Zhu. 2019. “Effects of Urban Green Space Morphological Pattern on Variation of PM2.5 Concentration in the Neighborhoods of Five Chinese Megacities.” Building and Environment 158: 1–15. https://doi.org/10.1016/j.buildenv.2019.04.058.
- Cheng, Liang, Ting Zhang, Longqian Chen, Long Li, Shangjiu Wang, Sai Hu, Lina Yuan, Jia Wang, and Mingxin Wen. 2020. “Investigating the Impacts of Urbanization on PM2.5 Pollution in the Yangtze River Delta of China: A Spatial Panel Data Approach.” Atmosphere 11, https://doi.org/10.3390/atmos11101058.
- China Statistics Press. 2021. “China’s 2020 1% Population Sample Survey Data.” In, edited by Population Statistics Department of National Bureau of Statistics.
- Dong, Feng, Shengnan Zhang, Ruyin Long, Xiaoyun Zhang, and Ziyuan Sun. 2019. “Determinants of Haze Pollution: An Analysis from the Perspective of Spatiotemporal Heterogeneity.” Journal of Cleaner Production 222: 768–783. https://doi.org/10.1016/j.jclepro.2019.03.105.
- Fan, Chenjing, Li Tian, Lin Zhou, Deyi Hou, Yan Song, Xiaohui Qiao, and Jingwei Li. 2018. “Examining the Impacts of Urban Form on air Pollutant Emissions: Evidence from China.” Journal of Environmental Management 212: 405–414. https://doi.org/10.1016/j.jenvman.2018.02.001.
- Fan, Zhiyu, Qingming Zhan, Huimin Liu, Yihan Wu, and Yu Xia. 2022. “Investigating the Interactive and Heterogeneous Effects of Green and Blue Space on Urban PM2.5 Concentration, a Case Study of Wuhan.” Journal of Cleaner Production 378, https://doi.org/10.1016/j.jclepro.2022.134389.
- Geng, G., Q. Xiao, S. Liu, X. Liu, J. Cheng, Y. Zheng, T. Xue, et al. 2021. “Tracking Air Pollution in China: Near Real-Time PM2.5 Retrievals from Multisource Data Fusion.” Environmental Science & Technology 55 (17): 12106–12115. https://doi.org/10.1021/acs.est.1c01863.
- Gong, Xusheng, Bi-Qin Ke, and Heung Eog Cha. 2022. “Spatiotemporal Patterns and Drivers of Surface Ozone in the Yangtze River Economy Belt.” Resources and Environment in the Yangtze Basin 31 (11): 2489–2499. https://doi.org/10.11870/cjlyzyyhj202211014.
- Guo, Jing., Peng. Gong, Iryna. Dronova, and Zhiliang. Zhu. 2022. “Forest Cover Change in China from 2000 to 2016.” International Journal of Remote Sensing, https://doi.org/10.1080/01431161.2021.2022804.
- Guo, L., J. Luo, M. Yuan, Y. Huang, H. Shen, and T. Li. 2019. “The Influence of Urban Planning Factors on PM2.5 Pollution Exposure and Implications: A Case Study in China Based on Remote Sensing, LBS, and GIS Data.” Science of The Total Environment 659: 1585–1596. https://doi.org/10.1016/j.scitotenv.2018.12.448.
- Guo, B., X. Wang, L. Pei, Y. Su, D. Zhang, and Y. Wang. 2021. “Identifying the Spatiotemporal Dynamic of PM2.5 Concentrations at Multiple Scales Using Geographically and Temporally Weighted Regression Model Across China During 2015-2018.” Science of The Total Environment 751: 141765. https://doi.org/10.1016/j.scitotenv.2020.141765.
- Guo, Bin, Dingming. Zhang, Lin. Pei, Yi. Su, Xiaoxia. Wang, Y. Bian, D. Zhang, W. Yao, Z. Zhou, and L. Guo. 2021. “Estimating PM2.5 Concentrations via Random Forest Method Using Satellite, Auxiliary, and Ground-Level Station Dataset at Multiple Temporal Scales Across China in 2017.” Science of the Total Environment 778: 146288. https://doi.org/10.1016/j.scitotenv.2021.146288.
- He, Qingqing, Kai Gao, Lei Zhang, Yimeng Song, and Ming Zhang. 2021. “Satellite-derived 1-km Estimates and Long-Term Trends of PM2.5 Concentrations in China from 2000 to 2018.” Environment International 156, https://doi.org/10.1016/j.envint.2021.106726.
- Health Effects Institute. 2019. “State of Global Air 2019. Special Report. Boston., MA:Health Effects Institute.,.” In.
- Huang, C., J. Hu, T. Xue, H. Xu, and M. Wang. 2021. “High-Resolution Spatiotemporal Modeling for Ambient PM2.5 Exposure Assessment in China from 2013 to 2019.” Environmental Science & Technology 55 (3): 2152–2162. https://doi.org/10.1021/acs.est.0c05815.
- Huang, Bo, Bo Wu, and Michael Barry. 2010. “Geographically and Temporally Weighted Regression for Modeling Spatio-Temporal Variation in House Prices.” International Journal of Geographical Information Science 24 (3): 383–401. https://doi.org/10.1080/13658810802672469.
- Janhäll, Sara. 2015. “Review on Urban Vegetation and Particle air Pollution – Deposition and Dispersion.” Atmospheric Environment 105: 130–137. https://doi.org/10.1016/j.atmosenv.2015.01.052.
- Ji, Yanjie, Xinwei Ma, Mingyuan Yang, Yuchuan Jin, and Liangpeng Gao. 2018. “Exploring Spatially Varying Influences on Metro-Bikeshare Transfer: A Geographically Weighted Poisson Regression Approach.” Sustainability 10 (5), https://doi.org/10.3390/su10051526.
- Jian, Le, Dimpalben Patel, Jianguo Xiao, Janis Jansz, Grace Yun, Ting Lin, and Andrew Robertson. 2023. “Can we use a Machine Learning Approach to Predict the Impact of Heatwaves on Emergency Department Attendance?” Environmental Research Communications 5 (4), https://doi.org/10.1088/2515-7620/acca6e.
- Jiang, Zhao. Bing., Qian. Zhang, Feng. Yang, and Yi. Song. Xie. 2019. “Construction Site Dust Management Engineering Technology Overview.” Resource Conservation and Environmental Protection, https://doi.org/10.16317/j.cnki.12-1377/x.2019.02.040.
- Lei, Yakai, G. Matt Davies, Huan Jin, Guohang Tian, and Gunwoo Kim. 2021. “Scale-dependent Effects of Urban Greenspace on Particulate Matter air Pollution.” Urban Forestry & Urban Greening 61, https://doi.org/10.1016/j.ufug.2021.127089.
- Li, Kongming, Chunlin Li, Miao Liu, Yuanman Hu, Hao Wang, and Wen Wu. 2021. “Multiscale Analysis of the Effects of Urban Green Infrastructure Landscape Patterns on PM2.5 Concentrations in an Area of Rapid Urbanization.” Journal of Cleaner Production 325, https://doi.org/10.1016/j.jclepro.2021.129324.
- Li, Chunlin, Miao Liu, Yuanman Hu, Rui Zhou, Na Huang, Wen Wu, and Chong Liu. 2020. “Spatial Distribution Characteristics of Gaseous Pollutants and Particulate Matter Inside a City in the Heating Season of Northeast China.” Sustainable Cities and Society 61, https://doi.org/10.1016/j.scs.2020.102302.
- Li, Huilei, Jian Peng, Liu Yanxu, and Hu Yi’na. 2017. “Urbanization Impact on Landscape Patterns in Beijing City, China: A Spatial Heterogeneity Perspective.” Ecological Indicators 82: 50–60. https://doi.org/10.1016/j.ecolind.2017.06.032.
- Li, Chao, Zhanyong Wang, Bai Li, Zhong-Ren Peng, and Qingyan Fu. 2019. “Investigating the Relationship Between air Pollution Variation and Urban Form.” Building and Environment 147: 559–568. https://doi.org/10.1016/j.buildenv.2018.06.038.
- Li, Fan, and Tao Zhou. 2019. “Effects of Urban Form on air Quality in China: An Analysis Based on the Spatial Autoregressive Model.” Cities 89: 130–140. https://doi.org/10.1016/j.cities.2019.01.025.
- Linlin, Y. U., H. U. Haibo, and Y. U. Wei. 2020. “Effects of Urban Green Spaces on PM2.5 Concentrations in Atmosphere.” Journal of Nanjing Forestry University (Natural Sciences Edition), 179–184. https://doi.org/10.3969/j.issn.1000-2006.201811039.
- Liu, Chao, Hancheng Dai, Lin Zhang, and Changchun Feng. 2019. “The Impacts of Economic Restructuring and Technology Upgrade on air Quality and Human Health in Beijing-Tianjin-Hebei Region in China.” Frontiers of Environmental Science & Engineering 13 (5), https://doi.org/10.1007/s11783-019-1155-y.
- Liu, Ying, Lijie He, Wenmin Qin, Aiwen Lin, and Yanzhao Yang. 2022. “The Effect of Urban Form on PM2.5 Concentration: Evidence from China’s 340 Prefecture-Level Cities.” Remote Sensing 14 (1), https://doi.org/10.3390/rs14010007.
- Liu, Yupeng, Jianguo Wu, and Deyong Yu. 2017. “Characterizing Spatiotemporal Patterns of air Pollution in China: A Multiscale Landscape Approach.” Ecological Indicators 76: 344–356. https://doi.org/10.1016/j.ecolind.2017.01.027.
- Liu, Y., J. Wu, D. Yu, and Q. Ma. 2018. “The Relationship Between Urban Form and air Pollution Depends on Seasonality and City Size.” Environmental Science and Pollution Research 25 (16): 15554–15567. https://doi.org/10.1007/s11356-018-1743-6.
- Liu, Q., R. Wu, W. Zhang, W. Li, and S. Wang. 2020. “The Varying Driving Forces of PM2.5 Concentrations in Chinese Cities: Insights from a Geographically and Temporally Weighted Regression Model.” Environment International 145: 106168. https://doi.org/10.1016/j.envint.2020.106168.
- Logan, T. M., B. Zaitchik, S. Guikema, and A. Nisbet. 2020. “Night and day: The Influence and Relative Importance of Urban Characteristics on Remotely Sensed Land Surface Temperature.” Remote Sensing of Environment 247, https://doi.org/10.1016/j.rse.2020.111861.
- Lu, Debin, Wanliu Mao, Dongyang Yang, Jianan Zhao, and Jianhua Xu. 2018. “Effects of Land use and Landscape Pattern on PM2.5 in Yangtze River Delta, China.” Atmospheric Pollution Research 9 (4): 705–713. https://doi.org/10.1016/j.apr.2018.01.012.
- Mao, F. Y., J. Hong, Q. Min, W. Gong, L. Zang, and J. Yin. 2021. “Estimating Hourly Full-Coverage PM2.5 Over China Based on TOA Reflectance Data from the Fengyun-4A Satellite.” Environmental Pollution 270: 116119. https://doi.org/10.1016/j.envpol.2020.116119.
- McCarty, Joshua, and Nikhil Kaza. 2015. “Urban Form and Air Quality in the United States.” Landscape and Urban Planning 139: 168–179. https://doi.org/10.1016/j.landurbplan.2015.03.008.
- Nguyen, T., X. Yu, Z. Zhang, M. Liu, and X. Liu. 2015. “Relationship Between Types of Urban Forest and PM2.5 Capture at Three Growth Stages of Leaves.” Journal of Environmental Sciences 27: 33–41. https://doi.org/10.1016/j.jes.2014.04.019.
- Nowak, D. J., S. Hirabayashi, A. Bodine, and R. Hoehn. 2013. “Modeled PM2.5 Removal by Trees in ten U.S. Cities and Associated Health Effects.” Environmental Pollution 178: 395–402. https://doi.org/10.1016/j.envpol.2013.03.050.
- Peng, Jian, Sha Chen, Huiling Lü, Yanxu Liu, and Jiansheng Wu. 2016. “Spatiotemporal Patterns of Remotely Sensed PM 2.5 Concentration in China from 1999 to 2011.” Remote Sensing of Environment 174: 109–121. https://doi.org/10.1016/j.rse.2015.12.008.
- Qin, Hao.jun., Yang Xiaojun, Ma Li, Wang Yicheng, Fu Zhao, Zhang Junxia, and Lu Zhengqi. 2022. “Characteristics and Causes of Regional Sandstorms in Northwest of China from 2000 to 2020.” Journal of Desert Research, https://doi.org/10.7522/j.issn.1000-694X.2022.00042.
- Shi, Kaifang, Yang Li, Yun Chen, Linyi Li, and Chang Huang. 2019. “How Does the Urban Form-PM2.5 Concentration Relationship Change Seasonally in Chinese Cities? A Comparative Analysis Between National and Urban Agglomeration Scales.” Journal of Cleaner Production 239, https://doi.org/10.1016/j.jclepro.2019.118088.
- Tao, Yu, Zhen Zhang, Weixin Ou, Jie Guo, and Steven G. Pueppke. 2020. “How Does Urban Form Influence PM2.5 Concentrations: Insights from 350 Different-Sized Cities in the Rapidly Urbanizing Yangtze River Delta Region of China, 1998–2015.” Cities 98, https://doi.org/10.1016/j.cities.2019.102581.
- Tu, Mengzhao, Zhifeng Liu, Chunyang He, Zihang Fang, and Wenlu Lu. 2019. “The Relationships Between Urban Landscape Patterns and Fine Particulate Pollution in China: A Multiscale Investigation Using a Geographically Weighted Regression Model.” Journal of Cleaner Production 237, https://doi.org/10.1016/j.jclepro.2019.117744.
- Wang, L., D. Niu, H. Fan, and X. Long. 2022. “Urban Configuration and PM2.5 Concentrations: Evidence from 330 Chinese Cities.” Environment International 161: 107129. https://doi.org/10.1016/j.envint.2022.107129.
- Wang, W., A. Samat, J. Abuduwaili, and Y. Ge. 2020. “Spatio-Temporal Variations of Satellite-Based PM2.5 Concentrations and Its Determinants in Xinjiang, Northwest of China.” International Journal of Environmental Research and Public Health 17 (6), https://doi.org/10.3390/ijerph17062157.
- Wei, Bin, Jingxu Wang, and Tao Zhang. 1997. “Improvement of Assessment Methods for Ecological Effect of Urban Greenland.” Urban environment & Urban ecology 10 (4): 54–55.
- Xie, Wudan, and Jiansheng Wu. 2017. “Effects of Land Use and Urban Landscape Pattern on PM2.5 Concentration: A Shenzhen Case Study.” Acta Scientiarum Naturalium Universitatis Pekinensis, https://doi.org/10.13209/j.0479-8023.2016.120.
- Xu, Zhao, Xiaopeng Xia, Xiangnan Liu, and Zhiguang Qian. 2015. “Combining DMSP/OLS Nighttime Light with Echo State Network for Prediction of Daily PM2.5 Average Concentrations in Shanghai, China.” Atmosphere 6 (10): 1507–1520. https://doi.org/10.3390/atmos6101507.
- Yao, Jing, Miao Liu, Nina Chen, Xiaobo Wang, Xingyuan He, Yuanman Hu, Xueyan Wang, and Wei Chen. 2021. “Quantitative Assessment of Demand and Supply of Urban Ecosystem Services in Different Seasons: A Case Study on air Purification in a Temperate City.” Landscape Ecology 36 (7): 1971–1986. https://doi.org/10.1007/s10980-020-01112-7.
- Yao, Fei, Jiansheng Wu, Weifeng Li, and Jian Peng. 2019. “A Spatially Structured Adaptive two-Stage Model for Retrieving Ground-Level PM2.5 Concentrations from VIIRS AOD in China.” ISPRS Journal of Photogrammetry and Remote Sensing 151: 263–276. https://doi.org/10.1016/j.isprsjprs.2019.03.011.
- Zhang, X., and C. Cheng. 2022. “Temporal and Spatial Heterogeneity of PM2.5 Related to Meteorological and Socioeconomic Factors Across China During 2000–2018.” International Journal of Environmental Research and Public Health 19 (2), https://doi.org/10.3390/ijerph19020707.
- Zhang, Biao., and Shuang. Wang. 2020. “Dynamic Changes of the Sand-Fixing Service in the Sandstorm Source Control Region of Xilin Gol League.” Journal of Ecology and Rural Environment 36: 291–299. https://doi.org/10.19741/j.issn.1673-4831.2019.0325.
- Zhang, Min, Xuemei Wang, Jianmin Chen, Tiantao Cheng, Tao Wang, Xin Yang, Youguo Gong, Fuhai Geng, and Changhong Chen. 2010. “Physical Characterization of Aerosol Particles During the Chinese New Year’s Firework Events.” Atmospheric Environment 44 (39): 5191–5198. https://doi.org/10.1016/j.atmosenv.2010.08.048.
- Zheng, Siqi, Xiaonan Zhang, Weizeng Sun, and Jianghao Wang. 2019. “The Effect of a new Subway Line on Local air Quality: A Case Study in Changsha.” Transportation Research Part D: Transport and Environment 68: 26–38. https://doi.org/10.1016/j.trd.2017.10.004.
- Zhou, Hao, Mingdong Jiang, Yumeng Huang, and Qi Wang. 2021. “Directional Spatial Spillover Effects and Driving Factors of Haze Pollution in North China Plain.” Resources, Conservation and Recycling 169, https://doi.org/10.1016/j.resconrec.2021.105475.