
 ?Mathematical formulae have been encoded as MathML and are displayed in this HTML version using MathJax in order to improve their display. Uncheck the box to turn MathJax off. This feature requires Javascript. Click on a formula to zoom.
ABSTRACT
Public participation geographic information system (PPGIS) is a facilitated Volunteered Geographic Information approach and data collection method that aims to capture the spatial experiences of individuals. Although we experience the space around us three-dimensionally, altitude, as the third dimension, has been often absent from PPGIS research and practice. This is largely because of the complexity of implementing surveys in 3D but can also be attributed to a lack of analytical preparedness for using such data. This study complements 3D PPGIS data collected from a pilot study of the Aninkainen block in Turku, Finland with synthetic, i.e. artificially manufactured, data to propose an analytical framework for the study of 3D PPGIS data. The analytical framework divides methods based on the geographical scale into two groups: micro- and macro-scale analysis. In this framework, we propose the use of geospatial metrics to analyze 3D PPGIS data. We argue that while this multidisciplinary area of research is in its infancy, use of intuitive 3D adapted geometric and landscape metrics can help overcome some of complexities associated with use of this emerging participatory data. We conclude by outlining the limitations and envisioning areas for future research.
1. Introduction
1.1 Background
We experience the space around us three-dimensionally (3D) and perceive our cities as a collection of related 3D physical elements. These elements can include anything from buildings to various natural and man-made spaces. For spatial planning of urban futures, integrating the different elements of built and natural environments is crucial and best understood when the third vertical dimension of the elements is acknowledged. However, geographic information systems (GIS) effective in treating, managing, and analyzing various spatial data have predominantly been applied to analyze and study our world in 2D or 2.5D. A 2.5D visualization is a convenient and efficient approach for exploiting city models in web GIS without incorporating 3D objects as surface or volume models (Liang et al. Citation2016). Nevertheless, in the past decade, owing largely to advancements in digital and computational technologies, a paradigm shift has occurred in geographic information science. We are analyzing, simulating, and visualizing our world in 3D, and even developing 3D ‘metaverses’ has become commonplace (Song and Hong Citation2021). This trend has slowly but steadily emerged in urban spatial planning as well. Urban 3D models (Biljecki, Ledoux, and Stoter Citation2016), digital urban twins (Dembski et al. Citation2020), and various attempts toward urban gamification for different planning purposes are a few examples of such endeavors (Qi et al. Citation2021; Batty Citation2018). Development has primarily focused on mapping and representing built and biophysical environments. There are several examples of cities worldwide that have produced open-access browser-based 3D city models, (Biljecki et al. Citation2015; Julin et al. Citation2018) and commercial actors such as Google Earth have been creating 3D globe models for a long time. Gaming technology (Almahmood and Skov-Petersen Citation2020) and computer-aided design (CAD) (Hermansdorfer et al. Citation2020) have a long history of using 3D technology.
However, little but increasing attention has been given to the opportunities that virtual 3D landscapes can potentially offer for identifying people’s subjective opinions and perceptions to enhance citizen participation and communication in urban planning (Eilola et al. Citation2023). Recently, interest in applying 3D geovisualizations, 3D city models, and digital twins to facilitate participation in planning (Biljecki et al. Citation2015; Batty Citation2018; Ketzler et al. Citation2020; Tao et al. Citation2019) has begun to emerge in (landscape) architecture, land use, landscape, and environmental planning at different stages of planning processes (Lovett et al. Citation2015; Portman, Natapov, and Fisher-Gewirtzman Citation2015). This has predominantly been in the form of participatory 3D modeling (P3DM) or Three-Dimensional Digital Participatory Planning (3DDPP). P3DM applies mapping as a process where participants are developing a tangible 3D model of their community (Gaillard and Maceda Citation2009; Le Dé et al. Citation2020). Similarly, 3DDPP has been used as a collaborative virtual environment where stakeholders and planners are immersed in a 3D co-creative space for designing and planning their own cities (Bouzguenda, Fava, and Alalouch Citation2021).
On another front, stemming from human geography and land use planning, studies have during the past two decades increasingly addressed people’s place-based experiential knowledge in landscape and urban planning (Brown, Reed, and Raymond Citation2020). This has been predominantly addressed through participatory mapping methods (Public Participation Geographical Information Systems, PPGIS), often combining digital surveys with a mapping component (Brown and Kyttä Citation2018). PPGIS is a variant of traditional Volunteered Geographic Information (VGI). VGI involves the voluntary contribution of geographic information by individuals, while PPGIS focuses on utilizing GIS technologies to engage the public in decision-making processes (Goodchild Citation2007). PPGIS can be conceived as a form of facilitated VGI (f-VGI) (Seeger Citation2008; Seeger Citation2017), where participants volunteer to map specific issues of interest to researchers or planning bodies. In f-VGI, the collection of volunteered information through online mapping interfaces is shepherded by a facilitator as part of a pre-established planning or design process (Seeger Citation2008; Seeger Citation2017) and as such, shares goals similar to PPGIS (Brown and Kyttä Citation2014). PPGIS has successfully engaged both the general public and individual stakeholders to identify and map landscape values, behavior, development preferences, and ecosystem services in a variety of contexts and scales (Fagerholm et al. Citation2012; Kyttä et al. Citation2015; Plieninger et al. Citation2013; Sherrouse, Semmens, and Clement Citation2014).
Use of 3D visualization and techniques in participatory processes is often found to promote participation and communication in planning (Neuenschwander, Wissen Hayek, and Grêt-Regamey Citation2014; Pettit, Cartwright, and Berry Citation2006). Although the amount of empirical evidence is still limited (Eilola et al. Citation2023), several recent studies have shown that people may consider 3D virtual landscape visualizations to be more explanatory, realistic, and understandable than 2D maps in different stages of landscape planning (Cadag and Gaillard Citation2012; Lütjens et al. Citation2019; Virtanen et al. Citation2015; J. C. Gaillard et al. Citation2013). Therefore, although PPGIS is typically applied using 2D topographic or satellite image maps, exploring use of 3D map view is a tempting area for exploration. However, this is an underexplored area in the current body of literature as most applications are still largely at a visionary level (Eilola et al. Citation2023; Julin et al. Citation2018). Snizek provided an early suggestion and application of what came to be the 3D PPGIS (Citation2003). Later, Babelon (Citation2017) proposed the combination of web-based PPGIS and 3D city models as a ‘socio-technical hybrid’ that can empower participatory mapping. Hasanzadeh and colleagues take the notion of 3D PPGIS further and envision its future application for empirical urban research (Citation2022). They go further by discussing that this may be the new frontier in participatory mapping research in coming years and that there is need for more methodological work in this area (Hasanzadeh and Fagerholm Citation2022). In a similar attempt, but with a different purpose, Gkeli et al., provide a technical solution for collection of crowdsourced 3D cadastral surveys (Citation2020). Using a case study of Athens, Greece, they show that this approach can be used to provide a functional 3D cadastral system in areas lacking accurate registration maps (Gkeli, Potsiou, and Ioannidis Citation2020).
Digital map-based survey approaches incorporating 3D virtual landscapes (i.e. online 3D PPGIS) are emerging in both business and academia (Hermansdorfer et al. Citation2020; Petrasova et al. Citation2018). There are also reports of 3D PPGIS being piloted or implemented as both analog and digital participatory tool (Babelon Citation2017; Jeansson, Telldén, and Khashayar Citation2012; Rambaldi and Callosa-Tarr Citation2001). However, more methodological work is required before 3D PPGIS becomes more prevalent.
1.2 Methodological gaps and research objectives
As stated earlier, discussions around 3D PPGIS are relatively new and there is need for methodological developments. The design concept for 3D participation and the required methodology for integrating 2D maps and 3D visualizations have been previously discussed in a number of studies. These studies do not necessarily use the term 3D PPGIS, however many of the findings related to integration of 3D and 2D visualizations for participatory purposes can also be applicable to 3D PPGIS development. For example, Mueller et al., describe a new strategy for ‘crowd-creative’ urban design using 3D visualization technology (Citation2018). Similarly, Lieven describes the efforts by city of Hamburg to integrate various interactive visualizations, including 3D surfaces and city models, into their GIS-based participatory platform (Citation2017). In another study, researchers present a technical solution for crowdsourced 3D cadastral surveys, which involves the simultaneous implementation of 2D and 3D property registration (Gkeli, Potsiou, and Ioannidis Citation2020).
However, in this study we focus on a different methodological gap that only arises after data collection. Presently, there is a notable absence of established methodologies for effectively analyzing the 3D data generated through participatory processes involving individuals (Hasanzadeh and Fagerholm Citation2022). To address these knowledge and methodological gaps, we developed a 3D PPGIS approach and applied it to collect the preferences of urban residents regarding the future development of the Aninkainen area in Turku, Finland. The addition of the 3D component in PPGIS introduces the use of 3D spatial data and visualization techniques. Using the 3D PPGIS survey, the participant can browse the study area including the representation of buildings and terrain in a three-dimensional space and place markings by clicking on any desired location within the space. Accordingly, the 3D coordinates of the marked point together with any additionally provided information will be stored in the database.
In this study, our primary objective was to investigate spatial analytical methods suitable for analyzing such 3D PPGIS dataset. As PPGIS data has not adequately been explored in 3D, this research represents a significant analytical contribution introducing a novel approach that can promote and facilitate the adoption of 3D PPGIS in future participatory research endeavors. We recognized the need to cover a wide range of analytical methods, including those suitable for analysis on both macro and micro geographical scales. However, as the data was collected from one city block, only micro-scale analytical methods could be explored. To address this, we expanded our dataset by incorporating synthetic 3D PPGIS data from a larger area in Turku's city center. To generate this synthetic data, we utilized a context-sensitive algorithm that leveraged learning techniques to generate realistic data (Hasanzadeh and Fagerholm Citation2022).
This study is structured around two key steps. Firstly, we propose an analytical framework for 3D PPGIS, which incorporates a diverse range of geospatial metrics. The metrics are presented using a division of analytical methods based on macro and micro geographical scales. Secondly, we demonstrate the practical applicability of this framework by applying it to both the Aninkainen case and the synthetic data. With the help of this empirical analysis, we discussed the potential of 3D PPGIS and deliberated on potential future directions for its implementation.
1.3 Spatial analysis of 3D PPGIS data
Digital participatory mapping surveys have been used for over a decade to collect large amounts of spatial experiential data in numerous studies from around the world (Brown et al. Citation2015; Gottwald, Laatikainen, and Kyttä Citation2016; Laatikainen et al. Citation2017; Saadallah Citation2020; Brown and Kyttä Citation2018; Hasanzadeh et al. Citation2022). However, when it comes to 3D PPGIS data, we are in a new territory for systematic analysis and exploration. While 3D participatory mapping has been present in form of Participatory 3-Dimensional Mapping (P3DM) (Cadag and Gaillard Citation2012; Gaillard et al. Citation2013), 3D Digital Participatory Planning (3DDPP) (Afrooz et al. Citation2018; Bouzguenda, Fava, and Alalouch Citation2021), at a visionary level (Babelon Citation2017), or as analog participatory mapping activities using physical 3D models (Rambaldi and Callosa-Tarr Citation2001), to the best of our knowledge, it has not been implemented digitally to collect sizable participatory GIS data. Nevertheless, the extensive amount of research on conventional 2D PPGIS data and the wide range of analytical methods available (Fagerholm et al. Citation2021; Broberg, Salminen, and Kyttä Citation2013; Brown and Fagerholm Citation2015; Hasanzadeh, Broberg, and Kyttä Citation2017), coupled with previous applications of other types of 3D geospatial data, provides us with a good starting point for stepping into this new territory.
Analytical methods can be categorized in various ways depending on the context, purpose, and complexity. In a previous study by Fagerholm et al. (Citation2021), the analytical methods of PPGIS data were divided into three categories: explore, explain, and predict, reflecting different levels of analytical complexity corresponding to the desired depth of knowledge discovery. Another categorization of GIS analytical methods can be proposed based on the spatial scale of the analysis: macro and micro. Macro-scale analysis refers to the study of a larger area, whereas micro-scale analysis focuses on the scrutiny of a more particular and compact spatial unit (Bryant and Delamater Citation2019). In an urban context, an example of such a division is the distinction between analyzing a whole city versus specific blocks or buildings. PPGIS has been used on both scales, although distinguishing it from previous studies can be challenging. Previous studies using PPGIS have often addressed people’s spatial values, experiences, and behaviors, which are operationalized in daily life and are often not restricted to detailed local surroundings. Therefore, although one can argue that the map markings done by survey respondents can be very detailed depending on how close the respondent has decided to zoom in on the map, the general application has predominantly been to study larger areas (Brown, Weber, and de Bie Citation2015). Furthermore, considerations made during the design of the mapping component in a PPGIS survey can help facilitate the implementation of PPGIS on a microscale. A map-based survey specifically designed for data collection at a detailed spatial scale has been shown to be effective, particularly in planning practice (Kahila-Tani, Kyttä, and Geertman Citation2019). Nevertheless, this often requires special technical arrangements, which could be another reason why the adoption of PPGIS in detailed scale studies has been far less common. For example, to study people’s experiences within a city block or a building, we need to also have information on the actual plan of the building and data in 3D. This is where the 3D PPGIS can be helpful.
From a technical GIS perspective, PPGIS data shares similarities with other GIS data, comprising points, lines, and polygons, highlighting their comparable nature in terms of data structure and representation. Hence, a wide range of analytical methods previously used to study PPGIS data fall into the category of common geospatial practices (de Smith, Goodchild, and Longley Citation2021). Spatial pattern analysis focusing on density, kernel, and clustering of map features (Muñoz et al. Citation2019; Brown and Glanz Citation2018), proximity-related analysis such as distance and buffer analysis (Laatikainen et al. Citation2017; Brown and Hausner Citation2017), visual and overlay analysis (Kyttä et al. Citation2013), suitability analysis(Brown, Sanders, and Reed Citation2018), and association analysis (Kajosaari, Hasanzadeh, and Kyttä Citation2019; Laatikainen, Haybatollahi, and Kyttä Citation2018) are examples of spatial and statistical methods that are common for exploring and explaining PPGIS data (Fagerholm et al. Citation2021).
Another analytical direction, which is not unique to PPGIS but has occasionally been adopted for the study of place values, is the use of landscape metrics. Landscape metrics are used in landscape ecology to quantify various characteristics related to land cover, structure, function, and change (Leitão et al. Citation2012). This is conventionally done by quantifying the structure and distributional patterns of various landscape elements, such as plants, animals, terrain, and other physical characteristics (Brown and Reed Citation2012). Few PPGIS studies have attempted to adopt or develop metrics to analyze the social perceptions of landscapes through social landscape metrics that quantify human perceptions (Broberg, Kyttä, and Fagerholm Citation2013; Bryan et al. Citation2010; Raymond et al. Citation2016; Brown and Brabyn Citation2012; Brown, Weber, and de Bie Citation2014; Brown and Reed Citation2012).
Landscape metrics have been predominantly applied to 2D GIS data; however, interest in their application to 3D data, particularly laser scanning data (LiDAR) and point clouds, is also present. Blaschke, Tiede, and Heurich (Citation2004) used a set of 3D landscape metrics on LiDAR data to model and investigate the 3D structure of forests and their spatial patterns in a national park in Germany. In another study conducted in two urban areas in the UK, Chen et al. analyzed urban landscape patterns using both 2D and 3D landscape metrics (Citation2014). They concluded that the inclusion of height as the third dimension and hence the use of 3D metrics instead of 2D measures can result in a better understanding of the structures and distribution of landscape patterns, including buildings and trees (Chen, Xu, and Devereux Citation2014). In another study conducted in New Orleans, USA, researchers built upon familiar, traditional, patch-based 2D landscape metrics and developed a number of 3D landscape metrics based on LiDAR data (Kedron, Zhao, and Frazier Citation2019). While showcasing the usability of these metrics in capturing aspects of patterns that traditional and surface metrics cannot reveal, researchers argue that such metrics can be further context specific, and future research should seek more 3D metrics for wider ecological contexts (Kedron, Zhao, and Frazier Citation2019). The advantages stemming from the utilization of 3D metrics in comprehending diverse geospatial data prompt a compelling incentive to examine its prospective application within the domain of 3D PPGIS data. Nevertheless, the exploration of 3D GIS metrics in the context of PPGIS data has been limited thus far, primarily due to the prevailing availability of PPGIS data exclusively in 2D formats.
The computation of most 2D metrics relies on a few basic components, including the attributes (characteristics), area, perimeter, and adjacency (McGarigal and Ene Citation2012). This list can also be expanded to include vertical heterogeneity, height above ground, aspect, volume, etc., of 3D metric measurements (Shi, Yang, and Li Citation2010). Nevertheless, a rich and dense 3D dataset enables the use of more complex approaches. This can include various models of different complexities, clustering-based or machine-learning techniques, and various artificial-intelligence-powered models for pattern recognition (Fanos et al. Citation2020; Ma et al. Citation2018; Vartholomaios Citation2019). Despite the analytical and technical superiority of these advanced techniques, this is not a promising analytical path for 3D PPGIS data. This is because most PPGIS datasets collected to this point rely on data provided by hundreds of individuals (e.g. Brown and Kyttä Citation2014), and even in the best implementations, the spatial data quality and density are not comparable to laser scanning or GPS data (Hasanzadeh Citation2021). Therefore, analytical approaches, such as artificial-intelligence (AI) and machine-learning, which typically thrive on massive high-quality spatial datasets, are not feasible with PPGIS data. Additionally, PPGIS data are used in various multidisciplinary research fields and by planning practitioners from various backgrounds who may not find overly sophisticated approaches, either practical or necessary (Fagerholm et al. Citation2021). Thus, simple, practical, and informative metrics for 3D PPGIS data seem to be a more logical analytical approach for this emerging type of experiential data produced by people. Accordingly, in this study, we explore different measures inspired by previous research in GIS and PPGIS, as well as some fundamental geometric measurements, to identify metrics that can help us navigate through the newly emerging 3D PPGIS domain.
3. Methods and materials
3.1 3D PPGIS survey development and data collection
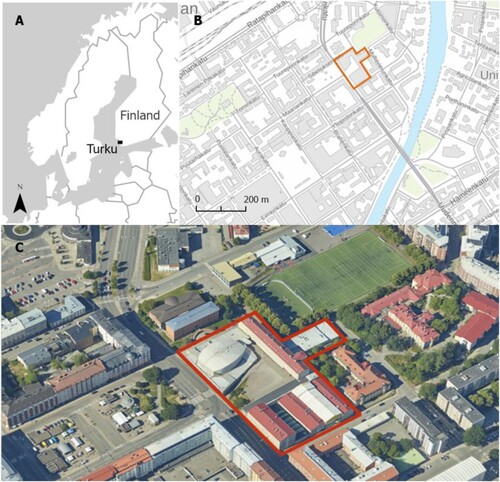
We conducted an online participatory mapping survey that included, instead of a conventional 2D map, a 3D mapping interface. The development and piloting of the 3D PPGIS survey was a public-private-academia collaboration between the companies Mapita, who provided the map-based survey tool, and Sova3D that developed a 3D city model integrating various open-source datasets, with the city of Turku and the University of Turku. The purpose of the survey was to gather preferences for the future development of a specific area (city block) in Turku called Aninkainen (). The case site was selected together with the city of Turku. The Aninkainen block has an ongoing spatial planning and renewal process, and the city of Turku needs to gather citizen perceptions and opinions through a participatory process. For the city of Turku, another aim of the survey was to increase citizens’ knowledge regarding the area and its culturally significant buildings. The oldest building originates to 1890s and has been a nursing home since that time. The block has also a concert hall and educational buildings from the 1950s and the functionalities of these buildings will change in the current urban renewal process. Also, urban densification through new buildings is planned. Both the city, the companies and the researchers were interested to test how a 3D visualization functions as a background for place-based data collection on people’s preferences in relation to a real urban planning process.
Figure 1. The study area Aninkainen city block in the city of Turku in southwestern Finland. The oldest building (northern part) is a nursing home and was built in the 1890s. The Concert Hall (white oval building) and educational buildings (at the eastern part) from the 1950s will receive new functionalities in the current urban renewal process. Also new buildings are planned.
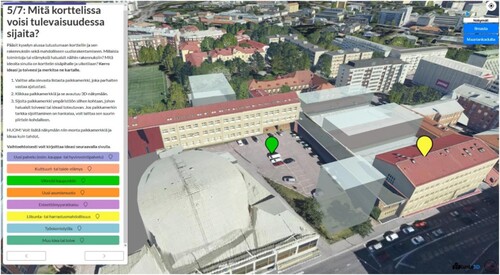
At the beginning of the survey, the respondents could familiarize themselves with the area in the 3D view. It was also possible to choose a guided fly over the area. The respondents could click on to see information regarding the different buildings and newly planned buildings to appear in the view. Subsequently, the respondents were asked to suggest how the area could be developed in the future by placing point markers on the area (). In this mapping task, the respondent could locate across the case area an unlimited number of point markers that were given on a pre-defined list of preferred use types including: new service, culture, or artistic experience, green to the city, new housing solution, accessibility solution, sport and leisure possibility, workspace, and other idea.
Figure 2. A screen capture from the 3D PPGIS survey. The 3D map view showed terrain, buildings, streets, trees and also the planned new buildings. The mapping task asked ‘What could be located in this area in the future?’ and the respondent could locate different development preferences as point markers in the 3D view.
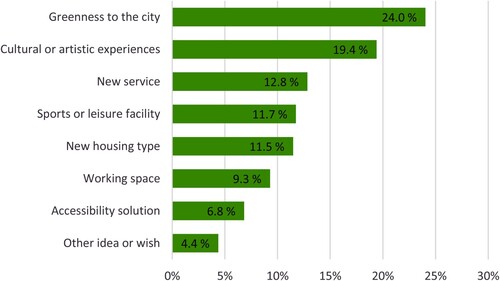
The survey was open in March-April 2021 for anyone (above 15 years old) to respond and advertise in various traditional and social media channels of the city of Turku. Out of the 385 respondents who started the survey, 35% (n = 135) mapped a total 368 development preferences (map markings outside the block discarded). These are mostly related to the green structures of the city and cultural or artistic events ().
Figure 3. Relative share of different development preferences mapped in the 3D PPGIS survey across the Aninkainen area.
3.2 Synthetic 3D PPGIS data generation
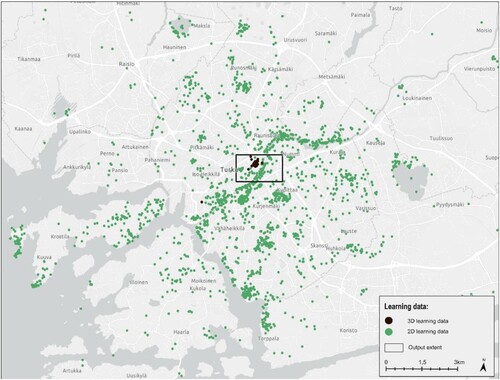
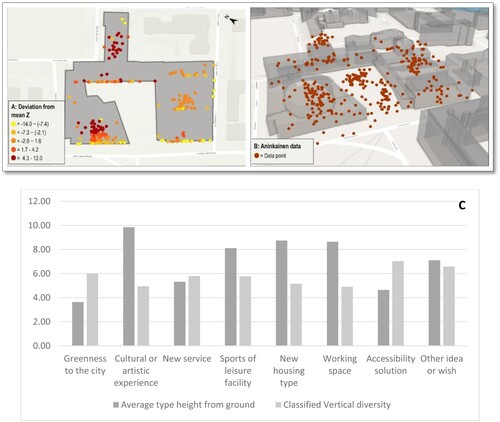
To expand the collected 3D PPGIS data to cover a wider spatial extent in the city center of Turku, we used synthetic 3D PPGIS data created using a learning-based algorithm adopted from a previous study (Hasanzadeh and Fagerholm Citation2022). This was due to the reason that the data was only available in one city block and hence exploring macro-scale analytical methods was not possible using the collected data alone. The algorithm can use multiple sets of data to learn the horizontal and vertical distributions of the learning data in relation to the physical environment, using a digital elevation model, population density, land use, and building data (Hasanzadeh and Fagerholm Citation2022). The learning data we used consisted of 368 3D points from the Aninkainen site, as well as 2270 2D points with only X and Y coordinates (). The two datasets were collected from the city of Turku, but on different occasions and as part of different projects. The sizes of the datasets in this case were arbitrary and based on the availability of the data.
Figure 4. Learning data from city of Turku and the output extent.
4. Results and analysis
4.1 Geospatial metrics for 3D PPGIS data
We propose several spatial analytical metrics that can be useful for analyzing 3D PPGIS data. The analytical methods proposed in this section are divided into two categories: macro- and micro-scale analysis. Macro-scale analytical approaches aim to provide an overall understanding of the data, whereas micro-scale methods are more suitable for diving into smaller areas of interest. Certain metrics can be applied to both the scales. In addition, the metrics can be categorized based on whether they address the distribution, diversity, or shape of 3D PPGIS data. provides a summary of the analytical framework and proposed metrics. They are described in more detail in the following sections. Examples of the outputs are shown in .
Figure 5. Exemplary outputs from some of the macro and micro scale metrics calculated with 3D PPGIS data.
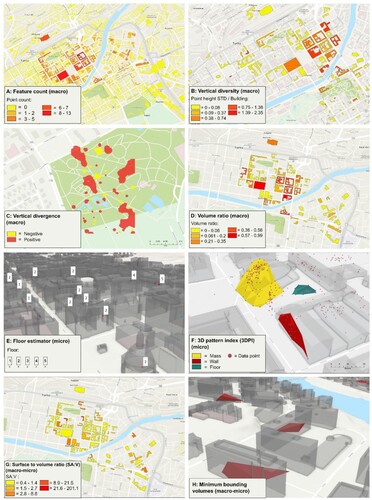
Table 1. Analytical framework: Macro and micro-scale analytical metrics for 3D PPGIS data.
4.1.1 Metrics for macro-scale analysis
Macro-scale analytical approaches aim to provide an overview of the 3D PPGIS data throughout a desired study area. These approaches were chosen to provide an overall understanding of the data as a whole and help identify potential areas of interest. This group of analytical approaches is applicable when data are collected from a large area such as a city or region. When a particular block or smaller area is the focus of data collection, this step can be skipped, and the analysis can begin at the micro-scale. Below, we discuss the macro-scale metrics in more detail.
Feature count. This simple measure counts the number of features as a whole, or filtered and queried based on criteria, per each 2D or 3D spatial unit of analysis. This can be implemented using a spatial join and various map overlay tools. The feature count provides an overall understanding of the data distribution and helps identify the units with the highest number of mapping points. If the units vary significantly in an area, normalization of the values using the unit area is recommended.
Vertical diversity. This is calculated as the standard deviation of the altitudes of the points overlapping a block divided by the total height of the building. The metric can show which buildings/blocks are potentially interesting to study in terms of vertical variations in markings. Alternatively, the standard deviation can be replaced with other descriptive and summary statistics of interest.
Vertical divergence. This can help identify areas with significant altitude differences between the PPGIS markings and terrain. These metrics can be applied by performing simple algebraic operations on raster files. First, a uniform surface is created based on 3D PPGIS data using an interpolation method such as inverse distance weighting (IDW). Next, the interpolation raster was subtracted from the elevation model to identify areas of significant positive and negative divergences. Alternatively, if the mapped phenomenon is not spatially correlated, a similar operation can be performed using the points or centroid of the clusters. The output can be complemented by reclassification and data visualization to improve the clarity of the results.
Volume ratio. This can provide a relative measure of the overall extent of markings in volume relative to the volume of the spatial unit or block. The volume of an object or group of features can be determined by applying a minimum concave volume to a given set of points. This divided by the volume of the block provides a size-adjusted measure suitable for macro-scale visualization and comparison. For a more robust analysis, alternative methods such as a 3D kernel cluster in voxel format can be used to delineate 3D volumes.
Classified volume ratio. This is similar to the ratio measure, in which the input features are classified by category or value. This metric helps to measure and compare the extent and distribution of features per category on a macro-level.
Classified vertical diversity (height-adjusted). This is the standard deviation of the height per type divided by the building height. This metric helps to identify marking types with the highest or lowest vertical diversities at the macro-scale.
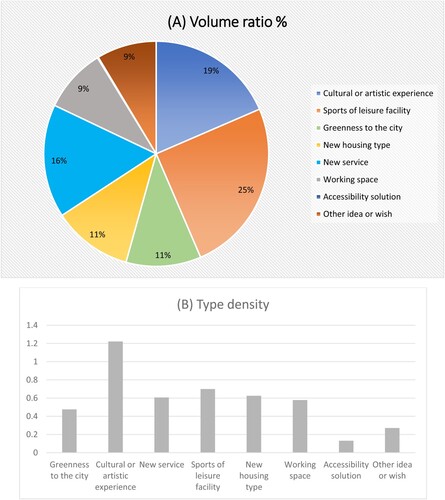
Type density. This measures the relative density of the PPGIS marking type per enumeration unit volume in 1000 m3 (Brown and Reed Citation2012)
where
is the number of markings in marking type i, and ml (megaliter) is the volume of the spatial unit in 1000 m3.
Volume richness density. Number of different object classes divided by the 3D spatial unit’s volume, for example, a building’s volume, in 1000 m3. The object class refers to spatial clusters of markings, 3D objects, or marking types.
4.1.2 Metrics for Micro scale analysis
Micro-scale analytical approaches aim to provide a detailed view of 3D PPGIS data in a small spatially limited area. For example, such methods can be used to study a specific park, shopping mall, or any other public space to evaluate people’s perceptions of the spaces in a 3D and more refined manner. Below, we describe the metrics of this category in more detail.
Classified vertical diversity. This is the standard deviation of the heights for each marking type. This metric is not adjusted by the height of the building and thus would be suitable for the comparison of marking types on a micro-scale and within the same enumeration unit or across multiple units with similar heights.
Average PPGIS marking type height from ground. This measures the relative average height of the PPGIS marking type from the ground. This can be measured by subtracting the Z-coordinate of the feature from the ground-level altitude.
Floor estimator. This simple index can be used to vertically locate the mapped PPGIS markings in a building. This can be useful prior to data classification and for a more in-depth study of the different floors in a building. The floor for point can be estimated as follows.
where
is an integer representing the estimated floor for feature i,
is the absolute altitude of feature i,
is the ground-level elevation at location i, and H is the average floor height of the building.
3D pattern index (3DPI). This index uses the ratio of the object’s squared height (H2) to the floor area (A) to help identify three types of patterns in the PPGIS marking clusters: surface, wall, and mass patterns. Mathematically, 3DPI can be formulated as follows:
Where H is the height of the object and A is the area of the bottom surface of the object. For a wider range of applications, A can be calculated as the area of the vertical shadow of an object.
A surface pattern indicates that a cluster of features forms a relatively thin, flat, and horizontal surface, as reflected by a low 3DPI value (close to zero). The wall pattern has a relatively flat vertical structure with a high 3DPI (>1). A mass pattern indicates that an object is relatively balanced in terms of dimensions, resulting in a 3DPI value of approximately 1.
The 3DPI results should be interpreted with caution, and the classification of output values should be made in accordance with real-life objects that are relevant to the study site. For example, a cube yields a 3DPI value of 1 whereas a perfect sphere has a value of 1.27. Furthermore, this metric will not be able to correctly identify oblique surfaces. However, this may not be an issue, as such surfaces are highly unlikely to manifest in the data, as such structures are rare in physical space.
Volume weighted average. Sum of all object volumes in a PPGIS marking type (e.g. minimum concave volume) with a quantitative attribute (e.g. a Likert scale) divided by the total volume of the object. The objects can be the product of a clustering analysis or pattern recognition process.
Volume overlap. A 3D overlap between the volumes of different marking clusters or types can provide a 3D overview of where different marking clusters or types coincide in a 3D space. The output can be evaluated visually or quantitatively.
4.1.3 Metrics for macro/micro analysis
Some metrics can be used at both the macro- and micro-scales. The metrics are described in the following section.
Shannon’s diversity volume index. This Shannon diversity index is calculated using the volume-based proportional abundance of each mapping category (Kedron, Zhao, and Frazier Citation2019). This measure can be calculated at different scales, making it suitable for analysis at both macro and micro-scales. This index can be calculated as follows:
where vi is the proportion of the volume of category i that points to the total volume of all categories.
Surface to volume ratio (SA:V). This is a well-known geometric measure that can capture the overall shape of a 3D object (Torabi Moghadam et al. Citation2018). It can be applied at various scales and on different sets of features (classified or unclassified), making it a suitable shape recognition measure for both macro- and micro-scale analyses.
Largest class by volume. This can be useful at both the macro and micro-scales to evaluate the geographically dominant marking type in a given area.
illustrates the outputs from some of the metrics described above for Aninkainen and synthetic data.
4.2 The Aninkainen case
In the Aninkainen case, 368 place markings provided by 135 respondents were considered for further analysis (). As Aninkainen is only one block, only micro-scale metrics were applicable to the data. Hence, synthetic data were not included in the analyses below. The standard deviation of the marking heights was 6.1 meters which is a considerable amount relative to the 13.1 meters average height of the building. The markings were allocated to eight categories () by the respondents, resulting in a volume richness density of 0.07 and a Shannon’s diversity volume index of 2.39, which is comparable to the diversity found in a dataset with approximately 11 equally populated classes (Brown, Weber, and de Bie Citation2015). There is some variation between the different marking types in terms of vertical diversity, calculated as the standard deviation of the Z-coordinate. On average, markings related to green areas and barriers were marked closest to the ground surface, whereas markings in the categories of culture, new housing, and work had the highest average elevation among marking classes.
Figure 6. Application of 3D PPGIS metrics in Aninkainen study area: (A) Vertical diversity expressed as the deviation of mean Z for points within the building, (B) An overview of markings within the block area, and (C) Average heights per marking type and classified vertical diversity
Within the building, a total volume of 295.7 m3 was marked by the participants across all eight marking types, accounting for approximately 2.7% of building’s total volume. The total volume was measured as the total volume of the minimum bounding volume of the points located within the building. A illustrates the volume of markings in each category. The categories were obtained straightly from the survey. Exercise and culture were the first and second largest marking types by volume, respectively, whereas the accessibility type had the smallest volume ratio. At the same time, the type density metric yielded the highest value for the culture category, followed by the exercise category, while it was the smallest for the barrier category (B).
Figure 7. Application of 3D PPGIS metrics in Aninkainen study area: (A) Volume ratio and (B) type density measurements.
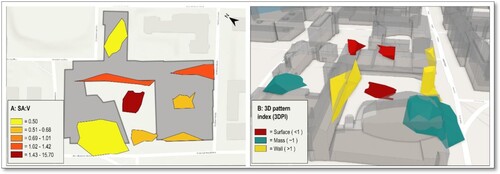
We identified eight distinct spatial clusters within the Aninkainen block using k-means clustering aided by visual analysis. We investigated the 3D shapes of these eight clusters using SA:V and 3DPI indices. As illustrated in A, the shapes of these clusters varied considerably according to the SA:V measure. Furthermore, the 3DPI metric could identify the three object classes of Wall, Surface, and Mass within these clusters (B). Three of the clusters yielded a 3DPI value of less than one, suggesting a relatively flat surface pattern. The two clusters yielded a 3DPI value close to 1, suggesting a mass object. Three clusters with values greater than 1 were identified as vertical objects.
Figure 8. Clusters and 3D objects in Aninkainen. A: Surface to volume ratio (SA:V)., B: 3D pattern index (3DPI).
6. Discussion
Cities are increasingly moving toward 3D geospatial data acquisition and usage (Jaalama et al. Citation2021; Julin et al. Citation2018). Interest in 3D geospatial data will inevitably reach the PPGIS field. This is not only the result of the hype around the use of these new technological possibilities in data collection through 3D geovisualizations but will also be derived by modern society, which is increasingly developing a visual culture (Billger, Thuvander, and Wästberg Citation2017; Herbert and Chen Citation2015). It is easy to envision future studies using emerging 3D tools and applications to create various implementations of 3D virtual landscapes that can act as PPGIS data-collection platforms with increased usability and efficiency. The question of whether these will result in more intuitive participatory processes, better citizen involvement in planning and design, or what the implications of 3D participatory platforms are on the quality of data will certainly require future scrutiny and investigation. Nonetheless, we foresee that with advancements in 3D mapping methods, we will see more examples of 3D PPGIS implementation, and therefore, an analytical preparation for making use of such data is imperative.
Motivated by this emerging need, in this study, we proposed a methodological framework comprising multiple geospatial metrics to analyze 3D PPGIS data. The metrics used in this study include adaptations of well-known 2D landscape metrics, as well as new metrics based on geometric measurements. We argue that the use of simple metrics for analyzing 3D PPGIS data is a good starting point for further development of PPGIS in its current form. This is because of several reasons. First, PPGIS data are collected from samples of typically tens or hundreds of individuals, and even with the most devoted participants, the density of output 3D PPGIS spatial data, even with the most devoted participants, may not be comparable to some conventional 3D GIS data. Additionally, the quality of user-generated data can be variable depending on the participants and survey implementation (Hasanzadeh Citation2021). Therefore, PPGIS data in its current form cannot benefit from sophisticated 3D data analysis methods such as those originating from machine-learning and AI studies. However, this does not mean that PPGIS data, whether in 2D or 3D, cannot be reliably analyzed using geospatial methods. In contrast, PPGIS data have been widely analyzed in various ways (see review by Fagerholm et al. Citation2021), including advanced modelling (Hasanzadeh, Laatikainen, and Kyttä Citation2018; Samuelsson et al. Citation2018; Sherrouse, Semmens, and Clement Citation2014). However, as previously discussed in the literature, certain analytical operations on PPGIS data may require special consideration of the geospatial characteristics of this type of data to produce reliable results (Hasanzadeh Citation2021; Brown, Weber, and de Bie Citation2015).
In addition to this methodological point, there is a more practical reason why the use of geospatial metrics is a promising starting point for the analysis of 3D PPGIS data. PPGIS is a highly multidisciplinary tool, and its application ranges from protected area management and ecosystem service assessment all the way to transportation engineering and urban planning, and it is realized not only by academics but also by practitioners. This means that, in practice, an analytical framework needs to be simple, practical, and informative to be widely noticed and adopted. The existence of an analytical gap among users of PPGIS data has been acknowledged by researchers. Consequently, a growing body of literature has been dedicated to the development of practical tools and methodologies for the analysis of PPGIS data (Burnett Citation2023; Hasanzadeh Citation2018; Van Berkel et al. Citation2023). Aligned with the aforementioned research trajectory that seeks to enhance the analytical accessibility of PPGIS, we have put forth the proposition of utilizing metrics as an initial framework for the analysis of 3D PPGIS data. The extensive utilization of metrics in various scientific disciplines serves as a valuable approach to facilitate a comprehensive and quantitatively informed comprehension of complex concepts. Accordingly, the application of metrics holds significant potential in aiding the emerging field of 3D PPGIS.
The data for this study were collected from a city block in Turku, Aninkainen. This was the first attempt to collect 3D PPGIS data; hence, the platform and tools used can be improved. Nevertheless, the markings provided by the participants showed considerable diversity in height across different categories. More specifically, the volumes of marking and vertical distributions were considerably different across multiple marking types, suggesting that participants employed 3D marking functionality to express their various experiences and ideas. Participants made markings in eight different categories, the total volume of which equaled approximately 3% of the total Aninkainen building volume. Exercise and culture were the first and second largest marking types by volume, respectively, whereas the barriers category had the smallest volume ratio. In the exercise and culture category, a high volume ratio suggests that participants did not provide detailed specifications regarding the placement of markings. Conversely, in the barrier category, markings were positioned relatively close to each other, resulting in a smaller overall bounding volume. At the same time, the type density metric yielded the highest value for the cultural and artistic category, followed by the sports and leisure categories, while it was smallest for the accessibility category. This indicates that culture and exercise were the most dominant marking types, both in terms of overall volume and relative count in the Aninkainen block. Using the 3D approach, we identified eight distinct clusters within the Aninkainen block. The SA:V and 3DPI metrics showed that the shapes of the clusters varied considerably. Three clusters were identified as relatively flat surfaces, two as mass objects, and three as vertical objects or walls.
6.1 Contributions, limitations, and future research
This study took a novel methodological step and introduced an analytical framework based on several geospatial metrics to study 3D PPGIS data. Considering that 3D PPGIS is still in its infancy, this methodological step is useful for the analysis of such data and encourages scholarly interest. The classification of methods into two groups of macro- and micro-scales based on the spatial scale of analysis makes this analytical approach more accessible for a wide range of use cases. These methods can be used to explore and explain the PPGIS data. In other words, using these metrics, data characteristics, such as spatial pattern and distribution, can be explored both independently and in relation to other geospatial data sources (Fagerholm et al. Citation2021).
The developed metrics were implemented on a relatively small 3D PPGIS dataset collected from the Aninkainen block in the city of Turku. The aim of this study was to demonstrate the usability of these metrics. However, the data had limitations and a thorough empirical examination was outside the scope of this study. A future study is required to address this limitation by conducting a wider empirical study using these 3D metrics and investigating their associations with other physical structural characteristics. Further, we envision future research to expand the current list of metrics and help test and improve existing ones. This is particularly important because the use of metrics can be context- and content-specific, and a wider range of metrics available for studying 3D PPGIS studies would help to grow its relevance for a wider range of applications.
The utilization of 3D PPGIS holds great promise for urban research. However, when considering a city like Turku, which predominantly features relatively low buildings, its potential might not be fully realized. This is a limitation of this study that needs to be addressed in future studies. To truly showcase the capabilities and relevance of this approach, it would be advantageous to employ better data and a more suitable context, for example a city such as Singapore, where high-rise buildings form a significant portion of the urban landscape. By conducting studies in such locations, researchers can delve deeper into how these metrics can contribute to the comprehension of experiential geodata collected in a 3D format. This will facilitate a more comprehensive understanding of urban dynamics and pave the way for future studies to better demonstrate how these metrics can contribute to interpreting and utilizing 3D PPGIS data.
Acknowledgements
K.H. and N.F. were funded by the Academy of Finland (grant number: 321555).
Disclosure statement
No potential conflict of interest was reported by the author(s).
Additional information
Funding
References
- Afrooz, Aida E, Russell Lowe, Simone Zarpelon Leao, and Chris Pettit. 2018. “3D and Virtual Reality for Supporting Redevelopment Assessment.” In Real Estate and GIS: The Application of Mapping Technologies. London: Routledge, 151.
- Almahmood, Mohammed, and Hans Skov-Petersen. 2020. “Public Space Public Life 2.0: Agent-Based Pedestrian Simulation as a Dynamic Visualisation of Social Life in Urban Spaces.” Journal of Digital Landscape Architecture 5: 305–317. https://doi.org/10.14627/537690032.
- Babelon, Ian. 2017. “Cyborgs in the City: Exploring Opportunities and Challenges for Web-Based PPGIS and 3D Cities.” In 2018. Digital Twins, edited by Batty Michael. London: SAGE Publications, Sage UK, 817–820. https://doi.org/10.1177/2399808318796416.
- Batty, Michael. 2018. Digital Twins, 817–820. London: SAGE Publications, Sage UK. https://doi.org/10.1177/2399808318796416.
- Biljecki, Filip, Hugo Ledoux, and Jantien Stoter. 2016. “An Improved LOD Specification for 3D Building Models.” Computers, Environment and Urban Systems 59: 25–37. https://doi.org/10.1016/J.COMPENVURBSYS.2016.04.005.
- Biljecki, Filip, Jantien Stoter, Hugo Ledoux, Sisi Zlatanova, and Arzu Çöltekin. 2015. “Applications of 3D City Models: State of the Art Review.” ISPRS International Journal of Geo-Information 4 (4): 2842–2889. https://doi.org/10.3390/IJGI4042842.
- Billger, Monica, Liane Thuvander, and Beata Stahre Wästberg. 2017. “In Search of Visualization Challenges: The Development and Implementation of Visualization Tools for Supporting Dialogue in Urban Planning Processes.” Environment and Planning B: Urban Analytics and City Science 44 (6): 1012–1035. https://doi.org/10.1177/0265813516657341.
- Blaschke, Thomas, Dirk Tiede, and Marco Heurich. 2004. “3D Landscape Metrics to Modelling Forest Structure and Diversity Based on Laser Scanning Data.” International Archives of the Photogrammetry, Remote Sensing and Spatial Information Sciences 36 (8/W2): 129–132.
- Bouzguenda, Islam, Nadia Fava, and Chaham Alalouch. 2021. “Would 3D Digital Participatory Planning Improve Social Sustainability in Smart Cities? An Empirical Evaluation Study in Less-Advantaged Areas.” Journal of Urban Technology 3: 41–71. https://doi.org/10.1080/10630732.2021.1900772.
- Broberg, Anna, Marketta Kyttä, and Nora Fagerholm. 2013. “Child-Friendly Urban Structures: Bullerby Revisited.” Journal of Environmental Psychology 35: 110–120. https://doi.org/10.1016/J.JENVP.2013.06.001.
- Broberg, Anna, Samuli Salminen, and Marketta Kyttä. 2013. “Physical Environmental Characteristics Promoting Independent and Active Transport to Children’s Meaningful Places.” Applied Geography, https://doi.org/10.1016/j.apgeog.2012.11.014.
- Brown, Greg, and Lars Brabyn. 2012. “An Analysis of the Relationships between Multiple Values and Physical Landscapes at a Regional Scale Using Public Participation GIS and Landscape Character Classification.” Landscape and Urban Planning 107 (3): 317–331. https://doi.org/10.1016/J.LANDURBPLAN.2012.06.007.
- Brown, Greg, and Nora Fagerholm. 2015. “Empirical PPGIS/PGIS Mapping of Ecosystem Services: A Review and Evaluation.” Ecosystem Services 13: 119–133. https://doi.org/10.1016/j.ecoser.2014.10.007.
- Brown, Greg, and Hunter Glanz. 2018. “Identifying Potential NIMBY and YIMBY Effects in General Land Use Planning and Zoning.” Applied Geography 99: 1–11. https://doi.org/10.1016/J.APGEOG.2018.07.026.
- Brown, Greg, and Vera Helene Hausner. 2017. “An Empirical Analysis of Cultural Ecosystem Values in Coastal Landscapes.” Ocean & Coastal Management 142: 49–60. https://doi.org/10.1016/J.OCECOAMAN.2017.03.019.
- Brown, Greg, Vera Helene Hausner, Małgorzata Grodzińska-Jurczak, Agata Pietrzyk-Kaszyńska, Agnieszka Olszańska, Barbara Peek, Marcin Rechciński, and Eiliv Lægreid. 2015b. “Cross-Cultural Values and Management Preferences in Protected Areas of Norway and Poland.” Journal for Nature Conservation 28: 89–104. https://doi.org/10.1016/j.jnc.2015.09.006.
- Brown, Greg, and Marketta Kyttä. 2014. “Key Issues and Research Priorities for Public Participation GIS (PPGIS): A Synthesis Based on Empirical Research.” Applied Geography 46: 126–136. https://doi.org/10.1016/j.apgeog.2013.11.004.
- Brown, Greg, and Marketta Kyttä. 2018. “Key Issues and Priorities in Participatory Mapping: Toward Integration or Increased Specialization?” Applied Geography, https://doi.org/10.1016/j.apgeog.2018.04.002.
- Brown, Gregory Gordon, and Pat Reed. 2012. “Social Landscape Metrics: Measures for Understanding Place Values from Public Participation Geographic Information Systems (PPGIS).” Landscape Research 37 (1): 73–90. https://doi.org/10.1080/01426397.2011.591487.
- Brown, Greg, Pat Reed, and Christopher M. Raymond. 2020. “Mapping Place Values: 10 Lessons from Two Decades of Public Participation GIS Empirical Research.” Applied Geography 116: 102156. https://doi.org/10.1016/J.APGEOG.2020.102156.
- Brown, Greg, Sara Sanders, and Pat Reed. 2018. “Using Public Participatory Mapping to Inform General Land Use Planning and Zoning.” Landscape and Urban Planning 177: 64–74. https://doi.org/10.1016/J.LANDURBPLAN.2018.04.011.
- Brown, Greg, Delene Weber, and Kelly de Bie. 2014. “Assessing the Value of Public Lands Using Public Participation GIS (PPGIS) and Social Landscape Metrics.” Applied Geography 53: 77–89. https://doi.org/10.1016/J.APGEOG.2014.06.006.
- Brown, Greg, Delene Weber, and Kelly de Bie. 2015. “Is PPGIS Good Enough? An Empirical Evaluation of the Quality of PPGIS Crowd-Sourced Spatial Data for Conservation Planning.” Land Use Policy 43: 228–238. https://doi.org/10.1016/J.LANDUSEPOL.2014.11.014.
- Bryan, Brett A., Christopher M. Raymond, Neville D. Crossman, and Darla Hatton Macdonald. 2010. “Targeting the Management of Ecosystem Services Based on Social Values: Where, What, and How?” Landscape and Urban Planning 97 (2): 111–122. https://doi.org/10.1016/J.LANDURBPLAN.2010.05.002.
- Bryant, James, and Paul L. Delamater. 2019. “Examination of Spatial Accessibility at Micro- and Macro-Levels Using the Enhanced Two-Step Floating Catchment Area (E2SFCA) Method.” Annals of GIS 3 (3): 219–229. https://doi.org/10.1080/19475683.2019.1641553.
- Burnett, Charla M., ed. 2023. Evaluating Participatory Mapping Software. Cham: Springer International Publishing. https://doi.org/10.1007/978-3-031-19594-5.
- Cadag, Jake Rom D., and J. C. Gaillard. 2012. “Integrating Knowledge and Actions in Disaster Risk Reduction: The Contribution of Participatory Mapping.” Area 44 (1): 100–109. https://doi.org/10.1111/J.1475-4762.2011.01065.X.
- Chen, Ziyue, Bing Xu, and Bernard Devereux. 2014. “Urban Landscape Pattern Analysis Based on 3D Landscape Models.” Applied Geography 55: 82–91. https://doi.org/10.1016/J.APGEOG.2014.09.006.
- Dembski, Fabian, Uwe Wössner, Mike Letzgus, Michael Ruddat, and Claudia Yamu. 2020. “Urban Digital Twins for Smart Cities and Citizens: The Case Study of Herrenberg, Germany.” Sustainability 12 (6): 2307. https://doi.org/10.3390/SU12062307.
- de Smith, Goodchild, and Longley. 2021. Geospatial Analysis 6th Edition. https://spatialanalysisonline.com/html/.
- Eilola, Salla, Kaisa Jaalama, Petri Kangassalo, Pilvi Nummi, Aija Staffans, and Nora Fagerholm. 2023. “3D Visualisations for Communicative Urban and Landscape Planning: What Systematic Mapping of Academic Literature Can Tell Us of Their Potential?” Landscape and Urban Planning 234: 104716. https://doi.org/10.1016/J.LANDURBPLAN.2023.104716.
- Fagerholm, Nora, Niina Käyhkö, Festo Ndumbaro, and Miza Khamis. 2012. “Community Stakeholders’; Knowledge in Landscape Assessments – Mapping Indicators for Landscape Services.” Ecological Indicators 18: 421–433. https://doi.org/10.1016/J.ECOLIND.2011.12.004.
- Fagerholm, Nora, Christopher M. Raymond, Anton Stahl Olafsson, Gregory Brown, Tiina Rinne, Kamyar Hasanzadeh, Anna Broberg, and Marketta Kyttä. 2021. “A Methodological Framework for Analysis of Participatory Mapping Data in Research, Planning, and Management.” International Journal of Geographical Information Science, https://doi.org/10.1080/13658816.2020.1869747.
- Fanos, Ali Mutar, Biswajeet Pradhan, Abdullah Alamri, and Chang Wook Lee. 2020. “Machine Learning-Based and 3D Kinematic Models for Rockfall Hazard Assessment Using LiDAR Data and GIS.” Remote Sensing 12 (11): 1755. https://doi.org/10.3390/RS12111755.
- Gaillard, Jean-Christophe, and Emmanuel A Maceda. 2009. “Participatory Three-Dimensional Mapping for Disaster Risk Reduction.” Participatory Learning and Action 60 (1): 109–118.
- Gaillard, J. C., Charlotte Monteil, Anais Perrillat-Collomb, Sukhdev Chaudhary, Mamta Chaudhary, Omkant Chaudhary, Franck Giazzi, and Jake Rom D. Cadag. 2013. “Participatory 3-Dimension Mapping: A Tool for Encouraging Multi-Caste Collaboration to Climate Change Adaptation and Disaster Risk Reduction.” Applied Geography 45: 158–166. https://doi.org/10.1016/J.APGEOG.2013.09.009.
- Gkeli, M., C. Potsiou, and C. Ioannidis. 2020. Design of a Crowdsourced 3D Cadastral Technical Solution. https://doi.org/10.5194/isprs-archives-XLIII-B4-2020-269-2020.
- Goodchild, Michael F. 2007. “Citizens as Sensors: The World of Volunteered Geography.” GeoJournal, https://doi.org/10.1007/s10708-007-9111-y.
- Gottwald, Sarah, Tiina E. Laatikainen, and Marketta Kyttä. 2016. “Exploring the Usability of PPGIS among Older Adults: Challenges and Opportunities.” International Journal of Geographical Information Science 30 (12): 2321–2338. https://doi.org/10.1080/13658816.2016.1170837.
- Hasanzadeh, Kamyar. 2018. “IASM: Individualized Activity Space Modeler.” SoftwareX 7: 138–142. https://doi.org/10.1016/j.softx.2018.04.005
- Hasanzadeh, Kamyar. 2021. “Use of Participatory Mapping Approaches for Activity Space Studies: A Brief Overview of Pros and Cons.” GeoJournal, 1–16. https://doi.org/10.1007/S10708-021-10489-0/TABLES/3.
- Hasanzadeh, Kamyar, Anna Broberg, and Marketta Kyttä. 2017. “Where Is My Neighborhood? A Dynamic Individual-Based Definition of Home Ranges and Implementation of Multiple Evaluation Criteria.” Applied Geography 84 (C): 1–10. https://doi.org/10.1016/j.apgeog.2017.04.006.
- Hasanzadeh, Kamyar, and Nora Fagerholm. 2022. “A Learning-Based Algorithm for Generation of Synthetic Participatory Mapping Data in 2D and 3D.” MethodsX 9: 101871. https://doi.org/10.1016/J.MEX.2022.101871.
- Hasanzadeh, Kamyar, Erika Ikeda, Suzanne Mavoa, and Melody Smith. 2022. “Children’s Physical Activity and Active Travel: A Cross-Sectional Study of Activity Spaces, Sociodemographic and Neighborhood Associations.” Children’s Geographies, https://doi.org/10.1080/14733285.2022.2039901.
- Hasanzadeh, Kamyar, Tiina E. Laatikainen, and Marketta Kyttä. 2018. “A Place-Based Model of Local Activity Spaces: Individual Place Exposure and Characteristics.” Journal of Geographical Systems 20 (3): 227. https://doi.org/10.1007/s10109-017-0264-z.
- Herbert, Grant, and Xuwei Chen. 2015. “A Comparison of Usefulness of 2D and 3D Representations of Urban Planning.” Cartography and Geographic Information Science 42 (1): 22–32. https://doi.org/10.1080/15230406.2014.987694.
- Hermansdorfer, Mariusz, Hans Skov-Petersen, Pia Fricker, Kane Borg, and Philip Belesky. 2020. “Bridging Tangible and Virtual Realities: Computational Procedures for Data-Informed Participatory Processes.” Journal of Digital Landscape Architecture 5: 354–365.
- Jaalama, Kaisa, Nora Fagerholm, Arttu Julin, Juho Pekka Virtanen, Mikko Maksimainen, and Hannu Hyyppä. 2021. “Sense of Presence and Sense of Place in Perceiving a 3D Geovisualization for Communication in Urban Planning – Differences Introduced by Prior Familiarity with the Place.” Landscape and Urban Planning 207: 103996. https://doi.org/10.1016/J.LANDURBPLAN.2020.103996.
- Jeansson, Eric, Erik Telldén, and Farmanbar Khashayar. 2012. “3D Online : Crowdsourcing for City Planning.” GIM International 26 (12): 28–31. https://urn.kb.se/resolve?urn=urn:nbn:se:bth-6943.
- Julin, Arttu, Kaisa Jaalama, Juho Pekka Virtanen, Matti Pouke, Johanna Ylipulli, Matti Vaaja, Juha hyyppä, and Hannu Hyppä. . . . . 2018. “Characterizing 3D City Modeling Projects: Towards a Harmonized Interoperable System.” ISPRS International Journal of Geo-Information 7 (2): 55. https://doi.org/10.3390/IJGI7020055.
- Kahila-Tani, Maarit, Marketta Kyttä, and Stan Geertman. 2019. “Does Mapping Improve Public Participation? Exploring the Pros and Cons of Using Public Participation GIS in Urban Planning Practices.” Landscape and Urban Planning, https://doi.org/10.1016/j.landurbplan.2019.02.019.
- Kajosaari, Anna, Kamyar Hasanzadeh, and Marketta Kyttä. 2019. “Residential Dissonance and Walking for Transport.” Journal of Transport Geography 74: 134–144. https://doi.org/10.1016/J.JTRANGEO.2018.11.012.
- Kedron, Peter, Yun Zhao, and Amy E. Frazier. 2019. “Three Dimensional (3D) Spatial Metrics for Objects.” Landscape Ecology 34 (9): 2123–2132. https://doi.org/10.1007/S10980-019-00861-4/FIGURES/4.
- Ketzler, Bernd, Vasilis Naserentin, Fabio Latino, Christopher Zangelidis, Liane Thuvander, and Anders Logg. 2020. “Digital Twins for Cities: A State of the Art Review.” Built Environment 46 (4): 547–573. https://doi.org/10.2148/BENV.46.4.547.
- Kyttä, Marketta, Anna Broberg, Mohammad Haybatollahi, Kaisa Schmidt-Thomé, and K. Schmidt-Thome. 2015. “Urban Happiness: Context-Sensitive Study of the Social Sustainability of Urban Settings.” Environment and Planning B: Planning and Design 43 (1): 34–57. https://doi.org/10.1177/0265813515600121.
- Kyttä, Marketta, Anna Broberg, Tuija Tzoulas, and Kristoffer Snabb. 2013. “Towards Contextually Sensitive Urban Densification: Location-Based SoftGIS Knowledge Revealing Perceived Residential Environmental Quality.” Landscape and Urban Planning 113: 30–46. https://doi.org/10.1016/j.landurbplan.2013.01.008.
- Laatikainen, Tiina E., Mohammad Haybatollahi, and Marketta Kyttä. 2018. “Environmental, Individual and Personal Goal Influences on Older Adults’ Walking in the Helsinki Metropolitan Area.” International Journal of Environmental Research and Public Health 16 (1): 58. https://doi.org/10.3390/IJERPH16010058.
- Laatikainen, Tiina E., Rami Piiroinen, Eeropekka Lehtinen, and Marketta Kyttä. 2017. “PPGIS Approach for Defining Multimodal Travel Thresholds: Accessibility of Popular Recreation Environments by the Water.” Applied Geography 79: 93–102. https://doi.org/10.1016/J.APGEOG.2016.12.006.
- Le Dé, Loïc, J. C. Gaillard, Anthony Gampell, Nickola Loodin, and Jake Cadag. 2020. Children’s Participation in Disaster Risk Reduction: What For?. https://doi.org/10.3316/INFORMIT.179659127498016.
- Leitão, André Botequilha, Joseph Miller, Jack Ahern, and Kevin McGarigal. 2012. Measuring Landscapes: A Planner’s Handbook. London: Island Press.
- Liang, Jianming, Jianhua Gong, Jin Liu, Yuling Zou, Jinming Zhang, Jun Sun, Shuisen Chen, et al. 2016. “Generating Orthorectified Multi-Perspective 2.5D Maps to Facilitate Web GIS-Based Visualization and Exploitation of Massive 3D City Models.” ISPRS International Journal of Geo-Information 5 (11): 212. https://doi.org/10.3390/IJGI5110212.
- Lieven, Claudius. 2017. “DIPAS – Towards an Integrated GIS-Based System for Civic Participation.” Procedia Computer Science 112: 2473–2485. https://doi.org/10.1016/J.PROCS.2017.08.182.
- Lovett, Andrew, Katy Appleton, Barty Warren-Kretzschmar, and Christina Von Haaren. 2015. “Using 3D Visualization Methods in Landscape Planning: An Evaluation of Options and Practical Issues.” Landscape and Urban Planning 142: 85–94. https://doi.org/10.1016/j.landurbplan.2015.02.021.
- Lütjens, Mona, Thomas P. Kersten, Boris Dorschel, and Felix Tschirschwitz. 2019. “Virtual Reality in Cartography: Immersive 3D Visualization of the Arctic Clyde Inlet (Canada) Using Digital Elevation Models and Bathymetric Data.” Multimodal Technologies and Interaction 3 (1): 9. https://doi.org/10.3390/MTI3010009.
- Ma, Wei, Hanjiang Xiong, Xuefeng Dai, Xianwei Zheng, and Yan Zhou. 2018. “An Indoor Scene Recognition-Based 3D Registration Mechanism for Real-Time AR-GIS Visualization in Mobile Applications.” ISPRS International Journal of Geo-Information 7 (3): 112. https://doi.org/10.3390/IJGI7030112.
- McGarigal, K, S A Cushman, and E. Ene. 2012. Spatial Pattern Analysis Program for Categorical and Continuous Maps. Computer Software Program Produced by the Authors at the University of Massachusetts, Amherst. FRAGSTATS v4. See http://wwwumassedu/Landeco/Research/Fragstats/Fragstatshtml.
- Mueller, Johannes, Hangxin Lu, Artem Chirkin, Bernhard Klein, and Gerhard Schmitt. 2018. “Citizen Design Science: A Strategy for Crowd-Creative Urban Design.” Cities 72: 181–188. https://doi.org/10.1016/J.CITIES.2017.08.018.
- Muñoz, Lorena, Vera Hausner, Greg Brown, Claire Runge, and Per Fauchald. 2019. “Identifying Spatial Overlap in the Values of Locals, Domestic- and International Tourists to Protected Areas.” Tourism Management 71: 259–271. https://doi.org/10.1016/J.TOURMAN.2018.07.015.
- Neuenschwander, N., U. Wissen Hayek, and A. Grêt-Regamey. 2014. “Integrating an Urban Green Space Typology into Procedural 3D Visualization for Collaborative Planning.” Computers, Environment and Urban Systems 48: 99–110. https://doi.org/10.1016/J.COMPENVURBSYS.2014.07.010.
- Petrasova, Anna, Brendan Harmon, Vaclav Petras, Payam Tabrizian, and Helena Mitasova. 2018. Tangible Modeling with Open Source GIS. New York City: Springer.
- Pettit, Christopher J, William Cartwright, and Michael Berry. 2006. “Geographical Visualization: A Participatory Planning Support Tool for Imagining Landscape Futures.” Applied GIS 2 (2).
- Plieninger, Tobias, Sebastian Dijks, Elisa Oteros-Rozas, and Claudia Bieling. 2013. “Assessing, Mapping, and Quantifying Cultural Ecosystem Services at Community Level.” Land Use Policy 33: 118–129. https://doi.org/10.1016/J.LANDUSEPOL.2012.12.013.
- Portman, M. E., A. Natapov, and D. Fisher-Gewirtzman. 2015. “To Go Where No Man Has Gone before: Virtual Reality in Architecture, Landscape Architecture and Environmental Planning.” Computers, Environment and Urban Systems 54: 376–384. https://doi.org/10.1016/J.COMPENVURBSYS.2015.05.001.
- Qi, Qinglin, Fei Tao, Tianliang Hu, Nabil Anwer, Ang Liu, Yongli Wei, Lihui Wang, and A. Y. C. Nee. 2021. “Enabling Technologies and Tools for Digital Twin.” Journal of Manufacturing Systems 58: 3–21. https://doi.org/10.1016/J.JMSY.2019.10.001.
- Rambaldi, Giacomo, and Jasmin Callosa-Tarr. 2001 Participatory Technology Development and Local Knowledge for Sustainable Land Use in Southeast Asia.Chiang Mai, Thailand 6-7 June 2001.
- Raymond, Christopher M., Sarah Gottwald, Jenni Kuoppa, and Marketta Kyttä. 2016. “Integrating Multiple Elements of Environmental Justice into Urban Blue Space Planning Using Public Participation Geographic Information Systems.” Landscape and Urban Planning 153: 198–208. https://doi.org/10.1016/J.LANDURBPLAN.2016.05.005.
- Saadallah, Dina M. 2020. “Utilizing Participatory Mapping and PPGIS to Examine the Activities of Local Communities.” Alexandria Engineering Journal 59 (1): 263–274. https://doi.org/10.1016/j.aej.2019.12.038.
- Samuelsson, Karl, Matteo Giusti, Garry D. Peterson, Ann Legeby, S. Anders Brandt, and Stephan Barthel. 2018. “Impact of Environment on People’s Everyday Experiences in Stockholm.” Landscape and Urban Planning 171: 7–17. https://doi.org/10.1016/J.LANDURBPLAN.2017.11.009.
- Seeger, Christopher J. 2008. “The Role of Facilitated Volunteered Geographic Information in the Landscape Planning and Site Design Process.” GeoJournal 72 (3-4): 199–213. https://doi.org/10.1007/S10708-008-9184-2/FIGURES/11.
- Seeger, Christopher J. 2017. “Mapping and Visualizing the Built Environment and User Interaction Through Facilitated-Volunteered Geographic Information (F-VGI).” The Virtual and the Real in Planning and Urban Design, 214–232. https://doi.org/10.4324/9781315270241-15.
- Sherrouse, Benson C., Darius J. Semmens, and Jessica M. Clement. 2014. “An Application of Social Values for Ecosystem Services (SolVES) to Three National Forests in Colorado and Wyoming.” Ecological Indicators 36: 68–79. https://doi.org/10.1016/J.ECOLIND.2013.07.008.
- Shi, Wenzhong, Bisheng Yang, and Qingquan Li. 2010. “An Object-Oriented Data Model for Complex Objects in Three-Dimensional Geographical Information Systems.” International Journal of Geographical Information Science 17 (5): 411–430. https://doi.org/10.1080/1365881031000086974.
- Snizek, Bernhard. 2003. “3dkroner. Dk–an Interactive, Web Based 4D Public Participation Tool.” CUMINCAD.
- Song, Youngjun, and Sunghyuck Hong. 2021. “Build a Secure Smart City by Using Blockchain and Digital Twin.” IJASC 3 (3): 9–13. https://doi.org/10.22662/IJASC.2021.3.3.009
- Tao, Fei, He Zhang, Ang Liu, and A. Y. C. Nee. 2019. “Digital Twin in Industry: State-of-the-Art.” IEEE Transactions on Industrial Informatics 15 (4): 2405–2415. https://doi.org/10.1109/TII.2018.2873186.
- Torabi Moghadam, Sara, Jacopo Toniolo, Guglielmina Mutani, and Patrizia Lombardi. 2018. “A GIS-Statistical Approach for Assessing Built Environment Energy Use at Urban Scale.” Sustainable Cities and Society 37: 70–84. https://doi.org/10.1016/J.SCS.2017.10.002.
- Van Berkel, Derek, Thomas Estabrook, Nathan Fox, Rahul Agrawal Bejarano, Lisa Maillard, Devin Gill, Erica Akemi Goto, and Maria Carmen Lemos. 2023. “PPGISr: An R Package for Public Participatory GIS.” SoftwareX 22: 101389. https://doi.org/10.1016/J.SOFTX.2023.101389.
- Vartholomaios, Aristotelis. 2019. “A Machine Learning Approach to Modelling Solar Irradiation of Urban and Terrain 3D Models.” Computers, Environment and Urban Systems 78: 101387. https://doi.org/10.1016/J.COMPENVURBSYS.2019.101387.
- Virtanen, Juho Pekka, Hannu Hyyppä, Ali Kämäräinen, Tommi Hollström, Mikko Vastaranta, and Juha Hyyppä. 2015. “Intelligent Open Data 3D Maps in a Collaborative Virtual World.” ISPRS International Journal of Geo-Information 4 (2): 837–857. https://doi.org/10.3390/IJGI4020837.