
 ?Mathematical formulae have been encoded as MathML and are displayed in this HTML version using MathJax in order to improve their display. Uncheck the box to turn MathJax off. This feature requires Javascript. Click on a formula to zoom.
ABSTRACT
Land surface all-wave net radiation (Rn) is crucial in determining Earth's climate by contributing to the surface radiation budget. This study evaluated seven satellite and three reanalysis long-term land surface Rn products under different spatial scales, spatial and temporal variations, and different conditions. The results showed that during 2000-2018, Global Land Surface Satellite Product (GLASS)-Moderate Resolution Imaging Spectroradiometer (MODIS) performed the best (RMSE=25.54 Wm-2, bias=−1.26 Wm-2), followed by ERA5 (the fifth-generation of European Centre for Medium-Range Weather Forecast Reanalysis) (RMSE=32.17 Wm-2, bias=−4.88 Wm-2) and GLASS-AVHRR (Advanced Very-High-Resolution Radiometer) (RMSE=33.10 Wm-2, bias=4.03 Wm-2). During 1983-2018, GLASS-AVHRR and ERA5 ranked top and performed similarly, with RMSE values of 31.70 and 33.08 Wm-2 and biases of −4.56 and 3.48 Wm-2, respectively. The averaged multi-annual mean Rn over the global land surface of satellite products was higher than that of reanalysis products by about 10∼30 Wm-2. These products differed remarkably in long-term trends variations, particularly pre-2000, but no significant trends were observed. Discrepancies were more frequent in satellite data, while reanalysis products showed smoother variations. Large discrepancies were found in regions with high latitudes, reflectance, and elevation which could be attributed to input radiative components, meteorological variables (e.g., cloud properties, aerosol optical thickness), and applicability of the algorithms used. While further research is needed for detailed insights.
1. Introduction
All-wave net surface radiation (Rn) at the land surface is the algebraic sum of the radiative energy budget of the underlying surface from the shortwave (0.3 to 3.0 μm) to the longwave (3.0 to 100.0 μm) portions of the electromagnetic spectrum (Bisht and Bras Citation2010; Jiang et al. Citation2016). Mathematically, Rn is the sum of the net shortwave and net longwave radiation and is expressed as:
(1)
(1) where
is the net shortwave radiation;
is the net longwave radiation;
and
are the downward and upward shortwave radiations; α is the broadband shortwave albedo;
and
are the downward and upward longwave radiations. In this study, the downward direction was defined as positive, and the unit for all radiative components was Wm−2.
Rn characterizes the land surface energy balance, and it also plays a critical role in ecological, agricultural, biogeochemical, and hydrological processes, such as evapotranspiration (ET) and some energy-consuming processes (i.e. photosynthesis) (Dickinson et al. Citation2006; Guo et al. Citation2020). Hence, Rn is an essential input for various ecological models, and weather forecast models (Al-Riahi, Al-Jumaily, and Kamies Citation2003; Liu and Yu Citation2006). High-quality long-term land surface Rn is of great significance for a variety of scientific studies and applications (Gao et al. Citation2013).
Due to unreliable data continuity, poor spatial representativeness, high maintenance costs, and uneven distribution of ground measurements, Rn is usually obtained from model reanalysis and satellite data in practical applications. Model reanalysis products are usually generated by assimilating various types of observations into an atmospheric model to obtain the best estimates of the state of the atmosphere and surface (Decker et al. Citation2012). Many reanalysis products provide radiative components to derive Rn, such as National Center for Atmospheric Research (NCAR) Reanalysis Ⅰ and its updated version namely NCAR II (Kanamitsu et al. Citation2002) from the National Center for Environmental Prediction (NCEP), Climate Forecast System Reanalysis (CFSR) (Decker et al. Citation2012; Saha et al. Citation2010); the forty-years Reanalysis (ERA40) (Uppala et al. Citation2005), the Interim Reanalysis (ERA-Interim) (Simmons et al. Citation2006), and their latest version ERA5 (Hersbach et al. Citation2019) from the European Centre for Medium-Range Weather Forecast (ECMWF), note that ERA5 has been extended to 1950s (Bell et al. Citation2021); Modern-Era Retrospective Analysis for Research and Applications version (MERRA) (Bosilovich et al. Citation2011) and its updated version MERRA2 (Gelaro et al. Citation2017a) from the National Aeronautics and Space Administration (NASA); the Japanese 25-year Reanalysis (JRA25) (Onogi et al. Citation2007) and its latest version the Japanese 55-year Reanalysis (JRA55) (Kobayashi et al. Citation2015b) from the Japan Meteorological Agency (JMA), and so on. Remotely sensed products are mainly generated using satellite observations, and can be roughly divided into two categories: generated from Radiative Transfer Model (RTM) and from parameterization or statistical models. Specifically, RTM-based products are produced from RTMs taking satellite observations and atmospheric and surface parameters derived from satellite data (e.g. cloud optical thickness) as inputs, such as the Clouds and Earths Radiant Energy System (CERES) Synoptic Radiation Fluxes and Clouds 1 degree series products (namely CERES_SYN1deg_Ed3A <CERES3A for short> and CERES_SYN1deg_Ed4A <CERES4A for short>) (Kato et al. Citation2015a), International Satellite Cloud Climatology Project (ISCCP) flux data (namely ISCCP-FD) (Zhang et al. Citation2004) and its high-resolution version ISCCP-FH (Young et al. Citation2018), and the Global Energy and Water Cycle Experiment Surface Radiation Budget (GEWEX-SRB) (Fu et al. Citation1997; Pinker and Laszlo Citation1992). In contrast, some remotely sensed products, most of which were released recently, can provide radiative components or Rn generated from parameterization models (i.e. TERRA (Verma et al. Citation2016)) or statistical models (i.e. FLUXCOM (Jung et al. Citation2019) and Global Land Surface Satellite <GLASS> (Jiang et al. Citation2016)). The statistical models were usually built by linking the radiative parameters with other ancillary information using various machine learning methods, and some of them can provide Rn as an integral based on the relationship between Rn and shortwave radiation (i.e. GLASS), or between Rn and top-of-atmosphere (TOA) satellite observations (Xu, Liang, and Jiang Citation2022). lists the characteristics of these global Rn product.
Table 1. The existing global Rn products (not all).
Although the performance of different Rn products was evaluated and claimed satisfactory by their producers, their validation procedures, including validation samples, study regions, or assessment periods, differed considerably. Hence, several studies conducted inter-comparisons of different Rn products for objective evaluations. For example, Decker et al. (Citation2012) evaluated Rn from five reanalysis products (NCAR, CFSR, ERA40, ERA-Interim, and MERRA) against the in situ measurements from 33 global flux tower sites. The results indicated that nearly all these products had high correlation with each other and their Rn variabilities were very similar to that of solar radiation. The MERRA and ERA-Interim products performed the best, with lower root-mean-square-error (RMSE) values ranging from 50 to 70 Wm−2, but all five products tended to overestimate Rn, mostly owing to their overestimation of shortwave radiation. With the release of the updated version of reanalysis products, such as NCAR II, MERRA2, and ERA5, Urraca et al. (Citation2018) concluded that the new version of reanalysis products provided better radiative estimates, with higher accuracy and finer spatio-temporal resolutions than their previous versions (NCAR, MERRA, and ERA-Interim). In addition, some studies have also conducted for remotely sensed Rn products evaluation. Jia et al. (Citation2016) validated surface Rn from CERES3A against comprehensive measurements collected from hundreds of stations at daily and monthly scales. And then, Jia et al. (Citation2018) conducted the comparison between CERES3A to three reanalysis Rn products, including JRA55, ERA-Interim, and MERRA2, also using these validation samples. The overall validation accuracy of CERES3A Rn was higher than that of other three reanalysis products, with the RMSEs of 33.56 and 25.57 Wm−2 at daily and monthly resolutions, respectively, which agreed with other studies showing that remotely sensed products usually perform better than reanalysis products in radiative estimates of the land (Liang et al. Citation2010) and sea surface (Liang et al. Citation2022). However, Jia et al. (Citation2018) also pointed out an inconsistency occurring in the long term variations in CERES3A Rn around 2007, possibly due to a different version of the model inputs. Recently, Seo et al. (Citation2020) evaluated Rn from ERA5 and NCAR and two remotely sensed radiative products, namely CERES_EBAF (Energy Balanced and Filled) and GEWEX-SRB, in the Arctic region based on ground measurements from six sites, and indicated that ERA5 Rn had the highest accuracy over this region, while the satellite-based products had the tendency to be overestimated at high latitudes. However, there are still only few Rn products evaluation studies, while most studies focused on evaluating the radiative components from different products, such as solar radiation (Damiani et al. Citation2018; Du et al. Citation2022; Jiang et al. Citation2020; Yu et al. Citation2019; Zhang et al. Citation2016), longwave radiation (Qin et al. Citation2020; Sianturi and Sartika Citation2020; Tang et al. Citation2021), and albedo (Corbea-Pérez et al. Citation2021; Liu et al. Citation2013; Qin et al. Citation2011). The major conclusions made by these studies all concluded that there are large discrepancies among various products in each radiative component, confirming that the reliability of the Rn obtained by combining the radiative components of different products needs to be carefully assessed. Moreover, even in the case of these Rn evaluation studies, there were limitations in terms of the comprehensiveness of the evaluated products and validation samples, the study region, the evaluation periods, and so on. Particularly, several Rn products listed in , especially the recently released ones, including the new version reanalysis (i.e. MERRA2, and JRA55) and remotely sensed products (e.g. CERES4A, ISCCP-FH, FLUXCOM, GLASS), have not been thoroughly assessed. Therefore, the performance of global Rn products needs to be validated and evaluated more rigorously and comprehensively, so that their advantages can help to improve the Rn estimation accuracy in the future and provide a valuable reference for product selection in practical applications.
The main aim of this study was to objectively evaluate the performance of ten Rn products, including seven remotely sensed products (GLASS-MODIS, GLASS-AVHRR, CERES4A, ISCCP-FH, GEWEX-SRB, FLUXCOM_RS, and FLUXCOM_RS + METEO <referred to as FLUXCOM_ALL>), and three reanalysis products (ERA5, MERRA2, and JRA55), in accuracies and spatio-temporal variations at daily time scales over the land surface using the most comprehensive Rn ground measurements collected from nearly 600 globally distributed sites during 1991–2018. The organization of this paper is as follows: Section 2 gives a detailed information about the Rn ground measurements for validation and the ten evaluated Rn products. Section 3 describes the methods. Section 4 provides the evaluation results and their analysis. Finally, major conclusions and discussions are provided in Section 5.
2. Data and pre-processing
2.1. In situ Rn measurements
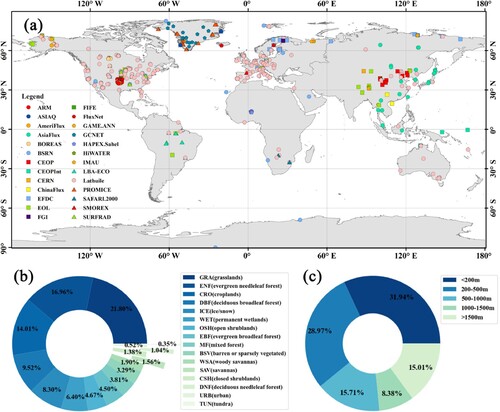
In this study, the ground radiative observations from 584 sites in 26 measurement networks around the world () from 1991 to 2018 were collected for products evaluation. The spatial distribution of the 584 sites was shown in (a). All sites were globally distributed, from the Antarctic to the Arctic, but were mostly located in the northern hemisphere and ranged from −9 m to 5038.6 m above the sea level in elevation. These sites were characterized by various land-cover types and ecosystem conditions within various climatic zones. The land covers of these sites were classified into sixteen types defined by the International Geosphere-Biosphere Programme (IGBP). The proportions of these sites for all sixteen land cover types and five elevation ranges were presented in (b,c), respectively. In addition, the homogeneousness of these sites has been examined by referring to Li et al. (Citation2021) by using the MODIS Land Cover Climate Modeling Grid (MCD12C1) product (https://lpdaac.usgs.gov/products/mcd12c1v006). Based on the results, within the 25 × 25 km2 regions surrounding each site, the land cover types for more than 79% of the sites were the same or similar. Hence, this demonstrates the spatial representativeness and the comprehensiveness of the measurements used for Rn products evaluation.
Figure 1. (a) Spatial distribution of 584 stations from 26 measuring networks. The proportions of all sites for (b) sixteen land-cover types defined by IGBP: and (c) five elevation ranges.
The detailed information about the 26 measuring networks/projects is listed in . Note that only the site at which both Rn and Rsi observations provided was applied in this study as Rsi was used for sky condition determination (see Equation (2)). As shown in , these radiative measurements were sampled at different frequencies at different sites and were recorded in various formats. Hence, at first, all quality-controlled Rn measurements or the ones obtained by adding radiative components measurements (see Equation (1)) were transferred into the local time at first, and then, the measurements whose sampling frequency was less than hourly were aggregated into hourly means with no missing data; thirdly, the hourly values were aggregated into daily means as long as at least 22 hourly values were avaliable in one day. Finally, all calculated daily values were checked manually again to remove any unreasonable values. The daily Rsi samples were obtained at the same way. Therefore, there were 513,486 daily Rn and Rsi samples during 1991–2018 were collected in this study.
Table 2. Details of the 26 observing networks.
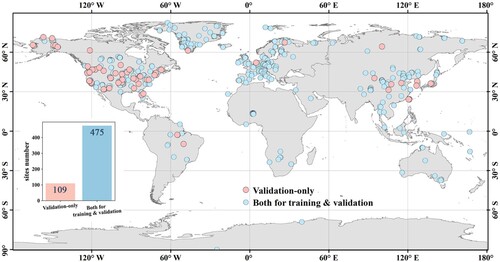
By considering the generation of some products, such as FLUXCOM and two GLASS Rn which were generated from the empirical models trained with numerous in-situ measurements, all validation samples were further carefully checked to guarantee their independence. However, for a more objective evaluation, the validation samples from the sites whose measurements have not been used for any Rn products production were screened and used for further validation. displays the spatial distribution of the sites providing only validation samples (pink circles). The figure shows that these sites are distributed unevenly, mainly in North America and Eastern China, and they account for less than 20% of all sites, providing 84,952 samples during 1991–2018. Therefore, two validation results, including the one using all validation samples and the other using only the spatially and temporally independent validation samples, were obtained in this study.
Figure 2. Spatial distribution of validation-only sites and sites for both training and validation.
In order to evaluate the Rn product under different sky conditions, the clearness index (CI) which is commonly used to represent atmospheric transmittance was used to classify the sky condition. CI is defined as the ratio of the daily to extraterrestrial radiation (
) as Equations (2) and (3) (Li et al. Citation2021; Liu and Jordan Citation1960) shows, and the daily
samples from sites were used for CI calculation.
(2)
(2) where
is calculated using Equation (3a) according to Irmak et al. (Citation2003):
(3a)
(3a)
(3b)
(3b)
(3c)
(3c)
(3d)
(3d)
(3e)
(3e) where
is the solar constant (0.0820 MJm−2 min−1),
is the inverse relative distance from the Earth to the Sun,
is the sunset hour angle (rad),
is the latitude (rad), δ is the solar declination (rad), and doy is the day of the year. According to a previous study (Iziomon, Mayer, and Matzarakis Citation2000), the sky was considered clear when CI was larger than 0.7, cloudy when CI was between 0.3 and 0.7, and overcast when CI was smaller than 0.3.
2.2. Rn datasets
Ten daily Rn products, including seven remotely sensed products, and three reanalysis products were evaluated in this study, and the characteristics of these products are listed in . For an objective evaluation, all Rn products should be pre-processed into the same format. Firstly, these products were converted into the local time as the in situ measurements. Then, they were aggregated into daily means. Products (e.g. GEWEX-SRB, ISCCP-FH, and JRA55) with temporal resolution larger than 1 h should be interpolated into an hourly scale at first. Finally, the daily Rn values of the ten products at each of the 584 validation sites were extracted according to the locations of these sites, one by one. Note that all products were extracted at their original spatial resolution for evaluation because the influence of their different spatial scales was small as long as the spatial scale was larger than 5 km according to Yan et al. (Citation2016); additionally, the spatial representativeness of the validation samples was satisfactory.
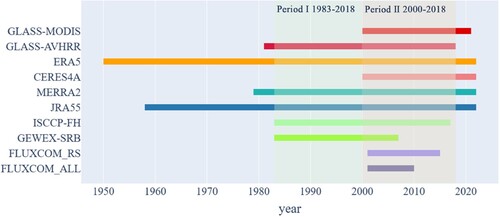
shows that the ten evaluated products were of different duration. After the year 2000, remotely sensed Rn products increased as more satellite observations became available. Hence, two periods during which the evaluated products were the most and typical were considered for evaluation: Period I for years 1983–2018 (No. of samples = 513,486) and Period Ⅱ for years 2000–2018 (No. of samples = 470,203). The validation samples for some products were fewer because of their shorter durations (i.e. ISCCP-FH, GEWEX-SRB, FLUXCOM_RS, and FLUXCOM_ALL) or coarser temporal resolution (>1 day) (i.e. FLUXCOM_RS and FLUXCOM_ALL). A brief description of each Rn product follows below.
Figure 3. Gantt plot of the available time ranges of each of the ten products. Period Ⅰ (1983–2018) and Period Ⅱ (2000–2018) were the two evaluation periods considered in this study.
2.2.1. Remotely sensed products
GLASS-AVHRR and GLASS-MODIS
GLASS daily Rn products at 0.05° include GLASS-MODIS from 2000 to 2020 and GLASS-AVHRR from 1982 to 2018, named after the satellites Moderate-resolution Imaging Spectro-radiometer (MODIS) and Advanced Very-High-Resolution Radiometer (AVHRR) used for production, which explains the difference in the two datasets’ durations. The production flowchart is shown in .
Figure 4. Workflow of GLASS-MODIS/GLASS-AVHRR daily Rn algorithm and production. Detailed information about the DSR-based Algorithm and LRD Algorithm are shown in the right panel.
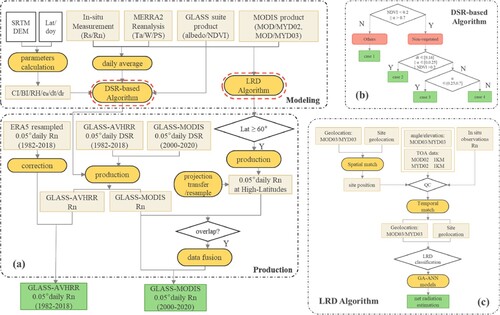
Based on the idea for generating the GLASS daytime Rn product (Jiang et al. Citation2016; Citation2018), GLASS-MODIS and GLASS-AVHRR daily Rn were both estimated using the Downward Shortwave Radiation (DSR)-based algorithm, which was built based on the relationship between daily Rn and as well as its variations under various conditions by combining other ancillary information (e.g. meteorological factors, Normalized Difference Vegetation Index <NDVI>, broadband albedo <α>, etc.). However, in comparison to the GLASS daytime Rn estimation, it was found that the variations in the relationship between daily Rn and
were also influenced by the length of daytime (dt) in hours besides α and NDVI, which were combined to characterize the land surface. Hence, dt was added to the daily Rn estimation in the DSR-based algorithm. As shown in (b), the DSR-based algorithm consists of four conditional models (case1-case4) classified by the combinations of α, NDVI, and dt. Specifically, the case2-case4 models are applied when the land surface is determined as non-vegetated (NDVI < 0.2 & α > 0.7), while the case1 model is used for vegetated surfaces. Particularly, the case4 model was built for snow-covered or high-latitude areas with high albedo. All the four models were constructed using the Multivariate Adaptive Regression Splines (MARS) method (Jiang et al. Citation2016). However, the DSR-based algorithm is effective as long as
is available or it dominates Rn (mainly at low-mid latitudes), while in the other cases (i.e. high-latitudes or short dt) the daily Rn in GLASS-MODIS and GLASS-AVHRR is generated in different ways. For GLASS-MODIS, the daily Rn was calculated by the LRD (length ratio of daytime) algorithm ((c)) developed by Chen et al. (Citation2020), which estimates daily Rn directly from MODIS TOA observations with a machine learning method. However, for GLASS-AVHRR, the daily Rn was filled with the linearly calibrated ERA5 daily Rn according to the one from GLASS-MODIS since the AVHRR TOA observations had too many missing data to apply the LRD algorithm. Moreover, for the overlapping regions where the daily Rn estimates derived from different algorithms or from ERA5, the final Rn values were weight-averaged with the weights determined by the in situ measurements within this region. The data used for GLASS-MODIS and GLASS-AVHRR daily Rn production are shown in (a), including in situ Rn/
measurements, GLASS high-level products including broadband albedo (Liu et al. Citation2013), NDVI (Xiao et al. Citation2017), and DSR (Zhang et al. Citation2019), meteorological factors (i.e. air temperature <Ta>, wind speed <W>, surface air pressure <PS>, etc.) from MERRA2, ERA5 daily Rn, and MODIS TOA bands (MOD/MYD02) and the corresponding geometry information (MOD/MYD03). Although the GLASS daily Rn products have not been evaluated thoroughly, the study conducted by Guo et al. (Citation2020) indicated that the estimated ET was more accurate when using daily Rn from GLASS-MODIS than when using MERRA2.
According to , GLASS-MODIS was only evaluated in period I, and GLASS-AVHRR was evaluated for both periods I and II.
(2) CERES4A
The CERES SYN1deg series radiative products (Wielicki et al. Citation1996) were generated based on a radiative transfer model, with the atmospheric and surface properties obtained from a variety of sources used as the model inputs, but constrained by both solar-reflected and Earth-emitted radiation from the TOA for all-sky and clear-sky conditions (Gupta et al. Citation2010; Kato et al. Citation2015b; Rutan et al. Citation2015). Recently, CERES4A, which is the updated version of CERES3A by altering input data such as aerosol optical thickness, atmospheric profiles, and cloud properties, was released. Compared to CERES3A, the temporal resolution of CERES4A increased to hourly. While the inconsistency issue was reported to be well addressed (Doelling et al. Citation2013; Citation2016), the performance of CERES4A daily Rn has not been assessed comprehensively. The daily Rn of CERES4A obtained by adding four radiative components during period II (2000–2018) was validated in this study. Note that CERES4A provides data only since March, 2000.
(3) ISCCP-FH
The ISCCP-FH climate data record (CDR) is the third-generation and high-resolution version of the ISCCP radiative flux profile product. Compared with its predecessor ISCCP-FD (Qin et al. Citation2011; Zhang Citation2004), ISCCP-FH contains a suite of level 2 and 3 products for monitoring the distribution and variation of cloud and surface properties to better understand the effects of clouds on climate and the radiation budget. The radiative estimates in ISCCP-FH were obtained every three hours on a 110-km equal-area (EQ) global grid covering the period July 1983 to June 2017 (Wang, Zhou, and Duan Citation2011; Young et al. Citation2018), and its Rn was also the sum of four radiative components. In this study, the daily Rn from ISCCP-FH were validated for periods 1983 to 2017 and from 2000 to 2017, which were shorter that period I and II.
| (4) | GEWEX-SRB | ||||
The GEWEX-SRB project is a major component of GEWEX radiation research, which aims to offer global surface and atmospheric shortwave and longwave fluxes at 1° every 3 h to analyze climate variations and decadal trends from July 1983 to 2007. The GEWEX-SRB shortwave products were generated from the algorithm developed by Pinker and Laszlo (Citation1992) based on radiative transfer theory, and the longwave radiation algorithm used the thermal radiative transfer code developed by Fu et al. (Citation1997). Therefore, the GEWEX-SRB Rn is also the sum of four radiative components and was validated between 1983 and 2007.
| (5) | FLUXCOM | ||||
The FLUXCOM initiative aims to improve understanding of the multiple sources and facets of uncertainties in empirical upscaling and, ultimately, to provide an integration of machine learning-based global flux products to the scientific community. It comprises two sets of products. FLUXCOM_RS was estimated exclusively from MODIS satellite data and does not require global climate forcing datasets as inputs. It also excludes potentially important information on meteorological conditions for biosphere-atmosphere fluxes and limits the temporal coverage to the MODIS era. For this reason, such datasets are themselves subject to uncertainty and are limited in spatial resolution. The second product is FLUCOM_RS + METEO (referred to FLUCOM_ALL), which was estimated from daily meteorological data and mean seasonal cycles of satellite data. It makes use of daily meteorological conditions and mean seasonal cycles of satellite-derived input drivers allowing for estimating fluxes beyond the satellite era. The FLUXCOM_RS gridded products at 0.0833° every 8 days were generated with nine machine learning methods, while FLUXCOM_ALL used three machine learning techniques with four global climate forcing data sets that yielded products with daily temporal and 0.5° spatial resolution (Jung et al. Citation2019). The Rn of FLUXCOM_RS and FLUXCOM_ALL is the sum of Rns and Rnl. In this study, FLUXCOM_RS and FLUXCOM_ALL daily Rn were validated during 2001–2010 and 2001–2015, respectively.
2.2.2. Reanalysis product
ERA5
ERA5 is the 5th generation climate reanalysis dataset from ECMWF. The most substantial upgrades compared to the ERA-Interim are the finer spatial grid from 79 to 31 km, the higher time resolution from 3-hourly to hourly, the higher number of vertical levels from 60 to 137, a new numerical weather product model (IFS <integrated forecasting system> Cycle 41r2) and the increase of the amount of data assimilated. The data assimilation model is also a 12-hourly 4DVar (Hersbach et al. Citation2020; Martens et al. Citation2020; Seo et al. Citation2020). In addition, this dataset contains records from 1979 to the present. The daily Rn in ERA5 is also the sum of the radiative components and it was evaluated in both period I and II.
| (2) | MERRA2 | ||||
MERRA2 is a new modern satellite era atmospheric reanalysis from the NASA GMAO (Global Modeling and Assimilation Office) (Reichle et al. Citation2017). It replaced its predecessor MERRA with an upgraded version of the Goddard Earth Observing System model accompanied by advanced assimilation technology, microwave observations, and GPS-Radio Occultation datasets (Zhang et al. Citation2020). It also has reduced some water cycle deviations and imbalances and improved in aerosol data assimilation, cryosphere, and stratosphere (Gelaro et al. Citation2017b). The MERRA2 longwave radiative processes are described in Chou (Citation1994) and the shortwave radiative processes are based on Suárez and Chou (Citation2013). MERRA2 directly provides hourly net radiation at 0.5° × 0.625° since 1979. The MERRA2 daily Rn was evaluated in both period I and II.
| (3) | JRA55 | ||||
JRA55 is the second global atmospheric reanalysis product and the first comprehensive reanalysis developed by JMA covering the period from 1958 to the present. JRA55 calculated longwave radiation fluxes based on the band emissivity method with diffusivity approximation and shortwave radiation fluxes by a two-stream method using the Delta-Eddington approximation (Joseph, Wiscombe, and Weinman Citation1976). It is considerably better than its predecessor JRA25, as it is based on a new data assimilation and prediction system (DA) that improves many deficiencies found in JRA25 and added several additional observational data sources. JRA55 provides four radiative components and Rn is their sum. This product was evaluated in both the period I and II.
3. Methods
In this study, the performance of daily Rn from ten products was first evaluated at site scale, followed by an inter-comparison of their spatio-temporal variations. For clarification, the evaluation products for the two periods are listed in . Hence, there are six products evaluated in period I and ten products in period II. Note that the lengths of some products were shorter than period I or II (see Section 2.2).
Table 3. The Rn products evaluated in the two periods.
3.1. Validation accuracy calculation
Validation accuracy was assessed with three common statistical measures: Bias, RMSE, and R2, which depict the sample’s overall bias, errors, and overall goodness of fit with a 1:1 line, respectively, calculated as:
(4)
(4)
(5)
(5)
(6)
(6) where
is the Rn estimate from product,
is the corresponding Rn measurement, and
is the number of samples.
3.2. Spatio-temporal variations calculation
In this study, the spatio-temporal variations were represented by the global mean and the long-term trend.
Annual mean Rn over global land surface
The annual mean Rn over the global land surface for each year in the evaluation period of each product was calculated. By considering the change in grid area at different latitudes, the latitude weighted average method was applied for each product according to Equation (7):
(7)
(7) where
is the averaged annual mean Rn over global land surface,
is the annual mean Rn of the kth pixel by averaging all available daily Rn values in this year for this pixel,
is the corresponding latitude of the kth pixel, and cos (
) is the weight of this pixel.
| (2) | Long-term trend | ||||
To avoid the inclusion of parametric deviations (Fensholt and Proud Citation2012; Liu et al. Citation2015), the widely used nonparametric Mann-Kendall (M–K) test (Kendall Citation1948) was employed for calculating the trend in this study. M–K is a rank-based method that identifies trend of a time-series dataset, which does not require the samples to conform to a certain type of normal distribution as the linear regression method, and is not easily affected by missing values and outliers (Gao et al. Citation2013). Its calculation is as follows:
(8a)
(8a)
(8b)
(8b)
(8c)
(8c)
(8d)
(8d) where
is the standardized normal statistic with a positive, negative and zero value indicating an increasing, decreasing, and no trend, respectively;
is the statistic of the test;
is a symbolic function;
and
are the
and
(
) values of the data, respectively;
is the number of samples. In this study,
≥ 1.96 indicates a significant increasing (decreasing) trend at the 95% significance level. No significant trend is present if
< 1.96.
4. Results and analysis
4.1. Evaluation of validation accuracy
The performance of the ten Rn products at site scales was evaluated in terms of the validation accuracy and its robustness under various conditions in terms of land cover, elevation, and sky condition.
4.1.1. Site scale validation accuracy
The ten daily Rn products were validated against the corresponding in situ measurements during Period Ⅰ and Period Ⅱ, respectively. presents the overall validation accuracy calculated by using all validation samples and the other one by using spatially and temporally independent validation samples (in italic font) for the two periods, respectively.
Table 4. The validation accuracy of each product in periods I and II.
From the overall validation accuracy calculated by using all validation samples, daily Rn of the remotely sensed products was generally superior to the reanalysis data products for both periods I and II, except in the case of ISCCP-FH, with the validated RMSE ranging from 25.54 to 37.42 Wm−2, the bias ranging from −1.26 to 7.84 Wm−2, and R2 ranging from 0.71 to 0.88. In terms of the worse accuracy of ISCCP-FH, it is assumed that might be caused by the significant errors in its longwave radiation (Qin et al. Citation2011). Most remotely sensed products slightly overestimate daily Rn which is consistent with the study of Bojanowski, Vrieling, and Skidmore (Citation2014), while the reanalysis products have the tendency to underestimate daily Rn with negative biases, except for MERRA2. Besides, there was little difference in the validation accuracies between Period Ⅰ and Period Ⅱ (i.e. GLASS-AVHRR, ISCCP-FH, ERA5, MERRA2, and JRA55), which indicated the comprehensiveness of the validation samples and the reliability of the validation results. Specifically, for Period Ⅱ, the validation accuracy in daily Rn of GLASS-MODIS was the best among all products evaluated with the validated RMSE of 25.54 Wm−2, bias of −1.26 Wm−2 and R2 of 0.88, followed by ERA5 (RMSE = 32.17 Wm−2, bias = −4.88 Wm−2, R2 = 0.80) and GLASS-AVHRR (RMSE = 33.10 Wm−2, bias = 4.03 Wm−2, R2 = 0.80) with their RMSE values close to each other and all less than 34 Wm−2. CERES4A, whose previous version CERES3A was acknowledged as one of the best Rn products (Jia et al. Citation2018), was at the fifth place (R2 = 0.76, RMSE = 35.49 Wm−2, bias = 3.50 Wm−2). Surprisingly, the daily ISCCP-FH Rn has poor accuracy with the largest RMSE value (48.44 Wm−2) and the largest bias (−17.21 Wm−2), and it even worse than that of MERRA2 (RMSE = 37.61 Wm−2, bias = 1.04 Wm−2) and JRA55 (RMSE = 42.29 Wm−2, bias = −8.24 Wm−2). In terms of the other two new remotely sensed products FLUXCOM_ALL and FLUXCOM_RS, their accuracy ranked ahead, with their validated RMSE values of 31.41 and 35.34 Wm−2 and biases of 2.62 and 0.11 Wm−2, which somewhat differed from the conclusions made by Jung et al. (Citation2019), which used a very different validation samples size. For inter-comparison, GLASS-MODIS and GLASS-AVHRR Rn were also validated using the same validation samples as FLUXCOM_ALL, and their accuracies were still better with the RMSEs of 23.48 and 28.78 Wm−2 and biases of 1.97 and 7.99 Wm−2, respectively. For Period Ⅰ, ERA5 daily Rn ranked the best and GLASS-AVHRR performed similarly, followed by GEWEX-SRB, MERRA2, and JRA55, while ISCCP-FH daily Rn was still ranked last with the largest RMSE (46.69 Wm−2) and bias (−16.13 Wm−2). Regarding the validation from sites providing validation samples only, the rank of the evaluation results remained nearly unchanged. Although the accuracy of most products decreased slightly, only a few reanalysis data products improved somewhat. In particular, the accuracy for ERA5 daily Rn improved for both period I and II by reducing the RMSEs by 1.56 and 1.44 Wm−2, respectively. Compared with the results in , we speculate that the reason is the lack of these validation samples at high latitudes, where ERA5 daily Rn performed relatively poorly. Overall, the two validation results indicated that the validation results were reliable. In summary, GLASS-MODIS and GLASS-AVHRR daily Rn were the best performing satellite products and GLASS-MODIS was even better; ERA5 performed the best among all three reanalysis products in accordance with Wang and Clow (Citation2021), and comparable to or even better than GLASS-AHVRR.
The spatial distribution of the overall validation accuracy at sites of the ten products for Period Ⅱ in terms of RMSE is shown in . The variations in the validated bias values with latitude (30° S to 90° N) for each product are also presented, and were calculated by averaging all available bias values at the sites per 10° latitude.
Figure 5. Spatial distribution of site overall validation accuracy (represented by RMSE) for period Ⅱ of the ten evaluated products: (a) GLASS-MODIS, (b) GLASS-AVHRR, (c) ERA5, (d) CERES4A, (e) MERRA2, (f) JRA55, (g) ISCCP-FH, (h) GEWEX-SRB, (i) FLUXCOM_RS and (j) FLUXCOM_ALL. The left graph in each plot shows the variations in the validated bias with latitude, which was calculated by averaging all bias values per 10° latitude from 30°S to 90°N. The number of sites shown in (i) FLUXCOM_RS and (j) FLUXCOM_ALL was less due to missing data.
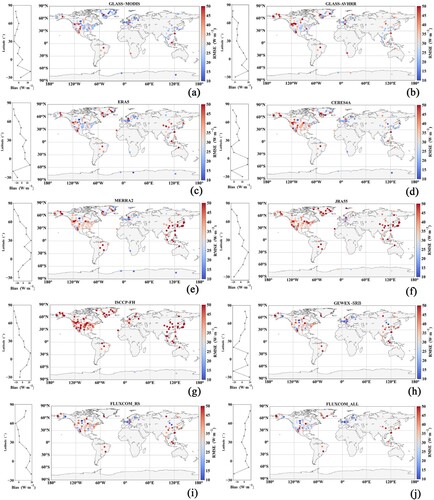
depicts that the ten daily Rn products showed worse accuracy in tropical areas (30°S to 30°N) than other regions. They almost all tended to be overestimated (positive bias) at low-middle latitudes and underestimated (negative bias) at high latitudes, except for the two FLUXCOM products ((i–j)), which estimated Rn simply at high latitudes (Jung et al. Citation2019). Comparatively, the sites with the lower RMSE values (<25 Wm−2, in blue) were the most for GLASS-MODIS ((a)) and mainly distributed in eastern Asia, eastern American, European, and even Greenland. The bias magnitudes were below 5 Wm−2 and decreased with the increases of latitude; whereas GLASS-AVHRR ((b)) showed a similar pattern as GLASS-MODIS but with more sites with larger RMSE values (>40 Wm−2, in warm red). The spatial pattern of ERA5 Rn ((c)) was much better than other reanalysis products and was similar to GLASS-AVHRR, but its accuracy was worse than that of GLASS-AVHRR at high latitudes, and this demonstrated the necessity to calibrate ERA5 Rn referring to GLASS-MODIS at high-latitudes for GLASS-AVHRR. For other products, the sites with RMSE values larger than 40 Wm−2 and magnitude of bias larger than 25 Wm−2 were the most in ISCCP-FH ((e)), the maximum magnitude of bias shown in GEWEX-SRB ((h)) at around 32° N due to the overestimation of albedo (Qin et al. Citation2011), two FLUXCOM products performed comparatively with the GLASS products, although FLUXCOM_ALL was a little better, whereas the results of any other products were consistent with previous results. However, the evaluation of these products in the Southern hemisphere was insufficient due to too few ground measurements available.
4.1.2. Product performance under various conditions
The accuracy robustness of each product under different conditions varies due to differences in the input data for different products, as well as the applicability of the algorithms used (Liang et al. Citation2010). Hence, the validation accuracy of the ten Rn products (in terms of RMSE) for each land-cover type, elevation range, clear-/cloudy-sky conditions, and month was further examined and compared for Period Ⅱ ((a–d)). The RMSE was used here because it is usually given more weight in accuracy evaluations, although a small RMSE does not always mean a small uncertainty when the average value of the parameter is small, such as in the case of Rn for land surfaces with high albedo (i.e. ICE) or at high-latitudes. Note that all validation samples were applied in this analysis.
Figure 6. Comparison of the validation accuracy in daily Rn (represented by RMSE) of the ten evaluated products under various conditions during Period Ⅱ: (a) land-cover types, (b) elevation ranges (200 m, 200–500 m, 500–1000 m, 1000–1500 m, and >1500 m), (c) sky conditions defined by CI (clear: CI > 0.7, mixed cloudy: 0.3≤CI≤0.7, overcast: CI < 0.3), and (d) twelve months. The accuracy for ICE and TUN of FLUXCOM_ALL and FLUXCOM_RS products was not available in (a) due to missing data (shown in oblique line).
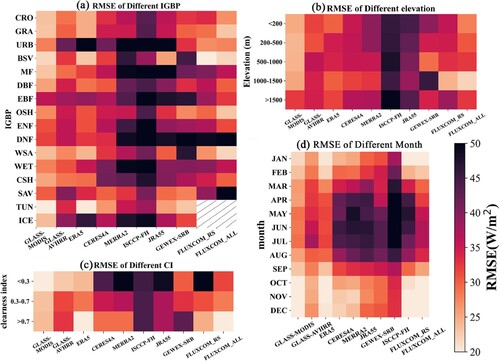
(a) shows the RMSE values of the ten products in daily Rn for sixteen land-cover types (see Section 2.1). The accuracy of all ten Rn products varied with different land-cover types, and almost all products estimated daily Rn poorly for forest (including ENF, EBF, DBF, and MF), WET, URB, and ICE, which was consistent with previous studies (Jiang et al. Citation2019). GLASS-MODIS and ERA5 yielded a similar and much better performance across all land-cover types than other products, with their RMSE mostly around 25 Wm−2, followed by GLASS-AVHRR. Regarding the two FLUXCOM products, their performance was relatively robust for most land-cover types especially FLUXCOM_ALL, but their results were not comprehensive enough as much fewer samples were available for ICE and TUN. However, the fewer available ground measurements for some land-cover types, such as DNF, URB, and WET, influence the validation results. The accuracy comparisons for five elevation ranges is shown in (b). Overall, all products performed worse at high elevation (>1500 m) regions. GLASS-MODIS Rn showed a robust and consistent performance for elevations less than 1500 m, with RMSE less than 25 Wm−2, followed by FLUXCOM_ALL. GLASS-AVHRR and ERA5 Rn were the third-best performing products, with the RMSE of GLASS-AVHRR Rn increasing with elevation and vice versa in the case of ERA5. Though the performance of CERES4A Rn was also robust for all evaluation ranges, its RMSE values were mostly around 35 Wm−2. (c) shows the performance of these products under clear-sky (CI > 0.7), mixed cloudy (0.3 ≤ CI ≤ 0.7), and overcast (CI < 0.3). GLASS-MODIS Rn was also the best either for clear or cloudy sky, and the uncertainty in Rn from GLASS-AVHRR increased as cloudiness decreased; in contrast, that of ERA5 was different with the largest uncertainty in Rn appearing in the presence of mixed cloudy sky. GEWEX-SRB and ISCCP-FH show poor accuracy in cloudy sky condition as they mistake clouds for snow (Qin et al. Citation2011). (d) shows obvious seasonal variations in the Rn estimates accuracy of all products, with the smaller RMSE values appearing in winter months and the larger ones appearing in summer months, which was possibly due to the uncertainty in radiative estimates, such as Rsi (Zhang et al. Citation2016), caused by the difference in cloud coverage and water vapor content of the two seasons Zhang et al. (Citation2020). Relatively, the GLASS and FLUXCOM series products, as well as ERA5 show a stable performance, with their RMSEs ranging from 15 to 30 Wm−2 across twelve months. And, the Rn from ISCCP-FH performed similarly but was still least accurate under the four conditions discussed, and this was consistent with the results described above.
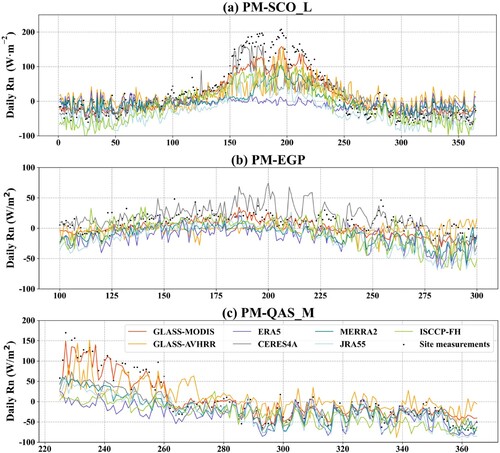
Moreover, we also found that GLASS-MODIS Rn performed particularly better when the land surface was covered by ice or snow, likely because of the application of the case4 model of the DSR-based algorithm and LRD algorithm, which were designed specifically for this case. For better illustration, the temporal variations in daily Rn from seven products and ground measurements at three sites with ICE land-cover (PM-SCO_L <72.223°N, 26.8182°W>, PM-EGP <75.62°N, 35.97°W>, and PM-QAS_M <61.09°N, 46.83°W>) during the randomly selected period were shown in . The Rn of GEWEX-SRB and two FLUXCOM series products were not included in because of unavailable data. shows that all products could capture the general variations in Rn at these ICE sites but most with the tendency to underestimate Rn. Relatively, the Rn values from GLASS-MODIS (red line) and GLASS-AVHRR (orange line) were the closest to the in situ measurements at the three sites, especially during summer days, but they varied differently due to different algorithms under ice cover land at high latitudes. CERES4A Rn was the only one to be overestimated often, such as Rn at PM-EGP ((b)), particularly during the doy of 170–220. Surprisingly, Rn estimates from ERA5 were heavily underestimated though its site scale validation accuracy was superiority, and the underestimation could be more than 100 Wm−2 ((a)), and the results were in accordance with the results in .
Figure 7. Temporal variations in daily Rn from GLASS-MODIS, GLASS-AVHRR, ISCCP-FH, CERES4A, ERA5, MERRA2, JRA55 and, ground measurements (black dots) at three validation sites of ICE land-cover: (a) PM-SCO_L, (b) PM-EGP, and (c)PM-QAS_M.
In general, GLASS-MODIS was the best performing among the ten evaluated products, and ERA5 Rn was the best one among the three new-generation reanalysis products and performed similarly to the GLASS series products. GLASS-MODIS and GLASS-AVHRR Rn products were satisfactory in validation accuracy and robustness. Besides, the uncertainty in Rn estimates was generally large for nearly all products in some regions, such as high-latitudes, tropical areas, high elevation (>1500 m), with a high albedo, even coastal regions, and so on. Hence, more efforts should be made in these regions to improve Rn estimation accuracy.
4.2. Inter-comparison of spatio-temporal variations in Rn
According to the results described above, Rn from six products, including three remotely sensed products (GLASS-MODIS, GLASS-AVHRR, and CERES4A) and three reanalysis products (ERA5, MERRA2, and JRA55), were further inter-compared in their spatio-temporal variations during Period II (2000–2018) based on their relative better validation accuracies, global continuous coverage, and long durations.
4.2.1. Spatial distribution in multi-annual mean Rn
At first, the global spatial distributions of the multi-annual mean Rn during Period II for each of the six products were calculated separately and presented in the diagonal of . Generally, the spatial patterns of the multi-annual mean Rn estimates from the six products were similar and reasonable, with their values decreasing from tropic to the polar area. The highest values in the multi-annual mean Rn (>100 Wm−2) appeared in central and southern Africa, northern south America, and southeast Asia regions, whereas the lowest values showed in Antarctica, Arctic (e.g. Greenland), and high elevation areas (e.g. Mount Qomolangma).
Figure 8. Comparison of the global spatial distributions of multi-annual mean Rn between six products (GLASS-MODIS, GLASS-AVHRR, CERES4A, ERA5, MERRA2, and JRA55) for Period Ⅱ.
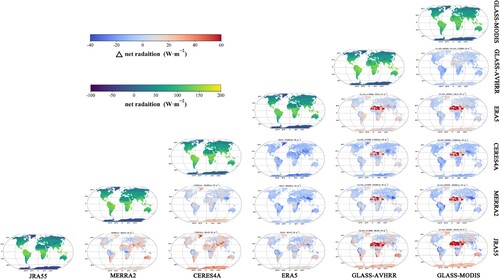
In , the maps below the diagonal present the difference in the multi-annual mean Rn between any two products; they were computed by using the multi-annual mean Rn of the product in every row on the diagonal minus each of the other ones. For example, the plot at the right bottom corner is the difference in multi-annual mean Rn by GLASS-MODIS minus JRA55. Overall, there is a large discrepancy between these six products. Specifically, the GLASS-MODIS multi-annual mean Rn is very close to that of GLASS-AVHRR with only a little bit larger over northern Africa (20°–30° N), where they are both extremely larger than that of all other products with the difference even larger than 40 Wm−2 (the first two columns from right to left), and this is possibly caused by the overestimated Rsi as pointed by Zhang et al. (Citation2019). For other products in multi-annual mean Rn, CERES4A was larger than others especially over the Qinghai-Tibet Plateau and Greenland which can be contributed to overestimation of downward longwave radiation according to Wang, Wang, and Xue (Citation2021), an evaluation in three poles regions, however, it suggested that CERES4A has the highest accuracy in Qinghai-Tibet Plateau; ERA5 was similar to the three remotely sensed products within a smaller magnitude; MERRA2 showed a large overestimation in the south and southwest China, possibly due to the uncertainty in cloud fraction estimates (Du et al. Citation2022). JRA55 was lower than others, especially in high latitude such as Antarctica region and Greenland, whereas it showed an overestimation over the tropics which may due to unrealistic trends in analyzed tropical cyclone strength (Kobayashi et al. Citation2015b).
4.2.2. Spatio-temporal trend in annual mean Rn
The averaged multi-annual mean Rn over the global land surface (), which is used in numerous studies, was calculated for each of the evaluated eight products (the two FLUXCOM products with missing data were excluded) and the results were list in .
Table 5. Multi-annual mean Rn over the global land surface () of eight products for Periods I and II.
Theoretically, the value should be robust regardless of the length of the calculated years as long as the time period is long enough. The calculated
values for the products in both period I and II were very similar (i.e. GLASS-AVHRR, GEWEX-SRB, ISCCP-FH, ERA5, MERRA2, and JRA55), hence, demonstrating the reliability of the results. At a global perspective, the
of nearly all remotely sensed products (except ISCCP-FH) was larger than that of three reanalysis products, with values ranging from ∼87 to ∼98 Wm−2 and from ∼68 to ∼86 Wm−2 for remotely sensed products and reanalysis products, respectively. The overall underestimation of ISCCP-FH daily Rn may due to the overestimation of surface albedo in caused by mistakenly treating the cloud as the snow when the cloud detection algorithms are conducted (Qin et al. Citation2011). Taking period II as an example,
of CERES4A was the largest, with 98.162 Wm−2, followed by that of GLASS-AVHRR and GLASS-MODIS with 95.527 and 92.729 Wm−2, respectively; their values were similar and larger than those of ERA5 by about 20 Wm−2, though their site validation accuracies were very close to each other. But the value of ERA5 (76.467 Wm−2) was close to the result from Wild et al. (Citation2014), which calculated
from CMIP5 simulations equal to 72.5 Wm−2. Hence, combining the validation results leads to speculate that the Rn generated from models was possibly an underestimation.
The climatology of the anomaly in for each of the eight products during their own periods from 1983 to 2018 was inter-compared in .
Figure 9. Inter-annual variations in the anomalies of the annual mean Rn averaged over the global land surface for eight products (as ) during their own duration periods from 1983 to 2018. The gray area indicates Period II (2000–2018).
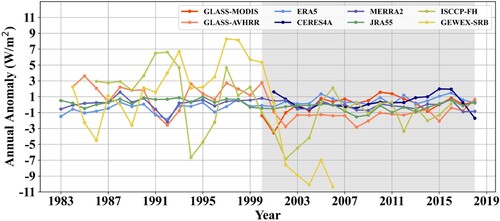
Overall, the discrepancy in the variations in the anomalies of of all eight products was large, especially before the year 2000. For all remotely sensed products, the fluctuations in the
from GEWEX-SRB and ISCCP-FH were dramatic and different from others, which can be attributed to errors in the cloud detection algorithm, which may reflect inadequacies in simulating the effects of volcanic aerosols on longwave radiative transfer or unrealistic cloud structure and stratospheric thermal layers, as they both used the cloud properties derived from the ISCCP-DX data (Qin et al. Citation2011). Hence, GEWEX-SRB and ISCCP-FH present homologous systematic errors that could explain the similarity in the fluctuating trends shown in (Zhang et al. Citation2015). Besides, Qin et al. (Citation2011) implied that neglecting the elevation effect influenced the shortwave of GEWEX-SRB as well. While the
of other three products (GLASS-MODIS, GLASS-AVHRR, and CERES4A) were relatively stable after 2000 but still in different trends, even in the case of the two GLASS products; whereas a sudden drop around 2000 was observed in
for all four remotely sensed products (GLASS-AVHRR, GLASS-MODIS, GEWEX-SRB, and ISCCP-FH) that contained data of this year, which was possibly caused by the satellite data inputs. A sudden jump in 2015 and a sharp decrease since 2017 were observed in
of CERES4A, which differed from other products and seemed unreasonable. The overestimated aerosol optical depths (AODs) in 2015 of CERES4A used for clear-sky irradiance computations (Fillmore et al. Citation2022), the significant errors in the upward longwave radiation estimates pointed out by Liu et al. (Citation2020), and a shift in the retrieved aerosol optical thickness over land caused by the switch from MODIS Collection 5 to Collection 6 for the inputs in 2017 might be the possible reasons. The three reanalysis products varied smoothly during the whole period but were still inconsistent in trend. A sudden drop in
during 1991–1993, which was influenced by the increase in aerosols caused by the eruption of Mount Pinatubo in 1991 (Frame and Stone Citation2013), was only captured by GLASS-AVHRR, ERA5, and MERRA2. What is striking is that JRA55 could not capture the significant plunge due to eruption, although Kobayashi et al. (Citation2015b) has stressed that numerous meteorological are not necessarily of sufficient quality for evaluation purposes, the reason behind this merits further investigation.
Moreover, the consistency in the spatio-temporal variations in annual mean Rn of each product calculated with the M–K method was also examined. By considering the reasonability and the number of products, four products during Period Ⅰ (GLASS-AVHRR, ERA5, MERRA2, and JRA55), and six products during Period II, including three remotely sensed products (GLASS-AVHRR, GLASS-MODIS, and CERES4A) and three reanalysis products (ERA5, MERRA2, and JRA55), were analyzed respectively. The spatial sizes of the six products were all processed to 5 km before the calculation of the trend. Then, the number of products with the same trends at each pixel was counted and represented by different colors and shown in .
Figure 10. Statistical results on the spatio-temporal trends in annual mean Rn from (a) four products (GLASS-AVHRR, ERA5, MERRA2, and JRA55) during Period Ⅰ, and (b) six products (GLASS-AVHRR, GLASS-MODIS, CERES4A, ERA5, MERRA2, and JRA55) during Period II. The triangle legend represents the consistence among these products in different trends: blue for significant increase (‘I’), green for significant decrease (‘D’), and pink for non-significant trend (‘N’); the tone of the three colors indicates the number of products having the same trend; the darker the color, the greater the number of products.
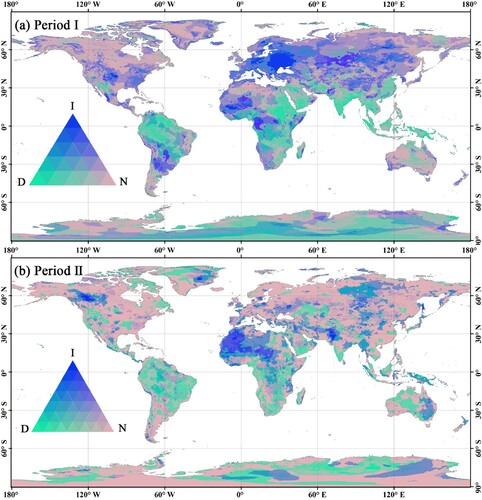
From the results in , the hotspots with a significant trend in annual mean Rn that agreed across most products were mainly located in tropical and high-latitude areas either in Period I or II. Specifically, for both period I and II, a significant increase in annual mean Rn in northwestern Africa, southeastern Australia, and some sparsely distributed regions at high latitudes, and a significant decrease over northern South America, particularly over the Amazon rainforest region, southern Africa, central oceanic, most Southeast Asia, and most areas of Antarctic close to the ocean were observed, which indicates that these hotspots which are very sensitive to radiation balance should be paid more attention and the consistence trend in Rn over these hotspots is in a high probability. As a matter of fact, some of these hotspots have also been discussed in previous studies. For instance, it was speculated that the reduced available Rn in the Amazon rainforest region was caused partly by the altered albedo and radiation partitioning due to deforestation (Oliveira et al. Citation2019; Restrepo-Coupe et al. Citation2013). However, more hotspots need to be further studied. In addition, the discrepancy in the global Rn trend between the two periods was more significant, especially at mid-high latitudes in the Northern hemisphere (e.g. east southern China, central Europe, south Asia, and so on), where the significant trend in Rn during period I seems mainly occurring before 2000. However, by considering the dramatically drop around 1991 in Rn, the large uncertainty in most products before 2000, an inconsistent variations in Rn around 2000, as well as only one remotely sensed product used in calculating the results in (a). Consequently, those regions with a different trend in Rn between the two periods should be analyzed more cautiously.
Therefore, the results point out that the discrepancy in the variations in Rn among different products is large, and all the questions raised above require further exploration and investigation in future research.
5. Conclusions and discussions
As one of the most critical parameters in land-surface interactions, the surface radiation budget Rn is usually obtained from various products in practical use due to many limitations in ground measurements. Hence, the evaluation of Rn products is of great significance. In this study, ten Rn products, including seven remotely sensed products (GLASS-MODIS, GLASS-AVHRR, CERES4A, ISCCP-FH, GEWEX-SRB, FLUXCOM_RS, and FLUXCOM_ALL), and three reanalysis products (ERA5, MERRA2, and JRA55), have been compared and evaluated against the most comprehensive in situ measurements collected from 584 globally distributed sites during 1991 to 2018. The analysis found that large discrepancies exist in various Rn products in terms of accuracy, robustness, consistency, and spatio-temporal variations. Several major conclusions have been drawn as follows:
The performances of these ten Rn products varied differently from each other, but nearly all products performed poor in some special regions, particularly at high-latitudes, within high elevation zones, and with high reflectance. Hence, more efforts should be made in these regions to improve the accuracy of Rn estimation. Moreover, better site scale validation precision does not mean reasonable spatio-temporal trends (e.g. ERA5, GLASS-MODIS, and GLASS-AVHRR).
Remotely sensed products match the in situ land surface Rn much better than those of most reanalysis products, and they are also better at characterizing the spatio-temporal variations in Rn. However, inconsistencies appear in most remotely sensed products, mainly due to their satellite data inputs, and some of them show the dramatic and unreasonable trends (i.e. ISCCP-FH and GEWEX-SRB). Regarding the reanalysis products, their Rn estimates tend to be underestimated, and their temporally variations are too smooth though their time series are usually longer and more consistent.
Among these products, GLASS-MODIS and GLASS-AVHRR Rn performed satisfactorily, showing strong potential to be widely used because of their finer spatial resolution, long time series, and global continuous coverage without missing. Particularly GLASS-MODIS, which had the best validation accuracy yielding R2 of 0.88, RMSE of 25.54 Wm−2, and bias of −1.26 Wm−2 during the Period II, and performed robust and almost the best under various conditions, especially for ICE land cover. However, the overestimation of the two GLASS products in North Africa should be paid sufficient attention in use.
The values of the averaged multi-annual mean Rn over global land surface from nearly all remotely sensed products (except ISCCP-FH) were larger than that of the reanalysis products by about 10–30 Wm−2. The top three values were from CERES4A (2000.03–2018), GLASS-AVHRR (1983–2018), and GLASS-MODIS (2000–2018) with 98.162, 95.527, and 92.729 Wm−2, respectively.
Globally, the climatology of Rn from different products differed from each other, especially before the year of 2000, and no significant trend was observed during the whole past decades. However, some hotspots with significant trends in Rn agreed with most products were found mainly in the Amazon rainforest region, western Africa, Greenland, and most of the Antarctic, which are sensitive to climate change and human activity.
Overall, large discrepancies exist in all evaluated Rn products in performance, temporal mean, and temporal variations, and each of the ten Rn products has its advantages and disadvantages. Hence, it is necessary to take the characteristics and performance into account to select the right Rn product in practical use. However, due to the few available ground measurements in the Southern Hemisphere and tropical areas, the evaluation results might be impacted. In summary, more efforts should be made to improve the evaluation work and to conduct the uncertainty analysis to help to generate a better Rn product, and further to explore the factors to drive the variations in Rn particularly in the hotspots.
Authorship contribution statement
Xiuwan Yin: Investigation, Methodology, Software, Data curation, Visualization, Writing-original draft. Bo Jiang: Conceptualization, Methodology, Resources, Investigation, Data curation, Writing-review & editing, Funding acquisition, Supervision. Shunlin Liang: Conceptualization, Investigation, Supervision. Shaopeng Li, Qian Wang: Data curation. Xiang Zhao, Jianglei Xu, Jiakun Han, Hui Liang, Xiaotong Zhang, Qiang Liu, Yunjun Yao, Kun Jia, and Xianhong Xie: Discussion, review.
Acknowledgements
We appreciate the radiation measurements provided by the FLUXNET community, in particular by the following networks (listed in Table 2): LaThuile, AsiaFlux, ARM, BSRN, SURFRAD, GAME.AAN, BOREAS, GC-Net, CEOP, CEOPInt, SMOSREX, CERN, FIFE, LBA-ECO, Hi-Water, HAPEX-Sahel, SAFARI.2000, AmeriFlux (U.S. Department of Energy, Biological and Environmental Research, Terrestrial Carbon Program (DE-FG02-04ER63917)), ASIAQ, ChinaFlux, EOL, EFDC, IMAU, PROMICE, and FGI. The authors acknowledge the financial support to the eddy covariance data harmonization provided by CarboEuropeIP, FAO-GTOS-TCO, Ileaps, Max Planck Institute for Biogeochemistry, National Science Foundation, University of Tuscia, Université Laval, Environment Canada and US Department of Energy and the datasets development and technical support from Berkeley Water Center, Lawrence Berkeley National Laboratory, Microsoft Researche Science, Oak Ridge National Laboratory, University of California-Berkeley and the University of Virginia. We thank the data support from ‘National Earth System Science Data Center, National Science and Technology Infrastructure of China’ (https://www.geodata.cn, accessed on 31 January 2023), and the valuable suggestions made by the reviewers to help improve the quality of this paper.
Disclosure statement
No potential conflict of interest was reported by the author(s).
Additional information
Funding
References
- Al-Riahi, M., K. Al-Jumaily, and I. Kamies. 2003. “Measurements of Net Radiation and Its Components in Semi-Arid Climate of Baghdad.” Energy Conversion and Management 44: 509–25.
- Allan, Richard P. 2004. “Simulation of the Earth’s Radiation Budget by the European Centre for Medium-Range Weather Forecasts 40-Year Reanalysis (ERA40).” Journal of Geophysical Research 109 (D18), https://doi.org/10.1029/2004jd004816.
- Augustine, J. A., J. J. DeLuisi, and C. N. Long. 2000. “SURFRAD – a National Surface Radiation Budget Network for Atmospheric Research.” Bulletin of the American Meteorological Society 81 (10): 2341. https://doi.org/10.1175/1520-0477(2000)081<2341:Sansrb>2.3.Co;2.
- Bell, Bill, Hans Hersbach, Adrian Simmons, Paul Berrisford, Per Dahlgren, András Horányi, Joaquín Muñoz-Sabater, et al. 2021. “The ERA5 Global Reanalysis: Preliminary Extension to 1950.” Quarterly Journal of the Royal Meteorological Society 147 (741): 4186–227. https://doi.org/10.1002/qj.4174.
- Bisht, Gautam, and Rafael L. Bras. 2010. “Estimation of net Radiation from the MODIS Data under All Sky Conditions: Southern Great Plains Case Study.” Remote Sensing of Environment 114 (7): 1522–34. https://doi.org/10.1016/j.rse.2010.02.007.
- Bojanowski, Jędrzej S., Anton Vrieling, and Andrew K. Skidmore. 2014. “A Comparison of Data Sources for Creating a Long-Term Time Series of Daily Gridded Solar Radiation for Europe.” Solar Energy 99: 152–71. https://doi.org/10.1016/j.solener.2013.11.007.
- Bosilovich, Michael G., Franklin R. Robertson, and Junye Chen. 2011. “Global Energy and Water Budgets in MERRA.” Journal of Climate 24 (22): 5721–39. https://doi.org/10.1175/2011jcli4175.1.
- Chen, Jiang, Tao He, Bo Jiang, and Shunlin Liang. 2020. “Estimation of All-Sky All-Wave Daily Net Radiation at High Latitudes from MODIS Data.” Remote Sensing of Environment 245, https://doi.org/10.1016/j.rse.2020.111842.
- Chou, Ming Dah. 1994. “An Efficient Thermal Infrared Radiation Parameterization for Use in General Circulation Models.” Environmental Science 3.
- Corbea-Pérez, Alejandro, Javier F. Calleja, Carmen Recondo, and Susana Fernández. 2021. “Evaluation of the MODIS (C6) Daily Albedo Products for Livingston Island, Antarctic.” Remote Sensing 13 (12), https://doi.org/10.3390/rs13122357.
- Damiani, Alessandro, Hitoshi Irie, Takashi Horio, Tamio Takamura, Pradeep Khatri, Hideaki Takenaka, Takashi Nagao, Takashi Y. Nakajima, and Raul R. Cordero. 2018. “Evaluation of Himawari-8 Surface Downwelling Solar Radiation by Ground-Based Measurements.” Atmospheric Measurement Techniques 11 (4): 2501–21. https://doi.org/10.5194/amt-11-2501-2018.
- Decker, Mark, Michael A. Brunke, Zhuo Wang, Koichi Sakaguchi, Xubin Zeng, and Michael G. Bosilovich. 2012. “Evaluation of the Reanalysis Products from GSFC, NCEP, and ECMWF Using Flux Tower Observations.” Journal of Climate 25 (6): 1916–44. https://doi.org/10.1175/jcli-d-11-00004.1.
- de Rosnay, P., J. C. Calvet, Y. Kerr, J. P. Wigneron, F. Lemaitre, M. J. Escorihuela, J. M. Sabater, et al. 2006. “SMOSREX: A Long Term Field Campaign Experiment for Soil Moisture and Land Surface Processes Remote Sensing.” Remote Sensing of Environment 102 (3–4): 377–89. https://doi.org/10.1016/j.rse.2006.02.021.
- Dickinson, R. E., K. W. Oleson, G. Bonan, F. Hoffman, P. Thornton, M. Vertenstein, Z. L. Yang, and X. B. Zeng. 2006. “The Community Land Model and Its Climate Statistics as a Component of the Community Climate System Model.” Journal of Climate 19 (11): 2302–24. https://doi.org/10.1175/Jcli3742.1.
- Doelling, D. R., N. G. Loeb, D. F. Keyes, M. L. Nordeen, D. Morstad, C. Nguyen, B. A. Wielicki, D. F. Young, and M. G. Sun. 2013. “Geostationary Enhanced Temporal Interpolation for CERES Flux Products.” Journal of Atmospheric and Oceanic Technology 30 (6): 1072–90. https://doi.org/10.1175/Jtech-D-12-00136.1.
- Doelling, D. R., M. Sun, L. T. Nguyen, M. L. Nordeen, C. O. Haney, D. F. Keyes, and P. E. Mlynczak. 2016. “Advances in Geostationary-Derived Longwave Fluxes for the CERES Synoptic (SYN1deg) Product.” Journal of Atmospheric and Oceanic Technology 33 (3): 503–21. https://doi.org/10.1175/Jtech-D-15-0147.1.
- Du, Yunfei, Hongrong Shi, Jinqiang Zhang, Xiangao Xia, Zhendong Yao, Disong Fu, Bo Hu, and Chunlin Huang. 2022. “Evaluation of MERRA-2 Hourly Surface Solar Radiation Across China.” Solar Energy 234: 103–10. https://doi.org/10.1016/j.solener.2022.01.066.
- Fensholt, Rasmus, and Simon R. Proud. 2012. “Evaluation of Earth Observation Based Global Long Term Vegetation Trends – Comparing GIMMS and MODIS Global NDVI Time Series.” Remote Sensing of Environment 119: 131–47. https://doi.org/10.1016/j.rse.2011.12.015.
- Fillmore, David W., David A. Rutan, Seiji Kato, Fred G. Rose, and Thomas E. Caldwell. 2022. “Evaluation of Aerosol Optical Depths and Clear-Sky Radiative Fluxes of the CERES Edition 4.1 SYN1deg Data Product.” Atmospheric Chemistry and Physics 22 (15): 10115–37. https://doi.org/10.5194/acp-22-10115-2022.
- Frame, David J., and Dáithí A. Stone. 2013. “Assessment of the First Consensus Prediction on Climate Change.” Nature Climate Change 3: 357–9. https://doi.org/10.1038/nclimate1763.
- Fu, Bojie, Shenggong Li, Xiubo Yu, Ping Yang, Guirui Yu, Renguo Feng, and Xuliang Zhuang. 2010. “Chinese Ecosystem Research Network: Progress and Perspectives.” Ecological Complexity 7 (2): 225–33. https://doi.org/10.1016/j.ecocom.2010.02.007.
- Fu, Qiang, K. N. Liou, M. C. Cribb, T. P. Charlock, and A. Grossman. 1997. “Multiple Scattering Parameterization in Thermal Infrared Radiative Transfer.” Journal of the Atmospheric Sciences 54 (24): 2799–812. https://doi.org/10.1175/1520-0469(1997)054<2799:mspiti>2.0.co;2.
- Gao, Yangzi, Honglin He, Li Zhang, Qianqian Lu, Guirui Yu, and Zulu Zhang. 2013. “Spatio-Temporal Variation Characteristics of Surface Net Radiation in China Over the Past 50 Years.” Journal of Geo-Information Science 15 (1): 1–10. https://doi.org/10.3724/SP.J.1047.2013.00001.
- Gelaro, R., W. McCarty, M. J. Suarez, R. Todling, A. Molod, L. Takacs, C. A. Randles, et al. 2017a. “The Modern-Era Retrospective Analysis for Research and Applications, Version 2 (MERRA-2).” Journal of Climate 30 (14): 5419–54. https://doi.org/10.1175/jcli-d-16-0758.1.
- Gelaro, R., W. McCarty, M. J. Suarez, R. Todling, A. Molod, L. Takacs, C. Randles, et al. 2017b. “The Modern-Era Retrospective Analysis for Research and Applications, Version 2 (MERRA-2).” Journal of Climate 30 (13): 5419–54. https://doi.org/10.1175/JCLI-D-16-0758.1.
- Guo, Xiaozheng, Yunjun Yao, Yuhu Zhang, Yi Lin, Bo Jiang, Kun Jia, Xiaotong Zhang, et al. 2020. “Discrepancies in the Simulated Global Terrestrial Latent Heat Flux from GLASS and MERRA-2 Surface Net Radiation Products.” Remote Sensing 12 (17), https://doi.org/10.3390/rs12172763.
- Gupta, Shashi K., David P. Kratz, Paul W. Stackhouse, Anne C. Wilber, Taiping Zhang, and Victor E. Sothcott. 2010. “Improvement of Surface Longwave Flux Algorithms Used in CERES Processing.” Journal of Applied Meteorology and Climatology 49 (7): 1579–89. https://doi.org/10.1175/2010jamc2463.1.
- Hersbach, Hans, Bill Bell, Paul Berrisford, Shoji Hirahara, András Horányi, Joaquín Muñoz-Sabater, Julien Nicolas, et al. 2020. “The ERA5 Global Reanalysis.” Quarterly Journal of the Royal Meteorological Society 146 (730): 1999–2049. https://doi.org/10.1002/qj.3803.
- Hersbach, H., B. Bell, P. Berrisford, A. Horányi, J Muñoz Sabater, J. Nicolas, R. Radu, D. Schepers, A. Simmons, and C. Soci. 2019. “Global Reanalysis: Goodbye ERA-Interim, Hello ERA5.” ECMWF Newsl 159: 17–24.
- Irmak, Suat, Ayse Irmak, James W. Jones, Terry Howell, Jennifer M. Jacobs, Richard G. Allen, and Gerrit Hoogenboom. 2003. “Predicting Daily Net Radiation Using Minimum Climatological Data.” 129: 256–69.
- Iziomon, M. G., H. Mayer, and A. Matzarakis. 2000. “A Empirical Models for Estimating net Radiative Flux: A Case Study for Three mid-Latitude Sites with Orographic Variability.” Astrophys. Space Sci 273: 313–30.
- Jia, Aolin, Bo Jiang, Shunlin Liang, Xiaotong Zhang, and Han Ma. 2016. “Validation and Spatiotemporal Analysis of CERES Surface Net Radiation Product.” Remote Sensing 8 (2), https://doi.org/10.3390/rs8020090.
- Jia, Aolin, Shunlin Liang, Bo Jiang, Xiaotong Zhang, and Guoxin Wang. 2018. “Comprehensive Assessment of Global Surface Net Radiation Products and Uncertainty Analysis.” Journal of Geophysical Research: Atmospheres 123 (4): 1970–89. https://doi.org/10.1002/2017jd027903.
- Jiang, B., S. Liang, A. Jia, J. Xu, X. Zhang, Z. Xiao, X. Zhao, K. Jia, and Y. Yao. 2018. “Validation of the Surface Daytime Net Radiation Product from Version 4.0 GLASS Product Suite.” IEEE Geoscience and Remote Sensing Letters 16 (4): 509–13. https://doi.org/10.1109/lgrs.2018.2877625.
- Jiang, Bo, Shunlin Liang, Aolin Jia, Jianglei Xu, Xiaotong Zhang, Zhiqiang Xiao, Xiang Zhao, Kun Jia, and Yunjun Yao. 2019. “Validation of the Surface Daytime Net Radiation Product from Version 4.0 GLASS Product Suite.” IEEE Geoscience and Remote Sensing Letters 16 (4): 509–13. https://doi.org/10.1109/lgrs.2018.2877625.
- Jiang, Bo, Shunlin Liang, Han Ma, Xiaotong Zhang, Zhiqiang Xiao, Xiang Zhao, Kun Jia, Yunjun Yao, and Aolin Jia. 2016. “GLASS Daytime All-Wave Net Radiation Product: Algorithm Development and Preliminary Validation.” Remote Sensing 8 (3), https://doi.org/10.3390/rs8030222.
- Jiang, Hou, Yaping Yang, Hongzhi Wang, Yongqing Bai, and Yan Bai. 2020. “Surface Diffuse Solar Radiation Determined by Reanalysis and Satellite Over East Asia: Evaluation and Comparison.” Remote Sensing 12 (9), https://doi.org/10.3390/rs12091387.
- Joseph, J. H., W. Wiscombe, and J. A. Weinman. 1976. “JRA55-The Delta-Eddington Approximation for Radiative Flux Transfer.” Journal of the Atmospheric Sciences 33 (12): 2452–9.
- Jung, M., S. Koirala, U. Weber, K. Ichii, F. Gans, G. Camps-Valls, D. Papale, C. Schwalm, G. Tramontana, and M. Reichstein. 2019. “The FLUXCOM Ensemble of Global Land-Atmosphere Energy Fluxes.” Scientific Data 6 (1): 74. https://doi.org/10.1038/s41597-019-0076-8.
- Kanamitsu, M., W. Ebisuzaki, J. Woollen, S. K. Yang, J. J. Hnilo, M. Fiorino, and G. L. Potter. 2002. “Ncep-doe amip-ii reanalysis (r-2).” Bulletin of the American Meteorological Society 83 (11): 1631–44.
- Kato, S., N. G. Loeb, D. A. Rutan, and F. G. Rose. 2015a. “Clouds and the Earth’s Radiant Energy System (CERES) Data Products for Climate Research.” Journal of the Meteorological Society of Japan 93 (6): 597–612. https://doi.org/10.2151/jmsj.2015-048.
- Kato, Seiji, Norman G. Loeb, David A. Rutan, and Fred G. Rose. 2015b. “Clouds and the Earth’s Radiant Energy System (CERES) Data Products for Climate Research.” Journal of the Meteorological Society of Japan. Ser. II 93 (6): 597–612. https://doi.org/10.2151/jmsj.2015-048.
- Kendall, M. G. 1948. Rank Correlation Methods.
- Kobayashi, S., Y. Ota, Y. Harada, A. Ebita, M. Moriya, H. Onoda, K. Onogi, et al. 2015a. “The JRA-55 Reanalysis: General Specifications and Basic Characteristics.” J. Meteor. Soc. Japan 93 (1): 5–48. https://doi.org/10.2151/jmsj.2015-001.
- Kobayashi, Shinya, Yukinari Ota, Yayoi Harada, Ayataka Ebita, Masami Moriya, Hirokatsu Onoda, Kazutoshi Onogi, et al. 2015b. “The JRA-55 Reanalysis: General Specifications and Basic Characteristics.” Journal of the Meteorological Society of Japan. Ser. II 93 (1): 5–48. https://doi.org/10.2151/jmsj.2015-001.
- Li, Shaopeng, Bo Jiang, Jianghai Peng, Hui Liang, Jiakun Han, Yunjun Yao, Xiaotong Zhang, et al. 2021. “Estimation of the All-Wave All-Sky Land Surface Daily Net Radiation at Mid-Low Latitudes from MODIS Data Based on ERA5 Constraints.” Remote Sensing 14 (1), https://doi.org/10.3390/rs14010033.
- Liang, Hui, Bo Jiang, Shunlin Liang, Jianghai Peng, Shaopeng Li, Jiakun Han, Xiuwan Yin, et al. 2022. “A Global Long-Term Ocean Surface Daily/0.05° Net Radiation Product from 1983 to 2020.” Scientific Data 9 (1), https://doi.org/10.1038/s41597-022-01419-x.
- Liang, Shunlin, Kaicun Wang, Xiaotong Zhang, and Martin Wild. 2010. “Review on Estimation of Land Surface Radiation and Energy Budgets from Ground Measurement, Remote Sensing and Model Simulations.” IEEE Journal of Selected Topics in Applied Earth Observations and Remote Sensing 3 (3): 225–40. https://doi.org/10.1109/jstars.2010.2048556.
- Liu Xinan, and Yu Guirui. 2006. “Research on the Calculating of Surface Net Radiation in China.” Journal of Natural Resources 21: 139–145.
- Liu, Chunlei, Richard P. Allan, Michael Mayer, Patrick Hyder, Damien Desbruyères, Lijing Cheng, Jianjun Xu, Feng Xu, and Yu Zhang. 2020. “Variability in the Global Energy Budget and Transports 1985–2017.” Climate Dynamics 55 (11–12): 3381–96. https://doi.org/10.1007/s00382-020-05451-8.
- Liu, Benjamin Y. H., and Richard C. Jordan. 1960. “The Interrelationship and Characteristic Distribution of Direct, Diffuse and Total Solar Radiation.” Solar Energy 4 (3): 1–19. https://doi.org/10.1016/0038-092X(60)90062-1.
- Liu, Y., X. Liu, Y. Hu, S. Li, J. Peng, and Y. Wang. 2015. “Analyzing Nonlinear Variations in Terrestrial Vegetation in China During 1982–2012.” Environmental Monitoring and Assessment 187 (11): 722. https://doi.org/10.1007/s10661-015-4922-7.
- Liu, Qiang, Lizhao Wang, Ying Qu, Nanfeng Liu, Suhong Liu, Hairong Tang, and Shunlin Liang. 2013. “Preliminary Evaluation of the Long-Term GLASS Albedo Product.” International Journal of Digital Earth 6 (Suppl. 1): 69–95. https://doi.org/10.1080/17538947.2013.804601.
- Martens, Brecht, Dominik L. Schumacher, Hendrik Wouters, Joaquín Muñoz-Sabater, Niko E. C. Verhoest, and Diego G. Miralles. 2020. “Evaluating the Surface Energy Partitioning in ERA5.” Geoscientific Model Development, https://doi.org/10.5194/gmd-2019-315.
- Ni, J. J., J. H. Wu, J. Tong, Z. M. Chen, and J. P. Zhao. 2020. “GC -Net: Global Context Network for Medical Image Segmentation.” Computer Methods and Programs in Biomedicine 190: ARTN 105121. https://doi.org/10.1016/j.cmpb.2019.105121.
- Oliveira, Gabriel, Nathaniel A. Brunsell, Elisabete C. Moraes, Yosio E. Shimabukuro, Thiago V. Santos, Celso Randow, Renata G. Aguiar, and Luiz E. O. C. Aragao. 2019. “Effects of Land-Cover Changes on the Partitioning of Surface Energy and Water Fluxes in Amazonia Using High-Resolution Satellite Imagery.” Ecohydrology 12 (6), https://doi.org/10.1002/eco.2126.
- Onogi, Kazutoshi, Junichi Tsutsui, Hiroshi Koide, Masami Sakamoto, S. Kobayashi, Hiroaki Hatsushika, Takanori Matsumoto, et al. 2007. “The JRA-25 Reanalysis.” Journal of the Meteorological Society of Japan. Ser. II 85: 369–432.
- Phillips, Thomas J., Stephen A. Klein, Hsi-Yen Ma, Qi Tang, Shaocheng Xie, Ian N. Williams, Joseph A. Santanello, David R. Cook, and Margaret S. Torn. 2017. “Using ARM Observations to Evaluate Climate Model Simulations of Land-Atmosphere Coupling on the U.S. Southern Great Plains.” Journal of Geophysical Research: Atmospheres 122 (21): 11,524–11,548. https://doi.org/10.1002/2017JD027141.
- Pinker, R. T., and I. Laszlo. 1992. “Modeling Surface Solar Irradiance for Satellite Applications on a Global Scale.” Journal of Applied Meteorology 31 (2): 194–211. https://doi.org/10.1175/1520-0450(1992)031<0194:mssifs>2.0.co;2.
- Qin, Boxiong, Biao Cao, Hua Li, Zunjian Bian, Tian Hu, Yongming Du, Yingpin Yang, Qing Xiao, and Qinhuo Liu. 2020. “Evaluation of Six High-Spatial Resolution Clear-Sky Surface Upward Longwave Radiation Estimation Methods with MODIS.” Remote Sensing 12 (11), https://doi.org/10.3390/rs12111834.
- Qin, Jun, Kun Yang, Shunlin Liang, Hao Zhang, Yaoming Ma, Xiaofeng Guo, and Zhuoqi Chen. 2011. “Evaluation of Surface Albedo from GEWEX-SRB and ISCCP-FD Data Against Validated MODIS Product Over the Tibetan Plateau.” Journal of Geophysical Research: Atmospheres 116 (D24), https://doi.org/10.1029/2011jd015823.
- Reichle, Rolf H., Q. Liu, Randal D. Koster, Clara S. Draper, Sarith P. P. Mahanama, and Gary S. Partyka. 2017. “Land Surface Precipitation in MERRA-2.” Journal of Climate 30 (5): 1643–64. https://doi.org/10.1175/jcli-d-16-0570.1.
- Restrepo-Coupe, Natalia, Humberto R. da Rocha, Lucy R. Hutyra, Alessandro C. da Araujo, Laura S. Borma, Bradley Christoffersen, Osvaldo M. R. Cabral, et al. 2013. “What Drives the Seasonality of Photosynthesis Across the Amazon Basin? A Cross-Site Analysis of Eddy Flux Tower Measurements from the Brasil Flux Network.” Agricultural and Forest Meteorology 182-183: 128–44. https://doi.org/10.1016/j.agrformet.2013.04.031.
- Rutan, David A., Seiji Kato, David R. Doelling, Fred G. Rose, Le Trang Nguyen, Thomas E. Caldwell, and Norman G. Loeb. 2015. “CERES Synoptic Product: Methodology and Validation of Surface Radiant Flux.” Journal of Atmospheric and Oceanic Technology 32 (6): 1121–43. https://doi.org/10.1175/jtech-d-14-00165.1.
- Saha, Suranjana, Shrinivas Moorthi, H. L. Pan, Xingren Wu, J. Wang, Sudhir Nadiga, Patrick Tripp, et al. 2010. The NCEP Climate Forecast System Reanalysis. Vol. 91, 1015–1057.
- Seo, Minji, Hyun-Cheol Kim, Kyeong-Sang Lee, Noh-Hun Seong, Eunkyung Lee, Jinsoo Kim, and Kyung-Soo Han. 2020. “Characteristics of the Reanalysis and Satellite-Based Surface Net Radiation Data in the Arctic.” Journal of Sensors 2020: 1–13. https://doi.org/10.1155/2020/8825870.
- Sianturi, Yesi, Marjuki, and Kwarti Sartika. 2020. “Evaluation of ERA5 and MERRA2 Reanalyses to Estimate Solar Irradiance Using Ground Observations Over Indonesia Region.” AIP Conference Proceedings 2223. doi:10.1063/5.0000854.
- Simmons, A., S. M. Uppala, D. P. Dee, and S. Kobayashi. 2006. “New ECMWF Reanalysis Products from 1989 Onwards.” ECMWF Newsletter 110: 26–35.
- Suárez, Max J., and Ming Dah Chou. 2013. “A Solar Radiation Parameterization for Atmospheric Studies.”
- Swap, Robert J., Harold J. Annegarn, J. Timothy Suttles, Michael D. King, Steven Platnick, Jeffrey L. Privette, and Robert J. Scholes. 2003. “Africa Burning: A Thematic Analysis of the Southern African Regional Science Initiative (SAFARI 2000).” Journal of Geophysical Research: Atmospheres 108 (D13), https://doi.org/10.1029/2003JD003747.
- Tang, Wenjun, Jun Qin, Kun Yang, Fuxin Zhu, and Xu Zhou. 2021. “Does ERA5 Outperform Satellite Products in Estimating Atmospheric Downward Longwave Radiation at the Surface?” Atmospheric Research 252, https://doi.org/10.1016/j.atmosres.2021.105453.
- Tota, Julio, David Fitzjarrald, Ralf Staebler, Ricardo Sakai, Osvaldo Moraes, Otavio Acevedo, Steven Wofsy, and Antonio Manzi. 2008. “Amazon Rain Forest Subcanopy Flow and the Carbon Budget: Santarém LBA-ECO Site.” Journal of Geophysical Research: Biogeosciences 113: 1–16. https://doi.org/10.1029/2007JG000597.
- Uppala, S. M., P. W. KÅllberg, A. J. Simmons, U. Andrae, V. Da Costa Bechtold, M. Fiorino, J. K. Gibson, et al. 2005. “The ERA-40 re-Analysis.” Quarterly Journal of the Royal Meteorological Society 131 (612): 2961–3012. https://doi.org/10.1256/qj.04.176.
- Urraca, Ruben, Thomas Huld, Ana Gracia-Amillo, Francisco Javier Martinez-de-Pison, Frank Kaspar, and Andres Sanz-Garcia. 2018. “Evaluation of Global Horizontal Irradiance Estimates from ERA5 and COSMO-REA6 Reanalyses Using Ground and Satellite-Based Data.” Solar Energy 164: 339–54. https://doi.org/10.1016/j.solener.2018.02.059.
- Verma, Manish, Joshua Fisher, Kaniska Mallick, Youngryel Ryu, Hideki Kobayashi, Alexandre Guillaume, Gregory Moore, et al. 2016. “Global Surface Net-Radiation at 5 km from MODIS Terra.” Remote Sensing 8 (9), https://doi.org/10.3390/rs8090739.
- Wang, Kang, and Gary D. Clow. 2021. “Newly Collected Data Across Alaska Reveal Remarkable Biases in Solar Radiation Products.” International Journal of Climatology 41 (1): 497–512. https://doi.org/10.1002/joc.6634.
- Wang, Gaofeng, Tianxing Wang, and Huazhu Xue. 2021. “Validation and Comparison of Surface Shortwave and Longwave Radiation Products Over the Three Poles.” International Journal of Applied Earth Observation and Geoinformation 104: 102538. https://doi.org/10.1016/j.jag.2021.102538.
- Wang, MeiRong, ShunWu Zhou, and AnMin Duan. 2011. “Trend in the Atmospheric Heat Source Over the Central and Eastern Tibetan Plateau During Recent Decades: Comparison of Observations and Reanalysis Data.” Chinese Science Bulletin 57 (5): 548–57. https://doi.org/10.1007/s11434-011-4838-8.
- Wielicki, B. A., B. R. Barkstrom, B. A. Baum, T. P. Charlock, R. N. Green, D. P. Kratz, R. B. Lee, et al. 1998. “Clouds and the Earth's Radiant Energy System (CERES): Algorithm Overview.” IEEE Transactions on Geoscience and Remote Sensing 36 (4): 1127–41. https://doi.org/10.1109/36.701020.
- Wielicki, B. A., B. R. Barkstrom, E. F. Harrison, R. B. Lee, G. L. Smith, and J. E. Cooper. 1996. “Clouds and the Earth’s Radiant Energy System (CERES): An Earth Observing System Experiment.” Bulletin of the American Meteorological Society 77 (5): 853–68. https://doi.org/10.1175/1520-0477(1996)077<0853:Catere>2.0.Co;2.
- Wild, Martin, Doris Folini, Maria Z. Hakuba, Christoph Schär, Sonia I. Seneviratne, Seiji Kato, David Rutan, Christof Ammann, Eric F. Wood, and Gert König-Langlo. 2014. “The energy balance over land and oceans: an assessment based on direct observations and CMIP5 climate models.” Climate Dynamics 44 (11–12): 3393-429. https://doi.org/10.1007/s00382-014-2430-z.
- Xiao, Zhiqiang, Shunlin Liang, Xiaodan Tian, Kun Jia, Yunjun Yao, and Bo Jiang. 2017. “Reconstruction of Long-Term Temporally Continuous NDVI and Surface Reflectance from AVHRR Data.” IEEE Journal of Selected Topics in Applied Earth Observations and Remote Sensing 10 (12): 5551–68. https://doi.org/10.1109/jstars.2017.2744979.
- Xu, Jianglei, Shunlin Liang, and Bo Jiang. 2022. “A Global Long-Term (1981–2019) Daily Land Surface Radiation Budget Product from AVHRR Satellite Data Using a Residual Convolutional Neural Network.” Earth System Science Data 14 (5): 2315–41. https://doi.org/10.5194/essd-14-2315-2022.
- Yan, Guangjian, Tianxing Wang, Zhonghu Jiao, Xihan Mu, Jing Zhao, and Ling Chen. 2016. “Topographic Radiation Modeling and Spatial Scaling of Clear-sky Land Surface Longwave Radiation Over Rugged Terrain.” Remote Sensing of Environment 172: 15–27. https://doi.org/10.1016/j.rse.2015.10.026.
- Yao, Yunjun, Shunlin Liang, Xianglan Li, Yang Hong, Joshua B. Fisher, Nannan Zhang, Jiquan Chen, et al. 2014. “Bayesian Multimodel Estimation of Global Terrestrial Latent Heat Flux from Eddy Covariance, Meteorological, and Satellite Observations.” Journal of Geophysical Research Atmospheres 119: 4521–45. https://doi.org/10.1002/2013jd020864.
- Young, Alisa H., Kenneth R. Knapp, Anand Inamdar, William Hankins, and William B. Rossow. 2018. “The International Satellite Cloud Climatology Project H-Series Climate Data Record Product.” Earth System Science Data 10 (1): 583–93. https://doi.org/10.5194/essd-10-583-2018.
- Yu, Yuechi, Jiancheng Shi, Tianxing Wang, Husi Letu, Pengfei Yuan, Wang Zhou, and Lu Hu. 2019. “Evaluation of the Himawari-8 Shortwave Downward Radiation (SWDR) Product and its Comparison With the CERES-SYN, MERRA-2, and ERA-Interim Datasets.” IEEE Journal of Selected Topics in Applied Earth Observations and Remote Sensing 12 (2): 519–32. https://doi.org/10.1109/jstars.2018.2851965.
- Zhang, Yuanchong. 2004. “Calculation of Radiative Fluxes from the Surface to top of Atmosphere Based on ISCCP and Other Global Data Sets: Refinements of the Radiative Transfer Model and the Input Data.” Journal of Geophysical Research 109 (D19), https://doi.org/10.1029/2003jd004457.
- Zhang, Xiaotong, Shunlin Liang, Guoxin Wang, Yunjun Yao, Bo Jiang, and Jie Cheng. 2016. “Evaluation of the Reanalysis Surface Incident Shortwave Radiation Products from NCEP, ECMWF, GSFC, and JMA Using Satellite and Surface Observations.” Remote Sensing 8 (3), https://doi.org/10.3390/rs8030225.
- Zhang, X., N. Lu, H. Jiang, and L. Yao. 2020. “Evaluation of Reanalysis Surface Incident Solar Radiation Data in China.” Scientific Reports 10 (1): 3494. https://doi.org/10.1038/s41598-020-60460-1.
- Zhang, Yuanchong, William B. Rossow, Andrew A. Lacis, Valdar Oinas, and Michael I. Mishchenko. 2004. “Calculation of Radiative Fluxes from the Surface to top of Atmosphere Based on ISCCP and Other Global Data Sets: Refinements of the Radiative Transfer Model and the Input Data.” Journal of Geophysical Research 109 (D19): D19105. https://doi.org/10.1029/2003jd004457.
- Zhang, Taiping, Paul W. Stackhouse, Shashi K. Gupta, Stephen J. Cox, and J. Colleen Mikovitz. 2015. “The Validation of the GEWEX SRB Surface Longwave Flux Data Products Using BSRN Measurements.” Journal of Quantitative Spectroscopy and Radiative Transfer 150: 134–47. https://doi.org/10.1016/j.jqsrt.2014.07.013.
- Zhang, Xiaotong, Xiang Zhao, Wenhong Li, Shunlin Liang, Dongdong Wang, Qiang Liu, Yunjun Yao, et al. 2019. “An Operational Approach for Generating the Global Land Surface Downward Shortwave Radiation Product from MODIS Data.” IEEE Transactions on Geoscience and Remote Sensing 57 (7): 4636–50. https://doi.org/10.1109/tgrs.2019.2891945.
- Zo, Il-Sung, Joon-Bum Jee, Bu-Yo Kim, and Kyu-Tae Lee. 2017. “Baseline Surface Radiation Network (BSRN) Quality Control of Solar Radiation Data on the Gangneung-Wonju National University Radiation Station.” Asia-Pacific Journal of Atmospheric Sciences 53: 11–9. https://doi.org/10.1007/s13143-016-0029-5.