
ABSTRACT
Earth system science is an interdisciplinary effort to understand the fundamentals and interactions of environmental processes. Interdisciplinary research is challenging since it demands the integration of scientific schemes and practices from different research fields into a collaborative work environment. This paper introduces the framework F4ESS that supports this integration. F4ESS provides methods and technologies that facilitate the development of integrative work environments for Earth system science. F4ESS enables scientists a) to outline structured and summarized descriptions of scientific procedures to facilitate communication and synthesis, b) to combine a large variety of distributed data analysis software into seamless data analysis chains and workflows, c) to visually combine and interactively explore the manifold spatiotemporal data and results to support understanding and knowledge creation. The F4ESS methods and technologies are generic and can be applied in various scientific fields. We discuss F4ESS in the context of the interdisciplinary investigation of flood events.
1. Earth system science – a collaborative interdisciplinary endeavour
Society faces national and global challenges such as climate change, biodiversity loss, natural hazards, and sustainable resource use. Therefore, leading Earth and environmental scientists emphasized Earth system science (ESS) as an interdisciplinary effort to understand the fundamentals of environmental processes and to provide scientifically based knowledge for addressing national and global challenges. (German National Academy of Sciences Leopoldina Citation2022; National Academies of Sciences, Engineering, and Medicine Citation2020; Australian Academy of Sciences Citation2018). Interdisciplinary Earth system science is a collaborative endeavour and comes along with several obstacles. The disciplinary-dominated structure of academia runs contrary to interdisciplinary research, which needs to break down barriers between fields to find common ground. ‘Done correctly, interdisciplinary research is not mere multidisciplinary work – a collection of people tackling a problem using their specific skills – but a synthesis of different approaches into something unique’ (Editorial Nature Citation2015, 289). The task of synthesizing and integrating different approaches is manifold: interdisciplinary research has a) to overcome the opacity of domain-specific practices of scientific communities to outsiders, b) it has to connect different conceptual and methodological scientific practices and languages, and c) it has to transfer and interpret intermediate results between heterogeneous communities and work environments (MacLeod Citation2018). The Report on ‘Tomorrow’s Science. Earth System Science – Discovery, Diagnosis, and Solutions in Times of Global Change’ describes how Earth system science must evolve; it should be ‘more transdisciplinary, more quantitative, and more digital, taking advantage of technological advances in the natural sciences, computing, and engineering.’ (German National Academy of Sciences Leopoldina Citation2022, 6).
2. Related work
Earth system science encompasses natural and social sciences (e.g. Steffen et al. Citation2020; Campello Torres and Jacobi Citation2021; Lange et al. Citation2023). We focus on interdisciplinary efforts related to the atmosphere, geosphere, hydrosphere, and cryosphere because our expertise is in Earth and environmental sciences. Several efforts have been made to address the barriers and needs of interdisciplinary Earth system science. On the one hand, geoscientists and environmental scientists study Earth system processes or specific regions of the Earth from different perspectives in order to gain a more comprehensive understanding and knowledge (e.g. Kottmeier et al. Citation2016; Mîndrescu and Hutchinson Citation2012; Shao et al. Citation2011). On the other hand, developments at the methodical and technological level have been initiated to address the integration challenges associated with interdisciplinary research. The modeling community has developed several techniques for coupling models representing different Earth system components, such as the Earth System Modeling Framework (ESMF) or the Model Coupling Toolkit (MCT) (Valcke et al. Citation2012). Data infrastructures for sharing and integrating data are being established within the data-driven community such as EUDAT (https://eudat.eu/), ORFEUS (https://www.orfeus-eu.org/), or NFDI4Earth (https://www.nfdi4earth.de/). Technologies based on workflow and service-oriented concepts are being developed to integrate geoprocessing tools into data processing chains and GIS environments (Cao and Ames Citation2012; Peng, Zhang, and Tan Citation2015; Forkan et al. Citation2023; Fang et al. Citation2023) Visualization techniques have been developed for the visual integration of multivariate spatiotemporal data (Roberts Citation2005) and the support of visually enabled geo-collaboration (MacEachren and Brewer Citation2004). While these efforts are valuable, there is still a need for broadly applicable generic solutions that link existing approaches into an integrative working environment for Earth system science. To the best of our knowledge, no integrative and collaborative work environment for Earth system science exists that links existing approaches within a generic framework in support of interdisciplinary research.
3. The framework F4ESS to facilitate interdisciplinary integration tasks of earth system science
This paper introduces the ‘Framework for Earth System Science F4ESS’. We developed F4ESS as a generic framework that combines various methods and technologies from computer – and information science under one roof to facilitate the integration tasks necessary for interdisciplinary Earth system science. F4ESS provides generic methods and technologies enabling scientists a) to outline their domain-specific scientific procedures, b) to link scientific procedures, such as data analysis procedures, into seamless, executable workflows, and c) to present and explore data and results among disciplines.
3.1. F4ESS requirements related to interdisciplinary integration tasks
F4ESS focuses on the integration tasks required for interdisciplinary Earth system science (Chapter 1); therefore, we concentrate on requirements directed at these tasks. We conducted a requirements analysis based on structured and unstructured interviews and discussions between scientists from different Earth science disciplines to identify the requirements. The requirements analysis was part of the interdisciplinary project ‘Digital Earth’ (https://www.digitalearth-hgf.de/), which aims to bring methods and techniques from computer and data science to Earth system science to enable an integrated, more holistic view of the Earth system. Scientists from climatology, hydrology, environmental science, and marine science were involved. The discussions resulted in the following primary needs that F4ESS should address: to support communication and understanding of discipline-specific scientific procedures and their synthesis, to link a large variety of data analysis methods and tools existing in each discipline, and to combine and understand a large amount of heterogeneous spatiotemporal data from different sources. From these findings, we derived the following requirements for F4ESS:
Req1: Provide methods to outline structured and summarized descriptions of scientific procedures to facilitate communication, understanding and synthesis. A basic understanding of the scientific procedures from distinct disciplines is required; scientists need to get an idea of how the procedures operate, what outcome they produce, what input they expect, and how they can be synthesized. The first requirement is that F4ESS provides methods enabling scientists to outline structured and summarized descriptions of their scientific procedures.
Req2: Provide concepts and technologies to combine a large variety of analytical methods and tools into seamless data analysis chains. Scientists use highly specialized data analysis software to extract information from the data. These software is often tailored to specific scientific applications and are usually incompatible with data analysis software developed by other scientists or communities. Interdisciplinary Earth system science requires combining the large variety of available data analysis methods from different scientific fields into integrative, seamless data analysis chains. Therefore, analysis software must be developed with the help of software components that communicate through APIs to exchange information and data. Another requirement for creating integrative seamless data analysis chains is the combination of software distributed across many scientists and IT systems. Message brokers that provide communication channels between distributed software components are needed to facilitate communication between distributed software components. The second requirement for F4ESS is twofold. F4ESS must provide methods that support scientists in implementing data analysis software as software components. These concepts and methods must also support scientists in defining APIs that software components developed by other scientists can easily use. Second, F4ESS must provide a message broker that helps researchers to combine distributed software components into seamless data analysis chains.
Req3: Facilitate direct interaction with data, methods and tools to support understanding and knowledge creation. Interdisciplinary research, such as the comprehensive investigation of flood events, is an iterative knowledge-creation process. Scientists must be able to interact directly with the data, methods, and tools to investigate and discuss hypotheses and results across disciplines. For instance, scientists may interactively change parameter settings and steer analysis procedures based on scientific insight and expertise. They also may go back and forward in the whole analysis process in a straight manner. The third requirement is that F4ESS needs to provide interactive user interfaces that support scientists in steering the iterative data analysis and knowledge-creation.
Req4: Provide visualization methods to present and interpret the manifold spatiotemporal data and results. Interdisciplinary Earth system science needs visual representations of data and results for several reasons. Visualization facilitates a combined presentation of a large variety of spatiotemporal data. It also supports scientists from different disciplines with different scientific languages to understand and discuss the spatiotemporal data and its relationships. The fourth requirement is that F4ESS needs to provide visualization methods that support the understanding and interpretation of the manifold data and results generated in interdisciplinary research.
3.2. F4ESS architecture, methods and technology
F4ESS is composed of three interrelated building blocks, each building block provides methods and technologies to address the requirements we defined ().
Figure 1. F4ESS architecture with methodical/technical building blocks.
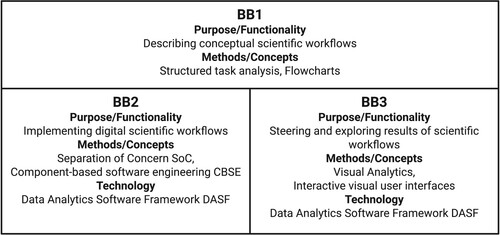
3.2.1. Building block 1 (BB1): methods to describe scientific procedures as conceptual workflows
F4ESS proposes to describe scientific procedures as scientific workflows. Science has increasingly used workflows (Hollingsworth Citation1995) to specify scientific experiments and operate data management and analysis procedures. With the increase in data volumes and diversity, workflows play an ever more significant role in enabling researchers to exploit a broad range of data sources and computational platforms (Cerezo, Montagnat, and Blay-Fornarino Citation2013; Atkinson et al. Citation2017). Workflows provide a twofold perspective on scientific procedures that differentiates between conceptual and digital workflows (Cerezo, Montagnat, and Blay-Fornarino Citation2013). Conceptual workflows are structured records of scientific procedures, they are suitable for documentation, communication, and discussion between scientists from different disciplines. Digital workflows make conceptual workflows executable, they connect and execute various methods and tools within a distributed computing infrastructure and manage the data flow between multiple data sources. BB1 focuses on the conceptual workflows to present scientific procedures in a structured and summarized way (addressing Req. 1). BB1 provides methods that support scientists to specify such conceptual workflows. BB1 aims to offer methods that are both well-established and comprehensible for non-experts. Task analysis is a well-established approach that supports users in structuring workflows and acquiring information about goals, tasks, and input/output data. (Kirwan and Ainsworth Citation1992; Jonassen, Tessmer, and Hannum Citation1998; Schraagen et al. Citation2000). People use task analysis to decompose complex procedures into a sequence of well-defined tasks. Cognitive task analysis focuses on mental tasks, such as data analysis tasks. Structured interviews are approved approaches to capture the required information. Well-known methods to describe and document conceptual scientific workflows include the ANSI flowchart using symbols from the American National Standards Institute, the UML Activity diagram using the Unified Modeling Language, the BPMN standing for Business Process Modeling Notation which is similar to UML, or straightforward flowcharts (Lucidchart Citation2022). BB1 proposes to apply flowcharts since geoscientists are familiar with this type of workflow presentation. The flowcharts represent scientific procedures at a conceptual level. and show exemplary conceptual workflows.
3.2.2. Building block 2 (BB2): methods and technologies to implement conceptual workflows as digital workflows
Implementing conceptual scientific workflows (i.e. as specified in BB1) as digital scientific workflows requires implementing each step of conceptual scientific workflows as a software component. To support the development of software components (Req2), BB2 provides concepts and methods from component-based software engineering (CBSE) (McIlroy Citation1969; Heineman and Councill Citation2001), such as the principle of separation of concerns (SoC) (Dijkstra Citation1982). It also assists researchers in defining APIs for their software components. To integrate distributed software components into seamless digital workflows (addressing Req2), BB2 provides scientists with a message-oriented middleware, which we call the Data Analytics Software Framework (DASF)-Message Broker (Eggert et al. Citation2022a). DASF-Message Broker uses the Remote Procedure Call (RPC) technique (White Citation1976) from distributed computing and complements the RPC technique with the central message broker Apache Pulsar (https://pulsar.apache.org/), which manages the communication between the software components of a digital workflow distributed over many IT systems. DASF-Message Broker provides mechanisms for software components to register with the Message Broker. DASF-Message Broker also reduces security conflicts in distributed environments, such as dealing with institutional firewalls.
3.2.3. Building block 3 (BB3): methods and technologies to steer and explore scientific workflows and their results
BB3 provides visualization techniques that support scientists in presenting and exploring the manifold data and results generated in scientific workflows. It also provides techniques for constructing interactive user interfaces that allow scientists to interact directly with data, methods, and tools to support the iterative knowledge-creation process. BB3 addresses Req3 and Req4. BB3 provides concepts from visual analytics, a sub-discipline of computer science that develops methods and computer-based systems to visually explore and understand massive, heterogeneous, and dynamic data sets (Keim et al. Citation2009; Andrienko et al. Citation2010; Spence Citation2014; Munzner Citation2014). To support the interactive analysis of spatiotemporal data, BB3 provides implementations of many widely-used visualization components and interaction methods through the DASF-Web module (Eggert et al. Citation2022a). For instance, BB3 enables scientists to link multiple views together, showing the same data from different perspectives (i.e. in complementing visual representations) to support scientists in interpreting data and results across disciplinary borders. Interaction techniques, such as selection or filtering, allow scientists to interact directly with the data, methods, and tools of the workflows via a graphical interface. The interface facilitates interactive parameter setting, steering of analysis procedures, and going back and forward in the workflow. Examples are shown in .
4. A showcase: application of F4ESS to investigate flood events
4.1. Interdisciplinary investigation of flood events
We chose the investigation of flood events as a showcase for implementing and evaluating F4ESS because studying flood events across multiple disciplines share many of the previously discussed integration challenges. The showcase was part of the interdisciplinary project Digital Earth (https://www.digitalearth-hgf.de/). Within Digital Earth, flood events are studied along the natural process chain, starting from flood generation and evolution to impact, and from multiple perspectives: climatology, hydrology, environmental- and marine science. Each discipline studies flood events from its unique scientific perspective and addresses its specific questions about flood events (), resulting in highly-specialized scientific knowledge for each scientific perspective. To gain a more comprehensive understanding of flood events, their drivers, impact, and relations, scientists must combine their unique perspectives. For instance, hydrologists and marine scientists working together on flood events can answer questions such as, ‘Do similar flood events have a similar impact on the sea? Can large-scale flood events be detected as exceptional nutrient inputs into the sea that lead to exceptional algae blooms?’ The hydrologists contribute to answering these questions with their knowledge of flood events and hydro-meteorological controls. They provide methods and data for this interdisciplinary research, allowing scientists to identify, assess and compare flood events based on parameters such as discharge, catchment conditions like precipitation or soil moisture, and inundation patterns. Marine scientists contribute with their expertise on the marine environment. For instance, flood events washing unusual amounts of nutrients and pollutants into the sea, can alter the marine environment and may increase algae blooms. They contribute with methods and data that enable scientists to investigate chemical and physical anomalies in the water body, such as anomalies of salinity, chlorophyll, or surface temperature. Marine scientists use these anomalies to determine the spatial and temporal extent of the river’s impact and the quality and quantity of nutrients introduced into the sea. The combination of methods and data from both disciplines enables scientists to understand flood events and their impact on the marine system and gain insight into the interaction of the two systems.
Figure 2. Each scientific discipline, Atmo, Terra, and Mare, provide its perspective and question to the generation, evolution, and impact of flood events. This figure is adapted from ‘Integrating Data Science and Earth Science [https://doi.org/10.1007/978-3-030-99546-1]’, used under CC BY 4.0.
![Figure 2. Each scientific discipline, Atmo, Terra, and Mare, provide its perspective and question to the generation, evolution, and impact of flood events. This figure is adapted from ‘Integrating Data Science and Earth Science [https://doi.org/10.1007/978-3-030-99546-1]’, used under CC BY 4.0.](/cms/asset/04968692-4361-4864-98fd-dff8add394ef/tjde_a_2259361_f0002_oc.jpg)
4.2. The digital earth flood event explorer: an exemplary application of F4ESS
Based on F4ESS we developed the Digital Earth Flood Event Explorer that supports scientists in investigating flood events from various perspectives (Eggert et al. Citation2022b). In this paper we focus on those parts of the Flood Event Explorer that link the hydrologists’ and marine scientists’ scientific approaches to answer the question, ‘Do similar flood events have similar impacts on the sea?’ The Elbe River in Germany ending in the North Sea has been chosen as a concrete test site since data is available for several severe and less severe flood events in this catchment. The flood event explorer shows exemplarily how the methods and technologies of the three F4ESS building blocks (BB1, BB2, BB3) are applied.
4.2.1. Outline the hydrologists’ and the marine scientists’ conceptual workflows with methods from building block 1 (BB1)
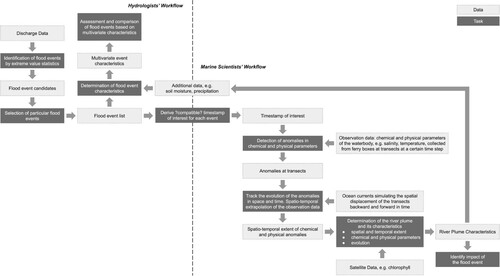
We used structured task analysis to outline the conceptual scientific workflows of the hydrologists and marine scientists. The hydrologists’ workflow shows all the tasks and data required to identify, assess and compare flood events in terms of water volume and hydrometeorological controls (). The marine scientists’ workflow consists of tasks and data to detect a flood river plume and its nutrient input into the North Sea and to investigate anomalies in the water body in terms of quality and quantity of chemical and physical parameters and its spatial and temporal extent (). In a second step, we combined these two workflows into an interdisciplinary workflow. depicts this combined scientific workflow at the conceptual level. The combined workflow compares the characteristics of individual flood events and the characteristics of their marine impacts in order to identify patterns and relationships between the two systems. depicts the additional tasks and data flows required to combine both workflows. For instance, the time stamps of flood events from the hydrologists’ workflow need to be passed over to the marine scientists’ workflow to investigate anomalies in the North Sea at those timestamps. The exchange and adjustment of timestamps are essential because there is a time delay between the measurements of flood levels at river gauges and the arrival of the flood at the North Sea. The marine scientists’ workflow feeds the characteristics of the marine anomalies back into the hydrologists’ workflow, enabling scientists to compare the flood event and the marine impact characteristics.
Figure 3. Flowchart of the hydrologists’ workflow.
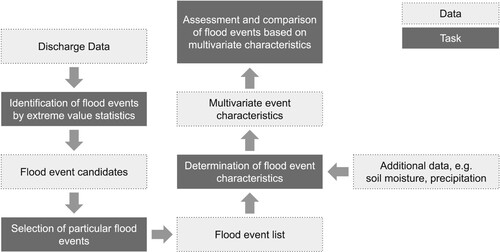
Figure 4. Flowchart of the marine scientists’ workflow.
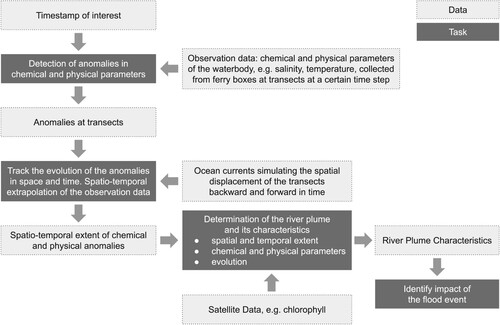
Figure 5. Flowchart of the combined workflow.
4.2.2. Implementation and integration of the hydrologists’ and the marine scientists’ digital scientific workflows with methods and technologies from building block 2 (BB2)
We implemented the conceptual scientific workflows from BB1 into digital workflows using the principle of separation of concern (SoC) and the DASF-Message Broker (Eggert et al. Citation2022a). For instance, we transformed the method called ‘Identification of flood events by extreme value statistics’ in the hydrologists’ workflow as a software component that extracts event candidates from the data using a hydrograph-based model (Boughton Citation1993) from the data (). To support the combination of this software component with other software components via the central message broker, we added a DASF module annotation to this software component. Once scientists deploy their software components with a DASF module annotation, DASF handles the technical issues of communicating with other software components in the data analysis chains.
Figure 6. Visual interface of the collaborative work environment presenting an overview of height and duration of flood events determined for selected gauges and time intervals. The visual interface supports the selection of gauges (map) and time intervals (time line at the top) and the identification of corresponding flood events (line graph). The line graph depicts water runoff with flood event candidates shown as yellow segments and selected events shown as purple segments. The list at the bottom specifies the parameters and data for selected events. This figure is adapted from ‘Integrating Data Science and Earth Science [https://doi.org/10.1007/978-3-030-99546-1]’, used under CC BY 4.0.
![Figure 6. Visual interface of the collaborative work environment presenting an overview of height and duration of flood events determined for selected gauges and time intervals. The visual interface supports the selection of gauges (map) and time intervals (time line at the top) and the identification of corresponding flood events (line graph). The line graph depicts water runoff with flood event candidates shown as yellow segments and selected events shown as purple segments. The list at the bottom specifies the parameters and data for selected events. This figure is adapted from ‘Integrating Data Science and Earth Science [https://doi.org/10.1007/978-3-030-99546-1]’, used under CC BY 4.0.](/cms/asset/950b8c6c-1b5b-4c11-84b7-b0a8a17afd20/tjde_a_2259361_f0006_oc.jpg)
4.2.3. Development of an interactive visual interface with methods and technologies from building block 3 (BB3) to enable hydrologists and marine scientists to visualize data and collaboratively explore the relationships between flood events and marine impact
We used the data visualization and interactive graphical user interface techniques provided by DASF-Web in BB3 to develop an exploratory work environment that allows hydrologists and marine scientists to present and interact with data and results, and thus collaboratively explore the relationships between flood events and marine impacts. Within this explorative workspace, scientists can obtain an overview of flood events that have been recorded for selected gauges and time intervals. This overview provides scientists with characteristic parameters of a flood event, such as elevation and duration (), its spatiotemporal pattern, precipitation, and catchment soil moisture (). Scientists can select potentially interesting flood events (e.g. the purple events in ) for further investigation, such as their impact on the marine water body. This is done by determining the corresponding water bodies based on the time stamp of the selected flood events. Scientists then examine the anomalies of chemical and physical parameters induced by the flood event. In addition, scientists can explore the spatial and temporal distribution of the anomalies and the variations of parameters such as salinity, temperature, or chlorophyll (). Scientists can iteratively investigate multiple events and compare data from the events to understand the relationships between flood events and their impact on the marine system ().
Figure 7. Visual interface of the collaborative work environment supporting detailed investigation and comparison of selected flood events. Linked view on the water run off (on the top) and corresponding precipitation for picked days (purple marker in the line graph).
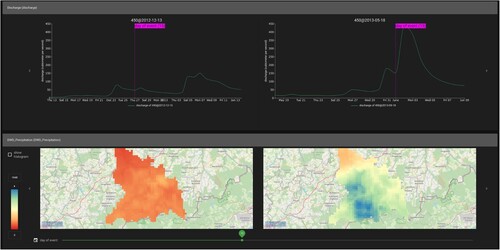
Figure 8. Visual interface of the collaborative work environment supporting the determination of marine impact characteristics for a specific flood event. Dates with detected anomalies aligning with the event date are shown in the calendar heatmap at the bottom. The spatial distribution and behaviour of the anomalies can be explored in the map, areas of interest can be selected for detailed investigation of physical and chemical parameters presented in the bar chart. An interactive timeline at the top facilitates investigating the variation of the anomaly in its spatial distribution (map) and its parameter values (bar chart) during a defined time interval. This figure is adapted from ‘Integrating Data Science and Earth Science [https://doi.org/10.1007/978-3-030-99546-1]’, used under CC BY 4.0.
![Figure 8. Visual interface of the collaborative work environment supporting the determination of marine impact characteristics for a specific flood event. Dates with detected anomalies aligning with the event date are shown in the calendar heatmap at the bottom. The spatial distribution and behaviour of the anomalies can be explored in the map, areas of interest can be selected for detailed investigation of physical and chemical parameters presented in the bar chart. An interactive timeline at the top facilitates investigating the variation of the anomaly in its spatial distribution (map) and its parameter values (bar chart) during a defined time interval. This figure is adapted from ‘Integrating Data Science and Earth Science [https://doi.org/10.1007/978-3-030-99546-1]’, used under CC BY 4.0.](/cms/asset/fa6d90f9-f7a3-473f-a666-64ca107cb49e/tjde_a_2259361_f0008_oc.jpg)
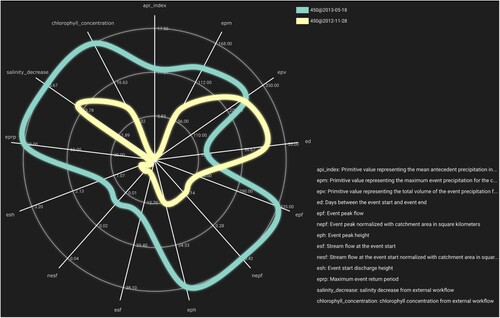
Figure 9. Visual interface of the collaborative work environment supporting the comparison of characteristics of flood events and marine impact. The radar plot shows the parameter values of two flood events and corresponding marine impact.
5. Assessment and outlook
We have developed F4ESS as a generic framework for creating working environments that support the integration challenges of Earth system science. Our Flood Event Explorer is an example of how the methods and technologies provided by F4ESS can be used to support the interdisciplinary study of flood events. In this work, we focused on the question, ‘Do similar flood events have similar impacts on the sea?’ In the broader context of the project, we have also addressed other questions such as ‘How might the hydro-meteorological control of flood events develop under projected climate change?’ or ‘What is the future design of groundwater monitoring networks required for different climate projections?’ In order to assess the ability of the Flood Event Explorer to support interdisciplinary research, we discussed the pros and cons with geoscientists and environmental scientists in a final evaluation workshop. The scientists pointed out that the conceptual scientific workflows described in flow charts are suitable means to communicate and discuss scientific procedures and their synthesis for interdisciplinary research. The methods of task analysis and flowcharts provided from the F4ESS building block BB1 are seen as helpful to describe scientific concepts and workflows in a systematic and structured way. However, applying the methods takes some additional effort since Earth and environmental scientists are usually not familiar with task analysis.
Scientists appreciated the integrated working environment with seamless digital workflows and interactive visual interfaces. Their feedback explicitly mentioned the intuitive access to spatial and temporal data and the ease with which users can visually select and combine data sets or subsets of data from different sources and at different stages of the data processing chain. They found the interactive, multi-linked views that combine different data to be very useful because they allow data to be viewed from different perspectives, e.g. the spatial and temporal distribution of the river plume and its chemical composition. The interactive visualization supported scientists to get a better picture of the phenomenon: more complete, reliable, and accurate. Scientists also pointed out that the Flood Event Explorer’s integrated working environment promotes more efficient scientific work, allowing them to focus on data analysis rather than tedious data and tool wrangling. Thus, F4ESS is allowing for a greater number of data sets to be studied which translates into greater scientific robustness.
Besides to this positive evaluation, the scientists mentioned the need for expertise and experience in software engineering as a barrier to using F4ESS. To reduce this barrier and minimize the implementation effort for scientific software developers, we developed the Data Analytics Software Framework DASF as part of F4ESS. The DASF Message Broker module facilitates communication between distributed software components and provides mechanisms to help scientists register software components with the Apache Pulsar message broker. The DASF-Web module supports scientists in developing interactive visual user interfaces. It provides an implementation of widely used visualization and interaction methods. The development of software components and APIs cannot be supported by technology; scientists must follow the separation of concern (SoC) principle of component-based software engineering, which we introduced as a generally accepted method in BB2.
Our collaborating scientist found F4ESS an appropriate tool for supporting interdisciplinary Earth system science. The following statements support this conclusion: ‘We need to rethink workflows and change the way we think about data and software for transparent, collaborative research.’ ‘Bringing different disciplines together is hard, but we did it.’ ‘The project has shown us how future collaborative geoscience research could look like.’ (All quotes in this paragraph are from personal communication at the Digital Earth workshop, January 26, 2021).
The evaluation of F4ESS and the Flood Event Explorer that we conducted with scientists from the Digital Earth project can only be seen as a first assessment of the capabilities of F4ESS. Further evaluation is needed to assess the contribution and effectiveness of F4ESS for interdisciplinary Earth system science. An evaluation of F4ESS and the Flood Event Explorer with a larger group of scientists and a more systematic evaluation scheme reflecting the interdisciplinary integration tasks would be necessary to obtain representative results. It would also require developing a test environment describing concrete tasks for test candidates to obtain comparable results. Such an evaluation is beyond the scope of this paper and would require a separate user study.
We have applied F4ESS in a single use case, the interdisciplinary study of flood events. Further use cases with other interdisciplinary Earth system science questions should be considered in the next step. It should be investigated whether the methods and technologies provided in the F4ESS building blocks BB1, BB2, and BB3 are suitable or whether they need to be modified or complemented. Such a review is vital when both natural and social sciences are involved.
Another topic for future work should be the support of scientists using F4ESS to develop integrative working environments. In particular, the methods and technologies provided by F4ESS for implementing seamless digital workflows and interactive visual interfaces require some expertise in software engineering. It should be explored how existing tools and training materials could be integrated into F4ESS to lower the barriers to adoption and enable more scientists to use F4ESS.
The review of existing approaches to address the barriers and requirements of interdisciplinary Earth system science (Chapter 2) showed a need for broadly applicable solutions to create integrative working environments for Earth system science. Our F4ESS addresses this need by providing generic methods and technologies to build integrated work environments for specific applications. To enable scientists applying the generic methods and technologies, F4ESS provides the Data Analytics Software Framework DASF with its modules DASF-Message Broker and DASF-Web, that minimize the implementation effort. F4ESS goes beyond existing approaches, its additional contribution is twofold: The F4ESS methods and technologies are generic and can be applied in many scientific use cases. F4ESS addresses several integration tasks of interdisciplinary research and provides approved methods and technologies under one roof.
Data and software availability statement
The Data Analytics Software Framework (DASF) we developed as basic technology for F4ESS has been published in the Journal of Open Source Software JOSS, https://doi.org/10.21105/joss.04052. The Digital Earth Flood Event Explorer that has been developed exemplarily on the basis of DASF and F4ESS is available under https://doi.org/10.5880/GFZ.1.4.2022.001.
Acknowledgements
We thank our partners in the Digital Earth consortium from the GFZ German Research Center for Geosciences, the GEOMAR Helmholtz Centre for Ocean Research, the Alfred Wegener Institute Helmholtz Center for Polar and Marine Research, the UFZ Helmholtz Center for Environmental Research, the Climate Service Center Germany (GERICS), the Helmholtz-Zentrum Hereon, and the Karlsruhe Institute of Technology for fruitful discussions and suggestions that enabled us to develop the scientific ideas discussed in this paper. Especially we thank Viktoria Wichert, Nicola Abraham, Bente Tiedje, Ulrich Callies and Holger Brix, all Helmholtz-Zentrum Hereon, and Daniela Rabe, German Research Center for Geosciences, for the collaboration with the marine scientists’ workflow. We also thank Kai Schröter, German Research Center for Geosciences and Technische Universität Braunschweig, and Stefan Lüdtke, German Research Center for Geosciences, for the collaboration with the hydrologists’ workflow. A special thanks goes to Roland Ruhnke, Karlsruhe Institute of Technology, and the reviewers who gave helpful remarks to improve the paper. We acknowledge funding from the Initiative and Networking Fund of the Helmholtz Association through the project Digital Earth.
Disclosure statement
No potential conflict of interest was reported by the author(s).
Additional information
Funding
References
- Andrienko, G., N. Andrienko, U. Demar, D. Dransch, J. Dykes, S. Fabrikant, M. Jern, M.-J. Kraak, H. Schumann, and C. Tominski. 2010. “Space, Time and Visual Analytics.” International Journal of Geographic Information Science 24 (10): 1577–1600. https://doi.org/10.1080/13658816.2010.508043.
- Atkinson, M., S. Geins, J. Montagnat, and I. Taylor. 2017. “Scientific Workflows: Past, Present, Future.” Future Generation Computer Systems 75 (2017): 216–227. https://doi.org/10.1080/13658816.2010.508043.
- Australian Academy of Sciences. National Committee for Earth Sciences. 2018. Our Planet, Australia’s Future – A Decade of Transition in Geoscience. A Decadal Plan for Australian Geoscience 2018–27. https://www.science.org.au/files/userfiles/support/reports-and-plans/2018/geoscience-decadal-plan.pdf.
- Boughton, W. C. 1993. “A Hydrograph-Based Model for Estimating the Water Yield of Ungauged Catchments.” In Proceedings of the 1993 Hydrology and Water Resources Symposium. Barton, A.C.T., 317–324. National Conference Publication 93/14. Australia: Institution of Engineers.
- Campello Torres, P. H., and P. R. Jacobi. 2021. Towards A Just Climate Change Resilience: Developing Resilient, Anticipatory and Inclusive Community Response (Palgrave Studies in Climate Resilient Societies). Cham: Palgrave Macmillan. 117 pages
- Cao, Y., and D. P. Ames. 2012. “A Strategy for Integrating Open Source GIS Toolboxes for Geoprocessing and Data Analysis”. Presented at the International Congress on Environmental Modelling and Software (iEMSs). 303. https://scholarsarchive.byu.edu/iemssconference/2012/Stream-B/303.
- Cerezo, N., J. Montagnat, and M. Blay-Fornarino. 2013. “Computer-assisted Scientific Workflow Design.” Journal of Grid Computing 11 (3): 585–612. https://doi.org/10.1007/s10723-013-9264-5.
- Dijkstra, E. W. 1982. On the Role of Scientific Thought. Selected Writings on Computing: A Personal Perspective. New York: Springer.
- Editorial. 2015. “Mind Meld.” Nature 525: 289–290. https://doi.org/10.1038/525289b.
- Eggert, D., D. Rabe, D. Dransch, S. Lüdtke, C. Nam, E. Nixdorf, V. Wichert, N. Abraham, K. Schröter, and B. Merz. 2022b. “The Digital Earth Flood Event Explorer: A Showcase for Data Analysis and Exploration with Scientific Workflows.” GFZ Data Services, https://doi.org/10.5880/GFZ.1.4.2022.001.
- Eggert, D., M. Sips, P. S. Sommer, and D. Dransch. 2022a. “DASF: A Data Analytics Software Framework for Distributed Environments.” Journal of Open Source Software 7 (78): 4052. https://doi.org/10.21105/joss.04052.
- Fang, Z., P. Yue, M. Zhang, J. Xie, D. Wu, and L. Jiang. 2023. “A Service-Oriented Collaborative Approach to Disaster Decision Support by Integrating Geospatial Resources and Task Chain.” International Journal of Applied Earth Observation and Geoinformation 117: 103217. https://doi.org/10.1016/j.jag.2023.103217.
- Forkan, A., A. Both, C. Bellman, M. Duckham, H. Anderson, and N. Radosevic. 2023. “K-span: Open and Reproducible Spatial Analytics Using Scientific Workflows.” Frontiers in Earth Science 11. https://doi.org/10.3389/feart.2023.1130262
- German National Academy of Sciences Leopoldina. 2022. Report on Tomorrow’s Science. Earth System Science – Discovery, Diagnosis, and Solutions in Times of Global Change. Halle (Saale). https://doi.org/10.26164/leopoldina_03_00591.
- Heineman, G. T., and W. T. Councill. 2001. Component-based Software Engineering: Putting the Pieces Together. Boston: Addison-Wesley Professional.
- Hollingsworth, D. 1995. Workflow Management Coalition: The Workflow Reference Model. http://www.workflowpatterns.com/documentation/documents/tc003v11.pdf.
- Jonassen, D. H., M. Tessmer, and W. H. Hannum, eds. 1998. Task Analysis Methods for Instructional Design. New York: Taylor and Francis Group.
- Keim, D. A., F. Mansmann, A. Stoffel, and H. Ziegler. 2009. “Visual Analytics.” In Encyclopedia of Database Systems, edited by L. I. U. L, and M. T. ÖZSU, 3341–3346. Boston: Springer.
- Kirwan, B., and L. Ainsworth ed. 1992. A Guide to Task Analysis. Routledge: Taylor and Francis.
- Kottmeier, C., A. Agnon, D. Al-Halbouni, P. Alpert, U. Corsmeier, T. Dahm, A. Eshel, et al. 2016. “New Perspectives on Interdisciplinary Earth Science at the Dead Sea: The DESERVE Project.” Science of The Total Environment 544 (15): 1045–1058. https://doi.org/10.1016/j.scitotenv.2015.12.003.
- Lange, M., D. Cabana, A. Ebeling, R. Ebinghaus, H. Joerss, L. Rölfer, and L. Celliers. 2023. “Climate-Smart Socially Innovative Tools and Approaches for Marine Pollution Science in Support of Sustainable Development.” Cambridge Prisms: Coastal Futures, 1–20. https://doi.org/10.1017/cft.2023.11.
- Lucidchart. 2022. What is a Workflow Diagram? https://www.lucidchart.com/pages/tutorial/workflow-diagram.
- MacEachren, A. M., and I. Brewer. 2004. “Developing a Conceptual Framework for Visually-Enabled Geocollaboration.” International Journal of Geographical Information Science 18 (1): 1–34. https://doi.org/10.1080/13658810310001596094.
- MacLeod, M. 2018. “What Makes Interdisciplinarity Difficult? Some Consequences of Domain Specificity in Interdisciplinary Practice.” Synthese 195 (2): 697–720. https://doi.org/10.1007/s11229-016-1236-4.
- McIlroy, M. D. 1969. “Mass Produced Software Components.” In Software Engineering: Report of a Conference Sponsored by the NATO Science Committee, Garmisch, Germany, 7–11 October 1968, edited by Scientific Affairs Division, 79. NATO.
- Mîndrescu, M., and S. M. Hutchinson. 2012. “Interdisciplinary Cooperation and Studies in Geoscience in the Carpathian Basin.” Scientific Annals of Stefan cel Mare University of Suceava Geography Series 21 (1): 1–7. https://doi.org/10.4316/GEOREVIEW.2012.21.1.51.
- Munzner, T. 2014. Visualization Analysis and Design: Principles, Techniques, and Practice. Routledge: CRC Press.
- National Academies of Sciences, Engineering, and Medicine. 2020. A Vision for NSF Earth Sciences 2020-2030: Earth in Time. Washington, DC: The National Academies Press.
- Peng, Y., M. Zhang, and Z. Tan. 2015. “A Geoprocessing Workflow System for Environmental Monitoring and Integrated Modelling.” Environmental Environmental Modelling and Software 69 (1), https://doi.org/10.1016/j.envsoft.2015.03.017.
- Roberts, J. C. 2005. “Exploratory Visualization with Multiple Linked Views.” In Exploring Geovisualization, edited by J. Dykes, A. M. MacEachren, and M.-J. Kraak, 159–180. Amsterdam: Elsevier.
- Schraagen, J. M., S. F. Chipman, L. Valerie, and V. L. Shalin ed. 2000. Cognitive Task Analysis. Publons: Psychology Press.
- Shao, Y., K.-H. Wyrwol, A. Chappell, J. Huang, Z. Lin, G. H. McTainsh, M. Mikami, T. Y. Tanaka, X. Wang, and S. Yoon. 2011. “Dust Cycle: An Emerging Core Theme in Earth System Science.” Aeolian Research 2 (4): 181–204. https://doi.org/10.1016/j.aeolia.2011.02.001.
- Spence, R. 2014. Information Visualization: An Introduction. Heidelberg: Springer.
- Steffen, W., K. Richardson, J. Rockström, H. J. Schellnhuber, O. P. Dube, S. Dutreuil, T. M. Lenton, and J. Lubchenco. 2020. “The Emergence and Evolution of Earth System Science.” Nature Reviews Earth & Environment 1 (1): 54–63. https://doi.org/10.1038/s43017-019-0005-6.
- Valcke, S., V. Balaji, A. Craig, C. DeLuca, R. Dunlap, R. W. Ford, R. Jacob, et al. 2012. “Coupling Technologies for Earth System Modelling.” Geoscientifc Model Development 5: 1589–1596. https://doi.org/10.5194/gmd-5-1589-2012.
- White, J. E. 1976. “RFC 707. A High-Level Framework for Network-Based Resource Sharing.” Proceedings of the 1976 National Computer Conference, https://doi.org/10.1145/1499799.1499878.