
 ?Mathematical formulae have been encoded as MathML and are displayed in this HTML version using MathJax in order to improve their display. Uncheck the box to turn MathJax off. This feature requires Javascript. Click on a formula to zoom.
ABSTRACT
Human activities significantly impact the environment. Understanding the patterns and distribution of these activities is crucial for ecological protection. With location-based technology advancement, big data such as location and trajectory data can be used to analyze human activities on finer temporal and spatial scales than traditional remote sensing data. In this study, Qilian Mountain National Park (QMNP) was chosen as the research area, and Tencent location data were used to construct time series data. Time series clustering and decomposition were performed, and the spatio-temporal distribution characteristics of human activities in the study area were analyzed in conjunction with GPS trajectory data and land use data. The study found two distinct human activity patterns, Pattern A and Pattern B, in QMNP. Compared to Pattern B, Pattern A had a higher volume of location data and clear nighttime peaks. By incorporating land use and trajectory data, we conclude that Pattern A and Pattern B represent the activity patterns of the resident and tourist populations, respectively. Moreover, the study identified seasonal variations in human activities, with human activity in summer being approximately two hours longer than in winter. We also conducted an analysis of human activities in different counties within the study area.
1. Introduction
Human activities in mountain areas, varying in intensity and type, have diverse impacts on the ecological environment (Han and Li Citation2019; Kubíček et al. Citation2019; Peng et al. Citation2021; Xiang et al. Citation2022). Understanding the temporal and spatial patterns of these activities is essential for effective environmental management. Tourism, a significant pattern of local human activity, can influence the ecology as well as residents’ activities (Francis et al. Citation2017; Gallardo, Zieritz, and Aldridge Citation2015; Gladstone, Curley, and Shokri Citation2013; Ping, Jiang, and Li Citation2011; Sun et al. Citation2020; van Zanten et al. Citation2016; Wang et al. Citation2021). The habitual activities of residents, primarily encompassing agriculture and animal husbandry, contribute to a certain degree of grassland destruction, leading subsequently to issues such as grassland degradation (Chen, Shi, and Cao Citation2015; Zhang et al. Citation2018). Furthermore, the development and execution of tourism activities in mountainous regions can influence the vegetation communities in the vicinity of these tourism areas. The progression of the tourism industry, marked by the creation of extensive infrastructure such as parking lots and visitor service centers, may also potentially have an impact on the ecological environment (Li et al. Citation2021). Since tourists and local residents exhibit different activity patterns in terms of time and area, their environmental impacts also vary. Thus, investigating the similarities and differences between tourist and local resident activities has significant value for sustainable environmental protection in mountainous regions.
Traditional approaches for studying human activities and their environmental impacts have relied on census data and tourism statistics (Yang Citation2019). However, these data sources offer limited spatial and temporal granularity, making it difficult to analyze activity patterns and distributions on a fine scale (Yi, Du, and Tu Citation2019). Recent advances in nighttime light data and location-based services (LBS) data provide new opportunities to extract detailed human activity features (Shi, Yang, and Li Citation2019; Zhao et al. Citation2018). Nighttime light data have been used as a proxy for studying the spatio-temporal characteristics of human activities (Sutton et al. Citation2001; Zhang et al. Citation2017; Zhao et al. Citation2019; Zhao, Zhou, and Samson Citation2015), enabling researchers to examine human settlement dynamics at finer scales (Zheng et al. Citation2017). However, this data source has limitations in capturing sub-daily scale characteristics and sparsely distributed human activity areas, such as mountain villages (Ma Citation2018).
LBS data, generated by smartphones and social media check-ins, have emerged as a valuable resource for understanding human activities (Cheng et al. Citation2021; Kubíček et al. Citation2019; Mao et al. Citation2016; Ratti et al. Citation2006; Seidl, Jankowski, and Tsou Citation2016; Shi et al. Citation2022; Wang et al. Citation2012; Wu et al. Citation2020; Zhao et al. Citation2017). These data sources offer the potential to enhance the accuracy of human activity research and enable fine-scale analysis (Fan et al. Citation2022; He et al. Citation2022; Kim, Helal, and Cook Citation2010; Shum et al. Citation2022; Yu et al. Citation2021). Numerous studies have delved into the spatio-temporal distribution of LBS data, thereby gaining intricate insights into the characteristics of human activities, such as identifying socially significant locations (Celik and Dokuz Citation2017; Dokuz Citation2022) and elucidating anomalous daily activities (Dokuz and Celik Citation2017). Chen et al. (Citation2018) employed mobile phone records to create a neural network model for high-precision urban population mobility predictions, while Zheng et al. (Citation2017) utilized Tencent location data combined with nighttime light data to extract accurate urban built-up area boundaries. Additionally, Yi, Du, and Tu (Citation2019) analyzed the spatial and temporal characteristics of the population distribution on the Qinghai-Tibet Plateau during a festival using Tencent location data.
In current research using location-based data to study human activities, the focus is often placed on overall human activities or specific types of activities. However, there is limited research attempting to distinguish different human activity patterns using geographic location data. Additionally, most of the studies on human activities tend to concentrate on economically developed, densely populated urban areas, while research on high-altitude mountain areas is scarce. High-altitude mountain regions are characterized by sparse population distribution and underdeveloped infrastructure, which make it challenging to obtain sufficient and reliable location data. In contrast to plain areas, human activities in high-altitude mountainous areas are more likely to be influenced by natural factors, such as terrain and rivers, rather than economic or transportation factors.
Qilian Mountain National Park (QMNP) is situated in the northeastern part of the Qinghai-Tibet Plateau, serving as an essential ecological function area and a renowned tourist attraction in China (Duan et al. Citation2021; Liu et al. Citation2003; Peng et al. Citation2021). Over at least the past decade, the ecological environment of QMNP has been severely damaged due to human activities such as exploration and mining, garnering widespread attention (Li et al. Citation2021). In QMNP, the characteristics of human activities are influenced by factors such as terrain, altitude, and traffic conditions, which differ from those in cities.
In this study, we utilized Tencent location data and travel trajectory data to examine human activities in QMNP. We analyzed the distribution characteristics of location data and travel trajectories within the park. Using the location data, we constructed time series of human activities and conducted clustering on the time series to identify distinct human activity patterns. Then we interpreted these patterns in conjunction with land use data and trajectory data. Finally, we applied time series decomposition to investigate and summarize the spatiotemporal distribution characteristics of human activity features in extended time series.
2. Data and study area
2.1. Study area: Qilian Mountain National Park (QMNP)
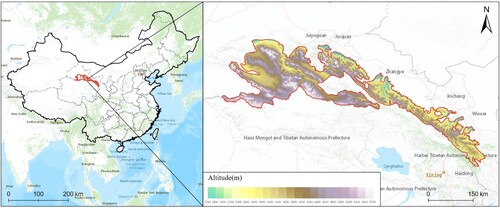
QMNP, located in the arid region of Northwest China, is a vast protected area with a total area of approximately 5 million hectares and an average elevation of 3,760 meters in . This region is characterized by a typical temperate continental mountain climate. In QMNP, there are croplands and pastures, and the residents make a living mainly through agriculture or animal husbandry. QMNP is also a famous tourist destination, attracting many visitors with its natural beauty.
Figure 1. The location of QMNP.
2.2. Tencent location data
Tencent Location Service is an example of a location-based service (LBS) and is widely used in China, including products such as QQ, WeChat, and Tencent Maps. Whenever users access LBSs through these products, they generate location data that contain information on time and user location (Zhang et al. Citation2020). Tencent location data consist of the total number of location requests, aggregated hourly within a 0.01° × 0.01° grid of latitude and longitude, based on the information provided by cell phone users when using Tencent Maps location services. These data include date, time, latitude, longitude, and the number of location requests.
Considering the possible impact of the COVID-19 pandemic on human activities, we collected Tencent location data in the study area from March 2018 to January 2019 before the outbreak. We identified a small number of outlier points in the collected data, which were caused by errors in the Tencent data collection mechanism. We divided QMNP into 10 km × 10 km grids and used the threshold method to initially clean the data. We counted the number of locations within each grid throughout the year and filtered out areas with too few total locations throughout the year by specifying a threshold of 100. After processing, we obtained a total of 79,406 location data points for 362 positioning grids.
2.3. 2bulu Outdoor Travel website
The 2bulu Outdoor Travel website (https://www.2bulu.com/) is a popular interactive platform in China used for sharing outdoor resources and connecting with communities (Mou et al. Citation2022). The website collects and shares outdoor tracks voluntarily recorded by Chinese travelers through the 2bulu Outdoor Assistant app. These tracks are composed of GPS data points and can be linked to photos uploaded by tourists on the website. As the main users of the website are travel enthusiasts, the trajectories shared are mostly travel trajectories.
For this study, we obtained 18,069 GPS trajectories shared by tourists in Gansu Province and Qinghai Province from January 2009 to August 2022 from the 2bulu Outdoor Travel website. These data contained attribute information such as TrackId (individual journey), Username (uploader ID), total track length, time, trip description, and trip start and end points ().
Table 1. Example data of GPS trajectory.
GPS trajectories can be affected by various factors during the acquisition process, leading to data errors. Therefore, we cleaned the acquired trajectories through the following steps. First, we removed duplicate tracks resulting from repeated data collection or crawling. Second, some areas in mountainous regions had poor signal coverage, leading to a straight line between two points due to signal loss, resulting in a trajectory passing through areas it did not actually pass through. We used a threshold of 5 km to delete trajectories with distances between adjacent localization points exceeding the threshold. Third, we filtered only the trajectories within and near the study area since the data could be searched only by province during the acquisition process. After data cleaning, a total of 1554 trajectories were obtained for further analysis in the study area.
2.4. Land use data
Various human activities can impact the types of land use within a particular region, with dense residential areas often featuring larger areas of cropland and construction land. This study employed land use data to investigate human activities in QMNP, using the areas of arable land and built-up land in the dataset to illustrate the characteristics of different human activities in the park. The land use data were obtained from the Resource and Environment Science Data Registration and Publication System. These data were manually interpreted using Landsat remote sensing image data as the data source, with the time frame being 2018 (Xu et al. Citation2018). The study employed a first-level classification, which included arable land, forestland, grassland, water, built-up land, and unused land.
3. Methods
3.1. Time series construction of location data
In this study, we constructed hourly and daily time series to investigate the characteristics of human activities in QMNP, with a location data accuracy of 0.01°×0.01°, approximately 1 km × 1 km. Due to potential errors in the acquisition process and low location volumes in some mountainous areas, we aggregated Tencent location data into 10 km × 10 km grids to better identify population activity patterns when constructing the intraday location number time series. To construct the intraday location time series, we calculated the total location volume of each grid cell for every hour of a day and constructed the corresponding time series. Grid cells with a median and absolute median deviation (MAD) of 0 were removed after construction. The MAD is defined as follows:
(1)
(1) where
represents the time series of location data for the grid cell;
represents the location data volume at hour
. In the presence of outliers, MAD is more robust than the commonly used median and mean in screening outliers.
In this study, location data from several counties, where human activities were mainly distributed in QMNP, were aggregated as the study unit. The average amount of location data per day in each county was calculated, and time series were constructed. These time series were then decomposed to study the overall trend of human activities in QMNP over the past year.
3.2. Time series clustering
To investigate the distinct patterns of daily human activities in QMNP, we utilized contour clustering to analyze the correlation between time series constructed from Tencent location data. This method was employed to group time series exhibiting similar increasing or decreasing trends into a single class, which allowed for the identification of areas with similar activity patterns.
For any two time series, and
, at any two positions, their Pearson correlation coefficients,
, were calculated as follows:
(2)
(2) where
is the covariance of
and
, and
and
represent the variance of
and
. The larger the correlation coefficient is, the stronger the correlation between the two time series. Then, the distance
of each two time series is calculated:
(3)
(3) The distance calculated by this formula results in a distance of 0 between two perfectly correlated time series, a distance of 1 between two perfectly uncorrelated time series, and a distance of 2 between two perfectly negatively correlated time series. All degrees of correlation will generate values in the interval [0,2], and the smaller the value is, the higher the degree of similarity. For the time series
… …
, a similarity matrix is created using the distance values between every two time series, and
represents the distance between
and
.
(4)
(4) The matrix was clustered using the K-means algorithm. In this method, random positions are selected as initial centroids for each cluster. Then, all other positions are assigned to the cluster whose centroid is most similar, creating initial clusters. Next, the centroids are recalculated based on the members of each cluster, and positions are reassigned to the clusters. If the new clusters change, the centroids are recalculated, and the process is repeated until no more changes occur in the clusters.
3.3. Time series decomposition
To explore the characteristics of human activities in QMNP throughout the year, this paper employed the method of time series decomposition. The time series X(t), which consisted of daily localization quantities in QMNP, was decomposed additively using the seasonal and trend decomposition using the Loess (STL) method proposed by Cleveland et al. (Citation1990). This method extracts trend terms, seasonal terms, and residual components, and the additive model is expressed as follows:
(5)
(5) where
is the trend term,
is the seasonal term, and
is the residual term.
The STL method was used to extract the trend and seasonal terms of the time series through recursive computation of multiple inner and outer loops. In the inner-loop computation, the time series was first decomposed into cycle-sub-series. Then, the initial seasonal term C(t) was obtained by Loess (locally weighted regression) smoothing, and the initial trend term L(t) was obtained by low-pass filtering. The S(t) of this cycle was obtained by subtracting L(t) from C(t). Finally, the trend term T(t) of this cycle was obtained by subtracting S(t) from X(t) and then performing Loess smoothing once. The outer loop calculation mainly assigns robustness weights to each value based on the size of the residual term to improve the robustness of the inner loop calculation to anomalies. The time series decomposition is completed by iterative computation of inner and outer loops until the trend term or seasonal term converges invariably. The pseudocode of the STL algorithm is presented in Algorithm 1.
Table
4. Results and discussion
4.1. Distribution characteristics of location data and trajectory data in QMNP
4.1.1. Location data
Through the analysis of location data, we can gain insights into the population distribution characteristics of QMNP. In (a), high-value location data were concentrated primarily in Tianzhu and Menyuan Counties in the eastern part of QMNP and some points were found in Sunan and Minle Counties in the central part. Furthermore, (a) elucidates that the location data are frequently distributed in proximity to roads and administrative centers such as prefecture-level cities and counties.
Figure 2. Distribution of location data in the QMNP (a) and the proportion of location data in different counties (b).
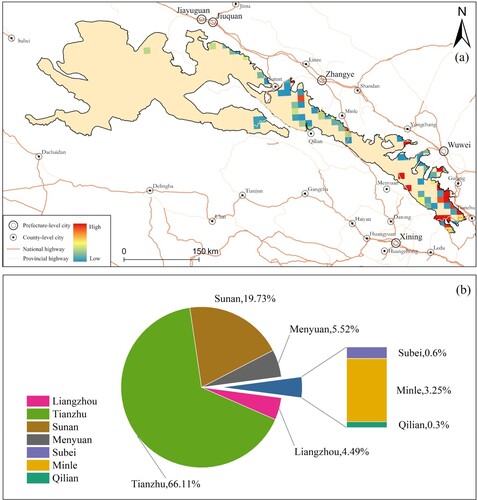
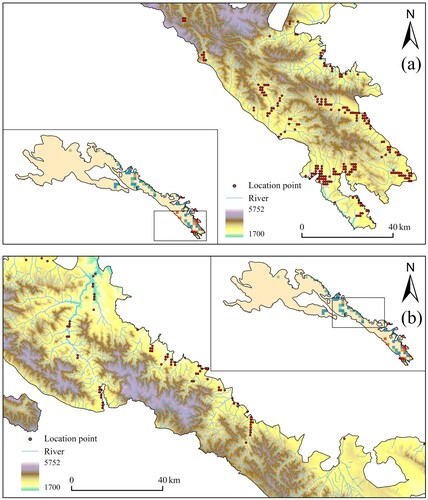
(b) indicates that the two counties with the highest number of location data were Tianzhu (66.11%) and Sunan (19.73%) in the eastern part of the park. These counties are mainly inhabited by ethnic minorities, and their primary economic activities are agriculture and animal husbandry. The remaining location data were distributed among Menyuan County (5.52%), Liangzhou District (4.49%), and other counties. Based on the topography and location data distribution shown in , human activities in the QMNP tend to be concentrated in low-elevation areas with gentle terrain and proximity to rivers.
Figure 3. Eastern (a) and central sections (b) of the QMNP.
4.1.2. Trajectory data
Tourism is a crucial human activity, and as most users of the 2bulu Outdoor Travel website are outdoor enthusiasts, the trajectories they share mostly consist of tourism data. By analyzing these data, we can gain insights into the distribution characteristics of tourism activities in QMNP. illustrates the distribution of GPS trajectory data in and around QMNP. The trajectories were primarily along highways and were distributed throughout the eastern, central, and western parts, with the highest concentration of data in the central part. The endpoints and description attributes of the trajectories indicated the travel purposes of the tourists. In QMNP, tourists usually visit multiple scenic spots in Gansu and Qinghai Provinces in the same trajectory, which is known as self-driving travel.
Figure 4. GPS track density distribution.
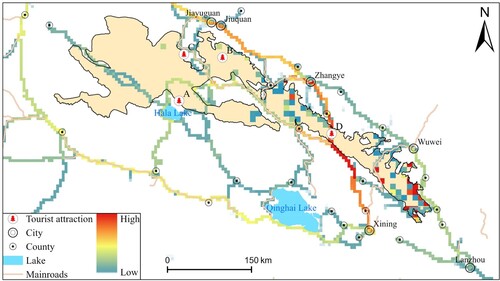
shows that a circular travel trajectory was formed around QMNP, connecting 14 cities in Gansu and Qinghai Provinces. By overlaying the roads with this circular trajectory, a travel route in Gansu and Qinghai Provinces can be found, which we call the Gansu-Qinghai Great Ring Road. Tourists often start from a certain city, drive through part of the ring line, and then enter QMNP to visit scenic spots in or around the park.
According to the travel purpose(s) of the travelers, A, B, C, and D marked in are the most visited tourist attractions in the QMNP. A represents Tuanjie Peak, the highest peak of the Qilian Mountains, which rises to over 5800 m above sea level, with extensive ice and snow coverage and a large area of modern glaciers. B and C represent two famous glaciers near QMNP, Bayi Glacier and Qiyi Glacier. When traveling in the northern section of the QMNP, tourists often visit these attractions comprehensively, such as starting from Jiayuguan or Jiuquan, going south through QMNP between Qiyi Glacier and Bayi Glacier, and then moving westward to Tuanjie Peak and Hala Lake or heading east to Qinghai Lake. D is part of the G227 highway in QMNP. This highway is known as the most beautiful highway in China. This highway is also the area with the largest number of trajectories in the QMNP. Most tourists start from Zhangye, pass through QMNP on the G227 highway and then head south to Xining or west to Qinghai Lake via other highways.
4.2. Daily patterns of human activity in QMNP
To analyze the population activity patterns and distribution characteristics of QMNP during different times of the day, the location data from 2018 to 2019 were summed at each hour in different grids and clustered. Two major patterns of population activities (Pattern A and Pattern B) were identified through time series clustering (as shown in ). In Pattern A, the volume of location data increased from 5:00 to 8:00 and remained relatively stable thereafter. It reached its highest peak of the day at 21:00 and then continued to decline, reaching the lowest point at 5:00 the next day. In Pattern B, the location data also increased from 5:00 to 8:00, remained stable from 8:00 to 21:00, and then continued to decline until 5:00 the next day. However, the average volume of location data in Pattern B was significantly lower than that in Pattern A.
Figure 5. Different population activity patterns.
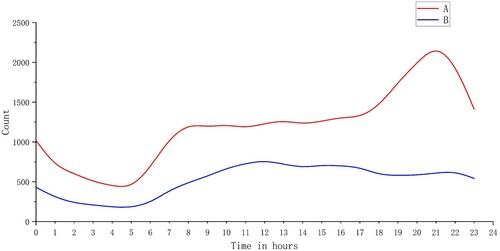
In Pattern A, the peak after 17:00 indicated strong nocturnal activity, suggesting that many people were in this area at night. Frequent nighttime activities suggested that the human population in this area consisted mainly of residents and that human activities were mainly daily activities. After 17:00, people used their mobile phones for entertainment, such as social networking and gaming, after completing their daily work. Tencent services hold a significant share of the social and gaming market data, and their frequent use led to the peak in location data at night.
Pattern B had a lower average location data volume than Pattern A, indicating a smaller human population in this pattern. Unlike Pattern A, the absence of nighttime peaks in Pattern B suggested a lower level of nocturnal activity, further implying a smaller resident population in this area. The daytime location data volume in Pattern B may correspond to activities such as travel or work. It is worth noting that QMNP tourist attractions mostly consist of natural landscapes located away from highways, with limited facilities and poor accommodation conditions. Therefore, tourists tend to stay in nearby towns rather than within the park, resulting in the absence of nighttime peaks in location data.
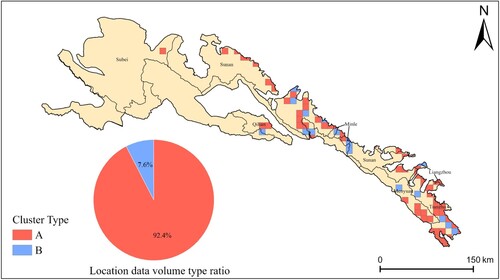
As seen in , the human activity pattern in QMNP was dominated by Pattern A (daily activities), which accounted for 92.4% of all location data. Both Pattern A and Pattern B were primarily concentrated in the eastern and central sections of QMNP.
Figure 6. Distribution of different population activity patterns.
4.3. Land use types and trajectory distribution of different patterns in the QMNP
The lifestyle of the permanent residents in QMNP is primarily based on cultivation and animal husbandry, so the area of arable land and built-up land within a region can reflect the activity intensity of the resident population to a certain extent. Meanwhile, tourism trajectory data can reflect human travel activities. Therefore, we superimposed human activity pattern data with land use types and trajectory data, then calculated the average trajectory quantity, arable land area, and built-up land area for each grid. The results are shown in .
Table 2. Statistical analysis of land use and trajectory data in different patterns.
shows that the average area of arable and built-up land was significantly higher in areas with Pattern A than in areas with Pattern B. However, the number of tourism trajectories was significantly higher in Pattern B areas than in Pattern A areas. This result further indicated that the time characteristics of Pattern A represented the activities of permanent residents, while the time characteristics of Pattern B represented the activities of tourists.
Upon comparison of location and trajectory data, it was found that the eastern section of QMNP had a concentrated distribution of location data. The large amount of location data in this area suggests a dense population. The population activity pattern mainly consists of Pattern A, indicating that the eastern section was the primary distribution area of the park's resident population. In contrast, Pattern B in the central section was mainly distributed in areas where major highways pass, such as the G227 National Road (shown in at point D). This indicats both a high level of population mobility and tourism behavior, along with a smaller resident population. The remaining distribution area of Pattern A was located in the northwest of QMNP, with a population consisting mostly of permanent residents.
4.4. Long-term characteristics of human activities in QMNP
To investigate the seasonal differences in human activities in QMNP, we further divided the location data in Pattern A areas into different seasons and calculated the changes in the volume of location data within the daily activity areas over a 24-hour period (shown in ).
Figure 7. Variation in intraday location data in different seasons (Pattern A).
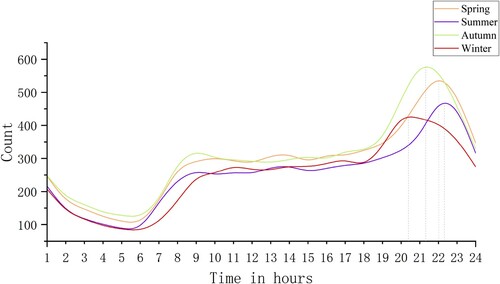
The daily activity period for most people is from morning until nightfall. The rising nodes of location data in the morning were delayed by an hour from summer to winter, and human activity in summer was approximately two hours longer than that in winter. This delay may be due to differences in temperature and duration of sunshine across seasons. QMNP is located in a continental climate zone, which experiences large diurnal temperature changes. In summer, longer daylight hours and warmer temperatures are more conducive to human activities.
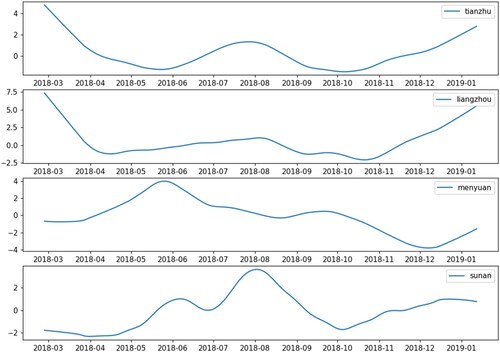
Based on location data distribution statistics, the seasonal trend decomposition procedure (STL) was performed for the counties (Tianzhu, Sunan, Menyuan, Liangzhou) where the main human activities were concentrated in QMNP. The trend terms from the decomposition results revealed the similarities and differences in human activity trends among different counties throughout the year.
As shown in , Tianzhu County, Liangzhou District, and Menyuan County are all located in the eastern part of QMNP and are the main distribution areas of the park's resident population. Their population activity time series showed certain similarities, with all three regions exhibiting a rising period at the end of the year. This increase is attributed to changes in human production activities during winter, as the main industries in these regions are agriculture. After winter crops were harvested, the intensity of production activities decreased, giving people more time for leisure activities. During the 2019 Chinese Lunar New Year in February, many people returned to their hometowns for the festival, resulting in a peak in location data volume due to increased leisure time. Sunan County in QMNP has a sparse resident population, and its human activity pattern mainly followed Pattern B, consisting of mostly tourist activity. Therefore, there was no significant peak in winter. Summer is the tourist season in Sunan, with a clear peak period in July and August.
Figure 8. Decomposition results of the time series in different counties.
Conclusion
In this study, we analyzed the spatial and temporal distribution characteristics of human activities in QMNP using location data and trajectory data. Firstly, we conducted grid aggregation to study the spatial distribution patterns of the data. Secondly, we constructed time series from location data to cluster the time patterns within a day. Through clustering, we identified two main human activity patterns (Patterns A and B). Pattern A represented the daily activities of the resident population, while Pattern B mainly reflected tourism behaviors. This distinction between Patterns A and B was validated by trajectory data and land use data. Finally, we studied the long-term characteristics of human activities. By comparing the differences in Pattern A during different seasons, we found that summer was the peak season for human activities, as summer has longer daylight hours and higher temperatures, contributing to more activities. In this study, the location data for Pattern A accounted for 92.4% of the total data, while Pattern B represented a smaller proportion of 7.6%. In the region delineated by Pattern A, the area of arable land and built-up land amounted to 143.41 and 6.89 hectares, respectively, with a count of 13.03 trajectory instances. Conversely, the corresponding figures for Pattern B showed an area of arable land and built-up land of 57.36 and 3.60 hectares, respectively, and a significantly higher trajectory count of 48.74 instances. We also used the STL time series decomposition method to decompose the long-term time series of the main counties with human populations. We found that the intensity of human activities in different counties varied at different times of the year, which may be related to their different modes of production and living.
Given the disparities in the spatio-temporal distribution characteristics of touristic and quotidian behaviors, the potential environmental implications differ correspondingly. Notably, in QMNP, over 90% of human activities constituted daily activities. Consequently, the environmental ramifications arising from the practices of the resident population-such as grazing and farming-are of paramount importance and demand significant consideration. To mitigate potential detrimental impacts, it would be advantageous to implement environmental monitoring, afforestation, and conversion of farmland to forests and grasslands in densely populated areas, such as Tianzhu. With respect to touristic behaviors, attention should be concentrated on the hotspots and peak seasons of tourism. For instance, monitoring the activities of tourists near primary thoroughfares and high-traffic scenic spots during the tourism season is critical to circumvent significant disruptions to the adjacent ecological environment.
Our findings suggest that the distribution of location data and trajectory data can provide valuable insights into the spatial and temporal patterns of human activities in high-altitude mountainous areas. By understanding the characteristics of human activities in different regions and seasons, policymakers can make informed decisions to promote sustainable tourism development and protect the natural and cultural resources of parks. Location-based big data are rapidly acquired and contain a large amount of population activity information, which is conducive to the exploration of human activities. This study shows that it is feasible to mine and distinguish different human activity patterns from big data. However, due to data resolution and division scale, only two relatively coarse patterns were obtained. Future work should reduce the spatial scale and combine multiple data sources to conduct detailed research on Pattern A, distinguishing between permanent residents with different lifestyles, such as farming and grazing.
Acknowledgements
The authors give their appreciation to Professor Min Feng for the valuable suggestions and guidance provided for this paper.
Disclosure statement
No potential conflict of interest was reported by the author(s).
Data availability statement
The data used in this study are available by contacting the corresponding author.
Additional information
Funding
References
- Celik, Mete, and Ahmet Sakir Dokuz. 2017. “Discovering Socio-Spatio-Temporal Important Locations of Social Media Users.” Journal of Computational Science 22: 85–98. https://doi.org/10.1016/j.jocs.2017.09.005.
- Chen, J., T. Pei, S. L. Shaw, F. Lu, M. X. Li, S. F. Cheng, X. L. Liu, and H. C. Zhang. 2018. “Fine-Grained Prediction of Urban Population Using Mobile Phone Location Data.” International Journal of Geographical Information Science 32 (9): 1770–1786. https://doi.org/10.1080/13658816.2018.1460753.
- Chen, J., W. Shi, and J. Cao. 2015. “Effects of Grazing on Ecosystem CO2 Exchange in a Meadow Grassland on the Tibetan Plateau During the Growing Season.” Environmental Management 55 (2): 347–359. https://doi.org/10.1007/s00267-014-0390-z.
- Cheng, X. M., Z. Q. Wang, X. X. Yang, L. Y. Xu, and Y. Liu. 2021. “Multi-Scale Detection and Interpretation of Spatio-Temporal Anomalies of Human Activities Represented by Time-Series.” Computers Environment and Urban Systems 88, https://doi.org/10.1016/j.compenvurbsys.2021.101627.
- Cleveland, Robert B, William S Cleveland, Jean E McRae, and Irma Terpenning. 1990. “STL: A Seasonal-Trend Decomposition.” Journal of Official Statistics 6 (1): 3–73.
- Dokuz, Ahmet Sakir. 2022. “Social Velocity Based Spatio-Temporal Anomalous Daily Activity Discovery of Social Media Users.” Applied Intelligence 52 (3): 2745–2762. https://doi.org/10.1007/s10489-021-02535-8.
- Dokuz, Ahmet Sakir, and Mete Celik. 2017. “Discovering Socially Important Locations of Social Media Users.” Expert Systems with Applications 86: 113–124. https://doi.org/10.1016/j.eswa.2017.05.068.
- Duan, Q. T., L. H. Luo, W. Z. Zhao, Y. L. Zhuang, and F. Liu. 2021. “Mapping and Evaluating Human Pressure Changes in the Qilian Mountains.” Remote Sensing 13 (12), https://doi.org/10.3390/rs13122400.
- Fan, R. Y., J. Li, W. J. Song, W. Han, J. N. Yan, and L. Z. Wang. 2022. “Urban Informal Settlements Classification via a Transformer-Based Spatial-Temporal Fusion Network Using Multimodal Remote Sensing and Time-Series Human Activity Data.” International Journal of Applied Earth Observation and Geoinformation, https://doi.org/10.1016/j.jag.2022.102831.
- Francis, C. D., P. Newman, B. D. Taff, C. White, C. A. Monz, M. Levenhagen, A. R. Petrelli, et al. 2017. “Acoustic Environments Matter: Synergistic Benefits to Humans and Ecological Communities.” Journal of Environmental Management 203: 245–254. https://doi.org/10.1016/j.jenvman.2017.07.041.
- Gallardo, B., A. Zieritz, and D. C. Aldridge. 2015. “The Importance of the Human Footprint in Shaping the Global Distribution of Terrestrial, Freshwater and Marine Invaders.” PloS One 10 (5), https://doi.org/10.1371/journal.pone.0125801.
- Gladstone, W., B. Curley, and M. R. Shokri. 2013. “Environmental Impacts of Tourism in the Gulf and the Red Sea.” Marine Pollution Bulletin 72 (2): 375–388. https://doi.org/10.1016/j.marpolbul.2012.09.017.
- Han, F. L., and C. T. Li. 2019. “Environmental Impact of Tourism Activities on Ecological Nature Reserves.” Applied Ecology and Environmental Research 17 (4): 9483–9492. https://doi.org/10.15666/aeer/1704_94839492.
- He, X., Y. T. Zhu, P. P. Chang, and C. S. Zhou. 2022. “Using Tencent User Location Data to Modify Night-Time Light Data for Delineating Urban Agglomeration Boundaries.” Frontiers in Environmental Science 10, https://doi.org/10.3389/fenvs.2022.860365.
- Kim, E., S. Helal, and D. Cook. 2010. “Human Activity Recognition and Pattern Discovery.” IEEE Pervasive Computing 9 (1): 48–53. https://doi.org/10.1109/MPRV.2010.7.
- Kubíček, Petr, Milan Konečný, Zdeněk Stachoň, Jie Shen, Lukáš Herman, Tomáš Řezník, Karel Staněk, Radim Štampach, and Šimon Leitgeb. 2019. “Population Distribution Modelling at Fine Spatio-Temporal Scale Based on Mobile Phone Data.” International Journal of Digital Earth 12 (11): 1319–1340. https://doi.org/10.1080/17538947.2018.1548654.
- Li, Z. X., F. Qi, Z. J. Li, X. F. Wang, G. Juan, B. J. Zhang, Y. C. Li, et al. 2021. “Reversing Conflict between Humans and the Environment – The Experience in the Qilian Mountains.” Renewable & Sustainable Energy Reviews 148, https://doi.org/10.1016/j.rser.2021.111333.
- Liu, J. Y., M. L. Liu, D. F. Zhuang, Z. X. Zhang, and X. Z. Deng. 2003. “Study on Spatial Pattern of Land-use Change in China during 1995-2000.” Science in China Series D-Earth Sciences 46 (4): 373–37+. https://doi.org/10.1360/03yd9033.
- Ma, T. 2018. “Multi-Level Relationships between Satellite-Derived Nighttime Lighting Signals and Social Media-Derived Human Population Dynamics.” Remote Sensing 10 (7), https://doi.org/10.3390/rs10071128.
- Mao, L., L. Yin, X. Q. Song, and S. J. Mei. 2016. “Mapping Intra-Urban Transmission Risk of Dengue Fever with big Hourly Cellphone Data.” Acta Tropica 162: 188–195. https://doi.org/10.1016/j.actatropica.2016.06.029.
- Mou, N. X., Z. W. Liu, Y. H. Zheng, T. Makkonen, T. F. Yang, and L. X. Zhang. 2022. “Cycling in Tibet: An Analysis of Tourists’ Spatiotemporal Behavior and Infrastructure.” Tourism Management 88, https://doi.org/10.1016/j.tourman.2021.104418.
- Peng, Q., R. H. Wang, Y. L. Jiang, and C. Li. 2021. “Contributions of Climate Change and Human Activities to Vegetation Dynamics in Qilian Mountain National Park, Northwest China.” Global Ecology and Conservation 32, https://doi.org/10.1016/j.gecco.2021.e01947.
- Peng, K., Y. F. Zhang, W. F. Gao, and Z. Lu. 2021. “Evaluation of Human Activity Intensity in Geological Environment Problems of Ji’nan City.” European Journal of Remote Sensing 54: 117–121. https://doi.org/10.1080/22797254.2020.1771214.
- Ping, X. G., Z. G. Jiang, and C. W. Li. 2011. “Status and Future Perspectives of Energy Consumption and its Ecological Impacts in the Qinghai-Tibet Region.” Renewable and Sustainable Energy Reviews 15 (1): 514–523. https://doi.org/10.1016/j.rser.2010.07.037.
- Ratti, C., D. Frenchman, R. M. Pulselli, and S. Williams. 2006. “Mobile Landscapes: Using Location Data from Cell Phones for Urban Analysis.” Environment and Planning B: Planning and Design 33 (5): 727–748. https://doi.org/10.1068/b32047.
- Seidl, Dara E., Piotr Jankowski, and Ming-Hsiang Tsou. 2016. “Privacy and Spatial Pattern Preservation in Masked GPS Trajectory Data.” International Journal of Geographical Information Science 30 (4): 785–800. https://doi.org/10.1080/13658816.2015.1101767.
- Shi, K. F., Q. Y. Yang, and Y. Q. Li. 2019. “Are Karst Rocky Desertification Areas Affected by Increasing Human Activity in Southern China? An Empirical Analysis from Nighttime Light Data.” International Journal of Environmental Research And Public Health 16 (21), https://doi.org/10.3390/ijerph16214175.
- Shi, Qingli, Li Zhuo, Haiyan Tao, and Qiuping Li. 2022. “Mining Hourly Population Dynamics by Activity Type Based on Decomposition of Sequential Snapshot Data.” International Journal of Digital Earth 15 (1): 1395–1416. https://doi.org/10.1080/17538947.2022.2110290.
- Shum, L. C., R. Faieghi, T. Borsook, T. Faruk, S. Kassam, H. Nabavi, S. Spasojevic, J. Tung, S. S. Khan, and A. Iaboni. 2022. “Indoor Location Data for Tracking Human Behaviours: A Scoping Review.” Sensors 22 (3), https://doi.org/10.3390/s22031220.
- Sun, Y. X., S. L. Liu, F. N. Shi, Y. An, M. Q. Li, and Y. X. Liu. 2020. “Spatio-Temporal Variations and Coupling of Human Activity Intensity and Ecosystem Services Based on the Four-Quadrant Model on the Qinghai-Tibet Plateau.” Science of The Total Environment 743, https://doi.org/10.1016/j.scitotenv.2020.140721.
- Sutton, P., D. Roberts, C. Elvidge, and K. Baugh. 2001. “Census from Heaven: An Estimate of the Global Human Population Using Night-Time Satellite Imagery.” International Journal of Remote Sensing 22 (16): 3061–3076. https://doi.org/10.1080/01431160010007015.
- van Zanten, Boris T., Derek B. Van Berkel, Ross K. Meentemeyer, Jordan W. Smith, Koen F. Tieskens, and Peter H. Verburg. 2016. “Continental-scale Quantification of Landscape Values Using Social Media Data.” Proceedings of the National Academy of Sciences 113 (46): 12974–12979. https://doi.org/10.1073/pnas.1614158113.
- Wang, P., T. Hunter, A. M. Bayen, K. Schechtner, and M. C. Gonzalez. 2012. “Understanding Road Usage Patterns in Urban Areas.” Scientific Reports 2, https://doi.org/10.1038/srep01001.
- Wang, Y., C. S. Wu, F. F. Wang, Q. Y. Sun, X. F. Wang, and S. X. Guo. 2021. “Comprehensive Evaluation and Prediction of Tourism Ecological Security in Droughty Area National Parks – A Case Study of Qilian Mountain of Zhangye Section, China.” Environmental Science and Pollution Research 28 (13): 16816–16829. https://doi.org/10.1007/s11356-020-12021-2.
- Wu, Lun, Ximeng Cheng, Chaogui Kang, Di Zhu, Zhou Huang, and Yu Liu. 2020. “A Framework for Mixed-use Decomposition Based on Temporal Activity Signatures Extracted from Big Geo-Data.” International Journal of Digital Earth 13 (6): 708–726. https://doi.org/10.1080/17538947.2018.1556353.
- Xiang, M. S., S. H. Zhang, Q. Y. Ruan, C. H. Tang, and Y. Zhao. 2022. “Definition and Calculation of Hierarchical Ecological Water Requirement in Areas with Substantial Human Activity-A Case Study of the Beijing-Tianjin-Hebei Region.” Ecological Indicators 138, https://doi.org/10.1016/j.ecolind.2022.108740.
- Xu, X., J. Liu, S. Zhang, R. Li, C. Yan, and S. Wu. 2018. “China Many Periods of Land Use Land Cover Remote Sensing Monitoring Data Set (CNLUCC), Chinese Academy of Sciences, Resources and Environment Science Data Center Data Registration and Publication System. 2018.” Resource and Environmental Science Data Registration and Publishing System, https://doi.org/10.12078/2018070201.
- Yang, Chengzhou. 2019. “Research on Characteristics and Models of Population Flow in Tibet.” Journal of Arid Land Resources and Environment 33 (07): 43–48. https://doi.org/10.13448/j.cnki.jalre.2019.196.
- Yi, Jiawei, Yunyan Du, and Wenna Tu. 2019. “Spatiotemporal Pattern of Population Distribution in the Qinghai-Tibet Plateau During the National Day Holidays: Based on Geospatial Big Data Mining.” Journal of Geo-Information Science 21 (09): 1367–1381. https://doi.org/10.12082/dqxxkx.2019.190067.
- Yu, M. Y., J. Q. Li, Y. Q. Lv, H. Q. Xing, and H. M. Wang. 2021. “Functional Area Recognition and Use-Intensity Analysis Based on Multi-Source Data: A Case Study of Jinan, China.” ISPRS International Journal of Geo-Information 10 (10), https://doi.org/10.3390/ijgi10100640.
- Zhang, W. L., Z. H. Chong, X. J. Li, and G. B. Nie. 2020. “Spatial Patterns and Determinant Factors of Population Flow Networks in China: Analysis on Tencent Location Big Data.” Cities 99, https://doi.org/10.1016/j.cities.2020.102640.
- Zhang, R., T. Liang, J. Guo, H. Xie, Q. Feng, and Y. Aimaiti. 2018. “Grassland Dynamics in Response to Climate Change and Human Activities in Xinjiang from 2000 to 2014.” Scientific Reports 8 (1): 2888. https://doi.org/10.1038/s41598-018-21089-3.
- Zhang, X. W., J. S. Wu, J. Peng, and Q. W. Cao. 2017. “The Uncertainty of Nighttime Light Data in Estimating Carbon Dioxide Emissions in China: A Comparison Between DMSP-OLS and NPP-VIIRS.” Remote Sensing 9 (8), https://doi.org/10.3390/rs9080797.
- Zhao, M., W. M. Cheng, C. H. Zhou, M. C. Li, K. Huang, and N. Wang. 2018. “Assessing Spatiotemporal Characteristics of Urbanization Dynamics in Southeast Asia Using Time Series of DMSP/OLS Nighttime Light Data.” Remote Sensing 10 (1), https://doi.org/10.3390/rs10010047.
- Zhao, Z., Y. Wei, R. Pang, R. Yang, and S. Wang. 2017. “Spatiotemporal and Structural Characteristics of Interprovincial Population Flow during the 2015 Spring Festival Travel Rush.” Progress in Geography 36 (8): 952–964. https://doi.org/10.18306/dlkxjz.2017.08.004.
- Zhao, M., Y. Y. Zhou, X. C. Li, W. T. Cao, C. Y. He, B. L. Yu, X. Li, C. D. Elvidge, W. M. Cheng, and C. H. Zhou. 2019. “Applications of Satellite Remote Sensing of Nighttime Light Observations: Advances, Challenges, and Perspectives.” Remote Sensing 11 (17), https://doi.org/10.3390/rs11171971.
- Zhao, N. Z., Y. Y. Zhou, and E. L. Samson. 2015. “Correcting Incompatible DN Values and Geometric Errors in Nighttime Lights Time-Series Images.” IEEE Transactions on Geoscience and Remote Sensing 53 (4): 2039–2049. https://doi.org/10.1109/TGRS.2014.2352598.
- Zheng, Q. M., J. S. Deng, R. W. Jiang, K. Wang, X. Y. Xue, Y. Lin, Z. Huang, Z. Q. Shen, J. Li, and A. R. Shahtahmassebi. 2017. “Monitoring and Assessing “Ghost Cities” in Northeast China from the View of Nighttime Light Remote Sensing Data.” Habitat International 70: 34–42. https://doi.org/10.1016/j.habitatint.2017.10.005.