
 ?Mathematical formulae have been encoded as MathML and are displayed in this HTML version using MathJax in order to improve their display. Uncheck the box to turn MathJax off. This feature requires Javascript. Click on a formula to zoom.
ABSTRACT
Recently, the use of Precise Point Positioning (PPP) has spread widely. Unlike Relative Positioning techniques, PPP uses only a single receiver unit. Although it provides sub-centimeter horizontal accuracy, the vertical accuracy of PPP is a hot topic in the research community. In this research, an approach to enhance the accuracy of PPP estimated heights is proposed via the integration of static measurements and corrector surfaces produced based on the Voronoi diagram. The performance of PPP Static and Kinematic measurements was evaluated by comparing their solutions with solutions obtained from Relative Positioning techniques. The Canadian Spatial Reference System-Precise Point Positioning (CSRS-PPP) was used to process measurements collected at the study area of 39 km2 along the coastal zone of the Mediterranean Sea in the northern Delta region of Egypt. Based on the estimated results, the proposed approach significantly reduces the RMSE of the height differences. The average improvement ratio is approximately 73.9%, with the RMSE decreasing from 10.9 cm to 2.79 cm. Moreover, about 95.7% of the 279 tested point height differences show values within ±5 cm or better after applying this approach. Notably, PPP using the proposed approach saved approximately 50% of the time required for the Relative Positioning technique.
1. Introduction
The most common and popular technique for estimating highly accurate positions is the Differential Global Navigation Satellite System (DGNSS), or Relative Positioning using carrier phase measurements in both Static and Kinematic modes. Traditionally, Relative Positioning techniques require collecting observations simultaneously from both unknowns or rover points and from reference control base stations; therefore, two or more receivers should be installed over both unknown and reference points. Static and Rapid Static methods are the most accurate methods with millimeter-level accuracy (ElShouny Citation2008). Therefore, they are considered the most suitable observation methods for applications that require high accuracy, such as geodetic applications. Kinematic techniques are divided into two basic methods: real-time kinematics (RTK) and post-processed kinematics (PPK). The RTK requires a continuous radio connection between the base and rover receivers to provide instantaneous correction to perform real-time processing. Over the last few decades, a new technique called Network RTK (NRTK) has emerged. It allows users to receive real-time corrections for determining positions with centimeter-level accuracy. This technique eliminates the need for individual base stations, as corrections are provided through a network of permanent reference stations (Alkan et al. Citation2020).
In PPK, there is no need for a radio connection because the measurements are post-processed using processing software. Kinematic methods provide centimeter-level accuracy (Heo et al. Citation2009), and are preferred for many applications such as land surveying, aircraft positioning, mobile mapping, machine control, mining agriculture, and construction (ElShouny, Yakoub, and Hosny Citation2017; Weaver, Gillins, and Dennis Citation2018). There are many restrictions that limit the use of both Static and Kinematic, Relative Positioning techniques in several applications, particularly in the case of a lack of reference stations in remote areas and coastal zones (Liu et al. Citation2020).
In addition, for the static technique, the long occupation time over the base and rover and the need for post-processing could limit its use in several applications (Hofmann-Wellenhof, Lichtenegger, and Collins Citation1997; Leick Citation1990; Mader Citation1992; Xu Citation2007). For the RTK technique, the greatest disadvantage is that the distance between the base and rover receivers must not exceed 20 km, and the possibility of losing communication and signal connection between receivers even if this distance is less than 20 km (Alkan et al. Citation2020).
To overcome the aforementioned limitations of Relative Positioning techniques, many new approaches have been represented by scientists and researchers in the last few years, such as the Virtual Reference Station (VRS), Continuously Operating Reference Station (CORS) (Wanninger Citation2003), and Precise Point Positioning (PPP). PPP, which was proposed and represented by Zumberge et al. (Citation1997) is an absolute positioning technique for estimating accurate positions using a single receiver, without the need for reference or base stations. PPP can process data collected using single- or dual-frequency receivers, as well as Static and Kinematic observations (Dardanelli et al. Citation2021). Reference stations are dispensed because PPP obtains the required satellite orbits and clock correction products provided by the International Global navigation satellite system (GNSS) Service (IGS) (Malinowski Citation2018). Recently, PPP has become widely popular as an alternative to the relative positioning technique. This is due to its simplicity, lack of need for reference stations, cost-effectiveness by reducing time, labor, and instruments required for measurements (Alkan et al. Citation2017). Nonetheless, PPP has proven its ability to provide coordinates with acceptable positional level accuracy for both Static and Kinematic modes (Kouba and Héroux Citation2001; Zumberge et al. Citation1997).
Many studies have investigated the achieved horizontal and vertical accuracies of Static and Kinematic PPP solutions in different applications. These studies have concluded that millimeter to centimeter position level accuracy is achieved in the Static PPP mode such as Dawidowicz and Krzan (Citation2014), El-Mowafy (Citation2011), Gandolfi, Tavasci, and Poluzzi (Citation2017), Ge et al. (Citation2023), Guo (Citation2015), and Martín Furones et al. (Citation2012). However, centimeters to a few decimeters are achieved by the Kinematic PPP mode (Anquela et al. Citation2013; Abdallah and Schwieger Citation2015; Gandolfi, Tavasci, and Poluzzi Citation2017; Liu et al. Citation2020; Alkan et al., Citation2016). The availability of real-time orbit and clock products from various agencies, such as IGS, along with the widespread use of PPP in various applications, has increased the demand for accurate real-time positioning. In response to this need, IGS has introduced the Real-Time Service (RTS), which provides open-access to corrections for Real-Time-PPP (RT-PPP) applications (Ge et al. Citation2008). With the help of this service, users can obtain precise PPP solutions in real-time by utilizing the available correction products.
Several studies have compared different PPP online services and offline software to evaluate their performances (El-Mowafy Citation2011; ElShouny and Miky Citation2019; Bulbul, Bilgen, and Inal Citation2021; Gandolfi, Tavasci, and Poluzzi Citation2017; Mendez Astudillo et al. Citation2018) have concluded that the Canadian Spatial Reference System-Precise Point Positioning (CSRS-PPP) service is the most accurate between all compared services and software. Several studies have found that the PPP vertical error is approximately twice that of the horizontal error (DeSanto, Chadwell, and Sandwell Citation2019; Liu et al. Citation2020; Yang et al. Citation2019). Alkan et al. (Citation2020) investigates the performance of both (NRTK) and (RT-PPP) techniques in a dynamics environment. In this study, we propose an approach for enhancing the accuracy of the height component estimated from Kinematic PPP measurements using static measurements and a corrector surface produced based on the Voronoi diagram. The proposed method requires dividing the study area into separate regions according to the distribution of available control stations in this area. Each of these subdivided regions adopts the values of a corrector surface estimated from the ellipsoid height deviations between PPP and Relative Positioning static solutions for the closest control stations calculated from static measurements. One of the main concerns is the segmentation of the study area into sub-divided regions related to the distribution of the control stations in this area. This area segmentation can be achieved using several approaches. The Voronoi diagram approach was selected because it is considered an effective method for area segmentation. The Voronoi diagram proposed by Rene Descartes in 1644 is a spatial partition structure that is widely applied in many scientific domains. In a Voronoi diagram with n points, the space is divided into n regions corresponding to these points, which are called Voronoi cells. For each of these n points, the corresponding Voronoi cell consists of all locations closer to that point than to any other. In other words, each point is the closest to all locations in the corresponding Voronoi cell (Li and Liu Citation2020). To judge our proposed approach, we first evaluated the accuracy of the Static and Kinematic PPP solution results by comparing them with the relative positioning technique results. Then, the approach should be applied to the PPP estimated height results to judge the efficiency of the proposed method. The CSRS-PPP service was selected to process the data used in this research.
The study area is located in the northern part of the Middle Delta of Egypt along the Mediterranean coast with a total area of approximately 39 km2. The selection of this coastal area is due to its importance in urban, economic, and development projects, as well as the continuous need for coastal protection works to fight erosion caused by global warming. The purpose of collecting these data is to produce an accurate contour map for the sake of Egyptian Coastal Protection Authority (ECPA) that requires an accuracy of 15 cm for heights used in producing contour maps and for more details please refer to ElShouny, Yakoub, and Hosny (Citation2017). In addition, the selection of this area is due to the scarcity of available reference stations along the coastal areas. This paper is organized as follows. First, a description of the PPP and the relative technique is discussed. Second, the study area and the collected measurements are introduced. Third, the methodology of the proposed approach is discussed. Next, the results are then presented, analyzed and discussed. Finally, the conclusions of this study are presented, along with suggestions for future work.
2. Relative positioning and PPP techniques
The estimation of highly accurate positions has become easier owing to the recently developed techniques and applications of Global Navigation Satellite Systems (GNSS). Relative Positioning is considered the most precise GNSS positioning technique because of its capability to remove most of the existing errors because it utilizes the difference in either the code or carrier phase ranges. Traditionally, Relative Positioning methods include Static, Rapid Static, Post-Processing Kinematic (PPK), and Real-Time Kinematic (RTK) (Berber, Ustun, and Yetkin Citation2012).
Specifically, Static or Rapid Static techniques achieve the highest accuracy because of their observation time and post-processing of data, which eliminates several observation errors. The static method is considered a unique method for long baseline distance surveys. Kinematic modes can be divided into two techniques: RTK and PPK. The RTK technique does not provide accuracy as a static technique, but it achieves acceptable accuracy up to centimeter-level accuracy (Heo et al. Citation2009). This technique provides us with adjusted coordinates instantaneously using real-time corrections for observations using a continuous radio connection between the base and rover. The other Kinematic technique is PPK, which is similar to RTK, but without a radio connection between the base and rover instruments. Therefore, PPK requires data post-processing, which achieves an accuracy higher than that achieved in RTK surveys. PPK requires less observation time compared with Static and Rapid Static surveys, but it should be noted that PPK requires initialization time at the beginning of observation and after any signal is lost to solve ambiguity. With ambiguity solving, PPK can achieve centimeter accuracy (ElShouny Citation2008). PPK has two modes: Continuous and Stop-and-go. Rover in continuous mode is in a continuous motion, while in the stop-and-go mode, it remains occupying stations for a short time of up to 2 min (ElShouny, Yakoub, and Hosny Citation2017). Relative positioning determines the point coordinates using double differences in phase measurements, as given below in Equation (1) (Lachapelle, Cannon, and Lu Citation1992):
(1)
(1) where
is the double difference operator at the time of receiving data (t),
is the phase measurement,
is the travel time from satellite to receiver,
is the satellite time,
refers to the true geometric range,
is the orbital prediction error,
and
are the ionospheric and tropospheric errors, respectively,
is the wavelength,
is the integer phase ambiguity, and
denotes to the noise component. The tropospheric delay is the sum of the wet and hydrostatic parts.
Owing to the rapid improvement in both hardware and software for satellite-based positioning applications in recent years, many algorithms, approaches, and processing strategies have been developed by scientists and organizations. Their main concern is that these developed approaches should be worldwide and provide more reliable and economical solutions with acceptable accuracy for positioning tasks. One of the most popular approaches is PPP, which was proposed and represented by Zumberge et al. (Citation1997). The major advantage of PPP over the Relative Positioning technique is the ability to obtaining three-dimensional coordinates with required accuracy using only one receiver (Rover one) and without the need for a reference station or base instruments, as shown in (Woodgate et al. Citation2017).
Figure 1. Schematic depicting: (a) Relative positioning. (b) Point positioning.
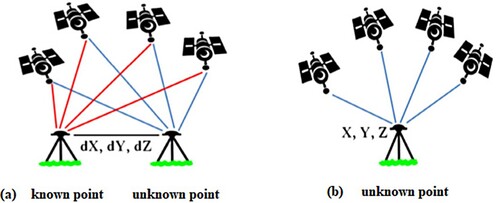
PPP measurements can be performed using both Static or Kinematic methods. The rapid growth in the use of the PPP method is owing to the increased availability of satellite clock corrections, satellite orbit ephemeris, and atmospheric products. These products can be obtained from the IGS or other organizations such as the Jet Propulsion Laboratory (JPL), Geodetic Survey Division of Natural Resources Canada (NRCan), and National Aeronautics and Space Administration (NASA). PPP-derived coordinates can be obtained using software or web-based, online processing services. This software may be scientific (BERNESE, GipsyX, GAMIT, and GLAB) or commercial (GRAFNAV). There are several available web-based services, such as Automatic Precise Positioning Service (APPS), MAGIC-GNSS, Trimble CenterPoint (RTX), GNSS Analysis and Positioning Software (GAPS), and CSRS-PPP.
In this study, the CSRS-PPP service is used to process the collected data. This service is a globally popular PPP processing service developed (Alkan et al. Citation2017) and operated by the geodetic survey division of NRCan, it is free of charge for registered users. It can process both Static and Kinematic data. IGS and NRCan provide precise GPS orbits, clock products, and antenna phase corrections that are used by CSRS-PPP. Based on the global ionospheric map, CSRS-PPP implements a global ionosphere model (GIM). The estimation of the CSRS-PPP tropospheric zenith delay is based on the Global Mapping Function (GMF) obtained from the numerical weather model of the European Centre for Medium-Range Weather Forecasts, along with default surface meteorological data and an elevation mapping function (Abd-Elazeem, Farah, and Farrag Citation2011), after submitting data, the PDF file of solution report is sent to registered user email containing results and graphical information of data processing (Mendez Astudillo et al. Citation2018). More detailed information about CSRS-PPP service processing procedures can be found in Mireault et al. (Citation2008), Natural Resources Canada (Citation2022), and Tétreault et al. (Citation2005).
PPP position determination is based on the processing of the ionosphere-free combination of un-differenced pseudorange and carrier phase observations to reduce the first-order ionospheric effect. The observation equations of PPP are represented by Heroux and Kouba (Citation2001) as shown in Equations (2) and (3):
(2)
(2)
(3)
(3) where
is the ionosphere-free combination of the L1 and L2 pseudo ranges (2.54P1–1.54P2),
is the ionosphere-free combination of L1 and L2 carrier-phases (2.54
1–1.54
2),
is the geometrical range computed as a function of satellite and station coordinates. c is the vacuum speed of light, dt is the station clock offset from GPS time, dT is the satellite clock offset from GPS time, M is a function to map tropospheric from slant to zenith, ztd is the tropospheric zenith total delay due to the neutral atmosphere, wavelength, and ionosphere-free combination. The tropospheric delay is the sum of the wet and hydrostatic parts. λ is the carrier or carrier combination, wavelength, N is the non-integer ambiguity of the carrier-phase ionosphere-free combination,
and
are the relevant measurement noise components, including the multipaths, and.
3. Material and methods
3.1. Study area and data
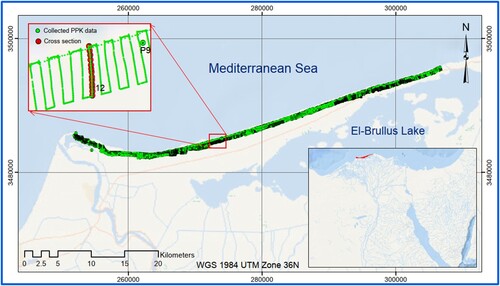
The study area was located in Egypt in the northern part of the Delta region along the Mediterranean Sea Coastal zone, as shown in from Rosetta City East at an approximate longitude of E 30° 23′ 18″ to Al Burullus City West at 30° 57′ 51″. This area has a longitudinal distance of approximately 60 km to the coastline, with a width ranging from 400 to 600 m perpendicular to the coastline, with a total area of approximately 39 km2. The selection of this zone area is due to the continuous need for the construction works of protection against shoreline erosion caused by global warming. Therefore, an accurate updated topographic map is required for surveying work performed continuously by ECPA. The measurements for producing this topographic map were collected by the Survey Research Institute (SRI Technical Report, Citation2014). To produce this topographic map with the required accuracy of 15 cm in height, several field measurements, such as Static, Kinematic GPS observations and leveling measurements, were collected and processed, as discussed by ElShouny, Yakoub, and Hosny (Citation2017). In the following section, we present the measurements used in this study.
Figure 2. The study area with a part of kinematic measurements.
3.2. Static observations
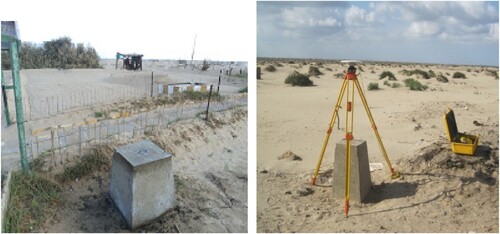
Because of the rarity of reference stations along all coastal areas as the study areas, it was first necessary to install and observe several control stations covering the entire area for measurements. Fourteen control stations were established along the study area, as shown in with a separated distance of approximately 5 km, which may be increased or decreased according to the topography and nature of the installed location. The installation of these control stations was not only for the required measurements but also for future work in this area. Therefore, to ensure the preservation of these control stations, they were constructed as a concrete prism with a height of 1 m and approximately 50 cm underground, and upper and lower dimensions of 40 × 40 cm and 60 × 60 cm respectively. At the top of the concrete prism, a steel cylinder was placed with a 10 cm steel bar fastened into the concrete prism. shows photographs of two of these established points.
Figure 3. Location of control stations and check cross sections along the study area.
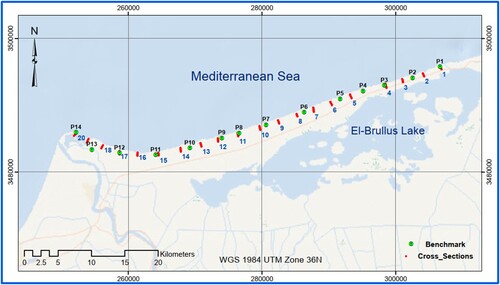
Figure 4. two photos of the established control stations.
Static GPS measurements were performed for these 14 control stations to estimate their 3-dimensional coordinates (latitude, longitude, and ellipsoid height). The 14 stations were connected to two points of the Egyptian Surveying Authority (ESA) first-order triangulation stations. The network was designed as an over-constrained network (Sobeih, Doma, and El Shoney Citation2010). In the measurements, four Trimble 5700 dual-frequency receivers were used to collect observations with durations ranging from 2 to 3 h, depending on baseline lengths. Trimble Business Center Software (TBC) was used to process kinematic collected data using precise ephemeris products. TBC uses several models to correct different error sources, such as tropospheric delay and antenna phase center (TBC Reference Manual Citation2008). All 14 points achieved the required horizontal and vertical precision of ±(2 cm + 1 ppm) (part per million) and (± 5 cm + 1 ppm); respectively.
3.3. Kinematic measurements
As mentioned above, the main purpose of collecting data along the study area was to produce an accurate topographic map using kinematic measurements. Therefore, the entire area was surveyed using kinematic measurements using the kinematic method and Stop and Go modes. In this method, one of the three used in the observations was installed in a base station, whereas the other two receivers were used as rovers. In the observations, the closest station of the 14 control points for the surrounding surveyed area was used as a base for this area to decrease the effect of geoid undulation variation when calculating geoid heights from ellipsoid heights. To survey the entire area, approximately 50,000 observations were collected over a period of approximately three weeks by dividing the area into cross-sections perpendicular to the beach line with separated distances of more than 100 m. The length of the cross-sections ranged from 400 m to 600 m according to the length of the surveyed area using Stop and Go mode consecutive measurements with a spacing of approximately 10 m. Part of the kinematic survey measurements is shown in . All collected data were later processed with TBC software to obtain 3-dimensional coordinates (latitude, longitude, and ellipsoid height) and to calculate point orthometric heights using geoid undulation values estimated from the 14 control stations (ElShouny, Yakoub, and Hosny Citation2017).
The main concern while collecting these measurements was the obtained accuracy, and whether this accuracy fulfills the requirements of producing contour maps as the requirements of ECPA. The ECPA requires the production of contour maps using kinematic measurements with a height accuracy of not more than 15 cm. To verify this, 20 check cross-sections were observed using kinematic measurements and spirit leveling with a spacing of approximately 3 km, as shown in . These kinematic measurements and spirit leveling observations were performed simultaneously at the same surveyed points at the same time. In this research, these 20 final coordinate cross-sections were compared with the results obtained from CSRS-PPP solutions to evaluate the performance of the PPP method in kinematic applications. The average precision values of the cross-section points were (1.2 cm) for horizontal positions and (2.4 cm) for vertical positions. The full detailed precision of these cross-sections is presented by ElShouny, Yakoub, and Hosny (Citation2017).
3.4. Methodology
This study has two major objectives: first, to assess the accuracy of the CSRS-PPP service in both Static and Kinematic measurements, and the second objective, to propose an approach to enhance the accuracy of the ellipsoid heights estimated using kinematic measurements. A flowchart of the research methodology is presented in . After collecting all Static and kinematic measurements and processing these data using the Relative Positioning technique, we obtained accurate coordinates for both Static and Kinematic measurements, as discussed in the previous subsections. Then, all raw data of both static measurements of the 14 control stations and kinematic measurements were uploaded to the CSRS-PPP website to obtain their processed coordinates using the PPP technique. Static and Kinematic PPP derived coordinates were compared with coordinates estimated from the Relative Positioning technique to assess the obtained accuracy of CSRS-PPP solutions in both static and kinematic modes.
Figure 5. Flowchart of the study methodology.
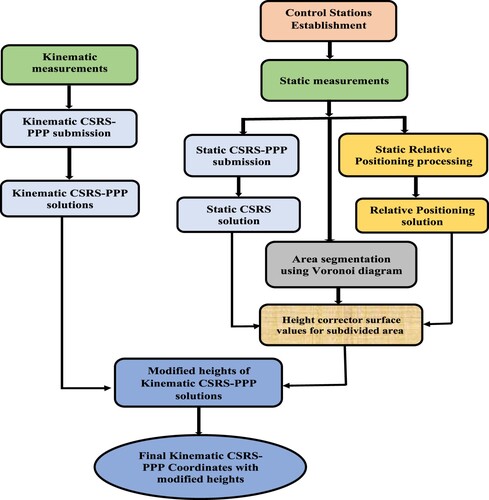
As previously discussed, the PPP vertical error is approximately twice the horizontal error; therefore, we propose a methodology to enhance the ellipsoid heights estimated from Kinematic PPP solutions. The methodology depends on the establishment of several control stations that are well distributed along the study area, and they should be measured and processed using the Relative Positioning Static technique to obtain accurate coordinates, particularly ellipsoid heights. Then, this static data should be submitted to the PPP service to be processed to obtain the PPP solution, particularly the ellipsoid height . Subsequently, a corrector surface is produced to enhance the heights estimated from the PPP Kinematic solution. The accuracy of static and kinematic techniques differs, with the static solution generally exhibiting superior accuracy compared to the kinematic technique. Therefore, we exclusively employed the static results (relative positioning and CSRS-PPP) to ascertain the ellipsoid height discrepancy. Equation (4) is employed to compute the value of the corrector surface at each control point. This value is derived from the disparity in heights estimated through static solutions. Each control point contributes the necessary correction to improve the accuracy of future PPP Kinematic results within its designated zone.
(4)
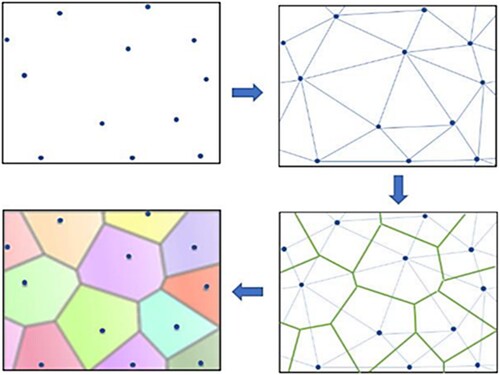
(4) where ξ(RP/PPP)(S) is the corrector surface value for each control station. hPPP(S) is the ellipsoid height of control stations estimated from static PPP solution. hRP (S) is the ellipsoid height of the control stations, estimated from the static Relative Positioning solution. Kinematic measurements should be performed without using any base station and should be submitted to the CSRS-PPP website for processing and solution. After estimating the final processed coordinates from the CSRS-PPP service, the calculated values of the corrector surface for each control station ellipsoid height calculated by Equation (4) are used to modify the estimated ellipsoid height from the Kinematic PPP. The survey area was divided into separate zones according to the distribution of the control points along this area. The study area segmentation was generated using the Voronoi diagram approach by dividing the area into separate regions according to the distribution of the control stations. A Voronoi diagram is a set of continuous polygons mode-up vertical bisectors joining two adjacent point segments. A Voronoi diagram was produced by randomly placing points on a Euclidean plane. Then, a tessellating polygon, or cell, is formed around each point of the plane, consisting of the area of the plane that is closest to that point. Voronoi diagrams have numerous applications across mathematics, as well as in various other disciplines. The steps of the Voronoi diagram procedure are shown in (Jian-Ping Citation2019; Wang et al. Citation2022). For more details on the mathematical principles and applications of Voronoi Diagrams, please refer to Okabe et al. (Citation2000). This area segmentation is important for selecting the closest control stations for each subdivided region. Each of these control points ellipsoid height corrector surface values calculated from both static solutions in Equation (4) are used to enhance the height estimated from the PPP Kinematic solution along each separated region. The final kinematic modified ellipsoid heights were calculated using Equation (5). Statistical values, including the Median, and RMSE, were adopted to evaluate the performance of the proposed approach. The RMSE for the height differences of the 20 cross-section points before and after applying the proposed approach were calculated using Equations (6) and (7).
(5)
(5) where hKPPP(F) is the final modified ellipsoid height after applying the approach. hPPP(K) is the estimated ellipsoid height from Kinematic PPP solution. ξ(RP/PPP)(S) is ellipsoid height deviation (corrector surface value) for each control station.
Figure 6. Voronoi diagram procedure steps flow chart.
between Relative Positioning and PPP Static solutions,
(6)
(6)
(7)
(7) where: hRP (K) is the estimated ellipsoid height from Kinematic Relative Positioning, The RMSE height is the root mean square error before and after applying the proposed approach.
It should be noted that static measurements are required for control stations located along the study area in both the relative positioning and PPP methods in order to generate the ellipsoidal height correction surface. These static measurements are performed only at the beginning of the project. Once the correction surface is constructed, there is no need to reobserve these points statically when conducting kinematic observations. The height can be adjusted using the correction surface. The heights estimated using the Relative Positioning technique are dependent on a constant value of ellipsoid height and the baseline height difference for the permanent triangulation network. These values should remain unchanged with repeated measurements or across different seasons. While heights obtained from CSRS-PPP maybe vary across the time. To investigate the variation in height estimation via CSRS PPP solution, the static data were submitted twice at different seasons to the PPP service in 2013 and 2014.
4. Results
In this section, the static measurements processed using the CSRS-PPP service are evaluated, and then the kinematic measurements processed using the same service are also assessed and compared with results obtained from Relative Positioning techniques. Then, the proposed approach is applied to the CSRS-PPP Kinematic derived heights and compared with the height calculated from Relative Positioning to evaluate the effectiveness of the proposed approach in calculating the final modified height.
4.1. Static PPP results
As mentioned in the methodology, the static data were submitted twice to the CSRS-PPP service to investigate variation in height estimation via CSRS PPP solution. The number of selected control points is designed and established according to the dimension of the study area with respect to the accuracy required (ElShouny, Yakoub, and Hosny Citation2017). In this study area, which is a strip area along the Mediterranean Sea as shown in , it was found that only 14 control points were required. Sometimes, relying solely on maximum, minimum, and median values may not provide a comprehensive understanding of a dataset, especially when the dataset is relatively small. In such cases, it is important to consider the spatial distribution of the data, including questions about data clustering and the presence of peaks within the distribution. To gain a better understanding of the coordinate differences and to identify outliers and highlight data peaks, the Normalized Median Absolute Deviation (NMAD) was calculated, and violin plots were employed. shows the summary of statistics of coordinates differences between Static CSRS-PPP and Relative Positioning solutions for all control stations for the two time points, presented in both geodetic coordinates and projection coordinates. Based on the results for 2013 data, for the geodetic coordinates’ differences, the maximum absolute difference was 0.00265 and 0.00344 s in Latitude and Longitude respectively. While the difference for the height component ranges between −3.20 cm to 2.80 cm with RMSE value of 2.48 cm. For projected coordinates, the maximum difference in the 2D position reaches 4.53 cm in the East coordinate and 7.72 cm in the North coordinate. The RMSE values for both the East and North coordinates are 5.09 and 4.17 cm, respectively. For 2014 observations, for the geodetic coordinates’ differences, the difference in Latitude ranged between −0.0019 and 0.00167 s, while in Longitude the difference was constant for all control points. It was −0.00011 s. The difference for the height component ranges between −5.90 cm to −11.30 cm with RMSE value of 9.13 cm. For projected coordinates, the maximum difference in the 2D position reaches 2.07 cm in the East coordinate and 2.54 cm in the North coordinate. The RMSE values for both the East and North coordinates are 1.20 and 1.35 cm respectively. Results obtained in the two time points showed no significant differences in the height component, which is crucial for generating the corrector surface and enhancing the accuracy of PPK analysis, as previously mentioned. In the analysis of kinematic observation, the topocentric coordinates were employed. To gain insights into the distortion introduced by the projection process, has been incorporated, displaying linear distortion and the scale factor for the control points. It was observed that the linear distortion in this study area did not exceed 358 ppm. represents the coordinates differences of data collected in 2014 while illustrates the violin plots of the differences of Static CSRS-PPP solution. From the figure one can notice that the distribution of the differences in the horizontal directions are approximately the same and a small change can be observed in the vertical direction.
Figure 7. Coordinate differences of Static CSRS-PPP solution of control stations.
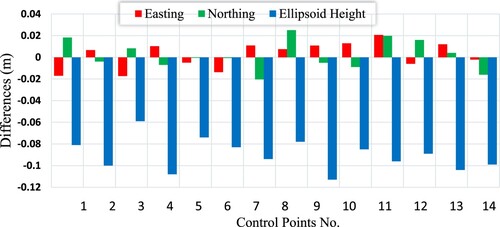
Figure 8. Violin plots of the difference of Static CSRS-PPP solution.
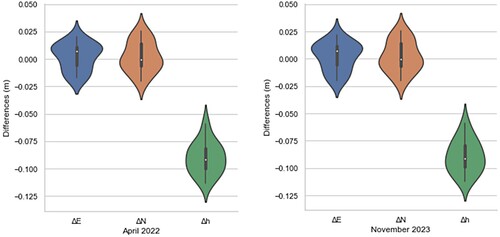
Table 1. Differences statistics between static CSRS-PPP and relative positioning solutions.
Table 2. Scale factor and Linear distortion of control points.
4.2. Kinematic PPP results
As discussed in Section 3, the collected kinematic data were processed using both Relative Positioning and CSRS-PPP to evaluate the accuracy of the CSRS-PPP solution prior to implementing the proposed method. The kinematic data were collected from points located along 20 cross-sections that were distributed throughout the study area, as illustrated in . For each point, the coordinate differences computed using both methods were calculated. Then, the statistical analysis of these coordinate differences includes Maximum, Minimum, Median, standard deviations, and RMSE for Easting, Northing, and ellipsoidal height was performed and shown in . shows graphical representation of the absolute differences between coordinates obtained from CSRS-PPP and Relative Positioning solutions for the Kinematic measurements of the 20 cross-sections points. As depicted in the figure, the difference in horizontal 2D positioning, calculated via the Euclidean distance for differences in Easting and Northing, is represented in the red color while the height difference is represented in blue color. For all sections, it is noticed the differences in horizontal positioning are always greater than differences in the height for all points. The maximum value of the difference in the horizontal positioning was 4.7 cm, it appeared in section 17 where standard deviation was 2.7 cm. The absolute value of vertical differences ranges between 3.6 and 18.4 cm with standard deviation of 2.2 and 2.9 cm respectively. compares the maximum differences of static CSRS-PPP and selected sections of kinematic CSRS-PPP solutions. It can be noticed that the differences values of Kinematic CSRS-PPP solutions are always greater than that obtained from Static CSRS-PPP solutions.
Figure 9. Horizontal and vertical absolute coordinate differences for Kinematic measurements.
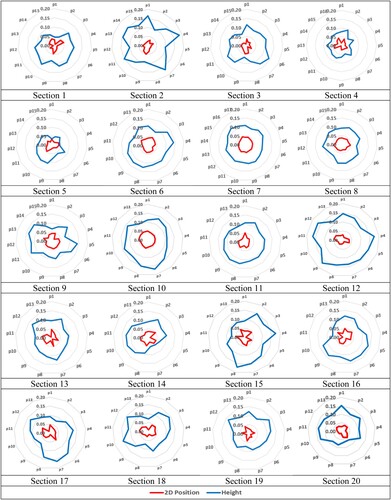
Table 3. Statistics values for Kinematic measurements differences of the 20 cross-sections.
Table 4. Absolute maximum differences for static and kinematic CSRS-PPP solutions (cm).
4.3. Proposed method results.
4.3.1. Constructing surface corrector.
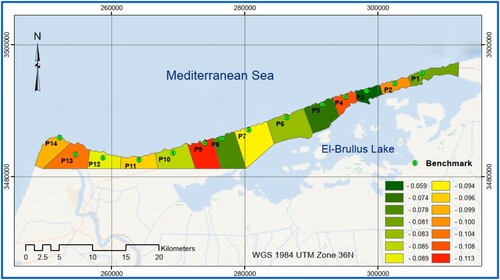
The main objective of the proposed method is to improve the accuracy of heights obtained from PPP Kinematic solutions by employing a surface correction technique. This correction surface is constructed using static measurements obtained from control points that are distributed across the study area. To facilitate this process, a Voronoi diagram is utilized to segment the study area and assign each zone to a specific control point. presents the study area subdivided regions with each area corrector surface height value.
Figure 10. The study area subdivided into regions with corrector surface heights values.
4.3.2. Accuracy assessment of proposed method
To assess the effectiveness of the proposed approach, the collected kinematic data were processed using both Relative Positioning and CSRS-PPP. The heights of the 20 cross-section points obtained from the kinematic CSRS-PPP solution are adjusted using the correction surface. The corrector surface is utilized to determine the appropriate correction value for each point in the cross-section based on its geospatial location. By applying the corresponding correction values from the surface, the heights of the cross-section points are modified. The final modified heights estimated after applying the correction were compared with the heights derived from the CSRS-PPP solution. shows the statistics for the differences of all sections points before and after applying the proposed approach. As shown in the table, the differences range decreased from (−19.3 cm to −14.2 cm) before applying the correction to (−9.3 cm to 3.8 cm) after applying correction using proposed approach. Also, RMSE value ranged between 1.6 cm and 4.1 cm after applying the correction, comparing with the range from 7.0 cm to 13.3 cm before applying the proposed method. Based on these results, it can be stated that applying the proposed approach enhances the Kinematic PPP heights accuracy with an improvement ratio of about 73.9%. presents box plots for both height values of the 20 cross-section points before and after applying the correction. As shown in the figures, the height difference values after applying the proposed approach obviously decreased compared with the height differences obtained from the CSRS-PPP solutions. Out of the total 279 points analyzed, the total number of points in the 20 cross sections, it was found that approximately 95.7% of the height differences were within the range of ±5 cm. Only 12 points had final modified heights that exceeded the threshold of ±5 cm. This demonstrates the effectiveness of the proposed approach in significantly improving accuracy of heights obtained from PPP Kinematic solutions for the majority of points in the dataset.
Figure 11. Box plot for all check cross-sections before and after applying the proposed approach.
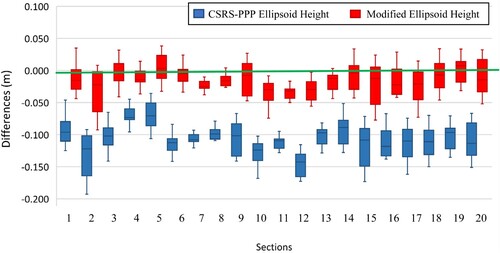
Table 5. Statistics values for differences before and after applying the proposed approach.
5. Discussion
The first objective of this study was to assess the accuracy of the CSRS-PPP service in both Static and Kinematic measurements. In this regard, accurate coordinates for both Static and Kinematic measurements for the 14 ground control points were obtained using the Relative Positioning technique. A comparison was made between the Relative Positioning results and those come from CSRS-PPP service. The results demonstrated the efficiency of the service in solving the Static mode, particularly in horizontal positioning, where the difference did not exceed 2.54 cm. However, the vertical accuracy was not as high, with a difference of 11.3 cm in height. In the Kinematic PPP mode, the horizontal accuracy was deemed acceptable, with a maximum difference in 2D positioning of 4.7 cm. However, the accuracy in the height component was not satisfactory, as the difference between heights reached 18.4 cm. Hence, it may not be suitable for using Kinematic PPP in several accurate applications. Therefore, the second objective was to propose an approach that utilizes static measurements to enhance the accuracy of the ellipsoid heights estimated through kinematic measurements.
When applying the proposed method, the study area was divided into 14 zones using Voronoi diagram, which represents the number of ground control points. A correction surface was generated, where each zone correction was linked to the difference between the static and kinematic observations for the control point. When evaluating the results of the adopted method using 279 points along 20 cross-sections distributed throughout the study area, the results indicate that the proposed method enhances the accuracy of the ellipsoid heights obtained from CSRS-PPP, improving the accuracy from the decimeter level to the centimeter level. This level of accuracy can be considered suitable for various surveying and geodetic applications.
It is worth noting that the proposed approach for PPP solution also offers a time advantage compared to the Relative Positioning solution. The Relative Positioning solution entails various time-consuming steps, including the observation of static measurements for control points and the collection of kinematic data, which involves base station installation, occupation time, initialization, and post-processing time. On the other hand, the PPP proposed method requires collecting static measurements for control points and only the occupation time of Kinematic measurements for the rover instrument besides the time required for submitting, receiving solutions. Since our proposed method does not require a base instrument, both instruments can be utilized for collecting kinematic measurements instead of relying on just one instrument.
A coarse comparison of the estimated time required for data observation and processing using both the relative positioning technique and the proposed PPP method revealed that the proposed method saved approximately 50% of the time required for the relative positioning technique solution. This highlights that the proposed approach not only enhances the accuracy of the obtained heights but also significantly reduces the time needed, particularly when kinematic measurements in the area are conducted frequently due to continuous surveying and other work.
Based on the results and discussion presented in this study, the benefits of implementing the proposed method can be summarized as follows: Firstly, the approach enhances time efficiency by reducing the time needed for data observation and processing, thereby increasing overall efficiency in surveying operations. Secondly, the use of two instruments for collecting kinematic measurements, eliminating the need for an additional base unit, contributes to increased productivity and cost reduction. This advantage is particularly notable as it streamlines the measurement process without requiring an extra instrument. Thirdly, the proposed method proves to be effective for repeated kinematic measurements in the same area, offering a streamlined and efficient process for such re-measurements. Lastly, the application of the proposed method results in enhanced accuracy of ellipsoid heights estimated through kinematic measurements, providing a higher level of precision that can prove beneficial for various applications relying on accurate height information.
6. Conclusions
In this study, an approach to enhance the accuracy of Kinematic PPP estimated heights using static measurements and a corrector surface produced based on the Voronoi diagram was proposed. In addition, the performance of the Static and Kinematic PPP solutions of the CSRS-PPP service was investigated and compared with Relative Positioning solutions to quantify their achieved accuracy. In the static solution of the measurements, an agreement was noticed between the PPP-derived coordinates and the coordinates obtained from the Relative Positioning solutions. The maximum difference was 2.5 cm in both Easting and Northing and 11.3 cm in the height components. However, in the Kinematic PPP solutions, the difference recorded high values. They are ±5 cm or better for 2D position components and approximately 18.4 cm or better for height components.
Based on the results, the proposed approach is effective in enhancing the accuracy of the estimated height from PPP Kinematic solutions using the static measurements of control points along the study area. Using the proposed method improves the accuracy of the height estimation with an improvement ratio of about 73.9%, the range of RMSE for the height differences values was reduced from (7.0 cm–13.3 cm) to (1.6 cm–4.1 cm) after applying the proposed approach. Additionally, the Voronoi diagram proved efficient in area segmentation into subdivided regions according to the availability of control points in the study area. Furthermore, applying the proposed approach saves approximately 50% of the time required for collecting and processing measurements using Relative Positioning techniques. In addition, the time reduction ratio may be increased in the case of repetition of kinematic work because there is no need for the repetition of static measurements and the sufficiency of the previous static solutions for control stations. According to the results of applying the proposed approach, Kinematic PPP solutions may be adopted in many accurate surveying applications, such as marine engineering, coastal management, hydrography, and oceanographic works.
Further research will focus on studying the different PPP services and software such as APPS, magic PPP, and GAPs to compare their results and evaluate the performance of applying the proposed approach. In addition, the effect of increasing or decreasing the number of control stations and their density along the study area should be investigated to determine their effect on the achievable positioning accuracy.
Authorship contribution
Ahmed Alshouny contributed to all the aspects of this study. Yehia Miky: investigation, validation, formal analysis, writing, review and editing, figures drafting. Abdullah Kamel: validation, analysis, writing, and editing. All the authors have read and agreed to the published version of the manuscript.
Acknowledgement
The authors gratefully acknowledge DSR technical and financial support.
Disclosure statement
No potential conflict of interest was reported by the author(s).
Data availability statement
The data used in this study were obtained from the corresponding author upon reasonable request.
Additional information
Funding
References
- Abd-Elazeem, M., A. Farah, and F. Farrag. 2011. “Assessment Study of Using Online (CSRS) GPS-PPP Service for Mapping Applications in Egypt.” Journal of Geodetic Science 1 (3): 233–239. https://doi.org/10.2478/v10156-011-0001-3
- Abdallah, A., and V. Schwieger. 2015. Kinematic Precise Point Positioning (PPP) Solution for Hydrographic Applications, Proc. FIG Working Week 2015 from the Wisdom of the Ages to the Challenges of the Modern World. Sofia, Bulgaria, 17–21 May.
- Alkan, R. M., S. Erol, V. Ilçi, and I. M. Ozulu. 2020. “Comparative Analysis of Real-Time Kinematic and PPP Positioning Techniques in Dynamic Environment.” Measurement 163: 1–12. https://doi.org/10.1016/j.measurement.2020.107995
- Alkan, R. M., İM Ozulu, and V. Ilci. 2016. “Precise Point Positioning (PPP) Technique Versus Network-RTK GNSS.” FIG Working Week 2016, 1–10.
- Alkan, R. M., M. H. Saka, İM Ozulu, and V. İlçi. 2017. Kinematic Precise Point Positioning Using GPS and GLONASS Measurements in Marine Environments.” Measurement 109: 36–43. https://doi.org/10.1016/j.measurement.2017.05.054
- Anquela, A. B., A. Martín, J. L. Berné, and J. Padín. 2013. “Gps and Glonass Static and Kinematic PPP Results.” Journal of Surveying Engineering 139 (1): 47–58. https://doi.org/10.1061/(ASCE)SU.1943-5428.0000091
- Berber, M., A. Ustun, and M. Yetkin. 2012. “Comparison of the Accuracy of GPS Techniques.” Measurement 45 (7): 1742–1746. https://doi.org/10.1016/j.measurement.2012.04.010
- Bulbul, S., B. Bilgen, and C. Inal. 2021. “The Performance Assessment of Precise Point Positioning (PPP) Under Various Observation Conditions.” Measurement 171: 108780. https://doi.org/10.1016/j.measurement.2020.108780
- Dardanelli, G., A. Maltese, C. Pipitone, A. Pisciotta, and M. Lo Brutto. 2021. “NRTK, PPP or Static, That is, the Question. Testing Different Positioning Solutions for GNSS Survey.” Remote Sensing 13 (7): 1406. https://doi.org/10.3390/rs13071406
- Dawidowicz, K., and G. Krzan. 2014. “Coordinate Estimation Accuracy of Static Precise Point Positioning Using Online PPP Service: A Case Study.” Acta Geodaetica et Geophysica 49 (1): 37–55. https://doi.org/10.1007/s40328-013-0038-0
- DeSanto, J. B., C. D. Chadwell, and D. T. Sandwell. 2019. “Kinematic Post-Processing of Ship Navigation Data Using Precise Point Positioning.” Journal of Navigation 72 (3): 795–804. https://doi.org/10.1017/S0373463318000887
- El-Mowafy, A. 2011. “Analysis of Web-Based GNSS Post-Processing Services for Static and Kinematic Positioning Using Short Data Spans.” Survey Review 43 (323): 535–549. https://doi.org/10.1179/003962611X13117748892074
- ElShouny, A. F. 2008. The Combined Adjustment of Terrestrial and Satellite Control Network. Diss. M. Sc. Thesis at the Faculty of Engineering, Minoufiya University, Minoufiya, Egypt.
- ElShouny, A., and Y. Miky. 2019. “Accuracy Assessment of Relative and Precise Point-Positioning Online GPS Processing Services.” Journal of Applied Geodesy 13 (3): 215–227. https://doi.org/10.1515/jag-2018-0046
- ElShouny, Ahmed El, Nagy Yakoub, and Magdy Hosny. 2017. “Evaluating the Performance of Using PPK-GPS Technique in Producing Topographic Contour Map.” Marine Geodesy 40 (4): 224–238. https://doi.org/10.1080/01490419.2017.1321594
- Gandolfi, S., L. Tavasci, and L. Poluzzi. 2017. “Study on GPS–PPP Precision for Short Observation Sessions.” GPS Soluttions 21 (3): 887–896. https://doi.org/10.1007/s10291-016-0575-4
- Ge, Y., X. Cao, D. Lyu, Z. He, F. Ye, G. Xiao, and F. Shen. 2023. “An Investigation of PPP Time Transfer via BDS-3 PPP-B2b Service.” GPS Solutions 27 (2): 61. https://doi.org/10.1007/s10291-023-01402-y
- Ge, M., G. Gendt, M. Rothacher, C. Shi, and J. Liu. 2008. “Resolution of GPS Carrier-Phase Ambiguities in Precise Point Positioning (PPP) with Daily Observations.” Journal of Geodesy 82 (7): 389–399. https://doi.org/10.1007/s00190-007-0187-4
- Guo, Q. 2015. “Precision Comparison and Analysis of Four Online Free PPP Services in Static Positioning and Tropospheric Delay Estimation.” GPS Solutions 19 (4): 537–544. https://doi.org/10.1007/s10291-014-0413-5.
- Heo, Y., B. Li, S. Lim, and C. Rizos. 2009. “Development of a Network Real-Time Kinematic Processing Platform.” Proceedings of the 22nd International Technical Meeting of Satellite Division of the Institute of Navigation (ION GNSS 2009), Georgia, USA.
- Heroux, P., and J. Kouba. 2001. “GPS Precise Point Positioning Using IGS Orbit Products.” Physics and Chemistry of the Earth 26 (6-8): 573–578. https://doi.org/10.1016/S1464-1895(01)00103-X
- Hofmann-Wellenhof, B., H. Lichtenegger, and J. Collins. 1997. Global Positioning System: Theory and Practice. 4th ed. Wien: Springer.
- Jian-Ping, Y. U. 2019. “A Method of Cell Grid Process and Network Optimization with Tyson Polygon.” Journal of Shandong Agricultural University (Natural Science Edition) 50: 492–494.
- Kouba, J., and P. Héroux. 2001. “Precise Point Positioning Using IGS Orbit and Clock Products.” GPS Solutions 5 (2): 12–28. https://doi.org/10.1007/PL00012883
- Lachapelle, G., M. E. Cannon, and G. Lu. 1992. “High Precision GPS Navigation with Emphasis on Carrier Phase Ambiguity Resolution.” Marine Geodesy 15 (4): 253–269. https://doi.org/10.1080/01490419209388062
- Leick, A. 1990. GPS Satellite Surveying. Hoboken, NJ: Wiley.
- Li, Y., and G. Liu. April 2020. Area Queries Based on Voronoi Diagrams. In 2020 IEEE 36th International Conference on Data Engineering (ICDE) (pp. 2064-2068). IEEE.
- Liu, R., B. Guo, A. Zhang, and B. Yimwadsana. 2020. “Research on GPS Precise Point Positioning Algorithm with a Sea Surface Height Constraint.” Ocean Engineering 197: 106826. https://doi.org/10.1016/j.oceaneng.2019.106826
- Mader, G. L. 1992. “Rapid Static and Kinematic Global Positioning System Solutions Using the Ambiguity Function Technique.” Journal of Geophysical Research 97 (B3): 3271–3283. https://doi.org/10.1029/91JB02845
- Malinowski, Marcin. 2018 “Accuracy of Precise Point Positioning with GPS and GLONASS Satellites Constellation Using Online Web Services.” 2018 Baltic Geodetic Congress (BGC Geomatics). IEEE.
- Martín Furones, ÁE, A. B. Anquela Julián, J. L. Berné Valero, and M. Sanmartin. 2012. “Kinematic GNSS-PPP Results from Various Software Packages and Raw Data Configurations.” Scientific Research and Essays 7 (3): 419–431.
- Mendez Astudillo, J., L. Lau, Y.-T. Tang, and T. Moore. 2018. “Analyzing the Zenith Tropospheric Delay Estimates in Online Precise Point Positioning (PPP) Services and PPP Software Packages.” Sensors 18: 580, https://doi.org/10.3390/s18020580.
- Mireault, Y., P. Tétreault, F. Lahaye, P. Héroux, and J. Kouba. 2008. “Online Precise Point Positioning: A New, Timely Service from Natural Resources Canada.” GPS World 19 (9): 59–64.
- Natural Resources Canada, Precise Point Positioning. 2022. Available from: http://www.nrcan.gc.ca/earth-sciences/geomatics/geodetic-systems/tools-applications/10925#ppp (accessed 02/12/2022).
- Okabe, A., B. Boots, K. Sugihara, and S. N. Chiu. 2000. Spatial Tesselations: Concepts and Applications of Voronoi Diagrams, 2nd ed., 671. Chichester: Wiley.
- Sobeih, M. F., M. I. Doma, and A. F. El Shoney. 2010. “Mixture-Order Design of GPS Networks Based on Genetic Algorithms.” ERJ. Engineering Research Journal 33 (4): 431–439. https://doi.org/10.21608/erjm.2010.67343
- Survey Research Institute (SRI) Technical Report. 2014. The Technical Report of the Survey Work Performed for the Area Between Rosetta and El-Brullus as Part of the Project Adaptation of the Nile Delta to Climatic Changes and Sea Water Rise. NWRC.
- TBC Reference Manual. 2008. Trimble Business Center Reference Manual. Trimble Navigation Limited Engineering and Construction Division.
- Tétreault, P., J. Kouba, P. Héroux, and P. Legree. 2005. “CSRS-PPP: An Internet Service for GPS User Access to the Canadian Spatial Reference Frame.” Geomatica 59 (1): 17–28.
- Wang, F., M. Ye, H. Zhu, and D. Gu. 2022. “Optimization Method for Conventional Bus Stop Placement and the Bus Line Network Based on the Voronoi Diagram.” Sustainability 14: 7918. https://doi.org/10.3390/su14137918.
- Wanninger, L. 2003. “Virtual Reference Stations (VRS).” Gps Solutions 7 (2): 143–144. https://doi.org/10.1007/s10291-003-0060-8
- Weaver, Brian, Daniel T. Gillins, and Michael Dennis. 2018. “Hybrid Survey Networks: Combining Real-Time and Static GNSS Observations for Optimizing Height Modernization.” Journal of Surveying Engineering 144 (1): 1–17. https://doi.org/10.1061/(ASCE)SU.1943-5428.0000244
- Woodgate, P., I. Coppa, S. Choy, S. Phinn, L. Arnold, and M. Duckham. 2017. “The Australian Approach to Geospatial Capabilities: Positioning, Earth Observation, Infrastructure, and Analytics: Issues, Trends, and Perspectives.” Geospatial Information Science 20 (2): 109–125.
- Xu, G. 2007. GPS: Theory, Algorithms and Applications, 2nd ed. Berlin: Springer.
- Yang, F. X., L. Zhao, L. Li, S. J. Feng, and J. H. Cheng. 2019. “Performance Evaluation of Kinematic BDS/GNSS Real-Time Precise Point Positioning for Maritime Positioning.” Journal of Navigation 72 (1): 34–52. https://doi.org/10.1017/S0373463318000644.
- Zumberge, J. F., M. B. Heflin, D. C. Jefferson, M. M. Watkins, and F. H. Webb. 1997. “Precise Point Positioning for the Efficient and Robust Analysis of GPS datafrom Large Networks.” Journal of Geophysical Research 102 (B3): 5005–5017. https://doi.org/10.1029/96JB03860