
 ?Mathematical formulae have been encoded as MathML and are displayed in this HTML version using MathJax in order to improve their display. Uncheck the box to turn MathJax off. This feature requires Javascript. Click on a formula to zoom.
ABSTRACT
Estimating downwelling surface longwave radiation (DSLR) under cloudy-sky conditions presents a significant challenge, the parameterization methods used to estimate cloudy-sky DSLR may yield disparate results for the same scenario. Hence, it is imperative to undertake a comparative and validation study of these methods to comprehend their applicability. This study compares and validates five parameterized schemes for estimating cloudy-sky DSLR using data from the Fengyun-4A (FY-4A) and Himawari-8 geostationary satellites. Additionally, an improved algorithm for cloudy-sky DSLR estimation is proposed, integrating the radiation effect of the entire cloud layer and a nonlinear parameterization algorithm. The verification results demonstrate that the nonlinear parameterization algorithm exhibits higher accuracy compared to those reliant on cloud-base temperature. Among these, the improved algorithm has high accuracy similar to the nonlinear algorithms in BSRN (Baseline Surface Radiation Network) and TPDC (National Tibetan Plateau Data Center) sites, its RMSE are 29.62 and 30.09 W/m2, respectively. Sensitivity analysis reveals that cloud type and cloud-base temperature exert a pronounced influence on DSLR estimation, particularly within parameterization algorithms based on cloud-base temperature, warranting thorough consideration. Furthermore, the influence of land cover type and surface elevation, especially in high-altitude regions with bare surfaces, should not be disregarded in DSLR estimation.
1. Introduction
Surface net radiation is an important component of surface energy balance, and one of the important parameters of various land surface process models, which affects land-atmosphere energy exchange, water cycle, surface biochemical processes, and climate change. Downwelling surface longwave radiation (DSLR) is mainly affected by atmospheric heat storage and air moisture content (Tian et al. Citation2023) and the vertical distribution of clouds, and its estimation is more challenging than other radiation components. Over the past few decades, numerous estimation algorithms have been developed for estimating DSLR under clear-sky conditions, categorized into two main approaches: physical model methods and parameterization methods. The physical model method employs near-surface meteorological parameters derived from satellites or station observations to calculate atmospheric emissivity and estimates the clear-sky DSLR based on the Stefan–Boltzmann law. Some scholars use air temperature and water vapor pressure to estimate atmospheric emissivity (Brutsaert Citation1975; Crawford and Duchon Citation1999; Idso Citation1981; Iziomon, Mayer, and Matzarakis Citation2003), while others only use air temperature (Idso and Jackson Citation1969; Swinbank Citation1963) or water vapor pressure (Brunt Citation1932; Garratt Citation1992). On the other hand, the parameterization method establishes a parameterized estimation relationship between satellite observation data and clear-sky DSLR. There are two primary categories of parameterization methods. The first category directly employs the radiance measurements at the top of the atmosphere to estimate DSLR by using different statistical regression methods, such as linear regression parameterization method, nonlinear regression parameterization method, and hybrid methods (Tang and Li Citation2008; Wang and Liang Citation2009; Yan et al. Citation2016; Yu et al. Citation2022; Zhou et al. Citation2019). The second category establishes the parameterized relationship between satellite or station observations, including near-surface air temperature, water vapor content, and other meteorological parameters, and DSLR (Nussbaumer and Pinker Citation2012; Yu et al. Citation2019).
Clouds not only absorb longwave radiation emitted from the surface and atmosphere, but also emit longwave radiation as emitters. The cloudy-sky DSLR can be estimated by adding cloud fraction or other cloud parameters into an empirical correction formula, building upon clear-sky DSLR estimation schemes (Crawford and Duchon Citation1999; Jacobs Citation1978; Lhomme, Vacher, and Rocheteau Citation2007; Maykut and Church Citation1973). While some recent studies (Cheng, Yang, and Guo Citation2019; Liu et al. Citation2020) have assessed and verified these empirical algorithms in recent years, their suitability for large-scale DSLR estimation remains limited due to the need for coefficient adjustments in specific regions. In addition to the aforementioned empirical approach, the parameterized estimation scheme can also be established by considering the influence of cloud attributes. Assuming that clouds have an additional contribution to DSLR, it can be expressed as the sum of clear-sky and cloud radiation (Kimball, Idso, and Aase Citation1982). According to different schemes for quantifying cloud radiation contribution, cloudy-sky DSLR parameterized estimation algorithms can be divided into two categories. One is a parameterized scheme based on cloud-base temperature. Schmetz, Schmetz, and Raschke (Citation1986) proposed a scheme to correct cloud radiation contribution using the difference between cloud-base temperature and air temperature as an adjustment factor. Gupta (Citation1989) established a cloudy-sky DSLR estimation scheme by separately considering the influence of the atmosphere and clouds, in which the radiation contribution of the cloud is represented by the nonlinear relationship between the cloud-base temperature and the atmospheric water vapor content, and then Gupta, Darnell, and Wilber (Citation1992) subsequently improved the coefficients of this nonlinear relationship to enhance its applicability. Diak et al. (Citation2000) proposed an algorithm for quantifying cloud radiation by establishing a single-layer cloud model based on cloud-base temperature. Another type of estimation scheme directly uses near-surface air temperature, water vapor content, and cloud parameters to establish a nonlinear parameterized algorithm. Zhou and Cess (Citation2001) employed surface upwelling longwave radiation (SULR), precipitable water vapor, and liquid water path to establish a parameterized estimation scheme. Then, Zhou et al. (Citation2007) increased the offset of the logarithmic water vapor term to avoid large estimation error under low water vapor conditions, and introduced the ice water path to account for the influence of ice clouds on cloudy-sky DSLR estimation. Wang et al. (Citation2020) developed a nonlinear parametric model by using cloud top temperature instead of cloud-base temperature, which reduces the error caused by the large uncertainty in cloud-base height estimation.
The above five algorithms include not only physically meaningful parameterization methods that individually quantify cloud radiation contributions, but also nonlinear parameterization methods based on remote sensing data and field observations, which are very representative. However, the algorithms based on cloud-base temperature using only cloud-base radiation to replace the entire cloud radiation are prone to overestimation. The nonlinear parametric algorithm may achieve better performance, but its mechanism is unclear and its scope of application is limited. These parameterized algorithms may have different performances in different scenarios, so it is, therefore, necessary to conduct comparative and validation studies on these methods to understand their performance and applicability. Moreover, there has been relatively limited research focusing on estimation algorithms for geostationary satellites, with only a few studies (Diak et al. Citation2000; Letu et al. Citation2022; Letu et al. Citation2023; Yu et al. Citation2022) addressing this aspect. With the continuous advancement of geostationary satellites, their spatial resolution is progressively improving, opening up new avenues for cloudy-sky DSLR estimation. Hence, this study selected five widely used and highly representative parameterization algorithms for comparative verification using FY-4A and Himawari-8 geostationary satellite data. At the same time, how to ensure the accuracy of the retrieval algorithm and better demonstrate the mechanism of cloudy-sky DSLR estimation is also an urgent problem to be solved on geostationary satellite data. Building upon this foundation, this study proposed an improved parametric algorithm to estimate cloudy-sky DSLR by considering the radiation effect of the entire cloud layer and integrating the advantages of nonlinear methods. The structure of the article is outlined as follows: Section 2 introduces the satellite data and the ground measurements. Section 3 presents the cloudy-sky estimation algorithms and the verification strategy. Section 4 provides an analysis of the verification results from both field-based and satellite-based data. Finally, Sections 5 and 6 present the Discussion and Conclusions, respectively.
2. Data
2.1. Satellite data
Fengyun-4A (FY-4A) heralds the next generation of Chinese geostationary meteorological satellites. Equipped with the Advanced Geosynchronous Radiation Imager (AGRI), FY-4A is primarily dedicated to gathering cloud-related data and boasts the capability to accurately distinguish between various cloud types. FY-4A provides a variety of products, including cloud phase, cloud top height/temperature, layer precipitable water, land surface temperature, and various other datasets (Guo et al. Citation2017). Himawari-8 offers exceptional advantages for observing target areas, including high resolution, frequent observations, and an extensive coverage range. Over time, various physical products, such as aerosol, clouds, sea surface, and fire point, have been gradually developed (Letu et al. Citation2022).
Both FY-4A and Himawari-8 satellites are orbiting over the Asia region, resulting in a significant overlap in their observation areas. This overlap enables complementary data collection in the same geographic regions, enhancing the observation capabilities for phenomena such as clouds. This study compares and validates parametric algorithms using cloud attribute products available in 2019. The specific products employed are detailed in .
Table 1. Satellite data and reanalysis data used in this study.
2.2. ERA5 reanalysis data
The ERA5 reanalysis dataset provides estimates of atmospheric, land and ocean climate variables spanning from 1959 to the present, with a spatial resolution of 0.25° × 0.25° (Hersbach et al. Citation2020). In this study, we primarily utilize data from the ERA5 hourly datasets, including the ERA5 hourly data on single levels and ERA5 hourly data on pressure levels. The ERA5 hourly data on single levels dataset provides essential variables such as 2-m air temperature, 2-m dew point temperature, liquid water path, and total column water vapor at hourly resolution. These variables serve to fill in any gaps present in satellite observations. Meanwhile, the ERA5 hourly data on pressure levels dataset provides temperature profile data with a 1-h temporal resolution at 37 layers from 1000 to 1 hPa. This information is utilized in calculating cloud-base temperature.
2.3. Ground measurements
2.3.1. ARM
The Atmospheric Radiation Measurement Project (ARM) provides the capability to collect long-term observations of clouds, radiation, and atmospheric dynamic and thermal conditions under different climate backgrounds (Ackerman and Stokes Citation2003; Stokes and Schwartz Citation1994). This study concentrated on three sites characterized by distinct climatic conditions: the Southern Great Plains Lamont site (SGP-C1), the North Slope of Alaska Barrow site (NSA-C1), and the Tropical Western Pacific Manus site (TWP-C1). We extracted the DSLR, SULR, precipitable water vapor, liquid water path, cloud top/base height, and cloud fraction, while surface air temperature was derived from the atmospheric profile product. Additionally, we computed the dew temperature using an empirical algorithm based on surface air temperature.
2.3.2. BSRN
The Baseline Surface Radiation Network (BSRN) stands as the world's largest research-grade radiation measurement network, which has 64 stations distributed in various climate regions from 80°N to 90°S (Driemel et al. Citation2018). In this study, we selected 11 time-continuous stations (in ) data within the geostationary satellite observation field of view from the BSRN observation network to validate the cloudy-sky DSLR estimation schemes by extracting in-situ measurements data. Note that the DSLR observations were sourced from the BSRN Toolbox V2.6 (Schmithüsen, Sieger, and König-Langlo Citation2012).
Table 2. Descriptions of sites in the BSRN network.
2.3.3. TPDC
The National Tibetan Plateau Data Center (TPDC) serves as a central repository for data across various disciplines and fields. In this study, time-continuous observation data from 9 stations belonging to the Watershed Allied Telemetry Experimental Research (WATER) and the Cold and Arid Research Network of Lanzhou University (CARN) within TPDC (Che et al. Citation2019; Liu et al. Citation2018; Zhao and Zhang Citation2020) were also utilized to validate the cloudy-sky DSLR estimation schemes. Note that the time resolution of DSLR measurements provided by TPDC is 10 min, so time matching is required when using these data to verify the cloudy-sky DSLR estimation algorithms.
3. Methods
The contribution of cloudy-sky DSLR mainly comes from the cloud and the atmosphere below the cloud. Based on the aforementioned derivation, under cloudy-sky conditions, the DSLR can be simplified as:
(1)
(1) where
represents the DSLR from the atmosphere below the cloud. Note that considering that the thermal radiation contribution mainly comes from the lower atmosphere, most researchers use the clear-sky DSLR estimation scheme to calculate
. Therefore, the DSLR estimation algorithm under cloudy sky conditions focuses on the quantification of cloud radiation contribution.
3.1. Existing cloudy-sky DSLR estimation algorithms
3.1.1. The algorithm-based cloud-base temperature of Schmetz, Schmetz, and Raschke (Citation1986)
The cloud's contribution mainly depends on the absorbing mass between the cloud and the surface, Schmetz, Schmetz, and Raschke (Citation1986) proposed using cloud factor based on cloud-base temperature and air temperature to correct the cloud radiation contribution in cloudy-sky DSLR estimation algorithm (hereafter, Schmetz1986).
(2)
(2) where
is the Stefan–Boltzmann constant,
is the atmospheric emissivity,
is the cloud emittance,
is the cloud-base temperature, and
is the air temperature, and
is the cloud fraction. Note, the
and
that this study uses the alternative from Prata’s (Citation1996) clear-sky estimation model.
3.1.2. The algorithm-based cloud-base temperature of Gupta (Citation1989)
Taking into account that the cloudy-sky DSLR is affected by cloud-base temperature and water vapor content, Gupta (Citation1989) established the parameterization scheme to calculate the radiation from the cloud. Considering the vertical distribution of the atmosphere, the estimation method for cloudy-sky can be expressed (hereafter, Gupta Citation1989):
(3)
(3) where
represents the total water vapor content under the sub-cloud,
∼
are fitting coefficients. Note that the
was use the clear-sky estimation scheme from Gupta (Citation1989).
(4)
(4)
(5)
(5)
(6)
(6) where
is the atmospheric effective emitting temperature,
is the total water vapor content,
is the surface skin temperature,
and
are the mean temperatures of the lowest two layers (surface∼850 hPa and 850∼680 hPa), and
.
3.1.3. The algorithm-based cloud-base temperature of Diak et al. (Citation2000)
Relying on the fact that the majority of the DSLR mainly from the near-surface atmosphere (Prata Citation1996; Schmetz Citation1989), Diak et al. (Citation2000) proposed a comprehensive parameterized scheme, which can be expressed as follows (hereafter, Diak2000):
(7)
(7) This model uses cloud-base temperature to estimate cloud radiation and is also known as the single-layer cloud model. Wang et al. (Citation2018) and Yang and Cheng (Citation2020) used this model to estimate the cloudy-sky DSLR based on MODIS data, it should be pointed out that this model will significantly overestimate, especially when low-level clouds exist.
3.1.4. The nonlinear parameterization algorithm of Zhou et al. (Citation2007)
Zhou et al. (Citation2007) employed the SULR and column precipitable water vapor to retrieve DSLR and added the cloud liquid water path and ice water path to consider cloud effects. The model is expressed as (hereafter, Zhou2007):
(8)
(8) where
is the column precipitable water vapor,
is the cloud liquid water path,
is the ice water path,
∼
are regression coefficients.
3.1.5. The nonlinear parameterization algorithm of Wang et al. (Citation2020)
Recognizing the challenge in acquiring parameters like LWP, IWP and, Wang et al. (Citation2020) established a non-linear parameterization algorithm to estimate DSLR by using cloud top temperature and the column water vapor, and is expressed as (hereafter, Wang2020):
(9)
(9)
(10)
(10) where
is the land surface temperature,
is the column water vapor,
is the cloud top temperature,
∼
,
∼
,
∼
, and
∼
are regression coefficients. Note that the coefficients in this algorithm are fitted from CERES satellite products. For the specific fitting process, please refer to Wang et al. (Citation2020).
3.2. Improved algorithm to estimate cloudy-sky DSLR
Under cloudy sky conditions, DSLR mainly comes from two parts, one part is the radiation of the cloud itself, and the other part is the radiation from the atmosphere below the cloud. The radiative forcing of clouds is contributed by the entire cloud layer and can be quantified by the effective cloud temperature (Jiang, Tang, and Zhang Citation2023). If only cloud-base temperature is used to characterize the radiation contribution of the entire cloud layer, it will cause serious overestimation problems. Therefore, it is more reasonable to use cloud-effective temperature to replace cloud-base temperature when estimating cloud radiation. On this basis, this study uses cloud-effective temperature to establish a parameterized algorithm, which can be expressed as:
(11)
(11) where
is the cloud's effective temperature, it can be calculated by numerical integration from the cloud top to base.
is set to 1, and
is calculated according to the scheme of Prata (Citation1996). For radiation from the atmosphere below clouds, the usual practice is to estimate it by using the clear-sky DSLR estimation scheme, and this study also uses the algorithm under clear skies. It should be noted that a variety of clear-sky DSLR algorithms have been developed, Jiao and Mu (Citation2022) have verified commonly used algorithms and found that nonlinear algorithms (EquationEquation 9
(9)
(9) ) from Wang et al. (Citation2020) that consider surface temperature and atmospheric water vapor content have better performance (bias of −5.48 W/m2, RMSE of 23.23 W/m2, R2 of 0.88). Therefore, this study also uses this nonlinear algorithm to estimate the radiation from the atmosphere below clouds.
3.3. Validation strategy
FY-4A and Himawari-8 provide different cloud attribute products, and their coverage slightly differs. To enhance the accuracy of verifying various parameterization algorithms using geostationary satellite data, this study provides two different verification strategies based on the satellite data sources employed (in ). Strategy 1: FY-4A products serve as the primary data source, and missing parameters required by each algorithm are complemented using Himawari-8 and ERA5 reanalysis data. Strategy 2: Using Himawari-8 products as the primary data source, with missing parameters supplemented by FY-4A and ERA5 reanalysis data. Attributed to inconsistent temporal and spatial resolutions of FY-4A data, Himawari-8 data, and ERA5 reanalysis data, it is necessary to perform spatiotemporal matching of data from different sources before algorithm verification. The verification process will involve multi-source and multi-scale data such as satellite data, reanalysis data and surface observation data. This study first scale-converts multi-source data to the resolution of geostationary satellite observation data, and then uses the nearest neighbor method to match estimated values with field observations.
Table 3. Descriptions of site conditions in the TPDC.
Table 4. Validation strategy and its required data sources.
4. Results
4.1. Validation results of existing algorithms
4.1.1. Validation results from field-based data
The atmospheric and cloud parameters observed by satellite sensors have large uncertainties, while the field-based data provided by ground observation sites are of high quality and accurate. To ensure the accurate verification of each algorithm's performance, this study initially utilizes the measured data of three field observation sites of NSA, SGP and TWP from 2010 to compare different algorithms. Note that, the field-base verification involves utilizing measurement data from three distinct observation stations to validate the parameterization schemes mentioned above, so only the matching on the time scale is required.
shows validation results for the cloudy-sky DSLR estimation models using in-suit observation data from NSA, SGP, and TWP sites. It is apparent that the algorithms of Schmetz1986, Gupta1989, and Diak2000 have fully considered the influence of cloud-base temperature on cloud-sky DSLR and have employed specific parameterized formulas to characterize the influence on cloud radiation. Consequently, the results of these three algorithms exhibit similar variation trends. Among them, the algorithm of Schmetz1986 achieves the highest estimation accuracy, primarily because Schmetz1986s algorithm incorporates the difference between cloud-base temperature and near-surface air temperature as a compensatory factor, resulting in the Root Mean Square Error (RMSE) of less than 20 W/m2. Gupta, Darnell, and Wilber (Citation1992) pointed out that in the presence of high clouds, detecting low and middle clouds might be challenging, leading to an overestimation of the cloud-base height. This discrepancy contributes to the underestimation observed in the low DSLR region among the three algorithms based on cloud temperature.
Figure 1. Validation of DSLR estimated by different algorithms versus field measurements.
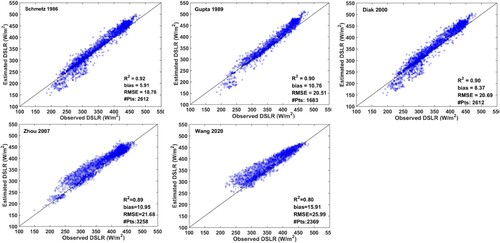
The algorithms of Zhou2007 and Wang2020 performed poorly in the field verification results, among which the algorithm of Wang2020 performed the worst, with a bias (estimated minus measured DSLR) greater than 15 W/m2 and an RMSE greater than 25 W/m2. Compared to the previously mentioned three algorithms, Wang2020s algorithm exhibits significant overestimation. This discrepancy may arise from the algorithm's utilization of cloud top temperature instead of cloud-base temperature to characterize the radiative contribution of clouds. Since the algorithms of Zhou2007 and Wang2020 are established using nonlinear statistical relationships, the exact regression coefficients depend on the specific training dataset. The presence of certain discrepancies between the training and verification data, especially the Wang2020 algorithm is established based on satellite data, this is the reason why these two algorithms produce large errors when they are verified based on the measured data.
4.1.2. Verification results from satellite-based data
4.1.2.1. Verification in BSRN
To accurately verify the applicability of cloudy-sky DSLR estimation algorithms on geostationary satellite data, this study employs field observations to verify the estimation accuracy based on the validation strategy. Given the differing time resolutions of the measured data in the BSRN and WATER observation networks, we utilize both networks to ensure the precision of verification results and analyze the performance of each algorithm. Initially, we utilize data from 11 stations within the BSRN observation network for verification. shows the performance of each algorithm under two different verification strategies. Note that the color bar in represents density, and the brighter the color, the more aggregated the verification data. From the figure, we found that when comparing results from the two verification strategies, the same algorithm exhibits similar performance. Nevertheless, the verification results under Strategy 1 are slightly worse than those under Strategy 2. On the whole, whether under Strategy 1 or Strategy 2, each algorithm tends to overestimate DSLR, with the Diak2000 algorithm demonstrating the largest bias and the Wang2020 algorithm displaying the smallest.
Figure 2. Comparisons between measured DSLR at BSRN sites and that estimated from geostationary satellite data (The left side is the verification result under Strategy 1, and the right side is the verification result under Strategy 2.).
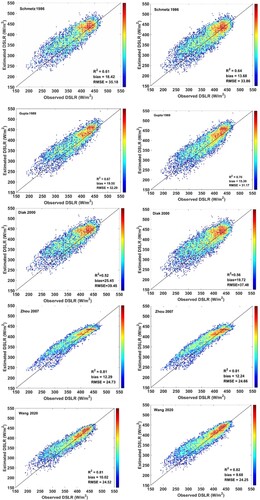
When evaluating individual algorithms, both Zhou2007 and Wang2020 demonstrated superior performance compared to the other algorithms. Among them, the algorithm of Wang2020 exhibited the highest accuracy, with biases of 9.68 W/m2 and 10.02 W/m2 under the conditions of Strategy 1 and Strategy 2, respectively, along with RMSEs of 24.25 W/m2 and 24.52 W/m2, respectively. Conversely, the remaining three algorithms performed less satisfactorily.
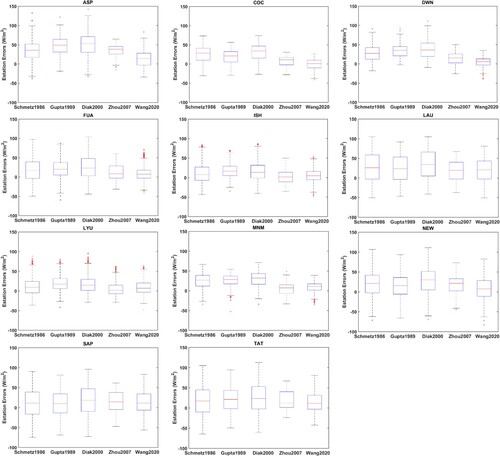
Considering the distinct geographical locations and underlying surfaces at each site, it's expected that the error distribution of each algorithm may vary across different locations. To provide a comprehensive understanding of these variations, we conducted a comparative analysis of individual algorithms on different sites, as shown in . Note that, here we only analyze the different performances of different algorithms at the same site. Viewed from a single site, the error distribution of each algorithm shows the same trend as that of all sites. Since the underlying surface, elevation and other parameters of each site are different, it will inevitably lead to different estimation accuracy between different sites. We will discuss this in detail in Section 5.
Figure 3. Box plots for the DSLR estimation errors from different sites.
4.1.2.2. Verification in TPDC
The WATER and CARN observation networks in TPDC are located in the Tibet Plateau, which is the highest plateau in the world and one of the most sensitive regions to global climate change. Given the pivotal role of surface radiation balance in this area, the findings hold significant implications for East Asia's broader climate dynamics and even the global energy balance. Therefore, this study selected 9 sites located in the Tibet Plateau region to compare and verify the performance of each cloudy-sky DSLR estimation algorithm. shows the estimated performance of each algorithm on these sites under the two verification strategies.
Figure 4. Comparisons between measured DSLR at TPDC sites and that estimated from geostationary satellite data (The left side is the verification result under Strategy 1, and the right side is the verification result under Strategy 2).
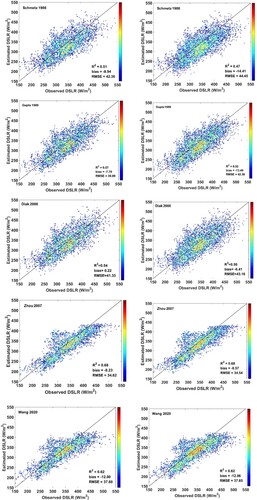
Overall, both verification strategies indicate significant underestimation, accompanied by relatively scattered estimation outcomes. The verification results of each algorithm in Strategy 1 are slightly better than the Strategy 2, but the gap is not obvious. When compared to the estimation results from the BSRN site, using TPDC data yields poorer estimation accuracy, possibly due to the higher altitude and complex terrain at the TPDC site. The effect of altitude on estimation error is discussed in Section 5. Among the individual algorithms, the bias of the Diak2000 algorithm is the smallest, which is 0.22 W/m2 and 6.41 W/m2 respectively under the two verification strategies; the RMSE of the Zhou2007 algorithm is the smallest, which is 34.62 W/m2 and 34.54 W/m2, respectively. The overall correlation of the two algorithms of Zhou2007 and Wang2020 is higher than that of the other three algorithms with geostationary satellite data, which indicates that the estimation results of these two algorithms are relatively reliable, and the results are similar to the results of the BSRN site verification. Note that there is a small gap between the verification results of Strategy 1 and Strategy 2. Therefore, in the following, this study analyzes the influencing factors of cloudy-sky DSLR based on Strategy 1.
4.2. Validation results of improved algorithms
To demonstrate the performance of the improved algorithm proposed in this study, we used the same data and verification strategy as mentioned above to verify the improved algorithm.
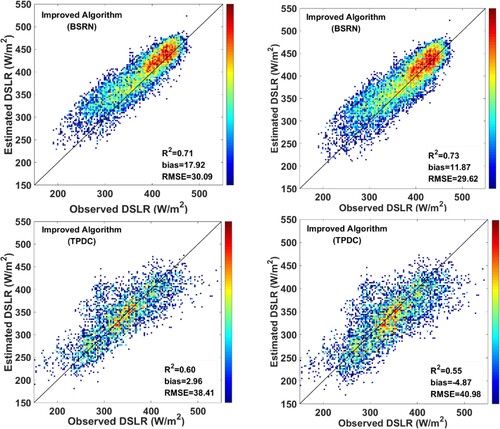
shows the comparison between estimated DSLR and observations under two different observation networks. It is evident that the newly proposed enhanced algorithm yields reasonable DSLR estimates, with an RMSE of less than 30 W/m2 in the BSRN observation network under Strategy 2. The improved algorithm has similar accuracy to the nonlinear parameterized algorithm mentioned above and performs better than the three algorithms based on cloud-base temperature. The newly proposed improved algorithm can not only achieve better performance but also quantitatively express the radiative forcing effect of clouds. It is worth noting that it can be clearly seen that the improved algorithm performs better in the BSRN observation network than in the TPDC observation network. This is because the stations in the TPDC observation network are located in high-altitude areas and the terrain is relatively rugged.
Figure 5. Comparisons between measured DSLR at sites and that estimated from geostationary satellite data (The left side is the verification result under Strategy 1, and the right side is the verification result under Strategy 2).
5. Discussion
As atmospheric conditions change, the cloud types and attributes will also change dynamically, which will change the DSLR estimation accuracy. Different cloud types exhibit varying cloud-base heights and thicknesses, thereby exerting diverse radiation effects that profoundly influence Earth's radiation balance. It is essential to analyze how DSLR varies with cloud attributes (cloud type, cloud-base temperature, and cloud fraction) and surface attributes (land cove types, surface altitude, and topography), so this study is based on five widely used parametric algorithms and the improved algorithm in this study to explore the influence of cloud attributes and surface attributes on DSLR estimation.
5.1. Effects of cloud types
Various cloud types possess distinct macroscopic and microphysical characteristics, including differences in particle radii, cloud water content, and the proportion of ice phase in cloud water. Furthermore, the vertical distribution of these microphysical quantities in clouds is also different, resulting in different radiation effects even for clouds of the same height and thickness. ISCCP (International Satellite Cloud Climatology Project) classifies clouds into 9 categories based on cloud top pressure and cloud optical thickness, including Cirrus (Ci), Cirrostratus (Cs), and Deep convective clouds (Dc) belong to high clouds, Altocumulus (Ac), Altostratus (As), and Nimbostratus (Ns) belong to middle clouds, Cumulus (Cu), Stratocumulus (Sc), and Stratus (St) belong to low clouds. Based on these cloud types, this study analyzes the influence of cloud types on cloudy-sky DSLR estimation, and the results are shown in .
Figure 6. Validation results of parameterization schemes for different cloud types.
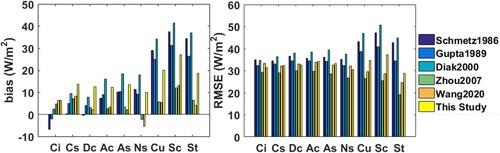
It can be seen from that as cloud types change from high clouds to low clouds, the bias and RMSE of the Schmetz1986, Gupta1989, Diak2000 and this study's algorithm steadily increase. Under high cloud conditions, all four parameterized algorithms exhibit biases of less than 15 W/m2, while under low cloud conditions, these biases exceed 20 W/m2. Similarly, we found that the RMSE of these four algorithms is also larger under low cloud conditions, and this result is consistent with the conclusion of Yu et al. (Citation2018) and Yang and Cheng (Citation2020). This phenomenon occurs due to the poor ability of satellites to detect and quantify clouds close to the ground (Schreiner et al. Citation1993). Optical sensors aboard geostationary satellites can only capture information from the uppermost cloud layer. For high clouds, if there are middle or low clouds under the high cloud layers, the corresponding information cannot be detected, resulting in underestimated cloud-base temperatures and, consequently, DSLR underestimation. This is the reason why the Schmetz1986 and Gupta1989 algorithms underestimate DSLR in the case of cirrus. It is worth noting that the bias of the improved algorithm proposed in this study is smaller under high cloud conditions than the algorithm based on cloud-base temperature. This is because the algorithm in this study reduces the reliance on CBH estimation. Conversely, the bias and RMSE of Zhou2007 and Wang2020 algorithms did not change regularly with the change of cloud types. These algorithms rely on cloud top temperature or cloud water content rather than cloud-base parameters to characterize cloud radiation effects. Since cloud-top parameter detection is more accurate than cloud-base parameter detection, their DSLR estimation errors are smaller than those of the four aforementioned algorithms.
5.2. Effects of cloud-base temperature
The cloud-base temperature is a crucial parameter to estimate the cloudy-sky DSLR (Diak et al. Citation2000; Gupta Citation1989; Schmetz, Schmetz, and Raschke Citation1986; Wang et al. Citation2018; Yang and Cheng Citation2020), and the DSLR mainly comes from the contribution of the cloud itself and the atmosphere below the cloud. Therefore, this study uses six cloud base temperature ranges to analyze their impact on cloudy-sky DSLR estimation: < 200 K, 200–220 K, 220–240 K, 240–260 K, 260–280 K, > 280 K.
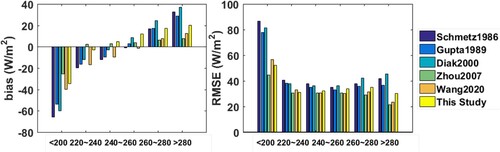
It can be seen from that as the cloud-base temperature gradually increases, the bias of each algorithm gradually changes from underestimation to overestimation. When the cloud-base temperature is less than 200 K, all algorithms exhibit significant underestimation, with biases ranging from −25.51 to −65.97 W/m2, and the RMSEs from 44.70–86.58 W/m2. This is because cloud-base temperatures are cooler at higher cloud heights. In the presence of high clouds, they tend to obstruct the middle and low cloud layers, leading to a significant underestimation of the estimated DSLR. When the cloud-base temperature is greater than 260 K, each algorithm shows overestimation, especially when it is greater than 280 K, the overestimation is more obvious, and its bias ranges from 7.54 to 32.54 W/m2. This is because when the cloud-base temperature is high, the cloud layer is relatively low, which is prone to overestimation. From the above analysis, we can conclude that when estimating DSLR under cloudy conditions, special attention should be paid to the occlusion of high clouds to middle and low clouds.
Figure 7. Validation results of parameterization schemes for different cloud- base temperature.
5.3. Effects of cloud fraction
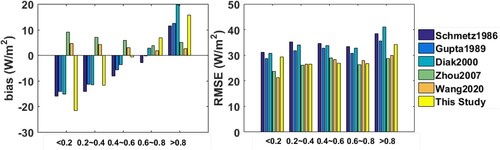
The cloud fraction determines the contribution of cloud radiation. This study uses five cloud fraction ranges to analyze their impact on cloudy-sky DSLR estimation: < 0.2, 0.2–0.4, 0.4–0.6, 0.6–0.8, and 0.8–1.0. shows the variation of the estimation error of each algorithm with the cloud fraction. It is evident that biases of the four algorithms based on cloud temperature gradually transition from underestimation to overestimation as cloud fraction increases, with a relatively small change range in RMSE. Among them, when the cloud fraction is less than 0.2, these four algorithms demonstrate the most significant underestimation, with biases ranging from −14.27 W/m2 to −21.62 W/m2. Conversely, when the cloud fraction is in the range of 0.8–1.0, these four algorithms demonstrate the most significant overestimation, with biases ranging from 11.53 W/m2 to 19.74 W/m2. This phenomenon may be attributed to the weak detection ability of satellites to broken clouds or clouds with a low cloud fraction, which leads to underestimation of DSLR. When the cloud fraction is small, the proportion of cloud radiation to DSLR is also small, so the impact on RMSE is not significant. Notably, the estimation error of Zhou2007 and Wang2020s algorithm is small and its bias does not show a trend of changing with the change of cloud fraction, which is because these two algorithms do not take into account the influence of cloud fraction.
Figure 8. Validation results of parameterization schemes for different cloud fraction.
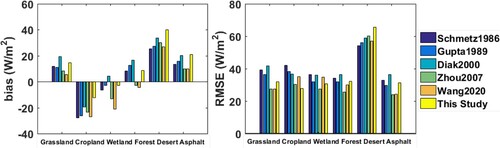
5.4. Effects of land cover types
Land cover type is an important factor that regulates the Earth-atmosphere interaction and subsequently affects DSLR estimation. In this study, the underlying surface types of the existing stations are divided into six categories, namely: grassland, cropland, wetland, forest, desert, and asphalt, to explore their impact on DSLR estimation. shows the performance of each algorithm under different land cover types. It can be seen that each algorithm shows serious overestimation under desert and asphalt types, with the largest errors observed in desert regions, ranging from biases of 25.12 W/m2 to 40.05 W/m2 and RMSE values varying from 54.28 W/m2 to 65.70 W/m2. In desert or barren surface cover types, a significant temperature deviation between land surface and air temperature is known to exist (Gupta et al. Citation2010). During DSLR estimation in each algorithm, land surface temperature is employed instead of air temperature, which may account for the substantial overestimation observed in desert areas. Conversely, under the cropland type, each algorithm shows obvious underestimation, with biases ranging from −12.58 W/m2 to −27.88 W/m2. However, it's worth noting that the RMSE values under the cropland type are relatively consistent with those of other land cover types, except for desert. This result is consistent with the conclusion of Cheng, Yang, and Guo (Citation2019). In summary, the estimation results of each algorithm are the worst in the desert-type regions, emphasizing the need to consider the temperature differential between land surface and air when estimating DSLR in such areas.
Figure 9. Validation results of parameterization schemes for different land cover types.
5.5. Effects of surface altitude and topography
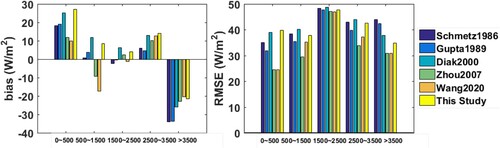
Changes in surface altitude lead to variations in water vapor and temperature, subsequently influencing Earth-atmosphere interactions and resulting in fluctuations in DSLR magnitude. Moreover, topography type, including flat terrain, hills, valleys, and peaks, significantly influences DSLR estimation. Therefore, this study combines surface altitude and topography type to analyze the impact on DSLR estimation. Surface altitude is categorized into five ranges for analysis: 0–500, 500–1500, 1500–2500, 2500–3500, and > 3500 meters.
From , it can be seen that the bias and RMSE of the estimated DSLR vary with the surface altitude. In the altitude range of 0–500 meters, each algorithm displays obvious overestimation, with biases ranging from 9.97 W/m2 to 26.98 W/m2. Notably, in areas with lower surface altitudes due to relatively flat terrain (most sites of BSRN), the influence of surface land cover type also needs to be considered. In the altitude range of 0∼500 meters, the surface land cover types are grassland, forest, and asphalt, all algorithms under these surface types show overestimation. This shows that the conclusions obtained in this section are consistent with Section 5.5. Conversely, at altitudes exceeding 3500 meters, each algorithm shows serious underestimation, with biases ranging from −20.35 W/m2 to −33.94 W/m2. This conclusion is consistent with that obtained by Cheng, Yang, and Guo (Citation2019). In high-altitude areas, the terrain is complex and the cloud layer height is high, and high clouds will block the middle and low clouds, resulting in the underestimation of DSLR. This conclusion is also consistent with the analysis results of the impact of cloud type and cloud-base temperature on DSLR.
Figure 10. Validation results of parameterization schemes for different surface altitude.
6. Conclusion
This study has conducted a comprehensive comparison and validation of five parametric methods for estimating cloudy-sky surface downwelling longwave radiation (DSLR) using both ground-measured data and geostationary satellite data. In validation against ground-measured data, the three algorithms based on cloud-base temperature have demonstrated superior estimation accuracy compared to the nonlinear parametric algorithms. However, when validated with geostationary satellite data, the nonlinear parameterization algorithms have exhibited better performance. Notably, algorithms based on cloud-base temperature are evidently reliant on cloud parameters, and the retrieval of these parameters introduces greater uncertainty, leading to diminished performance in DSLR estimation when applied to satellite data. Nonlinear parametric methods can achieve higher accuracy in estimating cloudy-sky DSLR when working with satellite data, and the applicability can be enhanced by expanding the training data set. However, the nonlinear parameterization algorithm lacks a physical mechanism, so it is necessary to establish an improved algorithm to improve its physical mechanism while ensuring its estimation accuracy.
On this basis, an improved cloudy-sky DSLR estimation algorithm was established by considering the radiation effect of the entire cloud layer and using a nonlinear estimation scheme of atmospheric radiation below clouds. The cloudy-sky DSLR estimate has been verified by using the ground-based data measured from the BSRN and TPDC network. The verification results showed that the improved algorithm exhibits high accuracy, its RMSE is 29.62 and 30.09 W/m2, respectively. This accuracy is similar to the performance of the nonlinear parameterized algorithm and compared with the algorithms based on cloud-base temperature, the bias and RMSE of the improved algorithm are smaller.
In addition, this study conducted a comprehensive analysis of the influence of latitude, cloud attributes (including cloud type, cloud-base temperature, and cloud fraction), land cover type, as well as surface elevation and topography on the estimation of cloudy-sky DSLR. The results revealed that cloud properties play a pivotal role in cloudy-sky DSLR estimation. A transition from high cloud to low cloud or from low cloud-base temperature to high cloud-base temperature leads to a shift in estimation error from underestimation to overestimation. This phenomenon is attributed to high clouds obscuring mid and low-level clouds, while satellite sensors exhibit reduced sensitivity in detecting low clouds. Moreover, the land cover type was found to exert a noticeable impact on DSLR estimation, potentially resulting in significant overestimation, especially in desert or barren regions. Additionally, surface altitude and topography also influenced DSLR estimation accuracy, manifesting as substantial underestimation in high-altitude areas.
Disclosure statement
No potential conflict of interest was reported by the author(s).
Additional information
Funding
References
- Ackerman, Thomas P., and Gerald M. Stokes. 2003. “The Atmospheric Radiation Measurement Program.” Physics Today 56 (1): 38–44. https://doi.org/10.1063/1.1554135.
- Brunt, D. 1932. “Notes on Radiation in the Atmosphere. I.” Quarterly Journal of the Royal Meteorological Society 58 (247): 389–420. https://doi.org/10.1002/qj.49705824704.
- Brutsaert, Wilfried. 1975. “On a Derivable Formula for Long-Wave Radiation from Clear Skies.” Water Resources Research 11 (5): 742–744. https://doi.org/10.1029/WR011i005p00742.
- Che, T., X. Li, S. Liu, H. Li, Z. Xu, J. Tan, Y. Zhang, et al. 2019. “Integrated Hydrometeorological, Snow and Frozen-Ground Observations in the Alpine Region of the Heihe River Basin, China.” Earth System Science Data 11 (3): 1483–1499. https://doi.org/10.5194/essd-11-1483-2019.
- Cheng, Jie, Feng Yang, and Yamin Guo. 2019. “A Comparative Study of Bulk Parameterization Schemes for Estimating Cloudy-Sky Surface Downward Longwave Radiation.” Remote Sensing 11: 528. https://doi.org/10.3390/rs11050528.
- Crawford, Todd M., and Claude E. Duchon. 1999. “An Improved Parameterization for Estimating Effective Atmospheric Emissivity for Use in Calculating Daytime Downwelling Longwave Radiation.” Journal of Applied Meteorology 38 (4): 474–480. https://doi.org/10.1175/1520-0450(1999)038<0474:AIPFEE>2.0.CO;2.
- Diak, G. R., W. L. Bland, J. R. Mecikalski, and M. C. Anderson. 2000. “Satellite-based Estimates of Longwave Radiation for Agricultural Applications.” Agricultural and Forest Meteorology 103 (4):349-355. https://doi.org/10.1016/S0168-1923(00)00141-6.
- Driemel, Amelie, John Augustine, Klaus Behrens, Sergio Colle, Christopher Cox, Emilio Cuevas-Agulló, Fred M. Denn, et al. 2018. “Baseline Surface Radiation Network (BSRN): Structure and Data Description (1992–2017).” Earth System Science Data 10 (3): 1491–1501. https://doi.org/10.5194/essd-10-1491-2018.
- Garratt, J. R. 1992. “Extreme Maximum Land Surface Temperatures.” Journal of Applied Meteorology 31 (9): 1096–1105. https://doi.org/10.1175/1520-0450(1992)031<1096:EMLST>2.0.CO;2.
- Guo, Qiang, Feng Lu, Caiying Wei, Zhiqing Zhang, and Jun Yang. 2017. “Introducing the New Generation of Chinese Geostationary Weather Satellites, Fengyun-4.” Bulletin of the American Meteorological Society 98 (8): 1637–1658. https://doi.org/10.1175/BAMS-D-16-0065.1.
- Gupta, Shashi K. 1989. “A Parameterization for Longwave Surface Radiation from Sun-Synchronous Satellite Data.” Journal of Climate 2 (4): 305–320. https://doi.org/10.1175/1520-0442(1989)002<0305:APFLSR>2.0.CO;2.
- Gupta, Shashi K., Wayne L. Darnell, and Anne C. Wilber. 1992. “A Parameterization for Longwave Surface Radiation from Satellite Data: Recent Improvements.” Journal of Applied Meteorology 31 (12): 1361–1367. https://doi.org/10.1175/1520-0450(1992)031<1361:APFLSR>2.0.CO;2.
- Gupta, Shashi K., David P. Kratz, Paul W. Stackhouse, Anne C. Wilber, Taiping Zhang, and Victor E. Sothcott. 2010. “Improvement of Surface Longwave Flux Algorithms Used in CERES Processing.” Journal of Applied Meteorology and Climatology 49 (7): 1579–1589. https://doi.org/10.1175/2010JAMC2463.1.
- Hersbach, Hans, Bill Bell, Paul Berrisford, Shoji Hirahara, András Horányi, Joaquín Muñoz-Sabater, Julien Nicolas, et al. 2020. ‘The ERA5 Global Reanalysis.’ Quarterly Journal of the Royal Meteorological Society 146 (730):1999–2049. https://doi.org/10.1002/qj.3803.
- Idso, Sherwood B. 1981. “A set of Equations for Full Spectrum and 8- to 14-μm and 10.5- to 12.5-μm Thermal Radiation from Cloudless Skies.” Water Resources Research 17 (2): 295–304. https://doi.org/10.1029/WR017i002p00295.
- Idso, Sherwood B., and Ray D. Jackson. 1969. “Thermal Radiation from the Atmosphere.” Journal of Geophysical Research 74 (23): 5397–5403. https://doi.org/10.1029/JC074i023p05397.
- Iziomon, M. G., H. Mayer, and A. Matzarakis. 2003. “Downward Atmospheric Longwave Irradiance Under Clear and Cloudy Skies: Measurement and Parameterization.” Journal of Atmospheric and Solar-Terrestrial Physics 65 (10): 1107–1116. https://doi.org/10.1016/j.jastp.2003.07.007.
- Jacobs, J. D.. 1978. “Radiation climate of Broughton island.” In Energy Budget Studies in Relation to Fast-Ice Breakup Processes, edited by Davis Strait, R.G. Bary, and J.D. Jacobs, 105–120. Boulder, CO, USA: Institute of Arctic and Alpine Research, University of Colorado.
- Jiang, Y., B. H. Tang, and H. Y. Zhang. 2023. “Estimation of Downwelling Surface Longwave Radiation for Cloudy Skies by Considering the Radiation Effect from the Entire Cloud Layers.” Remote Sensing of Environment 298: 113829. https://doi.org/10.1016/j.rse.2023.11382910.1016/j.rse.2023.113829.
- Jiao, Zhong-Hu, and Xihan Mu. 2022. “Global Validation of Clear-sky Models for Retrieving Land-Surface Downward Longwave Radiation from MODIS Data.” Remote Sensing of Environment 271:112903. https://doi.org/10.1016/j.rse.2022.112903.
- Kimball, B. A., S. B. Idso, and J. K. Aase. 1982. “A Model of Thermal Radiation from Partly Cloudy and Overcast Skies.” Water Resources Research 18 (4): 931–936. https://doi.org/10.1029/WR018i004p00931.
- Letu, Husi, Run Ma, Takashi Y. Nakajima, Chong Shi, Makiko Hashimoto, Takashi M. Nagao, Anthony J. Baran, et al. 2023. “Surface Solar Radiation Compositions Observed from Himawari-8/9 and Fengyun-4 Series.” Bulletin of the American Meteorological Society 104 (10): E1772–E1E89. https://doi.org/10.1175/BAMS-D-22-0154.1.
- Letu, Husi, Takashi Y. Nakajima, Tianxing Wang, Huazhe Shang, Run Ma, Kun Yang, Anthony J. Baran, et al. 2022. “A New Benchmark for Surface Radiation Products Over the East Asia–Pacific Region Retrieved from the Himawari-8/AHI Next-Generation Geostationary Satellite.” Bulletin of the American Meteorological Society 103 (3): E873–EE88. https://doi.org/10.1175/BAMS-D-20-0148.1.
- Lhomme, J. P., J. J. Vacher, and A. Rocheteau. 2007. “Estimating Downward Long-Wave Radiation on the Andean Altiplano.” Agricultural and Forest Meteorology 145 (3-4): 139–148. https://doi.org/10.1016/j.agrformet.2007.04.007.
- Liu, Shaomin, Xin Li, Ziwei Xu, Tao Che, Qing Xiao, Mingguo Ma, Qinhuo Liu, et al. 2018. “The Heihe Integrated Observatory Network: A Basin-Scale Land Surface Processes Observatory in China.” Vadose Zone Journal 17: 1. https://doi.org/10.2136/vzj2018.04.0072.
- Liu, Mengqi, Xiangdong Zheng, Jinqiang Zhang, and Xiangao Xia. 2020. “A Revisiting of the Parametrization of Downward Longwave Radiation in Summer Over the Tibetan Plateau Based on High-Temporal-Resolution Measurements.” Atmospheric Chemistry and Physics 20 (7): 4415–4426. https://doi.org/10.5194/acp-20-4415-2020.
- Maykut, Gary A., and Phil E. Church. 1973. “Radiation Climate of Barrow Alaska, 1962–66.” Journal of Applied Meteorology 12 (4): 620–628.
- Nussbaumer, Eric A., and Rachel T. Pinker. 2012. “Estimating Surface Long-Wave Radiative Fluxes at Global Scale.” Quarterly Journal of the Royal Meteorological Society 138 (665): 1083–1093. https://doi.org/10.1002/qj.974.
- Prata, A. J. 1996. “A new Long-Wave Formula for Estimating Downward Clear-sky Radiation at the Surface.” Quarterly Journal of the Royal Meteorological Society 122 (533): 1127–1151. https://doi.org/10.1002/qj.49712253306.
- Schmetz, Johannes. 1989. “Towards a Surface Radiation Climatology: Retrieval of Downward Irradiances from Satellites.” Atmospheric Research 23 (3-4): 287–321. https://doi.org/10.1016/0169-8095(89)90023-9.
- Schmetz, P., J. Schmetz, and E. Raschke. 1986. “Estimation of Daytime Downward Longwave Radiation at the Surface from Satellite and Grid Point Data.” Theoretical and Applied Climatology 37 (3): 136–149. https://doi.org/10.1007/BF00867847.
- Schmithüsen, Holger, Rainer Sieger, and Gert König-Langlo. 2012. BSRN Toolbox V2.0 – a Tool to Create Quality Checked Output Files from BSRN Datasets and Station-to-Archive Files. PANGAEA.
- Schreiner, Anthony J., Kathy I. Strabala, David A. Unger, W. Paul Menzel, Gary P. Ellrod, and Jackson L. Pellet. 1993. “A Comparison of Ground and Satellite Observations of Cloud Cover.” Bulletin of the American Meteorological Society 74 (10): 1851–1861. https://doi.org/10.1175/1520-0450(1973)012<0620:RCOBA>2.0.CO;2.
- Stokes, Gerald M., and Stephen E. Schwartz. 1994. “The Atmospheric Radiation Measurement (ARM) Program: Programmatic Background and Design of the Cloud and Radiation Test Bed.” Bulletin of the American Meteorological Society 75 (7): 1201–1221. https://doi.org/10.1175/1520-0477(1994)075<1201:TARMPP>2.0.CO;2.
- Swinbank, W. C. 1963. “Long-wave Radiation from Clear Skies.” Quarterly Journal of the Royal Meteorological Society 89 (381): 339–348. https://doi.org/10.1002/qj.49708938105.
- Tang, Bohui, and Zhao-Liang Li. 2008. “Estimation of Instantaneous net Surface Longwave Radiation from MODIS Cloud-Free Data.” Remote Sensing of Environment 112 (9): 3482–3492. https://doi.org/10.1016/j.rse.2008.04.004.
- Tian, Yinglin, Deyu Zhong, Sarosh Alam Ghausi, Guangqian Wang, and Axel Kleidon. 2023. “Understanding Variations in Downwelling Longwave Radiation Using Brutsaert's Equation.” Earth System Dynamics 14 (6): 1363–1374. https://doi.org/10.5194/esd-14-1363-2023.
- Wang, Wenhui, and Shunlin Liang. 2009. “Estimation of High-Spatial Resolution Clear-sky Longwave Downward and net Radiation Over Land Surfaces from MODIS Data.” Remote Sensing of Environment 113 (4): 745–754. https://doi.org/10.1016/j.rse.2008.12.004.
- Wang, Tianxing, Jiancheng Shi, Ya Ma, Husi Letu, and Xingcai Li. 2020. “All-sky Longwave Downward Radiation from Satellite Measurements: General Parameterizations Based on LST, Column Water Vapor and Cloud top Temperature.” ISPRS Journal of Photogrammetry and Remote Sensing 161: 52–60. https://doi.org/10.1016/j.isprsjprs.2020.01.011.
- Wang, Tianxing, Jiancheng Shi, Yuechi Yu, Letu Husi, Bo Gao, Wang Zhou, Dabin Ji, Tianjie Zhao, Chuan Xiong, and Ling Chen. 2018. “Cloudy-sky Land Surface Longwave Downward Radiation (LWDR) Estimation by Integrating MODIS and AIRS/AMSU Measurements.” Remote Sensing of Environment 205: 100–111. https://doi.org/10.1016/j.rse.2017.11.011.
- Yan, Guangjian, Tianxing Wang, Zhonghu Jiao, Xihan Mu, Jing Zhao, and Ling Chen. 2016. “Topographic Radiation Modeling and Spatial Scaling of Clear-sky Land Surface Longwave Radiation Over Rugged Terrain.” Remote Sensing of Environment 172: 15–27. https://doi.org/10.1016/j.rse.2015.10.026.
- Yang, Feng, and Jie Cheng. 2020. “A Framework for Estimating Cloudy sky Surface Downward Longwave Radiation from the Derived Active and Passive Cloud Property Parameters.” Remote Sensing of Environment 248, https://doi.org/10.1016/j.rse.2020.111972.
- Yu, Shanshan, Li Li, Biao Cao, Hailong Zhang, Lin Zhu, Xiaozhou Xin, and Qinhuo Liu. 2022. “Surface Downward Longwave Radiation Estimation from new Generation Geostationary Satellite Data.” Atmospheric Research 276:106255, https://doi.org/10.1016/j.atmosres.2022.106255.
- Yu, Shanshan, Xiaozhou Xin, Qinhuo Liu, Hailong Zhang, and Li Li. 2018. “Comparison of Cloudy-Sky Downward Longwave Radiation Algorithms Using Synthetic Data, Ground-Based Data, and Satellite Data.” Journal of Geophysical Research: Atmospheres 123 (10): 5397–5415. https://doi.org/10.1029/2017JD028234.
- Yu, Shanshan, Xiaozhou Xin, Qinhuo Liu, Hailong Zhang, and Li Li. 2019. “An Improved Parameterization for Retrieving Clear-Sky Downward Longwave Radiation from Satellite Thermal Infrared Data.” Remote Sensing 11: 425. https://doi.org/10.3390/rs11040425.
- Zhao, Changming, and Renyi Zhang. 2020. “Cold and Arid Research Network of Lanzhou university (an observation system of Meteorological elements gradient of Dunhuang Station, 2019).” edited by National Tibetan Plateau Data Center. National Tibetan Plateau Data Center.
- Zhou, Yaping, and Robert D. Cess. 2001. “Algorithm Development Strategies for Retrieving the Downwelling Longwave Flux at the Earth's Surface.” Journal of Geophysical Research: Atmospheres 106 (D12): 12477–12488. https://doi.org/10.1029/2001JD900144.
- Zhou, Yaping, David P. Kratz, Anne C. Wilber, Shashi K. Gupta, and Robert D. Cess. 2007. “An Improved Algorithm for Retrieving Surface Downwelling Longwave Radiation from Satellite Measurements.” Journal of Geophysical Research: Atmospheres 112: D15. https://doi.org/10.1029/2006jd008159.
- Zhou, Wang, Jiancheng Shi, Tianxing Wang, Bin Peng, Rui Zhao, and Yuechi Yu. 2019. “Clear-Sky Longwave Downward Radiation Estimation by Integrating MODIS Data and Ground-Based Measurements.” IEEE Journal of Selected Topics in Applied Earth Observations and Remote Sensing 12 (2): 450–459. https://doi.org/10.1109/JSTARS.2018.2878229.