
 ?Mathematical formulae have been encoded as MathML and are displayed in this HTML version using MathJax in order to improve their display. Uncheck the box to turn MathJax off. This feature requires Javascript. Click on a formula to zoom.
ABSTRACT
The ICESat-2 satellite equipped with a new photon-counting laser altimeter has received much attention as a source of accurate elevation observations. However, in this research field, there is a lack of an open-source high-accuracy elevation control point dataset with the specific quality requirements at a global scale. To this end, using ICESat-2 altimeter data as the main data source, we constructed and organized a dataset as a useful supplement for this research field. The dataset was generated by a methodology based on detection environment evaluation, photon spatial analysis, and the redundant observation statistics. The dataset includes more than 600 million elevation control points and covers the global land areas, except for Greenland and Antarctica. The dataset has been validated by multiple digital elevation models (DEMs) from around the world (sourced from airborne LiDAR data). The results show that the dataset has high-accuracy elevation control points. The overall root-mean-square error (RMSE) of the original elevations of ICESat-2 is about 1.384–4.820 m, but the overall RMSE of the elevation control points in the new dataset is about 0.279–0.642 m. Moreover, the results obtained in this study show that the dataset is suitable for application within high vegetation cover areas.
1. Introduction
Accurate elevation observations play a vital role in the research and applications of geoscience (Hawker et al. Citation2022; Li et al. Citation2022; Meadows, Jones, and Reinke Citation2024). The use of manual field surveys (ground surveying instruments, including GPS, etc.) to obtain accurate elevation information has a low efficiency (high labor costs and long survey time), and this approach is generally only suitable for application in a small area. Meanwhile, it is a challenging task to undertake field surveys within areas with harsh environments. To improve the above situations, instruments loaded onto airborne platforms, including laser altimeters, radar systems, high-resolution imagers, etc., have been used to observe the surface elevation below the platform. This measurement approach can survey large areas and improve the survey efficiency, compared to manual field surveys, but it is hard to survey at a global scale due to the high cost, especially for developing countries (Gong et al. Citation2011; Hawker et al. Citation2022). To break these limitations, an open-source global-scale accurate elevation observation dataset is a priority. As a result, the observations from satellite platforms are becoming of increasing interest to many scientists and scholars around the world. Among the different instruments, satellite laser altimeters perform (Li et al. Citation2023c; Markus et al. Citation2017; Martino et al. Citation2019; Schutz et al. Citation2005; Tang et al. Citation2020) well in accurate ranging, and satellite laser altimeter data have become the main data source for high-accuracy elevation information at a global scale.
Excluding some experimental payloads, the first satellite to be equipped with a laser altimeter for Earth observation was the Ice, Cloud, and Land Elevation Satellite (ICESat) (Schutz et al. Citation2005). Subsequently, other spaceborne platforms have been equipped with laser altimeters, including ICESat-2 (Markus et al. Citation2017; Martino et al. Citation2019), the Global Ecosystem Dynamics Investigation (GEDI) mission (Dubayah et al. Citation2020), Gaofen 7 (Tang et al. Citation2020; Xie et al. Citation2021a), etc., and are now operating in orbit. Among these spaceborne platforms, the laser altimeter (the Advanced Topographic Altimeter System, ATLAS) onboard ICESat-2 observes the Earth’s surface by using photon counting (simplistically defined as ‘photon count detection’) (Markus et al. Citation2017; Martino et al. Citation2019). The observations from other laser altimeters are obtained using the waveform energy (simplistically defined as ‘waveform energy detection’) (Dubayah et al. Citation2020; Schutz et al. Citation2005). Photon count detection is a new technology of laser altimetry for Earth observation. Compared with waveform energy detection, the instruments used for photon count detection need less energy and can obtain surface elevations with a high sampling (0.7 m) along the track (Markus et al. Citation2017; Martino et al. Citation2019; Neuenschwander and Pitts Citation2019; Xie et al. Citation2021b), which means that the ICESat-2 altimeter has the potential for providing higher-accuracy surface elevation data. Related studies have confirmed that ICESat-2’s products, such as ATL08, etc., have a high accuracy in general (Dandabathula, Verma, and Sitiraju Citation2020; Lian et al. Citation2022; Neuenschwander et al. Citation2020; Zhu et al. Citation2022). However, due to the influence of the complex detection environment, such as the variable atmosphere, the solar intensity, the relief of the object surface, etc., the data may have an uncertain quality (Duan et al. Citation2023; Li et al. Citation2023b; Moudrý et al. Citation2022; Tian and Shan Citation2021), resulting in the data not meeting the needs of mapping at a certain scale. Therefore, it is necessary to obtain the high-quality parts of the data through screening. Previous studies have evaluated the quality of ICESat-2’s altimeter data or proposed some criteria/methods for extracting the parts of the altimeter data with high quality by the use of quality evaluation labels (Cobb et al. Citation2023; Li et al. Citation2023b; Li et al. Citation2021; Moudrý et al. Citation2022; Neuenschwander et al. Citation2020; Tian and Shan Citation2021; Zhu et al. Citation2022). These studies have made a good contribution to the quality refinement of ICESat-2 altimetry data. However, there is a lack of an open-source high-accuracy elevation control point (ECP) dataset with specific quality requirements at a global scale. Elevation control point is a point of known elevation accuracy often used in least-squares analysis and adjustment for improving mapping accuracy, and it can also be used as one of the sources of elevation verification data for products such as digital terrain elevation.
In this study, based on the research basis of our previous study (Li et al. Citation2021), we further combined the redundant elevation observation statistics for constructing and organizing a high-quality dataset of ECPs from ICESat-2 altimeter data. The source of the dataset mainly is the ICESat-2 ATL08 product (the best-fit terrain elevation along 100-m ground track sampling, etc.) for the whole year of 2019, which ensures that the data can cover the global land areas since the ICESat-2 satellite repeats its Earth’s surface surveys every ∼91 days. To ensure the reliability of the dataset, we evaluated the accuracy of the ECPs within multiple areas around the world, and then comprehensively analyzed the quality of the ECPs in terms of different terrain, different vegetation cover, etc. This represents a useful supplementary study for the research field of open-source accurate elevation information and its cross-disciplinary applications, such as global-scale topographic mapping, vegetation biomass surveying, urban environmental monitoring, etc.
In the rest of the paper, we describe the materials (Section II), introduce the methodology (Section III), present the dataset, and report the accuracy of the validation results (Section IV). Finally, we gave our conclusions in Section V.
2. Materials
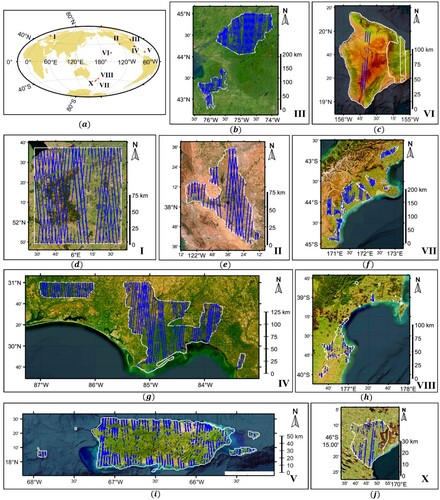
Three kinds of data were considered in this study: 1) satellite laser altimeter data; 2) global land-cover data; and 3) digital elevation model (DEM) data. The satellite laser altimeter data were used as the main source of ECPs. The global land-cover data acted as the auxiliary data (mask, etc.) for constructing the ECPs. The DEM data were of a high resolution and a high accuracy (elevation root-mean-square error (RMSE): ≤ 0.1 m). These DEM data covered some local areas of the global land areas and acted as the real elevation to validate the ECPs. shows the nine validation areas for ECPs around the world.
Figure 1. Validation areas for the elevation control points. (a) The geolocation (red points) of nine validation areas within the global land areas. (b) – (j) The distributions of the high-resolution DEMs (white line areas) and the elevation control points (blue points) within each validation area. I-X indicate the number of the study areas.
2.1. Satellite laser altimeter data
The satellite laser altimeter data were the ATL08 product. This kind of product is Level 3A in the ICESat-2 production system. This product (Neuenschwander and Pitts Citation2019) includes terrain height, canopy height, etc., at fixed-length steps along the ground track, such as 100 m.
The ATL08 product can be downloaded via EarthData (https://www.earthdata.nasa.gov/) or the National Snow and Ice Data Center (NSIDC, https://nsidc.org/). The ICESat-2 satellite repeats its observations every 91 days over the polar regions/oceans and points slightly off the overland (Markus et al. Citation2017; Martino et al. Citation2019). To ensure that the data covered the global land areas, we collected the ATL08 product for the whole year of 2019. There are about 54 thousand files for the whole year and the data volume is about 4.8 TB.
2.2. Global land-cover data
In the ATL08 product, there includes the land cover indicator for each elevation. The source of the land is the Copernicus Global Land Cover 2019 product (Neuenschwander and Pitts Citation2019; Neuenschwander et al. Citation2022), for which the spatial resolution is 100 m. This land cover indicator can be directly used as the mask to filter the elevations to reduce the amount of data required for subsequent use of high-resolution land cover products.
To enhance the analysis of the elevation surface, we added global land-cover data with a higher resolution. The additional data were the Finer Resolution Observation and Monitoring of Global Land Cover 10 m (FROM-GLC10, http://data.ess.tsinghua.edu.cn/fromglc10_2017v01.html). The main source of FROM-GLC10 is Sentinel-2 image data. In FROM-GLC10, the data are divided into 10 categories for the global land surface, and the overall accuracy of the data classification has been reported to be 72.76% (Gong et al. Citation2019).
2.3. Digital elevation model (DEM) data
The high-resolution DEM data were collected from open-source websites, including the National Oceanic and Atmospheric Administration (NOAA, https://www.noaa.gov/), Actueel Hoogtebestand Nederland (AHN, https://www.ahn.nl/), and the Land Information New Zealand Data Service (LINZ, https://data.linz.govt.nz/). All of these DEM data were sourced from airborne LiDAR surveys. The main characteristics (survey time, data resolution and elevation accuracy) of these DEM data are summarized in . The distribution of these DEM data is as shown in the white areas of . The main collection criteria for these DEM data were as follows:
The DEM data should have detailed information, including the elevation accuracy, special resolution, survey time, etc.
The DEM data should have a high resolution (better than 1 m), to avoid deviation of the validation results caused by a low resolution.
The survey time difference between the DEM data and the ICESat-2 laser altimeter data should be less than three years, to avoid deviation of the validation results caused by obvious change of the elevation surface.
The validation data needed to meet the ISPRS standard (Maune et al. Citation2014), i.e. the validation elevations’ (DEM data) accuracy should be 3 times better than the ECPs’ required accuracy.
The area covered by the DEM data should have multiple land-cover types (urban, vegetation, etc.), to more comprehensively analyze and evaluate the accuracy of the ECPs.
The multiple DEM data should have a good spatial distribution on the global scale.
Table 1. The Characteristics of the DEMs.
3. Methodology
3.1. Construction of the dataset
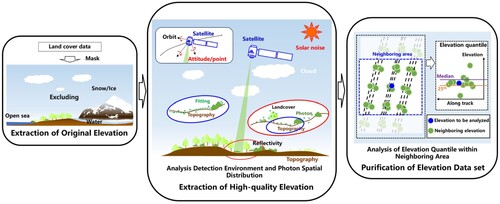
As shown in , the construction of the ECP dataset can be divided into three main steps: 1) extraction of the original elevation; 2) extraction of high-quality elevation; and 3) purification of the elevation data.
Figure 2. Schematic diagram for the construction of the dataset.
3.1.1. Extraction of the original elevation
The ATL08 elevations within ice-sheet areas can have significant variations due to the influence of the ice flow rate, etc. For this reason, the elevations located within Antarctica and Greenland were excluded from the construction of the ECP dataset. Moreover, in the remaining land areas, the elevations within nearshore open sea areas, snow/ice, and water were also excluded to ensure the reliability of the elevation. To this end, two kinds of global land-cover data ( and
) with different resolutions (100 and 10 m) were used as masks to filter the elevations (
) within the above land-cover areas, as follows:
(1)
(1)
(2)
(2)
(3)
(3) where
indicates the ATL08 elevations after filtering parts within the snow/ice, water, and open sea areas;
indicates the snow/ice, water, and open sea masks of Copernicus Global Land Cover 2019 product; and
indicates the snow/ice, and water of the FROM-GLC10 product.
For the Copernicus Global Land Cover 2019 product, the ATL08 product has been given a corresponding land-cover label for each elevation point, based on its geographical location, and can be used directly (Neuenschwander and Pitts Citation2019; Neuenschwander et al. Citation2022). For the FROM-GLC10 product with a higher resolution, we added the land-cover data for the geolocation nearest to the elevation point for each elevation point.
3.1.2. Extraction of high-quality elevation control points
During the detection, parts of the elevation data collected by the ICESat-2 laser altimeter can have a low quality, and may even be incorrect. The main reasons for this phenomenon include the variable weather, the solar intensity, the operating status of the instrument, the surface topography, and the land cover (Li et al. Citation2021; Moudrý et al. Citation2022; Neuenschwander and Pitts Citation2019; Tian and Shan Citation2021). To ensure the reliability of the altimeter data, it was necessary to construct a method to comprehensively evaluate these error sources on the quality of elevations, to achieve the extraction of the high-quality elevation parts. In our past research, our team proposed a method to extract the high accuracy elevation control points from the ATL08 elevations (Li et al. Citation2021). Relevant research results can provide an important reference for this study in analyzing the sources of elevation errors, selecting elevation quality evaluation labels, etc., during the process of constructing the dataset. The principle of the method is based on analysis of the photon counting altimeter detection characteristics and its data generation algorithm. The evaluation indicators for the method include outlier identification (compared with the reference DEM), cloud confidence degree, photon number statistics, percentage of photons belonging to the terrain, topography analysis (roughness and slope) along the ground track, geolocation uncertainty of photons, and condition of the terrain polynomial fitting (photon horizontal distribution and skew analysis). In this study, this method was used to extract high-quality ECPs from the original elevation points, i.e. the terrain elevation with 100 m resolution along ground track. According to different accuracy requirements (Li et al. Citation2021), the elevation control points in the data set are divided into three different levels: 0.5m@ slope < 2°, 0.7m@ 2°≤slope < 6° and 1.5m@ 6°≤slope < 25°. In the process of extraction, each ECP was labeled as quality level 1, 2, or 3, corresponding to the above three accuracy requirements.
3.1.3. Purification of the elevation control point data
The ICESat-2 laser altimeter repeats its observations about every about three months. In this study, the whole year of 2019 data was used to generate the ECP dataset, which means that we could further examine each ECP using the corresponding redundant elevation data. For this reason, the adjacent area (square) of each ECP was constructed to extract the corresponding redundant elevation data. For determining the boundary of the adjacent area, we directly adopted latitude and longitude for the reason that this can reduce the extra calculation caused by projection conversion. To avoid the impact of potential bias in the boundaries, the boundary length is set with a certain amount of redundancy (half of the along-track resolution of ATL08 elevations, i.e. 50 m). This strategy can improve the efficiency of the data processing. To achieve this strategy, it is necessary to consider the effect of the curvature of the Earth. For its surface, the interval of each 1 degree of latitude can be considered as fixed (
m), while the interval
of each 1 degree of longitude is variable at the different latitude
, which can be calculated by the following:
(4)
(4)
According to and
, for the geolocation (
) of an ECP, the geographical boundary of the adjacent area with
m side length is as follows:
(5)
(5)
(6)
(6)
(7)
(7)
(8)
(8) where
and
indicate the minimum and maximum longitudes of this geographical boundary, respectively; and
and
indicate the minimum and maximum latitudes of this geographical boundary, respectively. When setting the side length, it is necessary to consider two parts. The first part is the spatial distribution of the ATL08 product elevation, which is mainly determined by the elevation sample interval along track (100 m), the track interval of the strong and weak beam pair (90 m), and the track incline angle (its orbital inclination is 92 degrees) (Markus et al. Citation2017; Neuenschwander and Pitts Citation2019). The second part is differentiated settings based on the topographic relief, i.e. the side length within the topographic relief along track should be smaller than that within the flat topography along track. Based on the above restrictive conditions, the side length
of the ECPs belonging to level 2 or 3 (hilly or mountainous along track) was set to 150 m, and for those belonging to level 1 (flat along track), the side length was set to 250 m.
After obtaining the geographical boundary of the adjacent area, for each ECP, it was necessary to calculate the quantiles ( and
) of all the elevations within the adjacent area, as follows:
(9)
(9)
(10)
(10)
(11)
(11)
(12)
(12)
(13)
(13) where
represents the parts of
that have a difference between the elevation and reference DEM of less than 50 m, i.e. the parts of
that are excluded from outliers;
represents the number of original elevation points belonging to
within the adjacent area; and
and
indicate the calculations for the median and 25th percentile, respectively;
is the longitude range of the geographical boundary;
is the latitude range of the geographical boundary.
is used to filter potentially large deviations in the ECP dataset, to act as a supplement to the outlier identification. This is because the outlier identification described in the previous section has a certain limitation, for the reason that the global DEM elevation data have a low accuracy. Here, an ECP was removed when the difference between its elevation and
was more than 10 m. Man-made facilities exist in areas where humans congregate, which can lead to deviations in ECPs.
was used to filter the potential deviations caused by this special land cover in the ECP dataset. We focused on two main kinds of human congregation areas: urban and cropland areas. The ECPs within these two areas were removed when the elevation was 2.5 m higher than
. The setting of 2.5 m is the common threshold for classifying artificial facilities such as buildings.
3.2. Validation of the elevation control points
There is a deviation of about 6.5 m in the geolocation of the ATL08 elevations (Neuenschwander and Magruder Citation2019). For the DEMs with a high resolution and high accuracy, it was necessary to consider this phenomenon when validating the accuracy of the ECPs. To weak the effect of the geolocation deviation on the validation results, we selected all the DEM elevation data within an area around each ECP with a radius of 7 m (a little higher than the deviation of the geolocation) to calculate the average of the DEM elevations, and then compared the average with the ECP (Li et al. Citation2023b; Li et al. Citation2021). The purpose of adopting this strategy is to verify the elevation control point more rigorously and comprehensively, for ensuring higher reliability for users, and reducing the impact of this geographical deviation on users’ direct use of the dataset.
4. Release of dataset
Following the process flow described in the methodology, the ATL08 product for the whole year of 2019 within the global land areas was extracted, and then organized into a dataset of ECPs. The dataset has been openly released as multiple files (.mat). These files can be directly downloaded from https://doi.org/10.11888/Terre.tpdc.300508. Each file includes the ECPs within a grid of 30°×60° (latitude × longitude). shows the data dictionary of this dataset, including the ECPs’ survey time, geolocation, elevation, beam, and elevation quality level. The user can use the ‘Level’ label to select a different quality of ECPs for meeting the corresponding requirements of special applications, such as different-scale topographic mapping, etc. Moreover, for the ‘Beam’ label, the user can use it to divide the ECPs into two classifications: elevation points sourced from the strong beam and elevation points sourced from the weak beam. In our previous work, we found that the accuracy of the ECPs from the strong beam is a little better than that from the weak beam (Li et al. Citation2021). Thus, the ECPs of the strong beam have the priority of adoption. A further detailed analysis of this issue is provided in the next section.
Table 2. Data Dictionary of the Dataset.
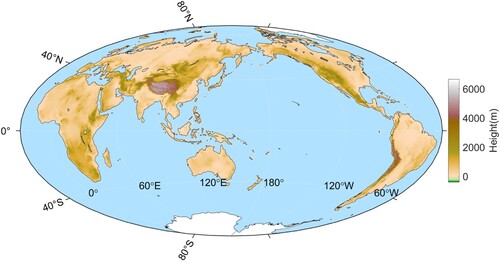
shows the distribution of this dataset. The dataset includes more than 6 billion ECPs. These ECPs are divided into three kinds of quality levels in accordance with the topography (slope) of the fixed segment (100 m) along the ground track. These levels, i.e. levels 1–3, correspond to the different application requirements (RMSE): 0.5 m (flat area), 0.7 m (hilly area), and 1.5 m (mountainous area). In the dataset, the percentage of elevation points decreases as the level increases. The percentages of the ECPs of levels 1–3 are 85.91%, 11.95%, and 2.14%, respectively. There are two main reasons for the above phenomenon. The first reason is that the proportions of the original elevation points within the flat, hilly, and mountainous areas also have a trend of sequential decrease. The second reason is that the accuracy uncertainty of the original elevation points within the hilly and mountainous areas is higher than that within the flat area, due to the relief of the topographic (Li et al. Citation2023a; Li et al. Citation2023b; Moudrý et al. Citation2022; Tian and Shan Citation2021). Moreover, from the figure, some extremely high elevations are not covered in the dataset. The main reasons for this are: 1) the global elevations observed from the ICESat-2 satellite are limited; 2) the snow/ice covered mountainous areas where extremely high elevations exist was excluded during the construction of the dataset.
Figure 3. Distribution of elevation control points in the dataset
5. Results analysis and discussions
5.1. Validation of elevation accuracy
5.1.1. Elevation accuracy of different topography
Some samples of the dataset were validated by the DEMs with high resolution and accuracy, as shown in the blue points of . The number of these samples is about 142 000 and the proportions for areas I – X are about 18.53%, 16.53%, 16.16%, 26.51%, 5.33%, 1.07%, 14.35%, 0.93%, and 0.55%, respectively. After validation, the RMSE of these samples belonging to levels 1, 2 and 3 is 0.279 , 0.433 , and 0.642 m, respectively. Moreover, a more detailed analysis of these ECPs within each validation area was carried out, and lists the analysis results.
Table 3. Accuracy Analysis of the Elevation Control Points Within Each Validation Region.
From , it drew that the ECPs within each area all have a good elevation accuracy. The ECPs belonging to level 1 have the best accuracy (about 0.20–0.41 m), those belonging to level 2 have the second-best accuracy (about 0.25–0.57 m), and those belonging to level 3 have the lowest accuracy (about 0.35– 0.85 m). The validation results imply that the ECPs of the dataset in local areas have a good elevation accuracy and can meet the accuracy requirement of 0.5–1.5 m.
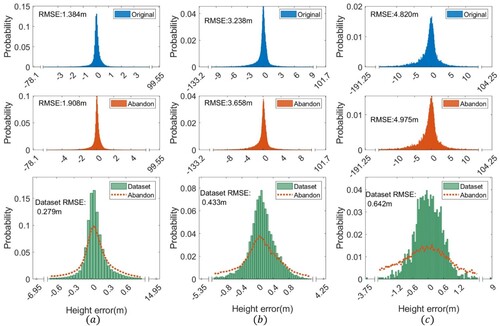
To further evaluate the accuracy of the dataset, the histogram statistics of the ECPs within the validation areas were calculated, including a comparison with the original elevations and the abandoned parts of the original elevations. shows the comparison results for the histogram statistics of the above elevations.
In , the blue and red histograms show the error distribution of the original elevations and the abandoned parts of the original elevations, respectively. The green histograms show the error distribution of the ECPs. It can be observed that the accuracy of the extracted ECPs shows a great improvement relative to that of the original elevations. The RMSEs of the original elevations are from 1.384 m to 4.820 m, and those of the ECPs are from 0.279 m to 0.642 m. In each quality level, compared with the abandoned original elevations, the ECPs all have a better distribution of elevation error, which is reflected that the distributions of the ECPs have a higher probability of amplitude. This implies that the proposed methodology for constructing the ECP dataset allows good identification of the parts of high quality in the original elevations.
Figure 4. Histogram statistics for the elevation control points within the validation areas. (a) – (c) Statistics of the elevation control points with levels 1 - 3, corresponding to flat, hilly and mountainous areas along track, respectively.
5.1.2. Elevation accuracy of strong and weak beams
ICESat-2 laser altimeter data are sourced from two kinds of beams with two different energy levels (strong or weak). The construction of the dataset includes ECPs belonging to these two kinds of beams. In the released dataset, there is also the ‘Beam’ label to indicate the beam of the ECPs. A more detailed description is described in . To evaluate the accuracy of the ECPs belonging to two different energy beams, the corresponding statistics were calculated, and lists the statistical results. From the statistics, the accuracies of the two different energy beams’ ECPs are both better than those of the original elevations, and compared with the weak beam’s ECPs, the strong beam’s ECPs have a slightly better accuracy. This discovery is consistent with our previous research (Li et al. Citation2021).
Table 4. Accuracy Comparison of the Strong and Weak Beams’ Elevation Control Points.
5.1.3. Elevation accuracy within urban and non-urban areas
Urban areas are the type of land cover with the highest human concentration. Accurate measurement of urban elevation is one of the important study areas for the analysis and evaluation of urban monitoring and modeling. Compared to urban areas, non-urban areas have more prominent natural geomorphological features. The accurate measurement of the topography of non-urban areas is important for the analysis and assessment of the ecological environment. For the above reason, the ECPs were divided into two categories – urban areas and non-urban areas – and then the ECPs of the two categories were analyzed. The masks for the two categories were extracted by the use of the FROM-GLC10 product. lists the analysis results. It can be found that, within both the urban and non-urban areas, the elevations of the dataset have a good accuracy (urban: 0.33 m, non-urban: 0.30 m), and the elevation RMSEs of the dataset are smaller than those of the original elevations.
Table 5. Accuracy Comparison of the Elevation Control Points Within Urban and Non-Urban Areas.
5.1.4. Elevation accuracy within different vegetation cover
Occlusion from vegetation can weak the valid signal from the ground, i.e. photons belonging to terrain, influencing the accuracy of the ATL08 elevations (Fernandez-Diaz, Velikova, and Glennie Citation2022; Ghosh, Behera, and Paramanik Citation2020; He et al. Citation2023; Li et al. Citation2023b; Neuenschwander et al. Citation2020; Xie et al. Citation2022). The dataset includes ECPs within different types of vegetation cover. The vegetation cover index for each ECP was directly collected from the ATL08 product. The distribution of the dataset within the different vegetation cover indices is shown in . The proportions of the dataset within the different vegetation cover indexes are shown in . From this statistic, in general, the proportions of ECPs in the dataset decreased with the increase of vegetation cover index. ECPs in the dataset focus on the low vegetation cover indexes, for example, the proportion of 0-10% vegetation cover index is about 47%. Although ECPs have a higher proportion in low vegetation cover areas, ECPs are still distributed in some areas with high vegetation cover index (>60%). This characteristic means that the dataset has certain potential and value for the application in the vegetated area, such as the terrain mapping within forests. Further, the accuracy evaluation of the ECPs within the different vegetation cover is important for applications within these land-cover types. Therefore, for the different vegetation covers, we compared the accuracy of original elevations with that of the ECPs, to further evaluate the application prospects of the dataset within these types of land cover. shows the comparison result, including the comparisons of the sample number, RMSE and elevation error boxplot.
Figure 5. Distribution of the dataset within the different vegetation cover indices.
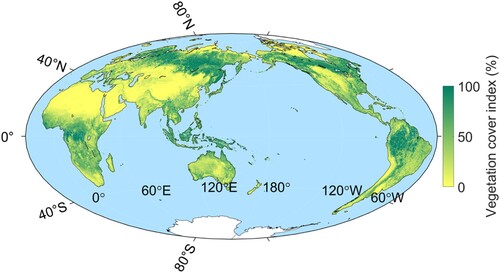
Figure 6. Proportions of the dataset within the different vegetation cover indices.
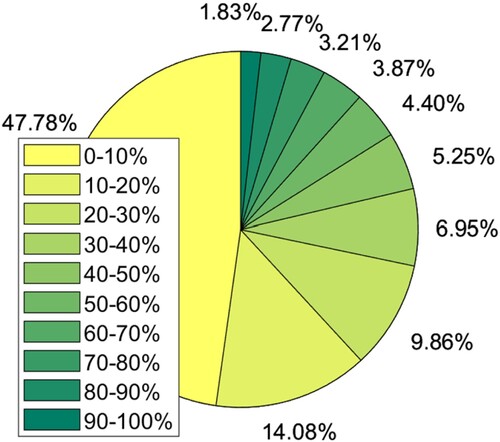
Figure 7. Accuracy analysis of the elevation control points within the different vegetation cover indices. (a) – (c) The sample number, RMSE, and elevation error of the original elevations and the dataset elevations, respectively.
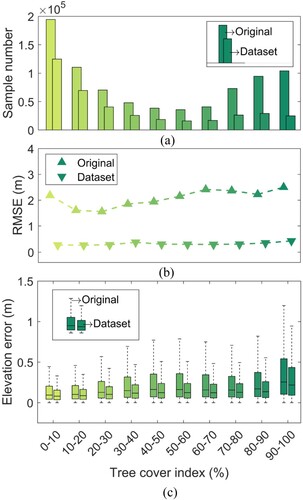
From (a), it can be observed that the extraction proportions of the ECPs in the dataset relative to the original elevations decrease with the increase in vegetation cover. The main reason for this trend is that the quality of the original elevations within the low vegetation cover is better than that within the high vegetation cover (Fernandez-Diaz, Velikova, and Glennie Citation2022; Li et al. Citation2023b; Moudrý et al. Citation2022; Neuenschwander and Magruder Citation2019; Tian and Shan Citation2021). Despite the decreasing trend described above, the ECPs within the high vegetation cover areas (more than 60%) are still included in the dataset, which implies that the dataset has good application prospects within vegetation-covered areas. From (b) – (c), it can be observed that the accuracy of the ECPs in the dataset is better than that of the original elevations for the different vegetation covers. The RMSEs of the original elevations are from ∼1.5 m to ∼2.5 m. The RMSEs of the ECPs are from 0 m to ∼0.5 m. Moreover, the elevation error of the ECPs in the dataset has a better distribution, compared with that of the original elevations.
5.2. Statistics of elevation aggregation
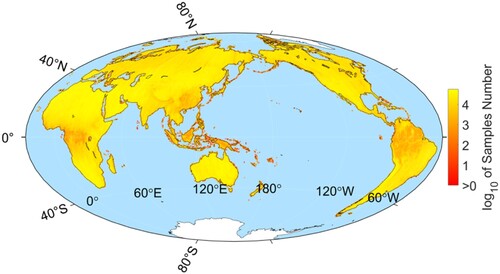
The aggregation level of the ECPs at a global scale can act as an important reference for users of this dataset. Due to this, the statistics of the ECPs within the global 0.25°×0.25° grid were collated and are shown in . From the statistics, the number of ECPs within certain areas, such as the midwest region of Africa, the southwest region of China, the Malay Archipelago, the northern region of Brazil, etc., is clearly lower than that within other areas. One reason for this phenomenon is that the intensity of the ICESat-2 altimetry data diminishes with the increment of latitude, resulting in most of these areas with lower numbers being concentrated near the equator. The other reason, more importantly, is that the ICESat-2 altimeter data are challenged by the topographic relief and vegetation cover, resulting in less data collection and a lower percentage of high-quality data. To support the above discussion, the statistics of the original elevation points within the global 0.25°×0.25° grid were also collated. These statistics are shown in , where it drew that the original elevations of the ATL08 product within the above areas also have lower numbers.
Figure 8. Statistics for the elevation control points within the global 0.25°×0.25° grid.
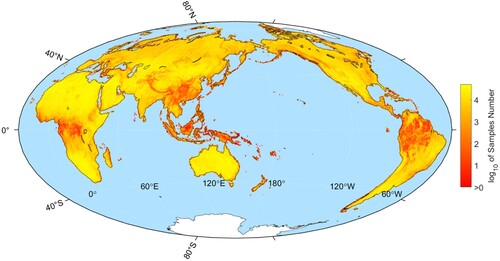
Figure 9. Statistics for the original elevation points within the global 0.25°×0.25° grid.
6. Conclusion
In this study, we constructed and released a high-quality elevation control point dataset. The dataset covers all the global land areas, except for Antarctica and Greenland. The ICESat-2 altimeter data used to construct the dataset span the entire year of 2019. Moreover, we recorded the distribution of the elevation control points within a global 0.25°×0.25° grid to analyze the dataset aggregation level at a global scale, to guide users in using the dataset.
The regions used to evaluate the accuracy of the dataset included regions in North America and Europe. The evaluation of the dataset accuracy included three main parts: 1) accuracy evaluation of the elevation control points within different topographies; 2) accuracy evaluation of the elevation control points within urban and non-urban areas; and 3) accuracy evaluation of the elevation control points within different types of vegetation cover. The results implied that the dataset has a good accuracy in the above three evaluations. Moreover, the analysis also implied that the dataset has good application prospects in vegetation-covered areas, for the reason that the elevation control points within the high vegetation cover areas (more than 60%) are still included in the dataset.
The released dataset will be a useful supplement for the research field of open-source accurate elevation information at a global scale, and will increase the potential of applications depending on accurate elevation data, such as global-scale topographic mapping, vegetation biomass surveying, urban environmental monitoring, etc.
Disclosure statement
No potential conflict of interest was reported by the author(s).
Data availability statement
The data that support the findings of this study are openly available in National Tibetan Plateau / Third Pole Environment Data Center at https://doi.org/10.11888/Terre.tpdc.300508
(Xie et al. Citation2023).Additional information
Funding
References
- Cobb, A. R., R. Dommain, R. S. Sukri, F. Metali, B. Bookhagen, C. F. Harvey, and H. Tang. 2023. “Improved Terrain Estimation from Spaceborne Lidar in Tropical Peatlands Using Spatial Filtering.” Science of Remote Sensing 7: 100074. https://doi.org/10.1016/j.srs.2022.100074.
- Dandabathula, G., M. Verma, and S. R. Sitiraju. 2020. “Evaluation of Best-fit Terrain Elevation of ICESat-2 ATL08 Using DGPS Surveyed Points.” Journal of Applied Geodesy 14: 285–293. https://doi.org/10.1515/jag-2020-0003.
- Duan, J., H. Wang, C. Wang, S. Nie, X. Yang, and X. Xi. 2023. “Denoising and Classification of Urban ICESat-2 Photon Data Fused with Sentinel-2 Spectral Images.” International Journal of Digital Earth 16: 4346–4367. https://doi.org/10.1080/17538947.2023.2270513.
- Dubayah, R., J. B. Blair, S. Goetz, L. Fatoyinbo, M. Hansen, S. Healey, M. Hofton, et al. 2020. “The Global Ecosystem Dynamics Investigation: High-Resolution Laser Ranging of the Earth’s Forests and Topography.” Science of Remote Sensing 1: 100002. https://doi.org/10.1016/j.srs.2020.100002.
- Fernandez-Diaz, J. C., M. Velikova, and C. L. Glennie. 2022. “Validation of ICESat-2 ATL08 Terrain and Canopy Height Retrievals in Tropical Mesoamerican Forests.” IEEE Journal of Selected Topics in Applied Earth Observations and Remote Sensing 15: 2956–2970. https://doi.org/10.1109/JSTARS.2022.3163208.
- Ghosh, S. M., M. D. Behera, and S. Paramanik. 2020. “Canopy Height Estimation Using Sentinel Series Images Through Machine Learning Models in a Mangrove Forest.” Remote Sensing 12.
- Gong, P., Z. Li, H. Huang, G. Sun, and L. Wang. 2011. “ICESat GLAS Data for Urban Environment Monitoring.” IEEE Transactions on Geoscience and Remote Sensing 49: 1158–1172. https://doi.org/10.1109/TGRS.2010.2070514.
- Gong, P., H. Liu, M. Zhang, C. Li, J. Wang, H. Huang, N. Clinton, et al. 2019. “Stable Classification with Limited Sample: Transferring a 30-m Resolution Sample set Collected in 2015 to Mapping 10-m Resolution Global Land Cover in 2017.” Science Bulletin 64.
- Hawker, L., P. Uhe, L. Paulo, J. Sosa, J. Savage, C. Sampson, and J. Neal. 2022. “A 30 m Global map of Elevation with Forests and Buildings Removed.” Environmental Research Letters 17: 024016. https://doi.org/10.1088/1748-9326/ac4d4f.
- He, L., Y. Pang, Z. Zhang, X. Liang, and B. Chen. 2023. “ICESat-2 Data Classification and Estimation of Terrain Height and Canopy Height.” Int. J. Appl. Earth Obs. Geoinf 118: 103233.
- Li, B., H. Xie, S. Liu, Y. Sun, Q. Xu, and X. Tong. 2023a. “Correction of ICESat-2 Terrain Within Urban Areas Using a Water Pump Deployment Criterion with the Vertical Contour of the Terrain.” Remote Sensing of Environment 298: 113817. https://doi.org/10.1016/j.rse.2023.113817.
- Li, B., H. Xie, S. Liu, X. Tong, H. Tang, and X. Wang. 2021. “A Method of Extracting High-Accuracy Elevation Control Points from ICESat-2 Altimetry Data.” Photogrammetric Engineering & Remote Sensing 87: 821–830. https://doi.org/10.14358/PERS.21-00009R2.
- Li, B., H. Xie, X. Tong, S. Liu, Q. Xu, and Y. Sun. 2023b. “Extracting Accurate Terrain in Vegetated Areas from ICESat-2 Data.” International Journal of Applied Earth Observation and Geoinformation 117: 103200.
- Li, B., H. Xie, X. Tong, H. Tang, and S. Liu. 2023c. “A Global-Scale DEM Elevation Correction Model Using ICESat-2 Laser Altimetry Data.” IEEE Transactions on Geoscience and Remote Sensing 61: 1–15.
- Li, B., H. Xie, X. Tong, H. Tang, S. Liu, Y. Jin, C. Wang, and Z. Ye. 2022. “High-Accuracy Laser Altimetry Global Elevation Control Point Dataset for Satellite Topographic Mapping.” IEEE Transactions on Geoscience and Remote Sensing 60: 1–1.
- Lian, W., G. Zhang, H. Cui, Z. Chen, S. Wei, C. Zhu, and Z. Xie. 2022. “Extraction of High-Accuracy Control Points Using ICESat-2 ATL03 in Urban Areas.” International Journal of Applied Earth Observation and Geoinformation 115: 103116.
- Markus, T., T. Neumann, A. Martino, W. Abdalati, K. Brunt, B. Csatho, S. Farrell, et al. 2017. “The Ice, Cloud, and Land Elevation Satellite-2 (ICESat-2): Science Requirements, Concept, and Implementation.” Remote Sensing of Environment 190: 260–273. https://doi.org/10.1016/j.rse.2016.12.029.
- Martino, A., T. Neumann, N. Kurtz, and D. McLennan. 2019. “ICESat-2 Mission Overview and Early Performance.” SPIE, 68–77.
- Maune, D., K. Heidemann, D. Smith, and Q. Abdullah. 2014. “ASPRS Positional Accuracy Standards for Digital Geospatial Data.” Photogramm. Eng. Remote Sens 81: A1–A26.
- Meadows, M., S. Jones, and K. Reinke. 2024. “Vertical Accuracy Assessment of Freely Available Global DEMs (FABDEM, Copernicus DEM, NASADEM, AW3D30 and SRTM) in Flood-Prone Environments.” International Journal of Digital Earth 17: 2308734. https://doi.org/10.1080/17538947.2024.2308734.
- Moudrý, V., K. Gdulová, L. Gábor, E. Šárovcová, V. Barták, F. Leroy, O. Špatenková, D. Rocchini, and J. Prošek. 2022. “Effects of Environmental Conditions on ICESat-2 Terrain and Canopy Heights Retrievals in Central European Mountains.” Remote Sensing of Environment 279: 113112. https://doi.org/10.1016/j.rse.2022.113112.
- Neuenschwander, A., E. Guenther, J. C. White, L. Duncanson, and P. Montesano. 2020. “Validation of ICESat-2 Terrain and Canopy Heights in Boreal Forests.” Remote Sensing of Environment 251), https://doi.org/10.1016/j.rse.2020.112110.
- Neuenschwander, A. L., and L. A. Magruder. 2019. “Canopy and Terrain Height Retrievals with ICESat-2: A First Look.” Remote Sensing 11), https://doi.org/10.3390/rs11141721.
- Neuenschwander, A., and K. Pitts. 2019. “The ATL08 Land and Vegetation Product for the ICESat-2 Mission.” Remote Sensing of Environment 221: 247–259. https://doi.org/10.1016/j.rse.2018.11.005.
- Neuenschwander, A., K. Pitts, B. Jelley, J. Robbins, J. Markel, S. Popescu, R. Nelson, et al. 2022. Algorithm Theoretical Basis Document (ATBD) for Land-Vegetation Along-Track Products (ATL08), ICE, CLOUD, and Land Elevation Satellite (ICESat-2) Project”.
- Schutz, B., H. Zwally, C. A. Shuman, and D. Hancock. 2005. “Overview of the ICESat Mission.” Geophysical Research Letters 32, https://doi.org/10.1029/2005GL024009.
- Tang, X., J. Xie, R. Liu, G. Huang, C. Zhao, Y. Zhen, H. Tang, and X. Dou. 2020. “Overview of the GF-7 Laser Altimeter System Mission.” Earth and Space Science 7, https://doi.org/10.1029/2019EA000777.
- Tian, X., and J. Shan. 2021. “Comprehensive Evaluation of the ICESat-2 ATL08 Terrain Product.” IEEE Transactions on Geoscience and Remote Sensing 59: 8195–8209. https://doi.org/10.1109/TGRS.2021.3051086.
- Xie, H., B. Li, X. Tong, S. Liu, Z. Hong, Y. Xi, C. Liu, Q. Xu, Y. Sun, and M. Ji. 2023. “High Accuracy Global Satellite Laser Altimeter Elevation Control Point Data set (2019).” National Tibetan Plateau / Third Pole Environment Data Center. https://doi.org/10.11888/Terre.tpdc.300508.
- Xie, H., B. Li, X. Tong, X. Zhang, T. He, J. Dai, G. Huang, Z. Zhang, and S. Liu. 2021a. “A Planimetric Location Method for Laser Footprints of the Chinese Gaofen-7 Satellite Using Laser Spot Center Detection and Image Matching to Stereo Image Product.” IEEE Transactions on Geoscience and Remote Sensing 59 (11): 1–14.
- Xie, H., Y. Sun, Q. Xu, B. Li, Y. Guo, X. Liu, P. Huang, and X. Tong. 2022. “Converting Along-Track Photons Into a Point-Region Quadtree to Assist with ICESat-2-Based Canopy Cover and Ground Photon Detection.” International Journal of Applied Earth Observation and Geoinformation 112: 102872.
- Xie, H., Q. Xu, D. Ye, J. Jia, Y. Sun, P. Huang, M. Li, et al. 2021b. “A Comparison and Review of Surface Detection Methods Using MBL, MABEL, and ICESat-2 Photon-Counting Laser Altimetry Data.” IEEE Journal of Selected Topics in Applied Earth Observations and Remote Sensing 14: 7604–7623. https://doi.org/10.1109/JSTARS.2021.3094195.
- Zhu, J., P.-F. Yang, Y. Li, Y.-Z. Xie, and H.-Q. Fu. 2022. “Accuracy Assessment of ICESat-2 ATL08 Terrain Estimates: A Case Study in Spain.” Journal of Central South University 29: 226–238. https://doi.org/10.1007/s11771-022-4896-x.