
 ?Mathematical formulae have been encoded as MathML and are displayed in this HTML version using MathJax in order to improve their display. Uncheck the box to turn MathJax off. This feature requires Javascript. Click on a formula to zoom.
ABSTRACT
The United Nations Sustainable Development Goals (SDGs) establish a fresh global framework for evaluating the development agenda, emphasizing prosperity, growth, inclusivity, and transparency while safeguarding our planet Earth. Land Degradation Neutrality (LDN) represents a clear target for assessing the achievement of SDG 15.3. In response to the shortcomings of the African Great Green Wall initiative with respect to LDN monitoring, reporting, and intervention, we developed an online tool, the Great Green Wall Big Data Facilitator (GGW-BDF), based on earth observation data (e.g. SDGSAT-1), cutting-edge big data analysis technologies, and Chinese experience in combating desertification, to support the implementation of the African Great Green Wall initiative. The GGW-BDF comprises an LDN data portal, desertification control knowledge, and e-learning resources. This study highlights the functionality of this tool to support stakeholders across countries in monitoring LDN while providing the successful technoloiges to restore degraded or barren land. The contributions of the GGW-BDF are very useful in supporting the Pan-African Agency of the Great Green Wall (PAGGW), and will hopefully be continuously upgraded for being a part of the federated toolbox of the Group on Earth Observation (GEO) LDN Flagship.
1. Introduction
Land degradation is a global challenge, and it is estimated that up to 40% of the planet’s land is degraded, directly affecting half of the global population and GDP (https://www.unccd.int/news-stories/press-releases/chronic-land-degradation-un-offers-stark-warnings-and-practical). To combat land degradation, the United Nations Convention to Combat Desertification (UNCCD) officially adopted the scientific concept of ‘Land Degradation Neutrality’ (LDN), defining it as a state whereby the amount and quality of land resources necessary to support ecosystem functions and services and enhance food security remain stable or increase within specified temporal and spatial scales and ecosystems (UNCCD Citation2015). Furthermore, UNCCD included it as the overall objective of the vision in the UNCCD 2018–2030 Strategic Framework (Li, Lu, and Jia Citation2021).
LDN monitoring is vital because it can help policymakers understand the land degradation status and dynamics, craft informed strategies, and implement actions to prevent land degradation (Cowie et al. Citation2018). Significant progress has been achieved, particularly in the integration of global tools and methodologies. In response to the complexity of the definition and assessment system of land degradation, the United Nations Inter-Agency Expert Group on Sustainable Development Goals (IAEG-SDGs) adopted the Sustainable Development Goal (SDG) 15.3.1 monitoring indicator system in November 2017, in which, land-cover change trend, land productivity change trend, and carbon stock (soil carbon) change trend are three core indicators used to identify whether land is degraded or not (Sims et al. Citation2019). In addition to indicators and data sources, considerable efforts have been made to address methodological inconsistencies and misleading trends that can arise as a result of natural fluctuations or incomplete datasets (Thomas et al. Citation2023). Despite the progress, serious challenges remain regarding consistent and accurate monitoring of LDN, particularly in developing countries. The UNCCD and its partners have published Good Practice Guidance (GPG) and are leading a capacity-building initiative that includes defining national baselines and targets, and implementing measures and monitoring approaches for achieving LDN. However, the default method and dataset may not always accurately reflect the specific conditions of individual countries, and may lack the granularity and specificity required to accurately reflect the unique circumstances of each country or region.
Ecosystem restoration, knowledge sharing, and knowledge transfer are key to realizing LDN. On a global scale, the World Overview of Conservation Approaches and Technologies (WOCAT) builds a global sustainable land management (SLM) database, integrates and shares soil and water conservation experiences and technologies from around the world, and provides support for different users in choosing appropriate technologies (Gonzalez-Roglich et al. Citation2019). However, the WOCAT database contains only a limited number of best practices from China. Only 53 techniques from China can be found in the SLM database, most of which were updated prior to 2012. Over the past few decades, China has undertaken remarkable engineering projects, such as the Three-North Shelterbelt Forest Program, Grain for Green Program, and Beijing–Tianjin Sand Source Control Project, and has gained extensive experience in combating land degradation, desertification, and drought (Cui et al. Citation2023). Though massive ecological projects have been initiated, an ecological restoration database has not yet been established (Cui et al. Citation2021), which has seriously hinders the sharing of relevant experiences and lessons.
The Sahel is a hotspot for global land degradation. The Great Green Wall (GGW) project was launched in 2007 under the leadership of the African Union and the Pan-African Agency of the Great Green Wall (PAGGW). It aimed to restore Africa’s degraded landscapes and transform millions of lives in one of the world’s poorest regions, the Sahel. A detailed LDN monitoring and ecological restoration techniques database suitable for the Sahel region is of utmost significance for achieving the goals of the African Great Green Wall initiative. Therefore, an online tool, Great Green Wall Big Data Facilitator (GGW-BDF; https://sdg.casearth.cn/en/onlineTools/GGWBDF) was developed to support stakeholders in monitoring the progress of LDN at a very fine scale based on Sustainable Development Science Satellite 1 (SDGSAT-1) and other satellite datasets, while providing tailored ecosystem restoration techniques by building a desertification control knowledge database. For capacity building, we developed an e-learning module to help local people monitor land productivity dynamics (LPD). The GGW-BDF is under continuous development, and we are hopeful that emerging needs and standards set by the PAGGW and the Group on Earth Observation (GEO) LDN flagship would be taken into consideration. It is hoped that GGW-BDF will become an important tool within (GEO) LDN Federated Toolbox.
2. The GGW-BDF platform
2.1. GGW-BDF main functions
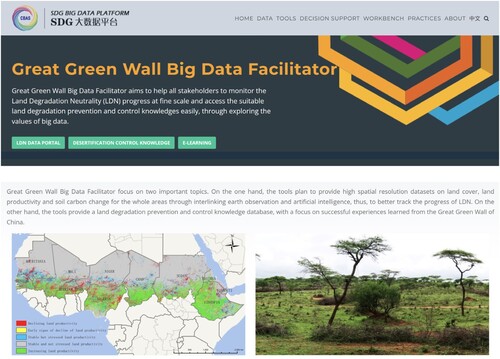
GGW-BDF aims to facilitate GGW by utilizing big data, which was designed to integrate datasets, knowledge, and tools related to LDN with the support of the SDG big data platform, thus providing a leading and significant tool for the LDN of GGW (). The online tool has two main features; first, it provides fine-scale LDN spatial data products and offers scripts for computing these products in support of users to customize product production according to their own needs; second, it builds a knowledge database for preventing and restoring land degradation based on the experience of China's GGW. Further, it provides a video-training module that supports users in learning tool usage through videos.
Figure 1. GGW-BDF home page. GGW-BDF, Great Green Wall Big Data Facilitator.
2.2. GGW-BDF basic structure
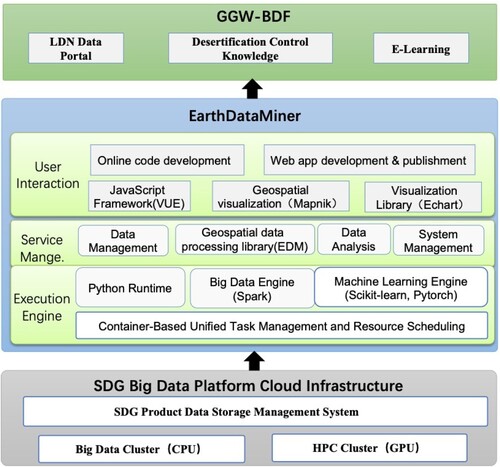
The underlying GGW-BDF system was deployed on the cloud infrastructure of the SDG Big Data Platform at the International Research Center of Big Data for Sustainable Development Goals (CBAS). The big data platform manages the storage for the original remote-sensing imagery and generates the SDG products used by the tools. This infrastructure leverages extensive data processing using CPU and HPC GPU clusters to support large-scale remote-sensing data analysis. The system uses the EarthDataMiner platform for specific data management and computational analysis tasks. EarthDataMiner provides a cloud-based online integrated development environment that enables scientists to conduct extensive Big Earth data mining analysis and visualization through code development (Liu, Wang, and Zhong Citation2020). EarthDataMiner includes three main modules, i.e. execution engine, service management, and user interaction (). Building on EarthDataMiner, we developed a GGW-BDF tool to support users in accessing and utilizing these resources online.
Figure 2. Synthetic workflow of the basic structure of the GGW-BDF: functions and technological components. GGW-BDF, Great Green Wall Big Data Facilitator.
3. Materials and methods
3.1. Study areas
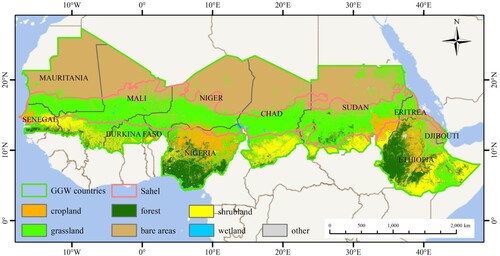
The GGW was an ambitious initiative launched in 2007 (Gadzama Citation2017). It aims to restore 100 million hectares of degraded land in 11 countries, including Ethiopia, Chad, Niger, Mali, Burkina Faso, Eritrea, Djibouti, Sudan, Senegal, Nigeria, and Mauritania (Mirzabaev et al. Citation2022), especially in the Sahel region, which has become a ‘hotspot’ for SDG 15.3.1. The plateau in this area is primarily concentrated in Ethiopia. The annual rainfall in most areas is between 0- 1,000 mm, and the rainfall span is large, gradually increasing from north to south. The climate in the northern part of the region is subtropical and tropical desert, the southern part is tropical savanna, and a small area in the southeast has a mountain-plateau climate. As they are affected by climate, the land-cover types in these regions are complex, but regular. The northern region is mostly desert and bare land, grasslands are concentrated in the central area, whereas croplands, shrubs and trees are found in the south.
Across the 11 countries, excluding Ethiopia and Djibouti, the Sahel was defined as an area with 100‒600 mm of rainfall (). The Pentad precipitation dataset of the Climate Hazards Group InfraRed Precipitation with Station (CHIRPS) was selected from the Google Earth Engine (GEE) platform (Collection Snippet: UCSB-CHG/CHIRPS/PENTAD) (Funk et al. Citation2015)—which began on January 1, 1981—to obtain the Sahel boundary. The area within an isoline range of 100‒600 mm precipitation was extracted and then smoothed on ArcGIS10.7 using gap-filling and edge-smoothing algorithms. The Sahel is considered one of the most sensitive ecosystems in the world because of its unique geographical location and climate (Gadzama and Ayuba Citation2016). The large impact of droughts causes ecological fragility (Zeng Citation2003), within which grasslands and bare land are the main land cover.
Figure 3. GGW countries and Sahel regions. Data source: https://zenodo.org/records/8239305. Data were reclassified. GGW, Great Green Wall.
3.2. Datasets and pre-processing
3.2.1. Remote-sensing satellite data
Landsat-8: Landsat-8 is an Earth observation satellite that monitors the Earth’s natural resources and environmental changes. The satellite is equipped with Operational Land Imager sensors that capture images across nine spectral bands at 30 m resolution for most bands and has a revisit period of 16 days. In this study, the red, NIR, and QA bands of the Landsat-8 Level 2, Collection 2, and Tier 1 datasets (GEE Collection Snippet: LANDSAT/LC08/C02/T1_L2) were utilized to generate 30 m Normalized Difference Vegetation Index (NDVI) from 2015 to 2022 on the GEE platform.
Moderate Resolution Imaging Spectroradiometer (MODIS): MODIS is the key instrument aboard the Terra and Aqua satellites. It features a spatial resolution of 250 m and a temporal resolution of one day, enabling the timely monitoring of changes on the Earth's surface. In this study, the processed MOD09Q1.006 Terra Surface Reflectance 8-Day Global 250 m dataset (GEE Collection Snippet: MODIS/006/MOD09Q1) from the GEE platform was fused with Landsat-8 data to produce a high-quality 30 m NDVI base dataset for the production of LPD.
SDGSAT-1: SDGSAT-1 is the world's first scientific satellite dedicated to the 2030 agenda for sustainable development. The thermal-infrared spectrometer of the satellite is equipped with three bands with a spatial resolution of 30 m and a revisit period of 11 days (Guo et al. Citation2023a). This configuration demonstrates a significant potential for large-scale desertification mapping. In this study, SDGSAT-1 was utilized to produce the silica index (SI), providing a reference for monitoring and tracking land degradation.
3.2.2. Climate factor data
ERA5-Land Daily Aggregated dataset: To assess the impact of climatic factors on the driving forces of LPD, three climate factors: temperature, precipitation, and solar radiation from 2015 to 2022, were derived from the ERA5-Land Daily Aggregated dataset (GEE Collection Snippet: ECMWF/ERA5_LAND/DAILY_AGGR) (Muñoz Sabater Citation2019), which has a spatial resolution of 11132 m.
CO2 concentrations dataset: The CO2 dataset from 2015 to 2022 used in this study was obtained from Cheng et al. (Citation2022) (https://zenodo.org/records/5021361), which has a spatial resolution of 11132 m and was utilized as one of the climatic factors to evaluate its contribution to the driving forces affecting the LPD.
3.2.3. Land-cover data
GLC_FCS30D: The Land Cover and its changes are basic sub-indicators of LDN monitoring. This study used the GLC_FCS30D product (Liu, Zhang, and Zhao Citation2023), which is the first global 30 m resolution product that utilizes continuous change detection for detailed land-cover dynamics. It achieves an overall accuracy of 80.88 % (±0.27 %) for the basic 10 major land-cover types (Zhang et al. Citation2021; Zhang et al. Citation2022; Zhang et al. Citation2023; Zhang et al. Citation2024).
DYNAMIC WORLD V1: Dynamic World V1 is a near-real-time Land-Use/Land Cover dataset with a spatial resolution of 10 m (Brown et al. Citation2022). In this study, the mode of label for each pixel over one year was used to determine the type of pixel. Within a 10,000 m range, the number of pixels classified as forestland or cropland was calculated to derive the forestland and cropland fractions at a spatial resolution of 10,000 m, which were later used as anthropogenic factors in the analysis of the driving forces affecting LPD.
3.2.4. GSOCmap
Soil organic carbon (SOC) plays a pivotal role in soil functionality and food production. GGW-BDF selected the Global SOC Map (GSOCmap) from Food and Agriculture Organization of the United Nations (FAO) (https://earthmap.org), which with a spatial resolution of 1 km. It is a globally recognized, scientifically robust, consistent, and the first nation-driven global dataset. The RMSE of the product was 36.57 Mg·ha (FAO and ITPS Citation2018).
3.3. LDN monitoring and reporting
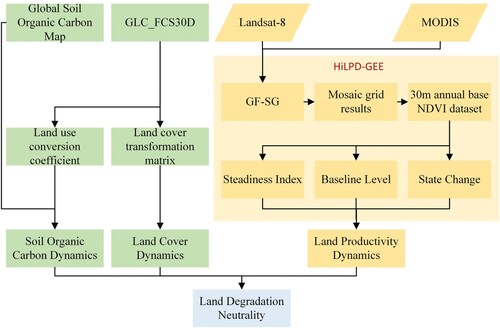
In the LDN-related data portal of the GGW-BDF tool, we first used the high spatial resolution LPD calculation tool based on GEE (HiLPD-GEE) to produce a 30 m LPD product from 2015 to 2022 for the GGW region, which is the highest resolution product of a long time series (2015 to 2022) for the large region. Then according to the degree of adaptation of spatial and temporal resolution, and taking into account the consistency of the long time series, we selected the GLC_FCS30D 2015 and 2022 land-cover products (Liu, Zhang, and Zhao Citation2023), and calculated land cover and SOC changes using the method adopted by Trends.Earth (Sims et al. Citation2021). Finally, a 30 m LDN was obtained by combining the three products. The specific process is shown in the . In addition, to better track and monitor the degree of land desertification, we used SDGSAT-1 to produce the silica index. Furthermore, a driving force analysis of land productivity was conducted to better understand the roles of anthropogenic and climatic factors in the region.
Figure 4. Flowchart of the generation of Land Degradation Neutrality.
3.3.1. Land productivity dynamics
Land productivity reflects the efficiency of solar energy conversion and land fixation (Cui and Li Citation2022), and is a key sub-indicator for determining the progress of LDN and implementing effective interventions against land degradation. One of the biggest flaws in existing global LPD products is that the spatial resolution is too low to meet the requirements of land degradation evaluation and intervention at a fine scale. In the GGW-BDF, the LPD was produced by HiLPD-GEE (Shen et al. Citation2023). The production process consists of two main steps. The first was the production of an annual high-quality basic vegetation index dataset using the Gap Filling and Savitzky–Golay filtering fusion (GF-SG) approach (Chen et al. Citation2021). MODIS and Landsat-8 images were fused to obtain the NDVI dataset with an 8-day temporal and 30 m spatial resolution, and an annual basic vegetation index dataset was synthesized by averaging the dataset. The second step was to calculate the LPD using the LPD approach recommended by the Joint Research Centre of the European Union (JRC). This is a 5-class map that integrates the steadiness index, baseline level, and state change. The LPD result includes declining, early signs of decline, stable but stressed, stable and not stressed, and increasing land productivity (Rotllan-Puig, Ivits, and Cherlet Citation2021).
Besides the LPD map, identifying the driving factors behind changes in land productivity is important for implementing land degradation interventions. Six driving factors were selected for the analysis: temperature, radiation, precipitation, forestland fraction, cropland fraction, and CO2 concentrations. Given the significant disparities in resolution among these datasets, it is essential to standardize both the resolution and coordinate systems. In this study, the resamples() and reproject() functions of GEE was used to downsample datasets with resolutions greater than 10,000 m to a uniform 10,000 m resolution under the WGS84 coordinate system using bilinear interpolation. The Shapley effect was employed to explore the effects of the six driving factors on the LPD based on the GEE. This method is based on variance decomposition for multiple linear regression models (Grömping Citation2007) and considers a variety of combinations. Finally, we obtained the relative importance index of the six driving factors.
3.3.2. SDGSAT-1 based silica index
Considering that the emissivity of silica particles present in sandy lands varies considerably across different wavelengths within the thermal-infrared spectrum (Salisbury and D’Aria Citation1992), we employed SDGSAT-1 thermal-infrared data to calculate an effective desertification thematic index—the silica index. The formula for calculating the silica index is given by Equation (1),
(1)
(1) where
and
correspond to the thermal-infrared wavelengths of SDGSAT-1 at 9.35 and 10.73 µm, respectively. Sandy land exhibited lower emissivity in
and higher emissivity in
, attributable to the content and particle size of silica present in the soil.
Using Mauritania as the pilot area, 507 SDGSAT-1 thermal-infrared images spanning from 2022 to 2023 were employed. First, on-orbit blackbody radiometric calibration was carried out with Equation (2) by using the calibration parameters ().
(2)
(2) Where L represents radiance at the sensor's entrance pupil, expressed in W/m2/sr/μm, and DN denotes the count value of the image after relative radiometric calibration. The Gain and Bias are listed in . Subsequently, we computed the brightness temperature of
using the Planck equation. Considering the lower brightness temperature exhibited by clouds in this band, we applied a histogram thresholding method to detect and remove cloud pixels from each image (Song, Liu, and Zhao Citation2004). Finally, the normalized median composite silica index was generated.
Table 1. Radiometric calibration parameters for the SDGSAT-1 TIS.
3.3.3. Land degradation neutrality
Referencing the recommended method of Good Practice Guidance (GPG) for SDG 15.3.1, three consistent sub-indicators (land productivity, land cover, and SOC) were used to evaluate the 30 m LDN dynamic in the GGW countries for the periods 2015–2022. Stable LPD are derived from a combination of early signs of decline, stable but stressed and stable and not stressed. Considering the regional characteristics of African GGW, we reclassified GLC_FCS30D into seven land-cover types (Tree-covered, Grassland, Cropland, Wetland, Artificial, Other land, and water bodies) that were compatible with the Trends.Earth change matrix. Subsequently, we derived the changes in land cover and soil organic carbon based on the land-cover change matrix and land-use conversion coefficients (Sims et al. Citation2021) (https://docs.trends.earth/en/latest/for_users/features/landdegradation.html). Finally, the indicators were categorized into three classes: declining, stable, and increasing/improving. The fundamental principle of combining three indicators is the ‘one out, all out’ criterion, meaning if any one of the indicators shows a declining, the final LDN is assessed as degradation. For the remaining combinations, if one indicator shows increasing/improving, the final LDN is assessed as improvement. If all three indicators were stable, the LDN was assessed as stable (Sims et al. Citation2021).
3.4. Desertification control knowledge building
The quest for nature-based solutions for desertification control cannot be overemphasized. Based on the Chinese experience of combating land degradation, desertification, and drought, a database of desertification control knowledge was established by following the standards set out by WOCAT (https://www.wocat.net/), but with some simplifications. These techniques detail the main uses of the technology. It also provides the types of degraded land for which nature-based technology can be applied, including semi-fixed sandy land, shifting sandy land, desertified grassland, saline-alkali grassland, active wind-erosion pit, degraded forestland, and desertified cultivated land. In addition, it provides climate and site-specific conditions such as soil conditions, vegetation types, and groundwater conditions, to which the technology can be applied. Furthermore, technological costs and the pictures of technological effectiveness are provided.
3.5. E-Learning module development
E-Learning serves as the guide for the tool application, which also supports users in calculating the spatial products by themselves to enhance their capacity in LDN monitoring and reporting. In this module, we provide four videos on how to use the GGW-BDF and related tools, which include ‘Great Green Wall Big Data Facilitator Guided Tutorial,’ ‘SDGSAT-1 SI Guided Tutorial,’ ‘HiLPD-GEE Guided Tutorial’ and ‘Desertification Control Knowledge Guided Tutorial.’
4. Results
4.1. LDN data portal
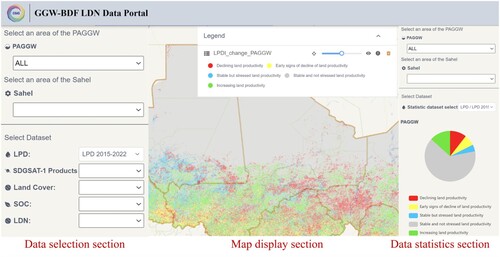
The LDN data portal comprises three components (): the data selection section on the left, the map display section in the middle, and the data statistics section on the right. In the data selection component, users can choose either the entire GGW region or only the Sahel hotspot. This allows for the selection of different countries for focused map navigation and rapid perspective switching. Within the data selection, users can display various products on the map, including the LPD and its driving force analysis results, SDGSAT-1 products (silica index), land cover, SOC, and LDN. After selecting the data, users can access detailed information and adjust the layer transparency in the legends. In the far-right statistical component, users can query the corresponding statistical results by selecting regions and data presented in the form of a pie chart.
Figure 5. GGW-BDF LDN Data Portal. GGW-BDF, Great Green Wall Big Data Facilitator; LDN, Land Degradation Neutrality.
4.1.1. LDN and its sub-indicators
The 2015 to 2022 30 m LPD product is shown in (a). In general, increasing land productivity was slightly greater than declining productivity, and the latter was primarily concentrated in southeastern Ethiopia, central Nigeria, and southern Niger. With respect to the declining LPD, the Sahel region was 2.71% higher than the GGW region. With increasing LPD, the Sahel region exceeded the GGW region by 4.31%. Regarding the overall extent of land-cover change in the GGW countries (b), there was an improvement of 2.01% and a degradation of 1.89%, indicating that the overall alterations were minimal. In general, changes were primarily manifested in an increase in forested areas and a decrease in grassland and bare land from 2015 to 2022. The overall SOC change in the GGW countries was minor (c). This was primarily reflected in an improvement of 1.23% and a decrease of 1.17%. These changes were mainly concentrated in Ethiopia and Nigeria.
Figure 6. Distribution of (a) land productivity dynamics, (b) land cover change, (c) soil organic carbon change, and (d) land degradation neutrality in African Great Green Wall.
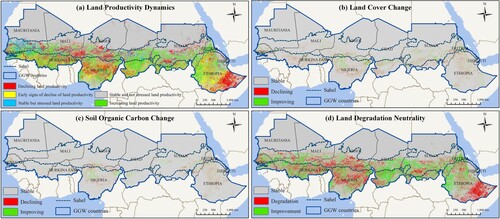
The result of the LDN dynamics in the GGW is shown in (d). In both the GGW countries and Sahel region, the countries with the highest proportions of land degradation and improvement were Nigeria (24.71%, 32.09%) and Senegal (28.37%, 27.12%). Statistical analysis revealed that for all GGW countries, the proportions of stable, degraded, and recovered lands were 75.35%, 11.35%, and 13.30%, respectively. In the Sahel region, these classes accounted for 69.10%, 13.45%, and 17.45% of the total, respectively. Although the restoration area was slightly larger than the degradation area, the proportion of degraded land remained above 10%. Hence, continuous attention and emphasis are needed on land degradation, both in the climate-sensitive Sahel region and across the entire GGW.
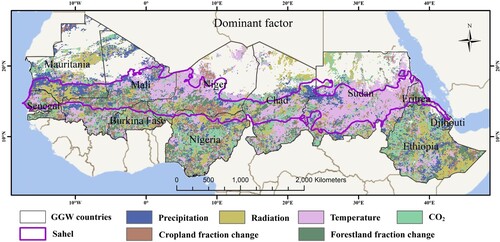
Regarding the contribution results (), the LPD could be explained by a combination of annual total precipitation (17.07%), average temperature (22.53%), total downward solar radiation (17.22%), forestland fraction change (11.28%), cropland fraction change (13.10%) and atmospheric CO2 (18.81%). Regarding the spatial differences, the climatic factors decreased from north to south, while the vegetation factors increased. Compared with the entire GGW region, the climatic driving factors in the Sahel region decreased only by 1.07%, and vegetation driving factors were still weak. Overall, climatic factors (mainly temperature and radiation) had the strongest driving force on LPD in the entire region, indicating that the Sahel is very vulnerable to severe climatic factors.
Figure 7. Dominant factor of land productivity dynamics change from 2015 to 2022.
4.1.2. Silica index
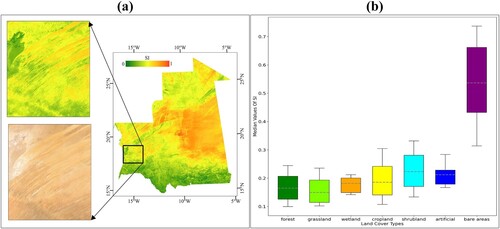
The median composite silica index of Mauritania is shown in (a), which shows that as desertification intensifies, the value of the silica index increases. The silica index can reflect the extent of sandy land in Mauritania. The statistical distribution of the silica index for different land-cover types is illustrated in the (b). The silica index was the highest in bare land areas, showing a distinct difference compared to other land-cover types. This demonstrates the effective capability of the SDGSAT-1 to monitor sandy areas, aiding the advancement of the dynamic monitoring of sandy regions in the GGW region.
Figure 8. (a) Normalized median composite silica index in Mauritania from 2022 to 2023 and (b) its statistical values under different land cover.
4.2. Desertification control knowledge
Based on the Chinese ecosystem restoration experience, we built a database including 26 techniques by referencing the SLM database, especially for desertification control (Appendix Figure A1). Each technique consisted of a general introduction, the main uses, types of degraded land and climatic conditions to which the technology was applicable, the site conditions suitable for the technology, the step by step technical contents, the technological cost, and the effectiveness demonstration. Users can browse to find the appropriate technique based on their requirements. The database is continuously being constructed, with more than 100 technologies to be added soon, including typical models and techniques for the Chinese GGW.
5. Discussion
5.1. Highlighting unique features: the distinctive role of GGW-BDF among LDN tools
This study aims to highlight the pivotal role of emerging developments in the context of SDG 15.3.1. The introduction of the GGW-BDF demonstrates a significant and forward-moving commitment to enhance monitoring, reporting, and intervention processes, which, in conjunction with existing tools, contributes to the global effort toward LDN. Distinctively, the GGW-BDF seeks to provide high spatial resolution datasets for LDN sub-indicators specifically tailored to countries within the Great Green Wall initiative. While Trend.Earth (Gonzalez-Roglich et al. Citation2019) remains the most popular tool for LDN reporting, offering free, open-source access to land condition assessments through Earth observation data across various spatial and temporal scales, GGW-BDF aims to deliver these datasets at a finer spatial resolution of 30 m. This enhancement is particularly advantageous for monitoring and reporting LDN in the diverse landscapes of GGW countries (Mirzabaev et al. Citation2022). It is important to note that both Trend.Earth and GGW-BDF rely on land-cover conversion data to infer changes in SOC, as direct estimation at large scales presents numerous challenges (Angelopoulou et al. Citation2019). However, recent advancements have shown promise for the large-scale estimation of sub-indicators dynamics. For instance, Samarinas et al. (Citation2023) utilized a Soil Data Cube and artificial intelligence to generate 10 m resolution thematic maps of topsoil in Lithuanian croplands, whereas Yang et al. (Citation2021) applied machine learning to estimate soil organic matter content at 30 m resolution across desertified lands in Northern China. Moreover, Guo et al. (Citation2023b) computed Land-cover Change Ratios for world cultural heritage sites from 2015 to 2020 using Earth Observation data predominantly with resolutions exceeding 1 m. These methodologies offer the potential for improved accuracy in sub-indicators dynamic estimations. Furthermore, GGW-BDF integrates desertification control techniques derived from China's four decades of experience with its own Great Green Wall, contributing to a wealth of technology and experience. These contributions have effectively enhanced the WOCAT global database of SLM practices (WOCAT Citation2021), offering invaluable insights into the African GGW initiative.
5.2. Limitations and future developments
Despite the distinct features of GGW-BDF in current LDN tools, they also have certain limitations. First, data products based on Earth’s observations, such as land cover, land productivity, and the silica index, originate from existing global products or are based on established algorithms. Their accuracy and effectiveness in the GGW Sahel require region-specific validation and improvement (Campos and Brito Citation2018). Second, the applicability of desertification control techniques based on the experience of GGW China must be tailored to adapt to the GGW Sahel, which must fully consider the differences in vegetation, precipitation, and human activity between the two regions (Bardgett et al. Citation2021). Finally, the current tools do not include planning tools to effectively link information, knowledge, and decision-making to fulfill the LDN target, which is a key functionality that decision-makers would prefer (Zucca et al. Citation2024).
The participation of local communities plays a significant role in enhancing the GGW-BDF tool. We have established a formal partnership with PAGGW for GGW-BDF verification, feedback, and demonstration applications. Through diversified training on data production methods and demonstrations of tool usage, stakeholders can monitor the progress of LDN in terms of the SOC, LPD, Land Cover, and land degradation. This will help us further modify and improve products in the future. In terms of application, we conducted multiple training sessions and exchanges. On the one hand, we could obtain feedback from stakeholders during the exchanges to update and improve the functions of the tool during continuous adjustments and serve the monitoring of local LDN situations. On the other hand, we can increase the number of users of GGW-BDF through training, which expands the influence of the tool and introduces more development opportunities.
In the future, the development of GGW-BDF will mainly focus on the following aspects. First, GGW-BDF utilizes SDGSAT-1 satellite data to develop regional medium- and high-resolution spatial data products related to land degradation such as land desertification degree products. The sensitivity of the silica index to variations in land desertification condition facilitates the identification of land status. Second, the GGW-BDF would further improve the desertification control knowledge database by collecting more techniques from Northern China's experience and combining them with local knowledge and indigenous plants within GGW countries. Based on multiple spatial datasets on climate and environment, desertification knowledge models and native plants can be allocated by different regions, thus providing an integrated desertification control spatial knowledge database suitable for GGW countries. Finally, the developments would be further refined following the standard criteria set by the GEO LDN Flagship as part of the ongoing efforts for a Federated Toolbox for the GEO LDN Flagship to allow for open knowledge sharing with the world.
6. Conclusion
This paper presents the development of the GGW-BDF tool based on Earth observation, big data analysis, and the GGW China experience, which has great potential for LDN monitoring, reporting, and intervention in the GGW Sahel. The desertification knowledge and e-learning resources also provide methodological and technical support and reference for LDN monitoring across global regions. The main conclusions are as follows:
SDGSAT-1 has good potential for mapping desertification in GGW countries based on the silica index, combined with other multiple remote-sensing datasets, and can provide higher quality and spatial resolution LDN-related products.
From 2015 to 2022, the land restoration area is slightly higher than that of degradation (1.95% higher in GGW countries and 4% higher in the Sahel region), reflecting a positive trend toward LDN in the area. However, the proportion of degradation remains above 10% in both the GGW and Sahel regions, and LDN will face significant challenges in the future. Climatic factors were the key drivers dominating land productivity in GGW countries, accounting for the majority (76%), whereas the influence of anthropogenic factors on productivity changes was relatively minor (24%).
The GGW-BDF could support stakeholders across countries in monitoring LDN while providing successful technologies to restore degraded or barren land, which will hopefully be continuously upgraded to be part of the federated toolbox of GEO LDN Flagship.
Supplemental Material
Download MS Word (971.1 KB)Acknowledgements
The authors wish to acknowledge the contributions of WOCAT, GEO LDN Flagship, PAGGW, who helped in the development of this paper and the support in shaping it to this stage. The authors would like to thank the scientists and agencies for providing free-access Land Cover and Soil Organic Carbon data. The authors thank the anonymous reviewers for their valuable comments.
Disclosure statement
No potential conflict of interest was reported by the author(s).
Data availability statement
The data supporting the findings of this study are available from the corresponding author, Tong Shen, upon reasonable request.
Additional information
Funding
References
- Angelopoulou, T., N. Tziolas, A. Balafoutis, G. Zalidis, and D. Bochtis. 2019. “Remote Sensing Techniques for Soil Organic Carbon Estimation: A Review.” Remote Sensing 11 (6): 676. https://doi.org/10.3390/rs11060676.
- Bardgett, R. D., J. M. Bullock, S. Lavorel, P. Manning, U. Schaffner, N. Ostle, M. Chomel, et al. 2021. “Combatting Global Grassland Degradation.” Nature Reviews Earth & Environment 2 (10): 720–735. https://doi.org/10.1038/s43017-021-00207-2.
- Brown, C. F., S. P. Brumby, B. Guzder-Williams, T. Birch, S. B. Hyde, J. Mazzariello, W. Czerwinski, et al. 2022. “Dynamic World, Near Real-Time Global 10 m Land use Land Cover Mapping.” Scientific Data 9 (1): 251. https://doi.org/10.1038/s41597-022-01307-4.
- Campos, J. C., and J. C. Brito. 2018. “Mapping Underrepresented Land Cover Heterogeneity in Arid Regions: The Sahara-Sahel Example.” ISPRS Journal of Photogrammetry and Remote Sensing 146: 211–220. https://doi.org/10.1016/j.isprsjprs.2018.09.012.
- Chen, Y., R. Cao, J. Chen, L. Liu, and B. Matsushita. 2021. “A Practical Approach to Reconstruct High-Quality Landsat NDVI Time-Series Data by Gap Filling and the Savitzky–Golay Filter.” ISPRS Journal of Photogrammetry and Remote Sensing 180: 174–190. https://doi.org/10.1016/j.isprsjprs.2021.08.015.
- Cheng, W., L. Dan, X. Deng, J. Feng, Y. Wang, J. Peng, J. Tian, et al. 2022. “Global Monthly Gridded Atmospheric Carbon Dioxide Concentrations Under the Historical and Future Scenarios.” Scientific Data 9 (1): 83. https://doi.org/10.1038/s41597-022-01196-7.
- Cowie, A. L., B. J. Orr, V. M. C. Sanchez, P. Chasek, N. D. Crossman, A. Erlewein, G. Louwagie, et al. 2018. “Land in Balance: The Scientific Conceptual Framework for Land Degradation Neutrality.” Environmental Science & Policy 79: 25–35. https://doi.org/10.1016/j.envsci.2017.10.011.
- Cui, Y., and X. Li. 2022. “A new Global Land Productivity Dynamic Product Based on the Consistency of Various Vegetation Biophysical Indicators.” Big Earth Data 6 (1): 36–53. https://doi.org/10.1080/20964471.2021.2018789.
- Cui, W., J. Liu, J. Jia, and P. Wang. 2021. “Terrestrial Ecological Restoration in China: Identifying Advances and Gaps.” Environmental Sciences Europe 33: 1–14. https://doi.org/10.1186/s12302-021-00563-2.
- Cui, G., C. Xiao, J. Lei, X. Li, Y. Bao, and Q. LU. 2023. “China’s Governance: Strategy Choice and Future Vision for Combating Desertification.” Bulletin of Chinese Academy of Sciences (Chinese Version) 38 (7): 943–955. https://doi.org/10.16418/j.issn.1000-3045.20230706002.
- FAO (Food and Agriculture Organization of the United Nations) and ITPS (Intergovernmental Technical Panel on Soils). 2018. Global Soil Organic Carbon Map (GSOCmap) Technical Report. Rome, Italiana: FAO. 162 pp. https://www.fao.org/documents/card/en/c/I8891EN.
- Funk, C., P. Peterson, M. Landsfeld, D. Pedreros, J. Verdin, S. Shukla, G. Husak, et al. 2015. “The Climate Hazards Infrared Precipitation with Stations – a New Environmental Record for Monitoring Extremes.” Scientific Data 2 (1): 1–21. https://doi.org/10.1038/sdata.2015.66.
- Gadzama, N. M. 2017. “Attenuation of the Effects of Desertification Through Sustainable Development of Great Green Wall in the Sahel of Africa.” World Journal of Science, Technology and Sustainable Development 14 (4): 279–289. https://doi.org/10.1108/WJSTSD-02-2016-0021.
- Gadzama, N. M., and H. K. Ayuba. 2016. “On Major Environmental Problem of Desertification in Northern Nigeria with Sustainable Efforts to Managing It.” World Journal of Science, Technology and Sustainable Development 13 (1): 18–30. https://doi.org/10.1108/WJSTSD-06-2015-0035.
- Gonzalez-Roglich, M., A. Zvoleff, M. Noon, H. Liniger, R. Fleiner, N. Harari, and C. Garcia. 2019. “Synergizing Global Tools to Monitor Progress Towards Land Degradation Neutrality: Trends. Earth and the World Overview of Conservation Approaches and Technologies Sustainable Land Management Database.” Environmental Science & Policy 93: 34–42. https://doi.org/10.1016/j.envsci.2018.12.019.
- Grömping, U. 2007. “Relative Importance for Linear Regression in R: The Package Relaimpo.” Journal of Statistical Software 17: 1–27. https://doi.org/10.18637/jss.v017.i01.
- Guo, H., F. Chen, Y. Tang, Y. Ding, M. Chen, W. Zhou, M. Zhu, et al. 2023b. “Progress Toward the Sustainable Development of World Cultural Heritage Sites Facing Land-Cover Changes.” The Innovation 4 (5), https://doi.org/10.1016/j.xinn.2023.100496.
- Guo, H., C. Dou, H. Chen, J. Liu, B. Fu, X. Li, Z. Zou, and D. Liang. 2023a. “SDGSAT-1: The World’s First Scientific Satellite for Sustainable Development Goals.” Science Bulletin 68 (1): 34–38. https://doi.org/10.1016/j.scib.2022.12.014.
- Li, X., Q. Lu, and X. Jia. 2021. “Harnessing big Earth Data to Facilitate Land Degradation Neutrality Goals—Practices and Prospects.” Bulletin of Chinese Academy of Sciences (Chinese Version) 36 (8): 896–903. https://doi.org/10.16418/j.issn.1000-3045.20210705002.
- Liu, J., W. Wang, and H. Zhong. 2020. “EarthDataMiner: A Cloud-Based big Earth Data Intelligence Analysis Platform.” In IOP Conference Series: Earth and Environmental Science 509 (1): 012032. IOP Publishing. https://doi.org/10.1088/1755-1315/509/1/012032.
- Liu, L., X. Zhang, and T. Zhao. 2023. “GLC_FCS30D: The First Global 30-m Land-Cover Dynamic Monitoring Product with Fine Classification System from 1985 to 2022” (Dataset). Zenodo. Accessed August 11, 2023. https://doi.org/10.5281/zenodo.8239305.
- Mirzabaev, A., M. Sacande, F. Motlagh, A. Shyrokaya, and A. Martucci. 2022. “Economic Efficiency and Targeting of the African Great Green Wall.” Nature Sustainability 5 (1): 17–25. https://doi.org/10.1038/s41893-021-00801-8.
- Muñoz Sabater, J. 2019. “ERA5-Land Monthly Averaged Data from 1981 to Present.” (Dataset). Copernicus Climate Change Service (C3S) Climate Data Store (CDS). Accessed July 12, 2019. https://doi.org/10.24381/cds.68d2bb30.
- Rotllan-Puig, X., E. Ivits, and M. Cherlet. 2021. “LPDynR: A New Tool to Calculate the Land Productivity Dynamics Indicator.” Ecological Indicators 133: 108386. https://doi.org/10.1016/j.ecolind.2021.108386.
- Salisbury, J. W., and D. M. D’Aria. 1992. “Infrared (8-14 μm) Remote Sensing of Soil Particle Size.” Remote Sensing of Environment 42 (2): 157–165. https://doi.org/10.1016/0034-4257(92)90099-6.
- Samarinas, N., N. L. Tsakiridis, S. Kokkas, E. Kalopesa, and G. C. Zalidis. 2023. “Soil Data Cube and Artificial Intelligence Techniques for Generating National-Scale Topsoil Thematic Maps: A Case Study in Lithuanian Croplands.” Remote Sensing 15 (22): 5304. https://doi.org/10.3390/rs15225304.
- Shen, T., X. Li, Y. Chen, Y. Cui, Q. Lu, X. J, and J. Chen. 2023. “HiLPD-GEE: High Spatial Resolution Land Productivity Dynamics Calculation Tool Using Landsat and MODIS Data.” International Journal of Digital Earth 16 (1): 671–690. https://doi.org/10.1080/17538947.2023.2179675.
- Sims, N. C., J. R. England, G. J. Newnham, S. Alexander, C. Green, S. Minelli, and A. Held. 2019. “Developing Good Practice Guidance for Estimating Land Degradation in the Context of the United Nations Sustainable Development Goals.” Environmental Science & Policy 92: 349–355. https://doi.org/10.1016/j.envsci.2018.10.014.
- Sims, N. C., G. J. Newnham, J. R. England, J. Guerschman, S. J. D. Cox, S. H. Roxburgh, R. A. Viscarra Rossel, et al. 2021. Good Practice Guidance. SDG Indicator 15.3.1, Proportion of Land That Is Degraded Over Total Land Area. Version 2.0. Bonn, Germany: United Nations Convention to Combat Desertification. https://www.unccd.int/resources/manuals-and-guides/good-practice-guidance-sdg-indicator-1531-proportion-land-degraded.
- Song, X., Z. Liu, and Y. Zhao. 2004. “Cloud Detection and Analysis of MODIS Image.” In IGARSS 2004. 2004 IEEE International Geoscience and Remote Sensing Symposium 4: 2764–2767. https://doi.org/10.1109/igarss.2004.1369875.
- Thomas, A., L. Bentley, C. Feeney, S. Lofts, C. Robb, E. C. Rowe, A. Thomson, E. Warren-Thomas, and B. Emmett. 2023. “Land Degradation Neutrality: Testing the Indicator in a Temperate Agricultural Landscape.” Journal of Environmental Management 346: 118884. https://doi.org/10.1016/j.jenvman.2023.118884.
- UNCCD (United Nations Convention to Combat Desertification). 2015. Report of the Conference of the Parties on its Twelfth Session, Held in Ankara from 12 to 23 October 2015. Part Two: Action Taken. Bonn, Germany: UNCCD. https://www.unccd.int/official-documents/cop-12-ankara-2015.
- WOCAT. 2021. “WOCAT, the world overview of conservation approaches and technologies [online]”. Accessed 3 March 2021. https://www.wocat.net/en/.
- Yang, J., X. Li, B. Wu, J. Wu, B. Sun, C. Yan, and Z. Gao. 2021. “High Spatial Resolution Topsoil Organic Matter Content Mapping Across Desertified Land in Northern China.” Frontiers in Environmental Science 9: 668912. https://doi.org/10.3389/fenvs.2021.668912.
- Zeng, N. 2003. “Drought in the Sahel.” Science 302 (5647): 999–1000. https://doi.org/10.1126/science.1090849.
- Zhang, X., L. Liu, X. Chen, Y. Gao, S. Xie, and J. Mi. 2021. “GLC_FCS30: Global Land-Cover Product with Fine Classification System at 30 m Using Time-Series Landsat Imagery.” Earth System Science Data 13 (6): 2753–2776. https://doi.org/10.5194/essd-13-2753-2021.
- Zhang, X., L. Liu, T. Zhao, X. Chen, S. Lin, J. Wang, J. Mi, and W. Liu. 2023. “GWL_FCS30: A Global 30 m Wetland map with a Fine Classification System Using Multi-Sourced and Time-Series Remote Sensing Imagery in 2020.” Earth System Science Data Discussions 15: 265–293. https://doi.org/10.5194/essd-15-265-2023.
- Zhang, X., L. Liu, T. Zhao, Y. Gao, X. Chen, and J. Mi. 2022. “GISD30: Global 30 m Impervious-Surface Dynamic Dataset from 1985 to 2020 Using Time-Series Landsat Imagery on the Google Earth Engine Platform.” Earth System Science Data 14 (4): 1831–1856. https://doi.org/10.5194/essd-14-1831-2022.
- Zhang, X., T. Zhao, H. Xu, W. Liu, J. Wang, X. Chen, and L. Liu. 2024. “GLC_FCS30D: The First Global 30-m Land-Cover Dynamic Monitoring Product with a Fine Classification System from 1985 to 2022 Using Dense Time-Series Landsat Imagery and Continuous Change-Detection Method.” Earth System Science Data Discussions 16: 1353–1381. https://doi.org/10.5194/essd-16-1353-2024.
- Zucca, C., Q. B. Le, P. Karampiperis, T. Lemann, R. Thomas, B. A. Thiombiano, T. Hermassi, et al. 2024. “Toward an Operational Tool to Integrate Land Degradation Neutrality into Land use Planning: LUP4LDN.” Land Degradation & Development 35 (7): 2489–2507. https://doi.org/10.1002/ldr.5075.