
 ?Mathematical formulae have been encoded as MathML and are displayed in this HTML version using MathJax in order to improve their display. Uncheck the box to turn MathJax off. This feature requires Javascript. Click on a formula to zoom.
ABSTRACT
China’s second generation of geostationary meteorological satellites Fengyun-4 (FY-4) are equipped with the Advanced Geosynchronous Radiation Imager (AGRI) which has the advantages of large number of spectral bands and high temporal resolution. To fully leverage these features, a new snow cover (SC) mapping algorithm was proposed, which firstly derives SC map from a single scene image and then combines multi-temporal SC results within one day into a daily SC composite. The novelty of the proposed algorithm includes the utilization of small spatial and temporal divisions to avoid the use of complex kernel-driven models for the correction of bidirectional effects of surface reflectance and a novel framework to merge multi-temporal SC maps by weighting the solar illumination conditions. The SC results were validated against in-situ snow depth measurements, Landsat 8 derived SC data and MODIS SC products. Results indicate that merging multi-temporal SC data can reduce cloud obscuration with the average daily cloud coverage percentage decreasing from about 47.03% for single scene to 35.62% for merged one and slightly improve snow detection accuracy. The overall accuracy (OA) ranges from 95.00% to 96.19%, and the F-score (FS) varies from 77.78% to 87.14% when compared to different reference data, suggesting an overall good performance.
1. Introduction
Snow cover (SC) plays a crucial role in the Earth's climate system through regulating energy and moisture fluxes between the surface and the atmosphere due to its high surface albedo, low thermal conductivity and contribution to soil moisture and runoff (Zhang Citation2005). Snow cover has been identified as one of the essential climate variables (ECVs) of the global climate observing system (GCOS) (Bojinski et al. Citation2014) and its information is critical for many applications such as water source management, numerical weather prediction, hydrological modeling, and climate change research (Alessandri et al. Citation2021; Brasnett Citation1999; Dyer Citation2008; MacKay et al. Citation2006; McCabe and Wolock Citation2010).
Optical satellite remote sensing has been one of the most referred approaches for snow cover mapping at both regional and global scales due to its capability to discriminate snow cover from snow-free surfaces and most clouds with multispectral observations and the abundance in data sources. Among the many optical sensors utilized for snow cover mapping, there are two main types of satellites: polar-orbiting and geostationary. Generally, polar-orbiting satellites can provide global coverage with high spatial resolution, but with limited temporal resolution. The commonly used sensors include the Advanced Very High Resolution Radiometer (AVHRR), the Moderate Resolution Imaging Spectroradiometer (MODIS), the Landsat series, and the Sentinel-2 multi-spectral instrument (MSI). Based on observations from these sensors, a number of snow cover products have been generated and published (Frei et al. Citation2012; Hall, Riggs, and Salomonson Citation1995; Key et al. Citation2013; Robinson, Dewey, and Heim Citation1993). However, these polar-orbiting snow cover products suffer from large data gaps due to frequent clouds. Meanwhile, cloud obscuration can reduce the snow cover mapping accuracy due to the similar spectral characteristics of snow and clouds (Liang et al. Citation2008; Wang, Xie, and Liang Citation2008). Various attempts have been made to obtain gap-filled snow cover products by using multi-temporal data (Huang et al. Citation2018; Huang et al. Citation2022; Jing et al. Citation2019; Morriss et al. Citation2016; Premier et al. Citation2021) or multi-source data (Chen et al. Citation2018; Dong and Menzel Citation2016; Hao et al. Citation2019).
In contrast to polar-orbit satellites, geostationary satellites have high temporal resolution which offers the possibility to significantly reduce the effect of clouds. A variety of snow cover mapping algorithms have been proposed specifically for different sensors, including the Imager instrument on Geostationary Operational Environmental Satellites (GEOS) (Romanov, Gutman, and Csiszar Citation2000), the Spinning Enhanced Visible and Infrared Imager (SEVIRI) on Meteosat Second Generation (MSG) (de Wildt, Martijn, and Gruen Citation2007; Romanov and Tarpley Citation2006 Siljamo and Hyvärinen Citation2011), the Visible and Infrared Spin Scan-Radiometer (VISSR) on the Chinese meteorological satellites Fengyun-2 (FY-2) (Li, Yan, and Liu Citation2007; Yang et al. Citation2014), the Advanced Himawari Imager (AHI) on the Japanese meteorological satellites Himawari-8/9 (Yogo et al. Citation2019), the Advanced Geosynchronous Radiation Imager (AGRI) on the Chinese meteorological satellites Fengyun-4 (FY-4) (Kan et al. Citation2023; Qiao et al. Citation2021), and the advanced meteorological imager (AMI) on Geostationary-Korean Multi-Purpose SATellite-2A (GK-2A) (Jin et al. Citation2022; Lee and Choi Citation2022). Generally, the above algorithms can be classified into two types. The first one firstly merges multi-temporal images into a composite one and then detects snow cover from the daily composited image (de Wildt, Martijn, and Gruen Citation2007; Qiao et al. Citation2021; Romanov and Tarpley Citation2006 Romanov, Gutman, and Csiszar Citation2000), while the second one firstly derives snow cover map from single scene image and then combines the snow cover maps into a composite one (Jin et al. Citation2022; Lee and Choi Citation2022; Siljamo and Hyvärinen Citation2011; Yang et al. Citation2014; Yogo et al. Citation2019).
Meanwhile, most of the above algorithms are threshold-based methods that utilize multiple thresholds for different bands and spectral indices (e.g. the normalized difference snow index (NDSI) (Dozier Citation1989)) to discriminate between clouds, snow-covered area and snow-free land. Since observations from geostationary satellites cover a very broad range of viewing and illumination configurations, variation in the illuminating-viewing geometry certainly causes high variation in reflectance due to the bidirectional properties of surface reflectance (de Wildt, Martijn, and Gruen Citation2007). Therefore, angular effect correction is usually applied to the measured reflectances based on a semi-empirical kernel-driven model. However, the best thresholds vary significantly with space and time (Hao et al. Citation2022; Härer et al. Citation2018), and a set of time – and location-independent thresholds may lead to large uncertainties in snow cover maps.
The Fengyun-4 (FY-4) satellites represent China’s second generation of geostationary meteorological satellites, and two satellites (FY-4A and FY-4B) have been successfully launched in December 2016 and June 2021, respectively. The AGRI sensor onboard FY-4 has 14 spectral channels covering a spectral range from 0.45 µm to 13.8 µm, and can deliver full disk images every 15–60 min at a resolution of 0.5–4 kilometers (Yang et al. Citation2017). Qiao et al. (Citation2021) firstly proposed a snow cover detection algorithm for FY-4A AGRI data, in which a cloud-clearing daily composite was generated by fusing the daily multi-temporal images based on a maximum infrared brightness temperature method (Romanov and Tarpley Citation2003; Romanov and Tarpley Citation2006; Romanov, Gutman, and Csiszar Citation2000) and then used for snow cover mapping after angular effect correction of surface reflectance. This algorithm can provide only one snow cover map per day. In contrast to this approach, this study aims to develop a new snow cover mapping algorithm for FY-4A AGRI data, which derives snow cover maps from multi-temporal imageries independently and then merges them into a composite one. The newly proposed algorithm is evaluated using three different snow cover datasets, including in situ snow depth measurements, Landsat 8 derived snow cover data, and MODIS snow cover products.
2. Study area and datasets
2.1. Study area
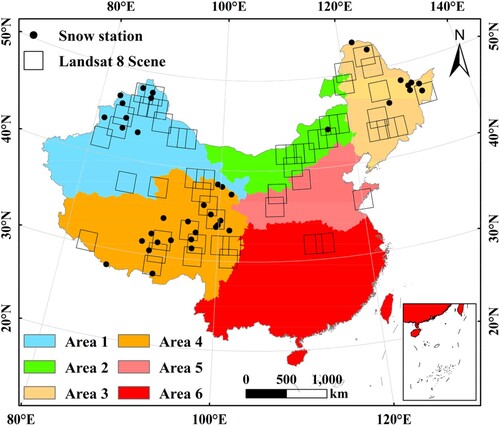
The study area is China land area which lies between 17°N – 56°N and 73°E – 135°E and is displayed in . The study area can be divided into 6 sub-regions according to their respective climate and ecosystem characteristics (Li et al. Citation2020; Xie et al. Citation2012). Area 1 mainly covers the arid region of Northwest China. While the southern part of this area is dominated by ephemeral snow, the north part contains various snow types, including prairie, taiga and mountain types as defined in (Sturm, Holmgren, and Liston Citation1995). Area 2 mainly covers the Inner Mongolia of Northern China, which is an arid and semi-arid region with prairie and tundra snow types. Area 3 covers the humid and semi-humid areas of Northeast China with dominant prairie and tundra snow types. Area 4 covers the Tibetan Plateau of China with the dominant tundra and mountain snow types. Area 4 mainly covers the semi-humid region in the North China Plain and Area 5 mainly covers the humid region in Southern China. Both areas are dominated by ephemeral snow.
Figure 1. Study area and study data in this study.
2.2. FY-4A AGRI data
The FengYun-4 (FY-4) series is the second generation of Chinese geostationary meteorological satellites, following on from the FengYun-2 (FY-2) series. The FY-4A satellite is the first satellite of FY-4 series and was launched on December 11, 2016. The AGRI instrument onboard FY-4A is a multiple channel radiation imager that covers a spectral range from 0.45 µm to 13.8 µm (Yang et al. Citation2017). It consists of 14 spectral bands, including 6 visible/near infrared bands (i.e. 0.47 , 0.65, 0.825, 1.375, 1.61, and 2.25 µm), 2 mid-wave infrared bands (i.e. 3.75 µm high and 3.75 µm low), 2 water-vapor bands (i.e. 6.25 and 7.1 µm) and 4 long-wave infrared bands (i.e. 8.5, 10.7, 12.0 and 13.5 µm). The AGRI sensor can deliver full disk images every 15–60 min at a resolution of 0.5–4 kilometers (Yang et al. Citation2017). The FY-4A is located at 104.7°E above the equator, and can provide high-frequency observations over China and neighboring areas.
The Level-1 product of FY-4A AGRI data were utilized and can be obtained from the National Satellite Meteorological Center (http://satellite.nsmc.org.cn). The Level-1 product encompasses all the 14 channel data at a resolution of about 4 km. The data were geometrically corrected using the latitude and longitude lookup table provided on the website. The accuracy of FY-4A AGRI navigation could reach 112 μrad (3σ, within 64.5° of geocentric angle) at the sub-satellite point, which can restrict the geolocation accuracy within 1 pixel (Yang et al. Citation2017; Zhang et al. Citation2019). The radiometric calibration was applied to the AGRI data to obtain the top-of-atmosphere (TOA) reflectance (for visible/near infrared bands) or brightness temperature (for infrared bands) of each band. Only data acquired between 10:45 and 14:15 (local time, UTC + 08:00) were used due to solar illumination conditions and there are 8 images each day with acquisition times being 10:45, 11:00, 11:15, 12:00, 13:00, 13:45, 14:00, and 14:15. The illumination conditions vary within one day, which causes reflectance variations, especially in the visible bands. Therefore, the TOA reflectances were corrected by dividing observed reflectances by the cosine of the solar zenith angle (SZA) according to (Yang et al. Citation2014). The simple cosine method is based on the assumption of Lambertian surface, and has been widely used for terrain illumination correction and BRDF correction (Dozier and Frew Citation1990; Kowalik, Marsh, and Lyon Citation1982; Richter Citation1997).
2.3. MODIS snow cover products
Two snow cover products derived from the MODIS data are used as reference data to validate the snow cover mapping results from FY-4A AGRI data. The first one is the MODIS daily snow cover MOD10A1 (MODIS/Terra Snow Cover Daily L3 Global 500 m SIN Grid, Version 61) (Hall and Riggs Citation2021), which can be available at the National Snow and Ice Data Center (NSIDC) (https://nsidc.org/data/mod10a1/versions/61). This product contains daily, gridded NDSI values derived from the surface reflectance data, and the binary snow cover map can be generated using a NDSI threshold value according to (Riggs, Hall, and Román Citation2017; Zhang et al. Citation2019). Two NDSI thresholds (i.e. 0.1 and 0.4) were tested for the validation of FY-4A SC data. The MODIS daily snow product has been extensively validated in different regions of the world (Hall and Riggs Citation2007; Parajka and Blöschl Citation2006; Rittger, Painter, and Dozier Citation2013) and can achieve an overall high accuracy when compared to ground data (Coll and Li Citation2018).
There are abundant cloud-induced gaps in the MOD10A1 product due to cloud contamination. A gap-filled MODIS snow cover product over China is also utilized for comparison. This product is produced by the Northwest Institute of Eco-Environment and Resources (NIEER), Chinese Academy of Sciences (Hao et al. Citation2022) and contains two datasets. The first one is the NIEER MODIS snow cover dataset (referred to as NIEER MODIS-only) which is produced by aggregating the Terra-MODIS and Aqua-MODIS snow cover data under clear skies to exclude some cloud gaps. The second one is the daily cloud-gap-filled (CGF) snow cover dataset (referred to as NIEER MODIS-CGF) which is generated by employing the spatiotemporal hidden Markov random field (HMRF) gap-filling technique to fill gaps by simultaneously assimilating temporally and spatially neighboring information. Validation results show that the overall accuracy (OA) of this daily continuous cloud-free dataset is up to 93% (Hao et al. Citation2022). This product can be obtained from the National Cryosphere Desert Data Center (http://www.ncdc.ac.cn).
2.4. Landsat 8 OLI data
The Landsat 8 Level-2 surface reflectance scene-based products with a spatial resolution of 30 m from Operational Land Imager (OLI) (Roy et al. Citation2014) were utilized to derive high spatial resolution snow cover for the validation of the FY-4A snow cover data. The Landsat 8 Level-2 product contains atmospherically corrected surface reflectance and can be obtained from the United States Geological Survey (USGS) (https://Earthexplorer.usgs.gov). A total of 63 scenes were obtained from 2018 to 2022 and their spatial distributions are displayed in .
In order to extract snow cover from Landsat 8 OLI data, the SNOw-MAPping (SNOMAP) algorithm was employed (Dozier Citation1989; Hall, Riggs, and Salomonson Citation1995; Riggs, Hall, and Salomonson Citation1994), and has been commonly used to map snow-covered area from multispectral data. The SNOMAP algorithm uses two criteria, namely, the NDSI and the near-infrared (NIR) band reflectance. Snow cover can be identified as having NDSI ≥ 0.4 and NIR ≥ 0.11. The Landsat 8 binary snow cover was then aggregated from 30 m to FY-4A AGRI 4 km resolution to produce a fractional snow cover product. A fractional snow cover threshold of 50% was used to classify a pixel as snow-covered or snow-free (Crawford Citation2015; Hall and Riggs Citation2007) to obtain snow cover product at 4 km.
2.5. In-situ snow depth measurements
Ground in-situ snow depth measurements offer a superior tool for independent validation of satellite-based snow cover products since they are not constrained by weather conditions. Daily ground snow depth observations from 41 ground stations published by the National Cryosphere Desert Data Center (http://www.ncdc.ac.cn) were used to validate the FY-4A snow cover product in this study. These snow depth measurements contain historical snow cover dataset in China (2008-2019) (Zheng et al. Citation2021), snow depth dataset from ordinary meteorological stations from 2017 to 2019 (Li et al. Citation2021a), and the snow characteristics dataset from 6 super stations from 2017 to 2020 (Li et al. Citation2021b). The spatial distribution of the selected ground stations is displayed in . These ground stations provide snow depth measurements with quality control. In order to convert the measured snow depth to snow presence or absence, a threshold of snow depth is applied. If measured snow depth is greater than 2 cm, the ground station is snow-covered; otherwise, it will be snow-free according to (Gascoin et al. Citation2019).
3. Methodology
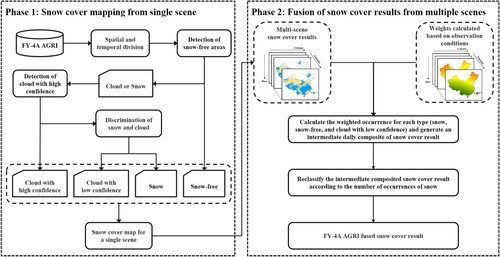
This study aims to develop a new snow cover detection algorithm for FY-4A AGRI data, which consists of two phases as indicated in . Phase 1 is dedicated to mapping snow cover from single scene of FY-4 AGRI data and it comprises three steps, including detection of snow-free pixels (Step 1), detection of cloud with high confidence (Step 2), and discrimination of snow and cloud (Step 3). Step 1 and Step 3 are based on decision tree classifiers while Step 2 is based on a threshold-based method. Phase 2 aims to merge the snow cover results from multi-temporal images into a fused one to reduce the gaps introduced by clouds.
Figure 2. Flowchart of the snow cover mapping algorithm for FY-4A AGRI data.
3.1. Snow cover mapping from single scene
3.1.1. Feature extraction
A total of 21 features are used for snow cover detection, including the 13 bands (excluding the band of 3.75 µm low) of FY-4A AGRI, 3 spectral indices and 5 brightness temperature differences. The 3 spectral indices include the normalized difference snow index (NDSI) (Dozier Citation1989), the normalized difference forest snow index (NDFSI) (Wang et al. Citation2015; Wang, Chen, and Wang Citation2020), and the normalized difference vegetation index (NDVI). These spectral indices are defined as:
(1)
(1)
(2)
(2)
(3)
(3) where R indicates the TOA reflectance of a band.
The NDSI has been widely used for snow-cover mapping at large scales and is more suitable for snow cover detection in open areas (Metsämäki et al. Citation2012). In forested areas, the NDSI value is observed to be low and exhibits a discrete distribution, which leads to reduced capability for snow cover detection (Wang et al. Citation2018). The NDFSI was proposed with the aim to improve the accuracy of snow recognition in forested regions. The NDFSI is used in addition to the NDSI to map snow in vegetated areas and helps to better estimate snow covered forest (Klein, Hall, and Riggs Citation1998).
Discriminating between clouds and snow is difficult in visible bands since they have very similar spectral characteristics with high reflectance. The thermal infrared bands have been widely used for the clouds and snow discrimination (Allen, Durkee, and Wash Citation1990; de Wildt, Martijn, and Gruen Citation2007; Gléau Citation2016; Siljamo and Hyvärinen Citation2011). In this study, 5 thermal differences were employed for identification of different clouds and discrimination between clouds and snow (Gléau Citation2016), including BT12.0 – BT3.75, BT12.0 – BT10.7, BT13.5 – BT10.7, BT10.7 – BT3.75, and BT8.5 – BT10.7. For example, BT12.0 – BT10.7 allows the detection of thin cirrus clouds and cloud edges, and BT10.7 – BT3.75 aims to detect high semi-transparent clouds.
3.1.2. Training and validation sample selection
The land surface is classified into three types, including cloud, snow and snow-free. A number of 195 FY-4A AGRI images during the period of 2018–2019 were collected to generate training samples, which were then used to train the snow cover mapping algorithm. About 270000 samples of clouds, snow, and snow-free pixels were selected by visual interpretation.
A major issue in snow cover mapping from geostationary satellite observations is the wide range of viewing and illumination conditions since both viewing zenith angle and solar zenith angle vary with time or space. Changes in the viewing and solar zenith angles can cause reflectance variations due to the effect of bidirectional reflectance distribution function (BRDF) (Wu et al. Citation2012). Previous studies have employed the BRDF models to correct the angle effects (de Wildt, Martijn, and Gruen Citation2007; Qiao et al. Citation2021 Romanov, Gutman, and Csiszar Citation2000). However, this correction can be only applied to clear sky conditions and additional uncertainties may be introduced, which requires further evaluation. As an alternative, this study firstly used the simple cosine method to normalize the visible reflectances. Furthermore, the study area is divided into 6 geographical sub-regions (as indicated in ) and the FY-4A data acquisition period (10:45–14:15) is divided into 3 time periods so that the variation in illumination conditions is small within each spatial and temporal division. Therefore, a total of 18 snow cover mapping models were trained separately for each division and the numbers of training and validation samples are displayed in .
Table 1. Number of training and validation samples for each spatial and temporal division.
3.1.3. Decision tree classifier
The algorithm involves three steps in Phase 1 as indicated in . Decision trees (DTs) are trained to identify snow-free pixels in Step 1 and to differentiate between snow and clouds in Step 3. A decision tree is a non-parametric supervised learning algorithm for classification and regression. It could provide a visual representation of the decision-making process and does not depend on any assumptions specific to variable distribution or the independence of the variables from one another.
There are two main parameters in DT needed to be tuned, including the maximum depth of the tree (ND) and the minimum number of samples required to be at a leaf node (NL). In general, larger values of ND and smaller values of NL are expected to yield models to better fit the data, but it may cause overfitting. To determine the best values of ND and NL, a grid search with five-fold cross validation was used. The value of ND increased from 2 to 20 with an interval of 2, and the value of NL increased from 5 to 50 with an interval of 5. The optimal values for ND and NL are selected based on the saturation of score increments according to grid search results. The DT model was implemented through the Python Scikit-Learn (Pedregosa et al. Citation2011).
3.1.4. Detection of cloud with high confidence
After removal of snow-free pixels, obvious clouds are then detected and labeled as cloud with high confidence in Step 2 of Phase 1 (as indicated in ). This study employs a threshold-based algorithm to identify obvious clouds. Six criteria are used according to (de Wildt, Martijn, and Gruen Citation2007; Qiao et al. Citation2021; Siljamo and Hyvärinen Citation2011; Yogo et al. Citation2019) and their thresholds were determined using the training samples and displayed in . It can be seen that the optimal thresholds vary over different regions, which may be explained by the large spatial differences and seasonal variations in the distribution of different cloud types and cloud phases across China (Cai, Yang, and Chen Citation2022) and confirms the necessity to divide the study area into sub-regions and determine the thresholds accordingly.
Table 2. Criteria and thresholds for detection of cloud with high confidence.
3.2. Fusion of snow cover results from multiple scenes
The FY-4A has the advantage of high temporal resolution and could acquire multi-temporal imageries every day. In Phase 1, the snow cover result can be obtained from each single scene. Then, the multi-scene snow cover results can be composited into a daily snow cover data to reduce the effect of clouds. Previous studies have proposed to use the maximum occurrence composite strategy (Yogo et al. Citation2019) or the priority principle (Gao et al. Citation2010; Yang et al. Citation2014) without considering the uncertainty of classification. In this study, a new fusion framework to generate daily clear-sky snow cover product is proposed by considering solar illumination conditions. For each pixel, the normalized weight wi of the ith scene of a day can be calculated as:
(4)
(4) where SZAi indicates the solar zenith angle for the ith scene of a day, SZAmin represents the minimum value of a day. Generally, lower SZA indicates better observation condition and has higher weight.
There are Ntotal (Ntotal = 8 in this study) observations per day for each pixel. The weighted occurrence is calculated by adding up the normalized weights for each type. For snow, snow-free, and cloud with low confidence (excluding cloud with high confidence), their weighted occurrences are labeled as Wsnow, Wsnow-free, and Wcloud, respectively. An intermediate composite of snow cover result is then generated in which the type of each pixel is determined as the type having the maximum weighted occurrence during one day. For example, if Wsnow-free is the maximum value, then the pixel is set as snow-free. The intermediate composite result is finally reclassified according to the number of occurrences of snow. If the pixel is assigned to snow in the intermediate composite data, the occurrence of snow Nsnow will be checked. If Nsnow/Ntotal is greater than 0.5, this pixel is set as snow, otherwise, it will be set as snow-free or cloud depending on their weighted occurrences. The daily snow cover composite result is referred to as FY-4A fusion SC in the following analysis.
3.3. Assessment metrics
In order to validate the FY-4A SC data, a confusion matrix (as indicated in ) is constructed by comparing the FY-4A SC data against the reference data under clear-sky conditions. Four pixel classes can be identified, namely, true positive (TP), false positive (FP), true negative (TN) and false negative (FN). TP is the number of pixels in which both reference data and FY-4A SC data are snow-covered while TN indicates the number of pixels in which both reference data and FY-4A SC data are snow-free. FP represents the number of pixels that the reference data are snow-free and the FY-4A SC data are snow-covered. FN denotes the number of pixels that the reference data are snow-covered, and the FY-4A SC data are snow-free.
Table 3. Confusion matrix for FY-4A snow cover data versus reference data.
With the confusion matrix, four commonly referred metrics can be defined, including overall accuracy (OA), F-score (FS), underestimation error (UE) and overestimation error (OE), and calculated as:
(5)
(5)
(6)
(6)
(7)
(7)
(8)
(8) where TP, FP, FN, TN are the number of pixels defined in .
Among the above four metrics, OA represents the percentage that snow and snow-free pixels are correctly classified. FS a combined statistic that describes the overall accuracy of the classification but ignores true negatives. FS is more meaningful than OA when there are imbalanced classes. For example, OA is considered less effective than FS when images have extensive snow-free areas. UE represents the level of misclassification of snow as non-snow, and OE indicates the level of misclassification of non-snow as snow (Parajka and Blöschl Citation2008; Pu, Xu, and Salomonson Citation2007). It should be noted that all the four assessment metrics are computed under clear-sky conditions.
4. Results and discussion
4.1. Snow cover mapping results
The newly proposed algorithm is able to detect snow cover for single scene and merge snow cover results from multiple scenes into a fusion one. As a demonstration, the snow cover mapping results of the FY-4A AGRI data obtained at 8 acquisition times on December 5, 2019 are presented in (a)–(h) with the fusion result being displayed in (i). Three MODIS snow cover products, including MOD10A1 (NDSI > 0.1), NIEER MODIS-only SC and NIEER MODIS-CGF SC are also shown for comparison.
Figure 3. Snow mapping results from FY-4A AGRI on December 5, 2019 at different times (a)-(h) and (i) the fusion result. Three MODIS snow cover products, including MOD10A1 (NDSI > 0.1), NIEER MODIS-only SC and NIEER MODIS-CGF SC, are also displayed.
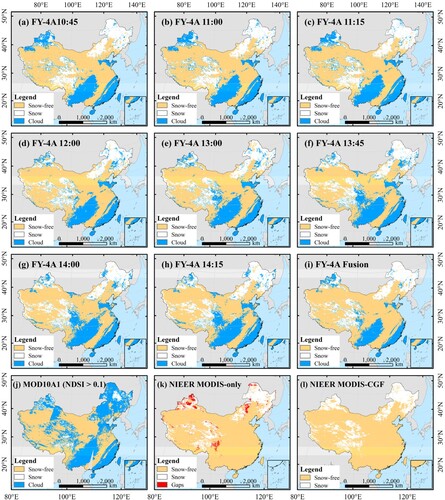
The spatial distribution of snow cover varies over imaging time for FY-4A data. For example, more snow covers are detected between 10:45 and 11:15 than between 12:00 and 14:15 in Northeast China, which could be partially explained by the rapid cloud movements. Another possible explanation could be associated with the variation in SZA. The calculated mean SZA across Northeast China reveals an increase from 68.9° to 78.5° as the imaging time increases, and higher SZA could lead to underestimation of snow cover as observed in (Hawotte et al. Citation2016). During the period of 10:45–11:15, the FY-4A single scene SC products are more consistent with NIEER MODIS SC products in Northeast China than in Northern Xinjiang and the Tibetan Plateau. However, opposite results are found for the period of 12:00–14:15. This result highlights the advantage of high-temporal data in eliminating the cloud gaps. Meanwhile, the FY-4A fusion SC product exhibits greater consistency with the MODIS-only product compared to the MODIS-CGF product since both FY-4A fusion SC and MODIS-only SC are purely derived from multi-temporal optical images without introducing other auxiliary data (i.e. passive microwave snow depth information).
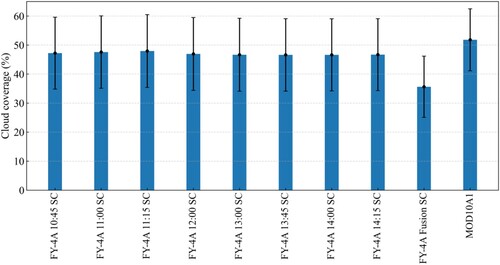
Merging of snow detection results from high temporal resolution data helps to reduce the effects of clouds. displays the average daily cloud coverage for different snow cover products during the period of 2018–2023. For the FY-4A single scene SC data, the cloud coverage is about 47.03%. By merging the multi-temporal FY-4A snow cover results, the cloud coverage is significantly reduced to 35.62%. MOD10A1 has the highest cloud coverage of about 51.80%, which can also be observed in that MOD10A1 yields more clouds than the other snow cover products.
Figure 4. Average daily cloud coverage with one standard deviation for different snow cover products during the period of 2018–2023.
4.2. Validation using in-situ snow depth data
The ground snow depth measurements from 41 stations are used to identify the presence of snow which are then used as truth data to evaluate the remotely sensed snow cover products. These stations are mainly located in the three major regions with stable seasonal snow cover, including Xinjiang, Northeast China, and the Tibetan Plateau. displays the four evaluation metrics (i.e. OA, FS, UE and OE) for FY-4A SC data at 8 acquisition times and the FY-4A fusion SC data. As a comparison, evaluation results for four MODIS SC products under clear-sky conditions are also displayed.
Figure 5. Evaluation metrics for different snow cover products validated using in-situ snow depth data.
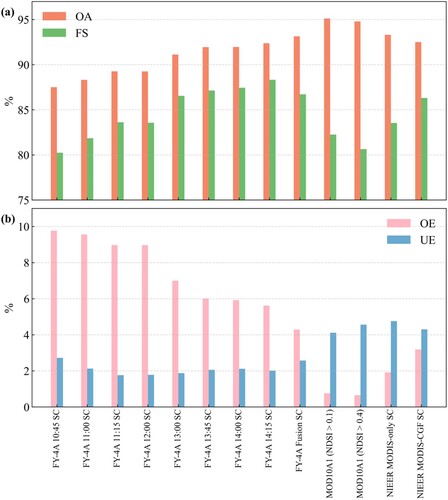
For the FY-4A single scene SC products, the accuracy shows an overall increase from 10:45–13:00 and then appears to stabilize from 13:00–14:15. The OA values range from 87.50% to 92.37% and the FS values vary from 80.24% to 88.33%. The UE ranges from 1.76% to 2.72%, while the OE ranges from 5.61% to 9.77%. The increase in accuracy with increasing local time may be attributed to the increasing quality in geometric observation conditions with an overall decreasing solar zenith angles, which justifies the rationality to merge the single scene SC products into a fused one by weighting the solar illumination conditions. The dependence of accuracy on SZA implies that the simple cosine correction method is not an optimal method to correct the reflectance and the corrected TOA reflectance still exhibits certain variation over time. However, the main advantage of the cosine correction method lies in its simplicity and requires no other auxiliary information. The merged SC product is superior to its input parent products and achieves an overall good accuracy in terms of highest OA value of 93.15% and lowest OE value of 4.29%. The FY-4A fusion SC product has comparable UE and OE values, indicating it is able to balance the overestimation and underestimation of snow pixels relative to each single scene product.
The OA value of the FY-4A fusion SC data is comparable to other MODIS SC products. However, it exhibits the highest FS value of 86.71%, indicating an overall good performance. The FY-4A fusion SC product has the UE value of 2.57% and the OE value of 4.29%. The higher of OE than UE infers that the overestimation is greater than the underestimation. The relatively high OE value also indicates that the FY-4A fusion SC product has a tendency to overestimate snow cover.
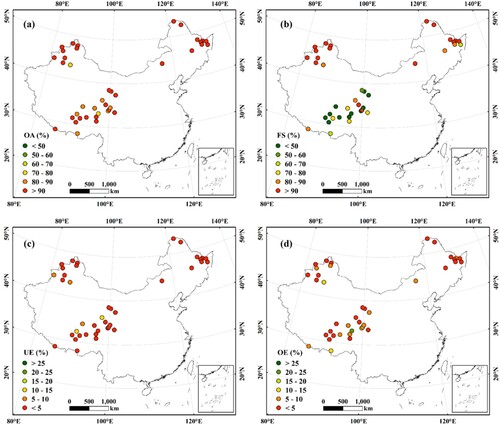
displays the spatial distribution of four evaluation metric calculated at each station. Almost all the stations in Xinjiang and Northeast China show high OA and FS values, indicating an overall good performance in these areas. However, stations in Tibetan Plateau have much lower FS values than the other two regions. The high OA of the Tibetan Plateau is significantly influenced by the snow-free area, and the FS value is more reliable than OA in evaluating the snow classification accuracy of satellite snow products. The relatively low accuracy of FY-4A fusion SC in Tibetan Plateau may be associated with patchy snow-cover features, rugged terrains, and rapid snow melt even in winter (Hao et al. Citation2022; Xiao et al. Citation2020). Meanwhile, the relatively low spatial resolution of the FY-4A AGRI data may also lead to the classification error of the mixed pixels, which further aggravates the uncertainty of the error.
Figure 6. The accuracy of the FY-4A fusion snow cover product varies at each ground snow-depth measurement station for (a) overall accuracy (OA), (b) F-score (FS), (c) underestimation error (UE) and (d) overestimation error (OE)
4.3. Validation using Landsat 8 OLI data
Ground in-situ snow depth measurements provide effective reference data for the accurate evaluation of snow cover product. However, the evaluation results highly depend on the spatial representativeness of in-situ snow depth measurements and could be biased due to the heterogeneity within satellite pixels (Huang et al. Citation2011). Therefore, snow cover maps derived from a total of 63 high resolution Landsat 8 OLI images are used to further evaluate the FY-4A fusion SC product.
shows the evaluation metrics for different regions. The FY-4A fusion SC product can achieve an overall good performance with OA and FS values being 89.05% and 91.65%, respectively. The high OE (9.22%) and low UE (1.73%) reveals that the FY-4A fusion SC product has a slight tendency to overestimate the snow cover. In terms of evaluation results for different regions, Area 1 (mainly covering Xinjiang), shows the highest accuracy with OA, FS, OE and UE values being 90.70%, 93.49%, 7.85% and 1.44%, respectively. This could be attributed to the widespread distribution of stable snow cover in Area 1. High OE values are observed in Area 2 (10.39%) and Area 3 (10.86%), indicating pronounced overestimations in these two areas. Area 2 and Area 3 mainly cover the Inner Mongolia and Northeast China, where extensive forest cover are presented. The SNOMAP algorithm tends to underestimate snow cover in forested areas due to low reflectance of dense forests and significant fluctuations in reflectance indices (Wang, Chen, and Wang Citation2020), which may help to explain the overestimate of snow cover for FY-4A fusion SC. Area 6 mainly covers areas in Southern China, where ephemeral snow dominates and the snow cover is more scattered and variable than other areas. Since FY-4A AGRI has a relatively poor spatial resolution of about 4 km, it has limited capability to detect patchy snow cover. This may help to explain the relatively low OA and FS values in Area 6.
Table 4. Evaluation metrics of FY-4A fusion snow cover product versus Landsat-8 OLI data.
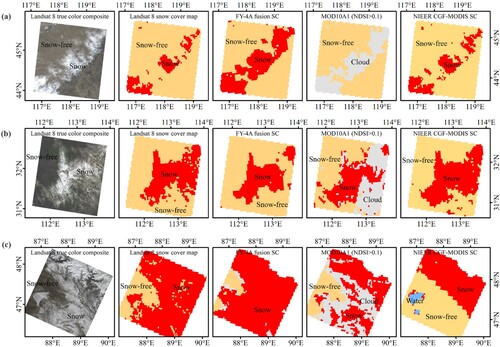
shows three detailed examples of comparisons among different snow cover products. The three images are located in eastern Inner Mongolia on January 5, 2019, Central China on February16, 2020 and Northern Xinjiang on March 22, 2019, respectively. (a) represents a mixed grassland and forest area and the Landsat 8 SC map with the SNOMAP algorithm obviously underestimates the snow cover, which can be explained by the effect of forest cover (Wang, Chen, and Wang Citation2020). The FY-4A fusion SC data extracts the largest snow cover and can successfully recognize scattered snow cover according to the Landsat 8 true color composite image. The MOD10A1 fails to identify the snow cover and misclassifies all the snow cover into cloud. (b) displays the snow cover results during a short-term snowfall under complex land cover conditions, where the land cover types include forest, croplands, urban and built-up lands. Almost all the SC products can captures this snowfall event except that the MOD10A1 is severely affected by clouds. (c) shows snow cover results in a mountainous area. The FY-4A fusion SC product agrees well with the Landsat 8 SC map. However, the MOD10A1 product detects more clouds while the NIEER MODIS-CGF product fails to detect ice and snow in the lower part of the Landsat 8 image.
Figure 7. Comparison of different snow cover products for three cases: (a) eastern Inner Mongolia, January 5 2019; (b) Central China, February16, 2020; (c) Northern Xinjiang, March 22, 2019.
4.4. Comparison to MODIS snow cover products
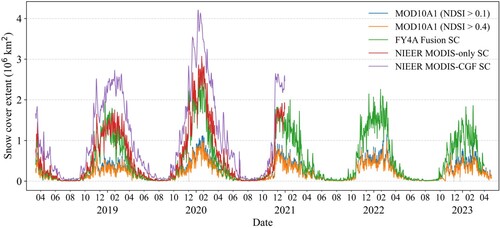
displays the daily snow cover extent over China extracted from five snow cover products during the period of 2019–2023. All the SC products can capture the seasonal variations of snow cover extent. The NIEER MODIS-CGF SC product yields the highest snow cover extent since it blends multi-source snow cover products, including Terra-MODIS, Aqua-MODIS and passive microwave snow depth products, which can help to reduce the cloud-induced gaps significantly. The FY-4A fusion SC product is very close to the NIEER MODIS-only SC product since both are purely derived from multi-temporal optical images within one day. The MOD10A1 (both thresholds) extracts the least snow cover extent, indicating that SC product from single scene severely suffers from cloud contamination.
Figure 8. Daily snow cover extent over China extracted from different snow cover products during the period of 2019–2023.
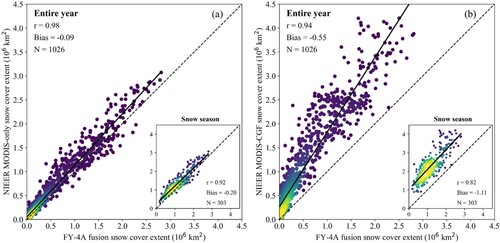
In order to further investigate the consistency between the FY-4A fusion SC product and the NIEER MODIS SC products, displays the scatterplots of snow cover areas between two NIEER MODIS SC products over entire year and snow season (November to March). The FY-4A fusion SC is more close to the NIEER MODIS-only SC than the NIEER MODIS-GCF SC in terms of higher correlation coefficients and smaller absolute biases. The snow cover extent between the FY-4A fusion SC and the NIEER MODIS-only SC is minimal as indicated in (a). When compared to the NIEER MODIS-CGF SC, the FY-4A fusion SC tends to underestimate snow cover extent with a negative bias of 0.55 × 10⁶ km2 for entire year and of 1.11 × 10⁶ km2 for snow accumulation period ((b)). However, the correlation coefficients still exceeded 0.8, indicating an overall performance of the FY-4A fusion SC product.
Figure 9. Scatterplots of snow cover extent between the FY-4A fusion SC product and the NIEER MODIS SC products for (a) the NIEER MODIS-only SC product and (b) the NIEER MODIS-CGF SC product over the entire year and the snow season.
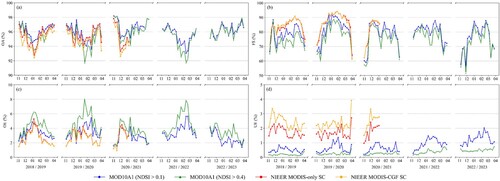
displays the time series of four evaluation metrics (i.e. OA, FS, OE and UE) on a weekly basis during the winter season (November to March) from 2019 to 2023. These metrics were calculated by comparing the FY-4A fusion SC data against four MODIS snow cover products over China under clear sky conditions. The OA of the FY-4A fusion SC ranges from 92% to 98%. The FS value shows a seasonal change with the months. It varies from 50% to 70% in early November, when snow begins to accumulate over China and the snow cover is small and patchy. This could help to explain the relatively low accuracy of the FY-4A fusion SC product (Hori et al. Citation2017). The FS values for the NIEER MODIS-only and the NIEER MODIS-CGF SC products are higher than those for MOD10A1 (both thresholds), indicating that the FY-4A fusion SC are more close to the NIEER MODIS products than MOD10A1. This results is reasonable since MOD10A1 is derived from single scene data while both FY-4A fusion SC and NIEER MODIS SC products are from multiple scenes. The OE ranges from 2% to 8% and the UE varies from 0% to 4%. The overestimation error is higher than the underestimation error, inferring the FY-4A fusion SC tends to overestimate snow cover compared to other MODIS snow cover products, which agrees with the validation results using in-situ snow depth measurements.
Figure 10. Time series of evaluation metrics of the FY-4A fusion snow cover product compared to other MODIS snow cover products on a weekly basis for (a) overall accuracy; (b) F-score; (c) overestimation error; and (d) underestimated error.
4.5. Importance of spatial and temporal division
In this study, small spatial and temporal divisions are utilized in the model training stage with the study area being divided into 6 geographical sub-regions and the FY-4A data acquisition period (10:45–14:15) being divided into 3 time periods. In order to investigate the influence of small divisions, a whole model without small divisions in Phase 1 is trained on all the sample data. The same fusing algorithm in Phase 2 is utilized to merge multi-temporal SC results for the whole model.
Since both the FY-4A fusion SC and the NIEER MODIS-only SC are derived from multi-temporal images within one day, the NIEER MODIS-only SC data is used as reference data to validate the FY-4A fusion SC data. summarizes the evaluation metrics of FY-4A fusion SC data with/without small divisions for different regions. The FY-4A fusion SC with small divisions performs better than that without small divisions in almost all regions in terms of relatively higher OA and FS values. For Area 1–4, the FY-4A fusion SC with small divisions yields high OA values (> 92%) and FS values (> 80%). By contrast, Area 5 and 6 have OA values up to 99% but has relatively low FS values. These two areas have ephemeral snow cover, and detection of ephemeral snow can be a difficult problem (Hall et al. Citation2010; Stillinger et al. Citation2023). However, the FY-4A fusion SC with small divisions shows a greater improvement in accuracy over Area 5 and 6 than over Area 1–4, which highlights the importance of the utilization of small divisions to improve the detection accuracy of ephemeral snow.
Table 5. Comparison of evaluation metrics for FY-4A fusion snow cover product with/without small divisions versus the NIEER MODIS-only SC product.
5. Conclusion
This paper proposed a new snow cover mapping over China from the multispectral data obtained by the Advanced Geosynchronous Radiation Imager (AGRI) onboard the China's second generation geostationary meteorological satellite Fengyun-4A (FY-4A). The newly proposed algorithm firstly derives snow cover maps from single scene image and then merges multiple scenes of snow cover results into a daily composite by considering the effects of geometric observation conditions. A simple cosine method and small spatial and temporal divisions were utilized to reduce the influences of variations in reflectance observations caused by varying viewing and illumination configurations. This algorithm was validated against in-situ snow depth measurements, Landsat 8 OLI derived snow cover data, and two MODIS snow cover products.
FY-4A has the advantage of high temporal resolution, which is found to be able to reduce the effects of cloud obscuration with the average daily cloud coverage reducing from about 47.03% for each single scene to 35.62% for the merged one during the period of 2018–2023. The snow cover products from AGRI data were validated against three different snow cover datasets and show an overall good performance. The OA and FS are 93.15% and 86.71%, respectively, when compared to in-situ snow depth data. The OA and FS reach 89.05% and 91.65%, respectively, when compared to Landsat 8 derived snow cover data. The snow cover extent calculated from the FY-4A fusion SC data and NIEER MODIS SC data are also compared, the correlation varies from 0.82–0.98 from March 2018 to December 2020. Meanwhile, the daily merged snow cover products achieve improved classification accuracy when compared to single scene snow cover result, and can be used as alternative datasets at 4 km to MODIS.
Acknowledgements
The authors would like to thank the National Satellite Meteorological Center (NSMC) of China Meteorological Administration for the FY-4A AGRI data, the National Cryosphere Desert Data Center of China for the in-situ snow depth data and the NIEER MODIS snow cover product, the National Snow and Ice Data Center (NSIDC) of the United States for the MOD10A1 snow cover data, the United States Geological Survey (USGS) for the Landsat 8 OLI data.
Disclosure statement
No potential conflict of interest was reported by the author(s).
Data availability statement
The data that support the findings of this study are available from the corresponding author upon request.
Additional information
Funding
References
- Alessandri, Andrea, Franco Catalano, Matteo De Felice, Bart van den Hurk, and Gianpaolo Balsamo. 2021. “Varying Snow and Vegetation Signatures of Surface-Albedo Feedback on the Northern Hemisphere Land Warming.” Environmental Research Letters 16 (3): 034023.
- Allen, Robert C., Philip A. Durkee, and Carlyle H. Wash. 1990. “Snow/Cloud Discrimination with Multispectral Satellite Measurements.” Journal of Applied Meteorology 29 (10): 994–1004. https://doi.org/10.1175/1520-0450(1990)029<0994:SDWMSM>2.0.CO;2
- Bojinski, Stephan, Michel Verstraete, Thomas C. Peterson, Carolin Richter, Adrian Simmons, and Michael Zemp. 2014. “The Concept of Essential Climate Variables in Support of Climate Research, Applications, and Policy.” Bulletin of the American Meteorological Society 95 (9): 1431–1443. doi:https://doi.org/10.1175/BAMS-D-13-00047.1.
- Brasnett, Bruce. 1999. “A Global Analysis of Snow Depth for Numerical Weather Prediction.” Journal of Applied Meteorology 38 (6): 726–740. https://doi.org/10.1175/1520-0450(1999)038<0726:AGAOSD>2.0.CO;2.
- Cai, Hongke, Yue Yang, and Quanliang Chen. 2022. “Distribution Characteristics of Cloud Types and Cloud Phases Over China and Their Relationship with Cloud Temperature.” Remote Sensing 14 (21), https://doi.org/10.3390/rs14215601.
- Chen, Xiaona, Di Long, Shunlin Liang, Lian He, Chao Zeng, Xiaohua Hao, and Yang Hong. 2018. “Developing a Composite Daily Snow Cover Extent Record Over the Tibetan Plateau from 1981 to 2016 Using Multisource Data.” Remote Sensing of Environment 215: 284–299. doi:https://doi.org/10.1016/j.rse.2018.06.021.
- Coll, James, and Xingong Li. 2018. “Comprehensive Accuracy Assessment of MODIS Daily Snow Cover Products and gap Filling Methods.” ISPRS Journal of Photogrammetry and Remote Sensing 144: 435–452. doi:https://doi.org/10.1016/j.isprsjprs.2018.08.004.
- Crawford, Christopher J. 2015. “MODIS Terra Collection 6 Fractional Snow Cover Validation in Mountainous Terrain During Spring Snowmelt Using Landsat TM and ETM+.” Hydrological Processes 29 (1): 128–138. doi:https://doi.org/10.1002/hyp.10134.
- de Wildt, de Ruyter, Gabriela Seiz Martijn, and Armin Gruen. 2007. “Operational Snow Mapping Using Multitemporal Meteosat SEVIRI Imagery.” Remote Sensing of Environment 109 (1): 29–41. doi:https://doi.org/10.1016/j.rse.2006.12.008.
- Dong, Chunyu, and Lucas Menzel. 2016. “Producing Cloud-Free MODIS Snow Cover Products with Conditional Probability Interpolation and Meteorological Data.” Remote Sensing of Environment 186: 439–451. doi:https://doi.org/10.1016/j.rse.2016.09.019.
- Dozier, Jeff. 1989. “Spectral Signature of Alpine Snow Cover from the Landsat Thematic Mapper.” Remote Sensing of Environment 28: 9–22. doi:https://doi.org/10.1016/0034-4257(89)90101-6.
- Dozier, J., and J. Frew. 1990. “Rapid Calculation of Terrain Parameters for Radiation Modeling from Digital Elevation Data.” IEEE Transactions on Geoscience and Remote Sensing 28 (5): 963–969. doi:https://doi.org/10.1109/36.58986.
- Dyer, Jamie. 2008. “Snow Depth and Streamflow Relationships in Large North American Watersheds.” Journal of Geophysical Research: Atmospheres 113 (D18): 1–12. https://doi.org/10.1029/2008JD010031.
- Frei, Allan, Marco Tedesco, Shihyan Lee, James Foster, Dorothy K. Hall, Richard Kelly, and David A. Robinson. 2012. “A Review of Global Satellite-Derived Snow Products.” Advances in Space Research 50 (8): 1007–1029. doi:https://doi.org/10.1016/j.asr.2011.12.021.
- Gao, Yang, Hongjie Xie, Ning Lu, Tandong Yao, and Tiangang Liang. 2010. “Toward Advanced Daily Cloud-Free Snow Cover and Snow Water Equivalent Products from Terra–Aqua MODIS and Aqua AMSR-E Measurements.” Journal of Hydrology 385 (1): 23–35. https://doi.org/10.1016/j.jhydrol.2010.01.022.
- Gascoin, S., M. Grizonnet, M. Bouchet, G. Salgues, and O. Hagolle. 2019. “Theia Snow Collection: High-Resolution Operational Snow Cover Maps from Sentinel-2 and Landsat-8 Data.” Earth System Science Data 11 (2): 493–514. https://doi.org/10.5194/essd-11-493-2019.
- Gléau, Hervé Le. 2016. Algorithm Theoretical Basis Document for the Cloud Product Processors of the NWC/GEO.
- Hall, Dorothy, Christopher Fuhrmann, Baker Perry, George Riggs, David Robinson, and James Foster. 2010. “A Comparison of Satellite-Derived Snow Maps with a Focus on Ephemeral Snow in North Carolina.” 67th Eastern Snow Conference, Hancock, MA, USA.
- Hall, Dorothy K., and George A. Riggs. 2007. “Accuracy Assessment of the MODIS Snow Products.” Hydrological Processes 21 (12): 1534–1547. doi:https://doi.org/10.1002/hyp.6715.
- Hall, Dorothy K., and George A. Riggs. 2021. MODIS/Terra Snow Cover Daily L3 Global 500 m SIN Grid, Version 61. Boulder, CO, USA: NASA National Snow and Ice Data Center Distributed Active Archive Center.
- Hall, Dorothy K., George A. Riggs, and Vincent V. Salomonson. 1995. “Development of Methods for Mapping Global Snow Cover Using Moderate Resolution Imaging Spectroradiometer Data.” Remote Sensing of Environment 54 (2): 127–140. doi:https://doi.org/10.1016/0034-4257(95)00137-P.
- Hao, Xiaohua, Guanghui Huang, Zhaojun Zheng, Xingliang Sun, Wenzheng Ji, Hongyu Zhao, Jian Wang, Hongyi Li, and Xiaoyan Wang. 2022. “Development and Validation of a new MODIS Snow-Cover-Extent Product Over China.” Hydrology and Earth System Sciences 26 (8): 1937–1952. doi:https://doi.org/10.5194/hess-26-1937-2022.
- Hao, Xiaohua, Siqiong Luo, Tao Che, Jian Wang, Hongyi Li, Liyun Dai, Xiaodong Huang, and Qisheng Feng. 2019. “Accuracy Assessment of Four Cloud-Free Snow Cover Products Over the Qinghai-Tibetan Plateau.” International Journal of Digital Earth 12 (4): 375–393. doi:https://doi.org/10.1080/17538947.2017.1421721.
- Härer, S., M. Bernhardt, M. Siebers, and K. Schulz. 2018. “On the Need for a Time- and Location-Dependent Estimation of the NDSI Threshold Value for Reducing Existing Uncertainties in Snow Cover Maps at Different Scales.” The Cryosphere 12 (5): 1629–1642. https://doi.org/10.5194/tc-12-1629-2018.
- Hawotte, Florent, Julien Radoux, Guillaume Chomé, and Pierre Defourny. 2016. “Assessment of Automated Snow Cover Detection at High Solar Zenith Angles with PROBA-V.” Remote Sensing 8 (9). doi:https://doi.org/10.3390/rs8090699.
- Hori, Masahiro, Konosuke Sugiura, Kazufumi Kobayashi, Teruo Aoki, Tomonori Tanikawa, Katsuyuki Kuchiki, Masashi Niwano, and Hiroyuki Enomoto. 2017. “A 38-Year (1978–2015) Northern Hemisphere Daily Snow Cover Extent Product Derived Using Consistent Objective Criteria from Satellite-Borne Optical Sensors.” Remote Sensing of Environment 191: 402–418. doi:https://doi.org/10.1016/j.rse.2017.01.023.
- Huang, Xiaodong, Tiangang Liang, Xuetong Zhang, and Zhenggang Guo. 2011. “Validation of MODIS Snow Cover Products Using Landsat and Ground Measurements During the 2001–2005 Snow Seasons Over Northern Xinjiang, China.” International Journal of Remote Sensing 32 (1): 133–152. doi:https://doi.org/10.1080/01431160903439924.
- Huang, Yan, Hongxing Liu, Bailang Yu, Jianping Wu, Emily L. Kang, Min Xu, Shujie Wang, Andrew Klein, and Yaning Chen. 2018. “Improving MODIS Snow Products with a HMRF-Based Spatio-Temporal Modeling Technique in the Upper Rio Grande Basin.” Remote Sensing of Environment 204: 568–582. doi:https://doi.org/10.1016/j.rse.2017.10.001.
- Huang, Yan, Jiahui Xu, Jingyi Xu, Yelei Zhao, Bailang Yu, Hongxing Liu, Shujie Wang, Wanjia Xu, Jianping Wu, and Zhaojun Zheng. 2022. “HMRFS–TP: Long-Term Daily gap-Free Snow Cover Products Over the Tibetan Plateau from 2002 to 2021 Based on Hidden Markov Random Field Model.” Earth System Science Data 14 (9): 4445–4462. https://doi.org/10.5194/essd-14-4445-2022.
- Jin, Donghyun, Kyeong-Sang Lee, Sungwon Choi, Noh-Hun Seong, Daeseong Jung, Suyoung Sim, Jongho Woo, Uujin Jeon, Yugyeong Byeon, and Kyung-Soo Han. 2022. “An Improvement of Snow/Cloud Discrimination from Machine Learning Using Geostationary Satellite Data.” International Journal of Digital Earth 15 (1): 2355–2375. https://doi.org/10.1080/17538947.2022.2152886.
- Jing, Yinghong, Huanfeng Shen, Xinghua Li, and Xiaobin Guan. 2019. “A Two-Stage Fusion Framework to Generate a Spatio–Temporally Continuous MODIS NDSI Product Over the Tibetan Plateau.” Remote Sensing 11 (19): 2261. doi:https://doi.org/10.3390/rs11192261.
- Kan, Xi, Zhengsong Lu, Yonghong Zhang, Linglong Zhu, Kenny T. Sian, Jiangeng Wang, Xu Liu, Zhou Zhou, and Haixiao Cao. 2023. “DSRSS-Net: Improved-Resolution Snow Cover Mapping from FY-4A Satellite Images Using the Dual-Branch Super-Resolution Semantic Segmentation Network.” Remote Sensing 15 (18). https://doi.org/10.3390/rs15184431.
- Key, Jeffrey R., Robert Mahoney, Yinghui Liu, Peter Romanov, Mark Tschudi, Igor Appel, James Maslanik, Dan Baldwin, Xuanji Wang, and Paul Meade. 2013. “Snow and ice Products from Suomi NPP VIIRS.” Journal of Geophysical Research: Atmospheres 118 (23): 12,816–12,830. doi:https://doi.org/10.1002/2013JD020459.
- Klein, Andrew G., Dorothy K. Hall, and George A. Riggs. 1998. “Improving Snow Cover Mapping in Forests Through the use of a Canopy Reflectance Model.” Hydrological Processes 12 (10-11): 1723–1744. https://doi.org/10.1002/(SICI)1099-1085(199808/09)12:10/11<1723::AID-HYP691>3.0.CO;2-2
- Kowalik, William S., Stuart E. Marsh, and Ronald J. P. Lyon. 1982. “A Relation Between Landsat Digital Numbers, Surface Reflectance, and the Cosine of the Solar Zenith Angle.” Remote Sensing of Environment 12 (1): 39–55. doi:https://doi.org/10.1016/0034-4257(82)90006-2.
- Lee, Soobong, and Jaewan Choi. 2022. “A Snow Cover Mapping Algorithm Based on a Multitemporal Dataset for GK-2A Imagery.” GIScience & Remote Sensing 59 (1): 1078–1102. https://doi.org/10.1080/15481603.2022.2097395.
- Li, Lanhai, Tao Che, Yan Liu, Xiaofeng Li, Jianshe Xiao, and Duo Chu. 2021a. Snow Depth Dataset from Common Statin in the Typical Regions of China During 2017-2019. Lanzhou, China: National Cryosphere Desert Data Center.
- Li, Lanhai, Tao Che, Yan Liu, Xiaofeng Li, Jianshe Xiao, and Duo Chu. 2021b. Snow Survey Dataset from Super Statins of China During 2017-2020. Lanzhou, China: National Cryosphere Desert Data Center.
- Li, Xiaofeng, Shuang Liang, Kai Zhao, Jian Wang, Tao Che, and Zhen Li. 2020. “Snow Cover Classification Based on Climate Variables and its Distribution Characteristics in China.” Journal of Glaciology and Geocryology 42 (1):62–71. https://doi.org/10.7522/j.issn.1000-0240.2019.0050.
- Li, Sanmei, Hua Yan, and Cheng Liu. 2007. “Study of Snow Detection Using FY-2C Satellite Data.” National Remote Sensing Bulletin 11 (3): 406–413. https://doi.org/10.11834/jrs.20070356.
- Liang, Tiangang, Xiaodong Huang, Caixia Wu, Xingyuan Liu, Wenlong Li, Zhenggang Guo, and Jizhou Ren. 2008. “An Application of MODIS Data to Snow Cover Monitoring in a Pastoral Area: A Case Study in Northern Xinjiang, China.” Remote Sensing of Environment 112 (4): 1514–1526. doi:https://doi.org/10.1016/j.rse.2007.06.001.
- MacKay, Murray D., Paul A. Bartlett, Ed Chan, Chris Derksen, Song Guo, and Henry Leighton. 2006. “On the Simulation of Regional Scale Sublimation Over Boreal and Agricultural Landscapes in a Climate Model.” Atmosphere-Ocean 44 (3): 289–304. doi:https://doi.org/10.3137/ao.440306.
- McCabe, Gregory J., and David M. Wolock. 2010. “Long-term Variability in Northern Hemisphere Snow Cover and Associations with Warmer Winters.” Climatic Change 99 (1-2): 141–153. doi:https://doi.org/10.1007/s10584-009-9675-2.
- Metsämäki, Sari, Olli-Pekka Mattila, Jouni Pulliainen, Kirsikka Niemi, Kari Luojus, and Kristin Böttcher. 2012. “An Optical Reflectance Model-Based Method for Fractional Snow Cover Mapping Applicable to Continental Scale.” Remote Sensing of Environment 123: 508–521. doi:https://doi.org/10.1016/j.rse.2012.04.010.
- Morriss, B. F., E. Ochs, E. J. Deeb, S. D. Newman, S. F. Daly, and J. J. Gagnon. 2016. “Persistence-based Temporal Filtering for MODIS Snow Products.” Remote Sensing of Environment 175: 130–137. doi:https://doi.org/10.1016/j.rse.2015.12.030.
- Parajka, J., and G. Blöschl. 2006. “Validation of MODIS Snow Cover Images Over Austria.” Hydrology and Earth System Sciences 10 (5): 679–689. https://doi.org/10.5194/hess-10-679-2006.
- Parajka, J., and G. Blöschl. 2008. “Spatio-temporal Combination of MODIS Images – Potential for Snow Cover Mapping.” Water Resources Research 44 (3): 1–13. https://doi.org/10.1029/2007WR006204.
- Pedregosa, Fabian, Gael Varoquaux, Alexandre Gramfort, Vincent Michel, Bertrand Thirion, Olivier Grisel, Mathieu Blondel, et al. 2011. “Scikit-learn: Machine Learning in Python.” Journal of Machine Learning Research 12: 2825–2830. doi:https://dl.acm.org/doi/10.5555/1953048.2078195.
- Premier, Valentina, Carlo Marin, Stefan Steger, Claudia Notarnicola, and Lorenzo Bruzzone. 2021. “A Novel Approach Based on a Hierarchical Multiresolution Analysis of Optical Time Series to Reconstruct the Daily High-Resolution Snow Cover Area.” IEEE Journal of Selected Topics in Applied Earth Observations and Remote Sensing 14: 9223–9240. https://doi.org/10.1109/JSTARS.2021.3103585.
- Pu, Zhaoxia, Li Xu, and Vincent V. Salomonson. 2007. “MODIS/Terra Observed Seasonal Variations of Snow Cover Over the Tibetan Plateau.” Geophysical Research Letters 34 (6): 1–6. https://doi.org/10.1029/2007GL029262.
- Qiao, Haiwei, Ping Zhang, Zhen Li, and Chang Liu. 2021. “A New Geostationary Satellite-Based Snow Cover Recognition Method for FY-4A AGRI.” IEEE Journal of Selected Topics in Applied Earth Observations and Remote Sensing 14: 11372–11385. https://doi.org/10.1109/JSTARS.2021.3125015.
- Richter, R. 1997. “Correction of Atmospheric and Topographic Effects for High Spatial Resolution Satellite Imagery.” International Journal of Remote Sensing 18 (5): 1099–1111. https://doi.org/10.1080/014311697218593.
- Riggs, G. A., D. K. Hall, and M. O. Román. 2017. “Overview of NASA's MODIS and Visible Infrared Imaging Radiometer Suite (VIIRS) Snow-Cover Earth System Data Records.” Earth Syst. Sci. Data 9 (2): 765–777. https://doi.org/10.5194/essd-9-765-2017.
- Riggs, G. A., D. K. Hall, and V. V. Salomonson. 1994. “A Snow Index for the Landsat Thematic Mapper and Moderate Resolution Imaging Spectroradiometer.” 1994 IEEE International Geoscience and Remote Sensing Symposium, 8-12 Aug. 1994.
- Rittger, Karl, Thomas H. Painter, and Jeff Dozier. 2013. “Assessment of Methods for Mapping Snow Cover from MODIS.” Advances in Water Resources 51: 367–380. https://doi.org/10.1016/j.advwatres.2012.03.002.
- Robinson, David A., Kenneth F. Dewey, and Richard R. Heim. 1993. “Global Snow Cover Monitoring: An Update.” Bulletin of the American Meteorological Society 74 (9): 1689–1696. https://doi.org/10.1175/1520-0477(1993)074<1689:GSCMAU>2.0.CO;2
- Romanov, Peter, Garik Gutman, and Ivan Csiszar. 2000. “Automated Monitoring of Snow Cover Over North America with Multispectral Satellite Data.” Journal of Applied Meteorology 39 (11): 1866–1880. https://doi.org/10.1175/1520-0450(2000)039<1866:AMOSCO>2.0.CO;2
- Romanov, P., and D. Tarpley. 2003. “Automated Monitoring of Snow Cover Over South America Using GOES Imager Data.” International Journal of Remote Sensing 24 (5): 1119–1125. https://doi.org/10.1080/0143116021000044823.
- Romanov, Peter, and Dan Tarpley. 2006. “Monitoring Snow Cover Over Europe with Meteosat SEVIRI.” Proceedings of the 2005 Eumetsat Meteorological Satellite Conference.
- Roy, D. P., M. A. Wulder, T. R. Loveland, C. E. Woodcock, R. G. Allen, M. C. Anderson, D. Helder, et al. 2014. “Landsat-8: Science and Product Vision for Terrestrial Global Change Research.” Remote Sensing of Environment 145: 154–172. https://doi.org/10.1016/j.rse.2014.02.001.
- Siljamo, Niilo, and Otto Hyvärinen. 2011. “New Geostationary Satellite–Based Snow-Cover Algorithm.” Journal of Applied Meteorology and Climatology 50 (6): 1275–1290. doi:https://doi.org/10.1175/2010JAMC2568.1.
- Stillinger, T., K. Rittger, M. S. Raleigh, A. Michell, R. E. Davis, and E. H. Bair. 2023. “Landsat, MODIS, and VIIRS Snow Cover Mapping Algorithm Performance as Validated by Airborne Lidar Datasets.” The Cryosphere 17 (2): 567–590. https://doi.org/10.5194/tc-17-567-2023.
- Sturm, Matthew, Jon Holmgren, and Glen E. Liston. 1995. “A Seasonal Snow Cover Classification System for Local to Global Applications.” Journal of Climate 8 (5): 1261–1283. https://doi.org/10.1175/1520-0442(1995)008<1261:ASSCCS>2.0.CO;2
- Wang, Xiaoyan, Siyong Chen, and Jian Wang. 2020. “An Adaptive Snow Identification Algorithm in the Forests of Northeast China.” IEEE Journal of Selected Topics in Applied Earth Observations and Remote Sensing 13: 5211–5222. https://doi.org/10.1109/JSTARS.2020.3020168
- Wang, Gongxue, Lingmei Jiang, Chuan Xiong, and Yongsheng Zhang. 2022. “Characterization of NDSI Variation: Implications for Snow Cover Mapping.” IEEE Transactions on Geoscience and Remote Sensing 60: 1–18.
- Wang, Xiaoyan, Jian Wang, Tao Che, Xiaodong Huang, Xiaohua Hao, and Hongyi Li. 2018. “Snow Cover Mapping for Complex Mountainous Forested Environments Based on a Multi-Index Technique.” IEEE Journal of Selected Topics in Applied Earth Observations and Remote Sensing 11 (5): 1433–1441. https://doi.org/10.1109/JSTARS.2018.2810094
- Wang, Xiaoyan, Jian Wang, Zhiyong Jiang, Hongyi Li, and Xiaohua Hao. 2015. “An Effective Method for Snow-Cover Mapping of Dense Coniferous Forests in the Upper Heihe River Basin Using Landsat Operational Land Imager Data.” Remote Sensing 7 (12): 17246–17257. https://doi.org/10.3390/rs71215882.
- Wang, Xianwei, Hongjie Xie, and Tiangang Liang. 2008. “Evaluation of MODIS Snow Cover and Cloud Mask and its Application in Northern Xinjiang, China.” Remote Sensing of Environment 112 (4): 1497–1513. doi:https://doi.org/10.1016/j.rse.2007.05.016.
- Wu, Hongyi, Shunlin Liang, Ling Tong, Tao He, and Yunyue Yu. 2012. “Bidirectional Reflectance for Multiple Snow-Covered Land Types from MISR Products.” IEEE Geoscience and Remote Sensing Letters 9 (5): 994–998. https://doi.org/10.1109/LGRS.2012.2187041.
- Xiao, Pengfeng, Chengxi Li, Luijun Zhu, Xueliang Zhang, Tengyao Ma, and Xuezhi Feng. 2020. “Multitemporal Ensemble Learning for Snow Cover Extraction from High-Spatial-Resolution Images in Mountain Areas.” International Journal of Remote Sensing 41 (5): 1668–1691. doi:https://doi.org/10.1080/01431161.2019.1674458.
- Xie, Gaodi, Changshun Zhang, Linbo Zhang, De Su, Shuyan Cao, Yunfa Leng, and Yu Xiao. 2012. “China's County-Scale Ecological Regionalization.” Journal of Natural Resources 27 (1): 154–162. https://doi.org/10.11849/zrzyxb.2012.01.016.
- Yang, Juntao, Lingmei Jiang, Jiancheng Shi, Shengli Wu, Ruijing Sun, and Hu Yang. 2014. “Monitoring Snow Cover Using Chinese Meteorological Satellite Data Over China.” Remote Sensing of Environment 143: 192–203. doi:https://doi.org/10.1016/j.rse.2013.12.022.
- Yang, Jun, Zhiqing Zhang, Caiying Wei, Feng Lu, and Qiang Guo. 2017. “Introducing the New Generation of Chinese Geostationary Weather Satellites, Fengyun-4.” Bulletin of the American Meteorological Society 98 (8): 1637–1658. https://doi.org/10.1175/BAMS-D-16-0065.1.
- Yogo, Y., Yusuke Ioka, Tomonori Tanikawa, M. Hosaka, Haruma Ishida, and Teruo Aoki. 2019. “Algorithm Theoretical Basis for the Himawari-8, −9/AHI Cryosphere Product Part 1: Snow Cover.” Meteorological Satellite Center Technical Note 64: 1–12.
- Zhang, Tingjun. 2005. “Influence of the Seasonal Snow Cover on the Ground Thermal Regime: An Overview.” Reviews of Geophysics 43 (4): 1–23. https://doi.org/10.1029/2004RG000157.
- Zhang, Peng, Qifeng Lu, Xiuqing Hu, Songyan Gu, Lei Yang, Min Min, Lin Chen, et al. 2019a. “Latest Progress of the Chinese Meteorological Satellite Program and Core Data Processing Technologies.” Advances in Atmospheric Sciences 36 (9): 1027–1045. doi:https://doi.org/10.1007/s00376-019-8215-x.
- Zhang, Hongbo, Fan Zhang, Guoqing Zhang, Tao Che, Wei Yan, Ming Ye, and Ning Ma. 2019b. “Ground-based Evaluation of MODIS Snow Cover Product V6 Across China: Implications for the Selection of NDSI Threshold.” Science of The Total Environment 651: 2712–2726. https://doi.org/10.1016/j.scitotenv.2018.10.128.
- Zheng, Zhaojun, Xiaohua Hao, Xiaofeng Li, Pengfeng Xiao, Lingmei Jiang, Liyun Dai, and Yan Liu. 2021. Historical Data set of Snow Cover in China (2008-2019). National Cryosphere Desert Data Center.