
 ?Mathematical formulae have been encoded as MathML and are displayed in this HTML version using MathJax in order to improve their display. Uncheck the box to turn MathJax off. This feature requires Javascript. Click on a formula to zoom.
ABSTRACT
It is necessary to integrate data and information effectively in order to build an integrated digital and refined urban system. A multi-granularity and multi-view urban heat map formed by integrating multi-source urban information flow can assist in immediate decision-making. Managing urban big data in the form of streams requires a stable operating environment that can efficiently handle millions of sensors and devices connected to the Internet of Things (IoT) in a highly concurrent environment. Urban management data contain spatiotemporal multi-dimensional information that presents the complexity of spatiotemporal dynamic associations, further increasing the difficulty of data streaming. To overcome these challenges, we have proposed a spatiotemporal-pyramid (ST-pyramid) model that organizes multidimensional and dynamic data streams logically using a data partition strategy based on geographical grid subdivision. Accordingly, we have proposed a load-balanced heatmap pyramid computation framework that can be used to build streaming processing procedures in a distributed environment. In addition, we implemented an urban traffic heatmap prototype system based on an open-source Flink framework. The experimental results show that the real-time heatmap pyramid construction algorithm proposed in this paper has high throughput, low latency, and flexible scalability and can provide large-scale public services in time in digital earth construction.
1. Introduction
With the development and promotion of the Internet of Things (IoT) and urbanization, the world’s population is concentrating in urban areas at an unprecedented rate. Research indicates that 70 percent of the world’s population will live in cities by 2050 (Jin et al. Citation2014). Urban management faces significant challenges; traffic congestion, violations, energy consumption, security, and other issues are becoming increasingly serious (Chen et al. Citation2016a).
Urban environments provide rich bodies of information and knowledge. Confronted with an immense volume of urban data streams, effectively integrating this vast amount of streaming information to deliver digital urban services represents a central challenge that urban computing seeks to address (Li et al. Citation2023). However, owing to the lack of effective perception, management, and collaboration, many spaces and challenges remain to be explored. Urban computing aims to use the information contained in physical spaces effectively in order to achieve interactive services between human beings. It includes accessibility (Wu and Zheng Citation2023), traffic flow (Hu et al. Citation2021; Rathore et al. Citation2017), impact on public safety (Rathore et al. Citation2015), urban air quality (Zheng, Liu, and Hsieh Citation2013), public health (McGregor Citation2011), surveillance video streams (Chen et al. Citation2016b), rainfall climate (Lin et al. Citation2020), and street environments (Wang and Vermeulen Citation2020). All of the smart city services aforementioned can be controlled by the streaming analysis of urban data. Urban data are collected by millions of connected devices, sensor services, and intelligent systems on the Internet, generating terabytes of high-speed streaming data (Rathore et al. Citation2018). Utilizing the space-air-ground integrated sensor network to gather spatiotemporal data streams from multiple sources in cities can comprehensively, accurately, and capture the dynamic changes in urban and societal developments in a timely manner (Gong et al. Citation2019). This approach enhances the intelligence and refinement level of urban operations and maintenance, making full use of the available data to improve urban management. Therefore, processing high-speed streaming data in a streaming environment and providing application services that support multi-dimensional urban analysis and auxiliary decision-making are the main challenges in the construction of smart urban systems (Rathore et al. Citation2018).
In regard to urban computing, converging data streams using heat maps can form a multi-dimensional view of a city. In addition, heat map computing based on urban data streams has made outstanding contributions to transportation events, such as anomaly event detection (Shen, Zhao, and Fan Citation2015), hotspot analysis (Meng et al. Citation2023), travel recommendations (Yerva et al. Citation2013), and infrastructure deployment (Gao et al. Citation2023).
Situational awareness is an important part of many critical and dynamic data-driven tasks that provide decision-makers with a deeper understanding of the meaning of urban data. In existing studies, more attention has been paid to the real-time access, storage, analysis, and service of data in smart cities (Amini, Gerostathopoulos, and Prehofer Citation2017; Chen et al. Citation2016b; Kamilaris et al. Citation2017), whereas the real-time expression of large-volume data streams has been ignored. As an important means of expression for large-flow map services, heat maps correspond to urban real-time data streams in data organizations (Xu et al. Citation2022), which is an ideal method of data stream expression. Therefore, it plays an important role in data, information, and trajectory streams (Hu et al. Citation2021; Yu and Sarwat Citation2020). For example, an Intelligent Traffic System (ITS) uses a heatmap to publish real-time traffic monitoring information and monitor traffic congestion (Hu et al. Citation2021). An intelligent and real-time high-speed traffic heatmap monitoring system will help reduce the number of accidents (Chen et al. Citation2016b). A heatmap of social check-ins in New York City can help identify urban hotspots (Yu, Zhang, and Sarwat Citation2018). The real-time push-of-map services are used to assist real-time decision-making in urban development planning (Haferkamp, Ulmer, and Ehmke Citation2023). This allows users to aggregate, analyze, and reason geospatial data, which is of great significance for optimal road planning, hotspot discovery, and also traffic congestion in cities.
Urban daily management data are a typical example of spatiotemporal big data characterized by diverse types, heterogeneity, massive scale, and continuous growth. As with other types of big data, it exhibits the ‘4V’ characteristics: Volume, Variety, Velocity, and Value (Shu Citation2016). However, urban data also have inherent properties, such as spatiotemporal correlation and flow dynamics, which present the complexity of multi-dimensional, semantic, and spatiotemporal dynamic correlations (Li, Yao, and Shao Citation2014). Therefore, addressing the complex relationships of the spatiotemporal dynamic associations of data streams in a stream-processing environment presents another challenge.
Over the years, several models and frameworks have been proposed for processing large volumes of data, among which MapReduce is one of the most popular ones used (Dean and Sanjay Citation2008). However, it is difficult to apply traditional static processing models to continuous computing and management of large-scale urban data streams. Many common big data frameworks have been used for streaming processing, including Apache Spark Streaming, Apache Flink, Apache Storm, and Kafka. Among them, Flink has good scalability compared to other common distributed stream processing frameworks such as Spark Streaming and Storm (Karimov et al. Citation2018). Flink considers everything as a pipeline fault-tolerant data stream and is an ideal real-time data stream processing framework with a higher processing rate and throughput (El Mendili, El Bouzekri El Idrissi, and Hmina Citation2019). This is of great significance for the process of urban data stream computing.
The representation mode of the heat power forms pixel flows through multisource data mapping. In the pyramid aggregation model of multiscale maps, the aggregation at the pixel level and the aggregation logic at the spatial level must be considered. However, the pyramidal tile generation process is computationally intensive. Limited computing resources constrain classical solutions; therefore, considerable time is required to map large-scale urban spatiotemporal data streams (Sarwat and Nandi Citation2017). The generation of large-scale map tiles typically involves static batch processing (Guan et al. Citation2020; Yu, Zhang, and Sarwat Citation2018). Some studies have also indicated that the canopy clustering algorithm can be applied to heatmap visualization using a micro-batch (Perrot et al. Citation2017). Recent studies have focused on using distributed computing frameworks to dock data streams by streaming computing frameworks, such as Flink, and generating map tiles using distributed computing resources (Hu et al. Citation2021). However, the aggregation process of map tiles is extremely time-consuming, and the cluster load may become unbalanced because of data skewness. This introduces challenges in load balancing and also resource management, particularly when computationally intensive tasks are performed in a stream-processing environment.
To summarize, an urban spatiotemporal data stream is characterized by multidimensionality, semantic complexity, and spatiotemporal dynamics. Mapping unbounded spatiotemporal data streams onto map tiles is an important method for large-scale urban public services and monitoring. The main contributions of this study are as follows.
This study has proposed an ST-pyramid model for real-time data streams. This model logically constitutes a data partitioning strategy based on a geographical grid subdivision that effectively supports data stream retrieval and updates in a distributed environment.
A load-balanced distributed heatmap pyramid computation framework has been developed using the spatiotemporal partition strategy and window selection mechanism. A scalable and efficient heatmap pyramid construction algorithm is proposed based on a distributed two-stage tile aggregation strategy.
Based on the open-source Flink framework, this study has realized the convergence and fusion of large-scale spatiotemporal data streams. A real-time urban traffic heat map prototype was implemented.
The remainder of this paper is organized as follows. Section 2 summarizes related work. Section 3 introduces the ST-pyramid model for the real-time data stream and the framework and algorithms of heatmap computation. In Section 4, we evaluate the performance of the real-time heatmap pyramid computing framework and realize a prototype system for an urban traffic heatmap. The final section summarizes the study.
2. Background and literature review
2.1. Data streams and models
Data streams are typically defined as high-rate input data. Depending on the application scenario, the data types in the stream may vary, including discrete signals, event logs, monitoring information, time-series data, and videos. To construct a spatiotemporal data-stream model, we must first discuss the fundamental concepts of spatiotemporal objects. Generally, the objects whose spatial positions or ranges change over time are referred to as spatiotemporal objects, such as flying aircrafts, road vehicles, and human trajectories (Bellini et al. Citation2023). More formally, an input stream can be expressed as a sequence of data elements, that is, . They determine the arriving elements with different timestamps, where each
can be expressed as
, where
represents its timestamp information,
represents its spatial information, and
is the attribute information carried by its elements.
Based on the current research, spatiotemporal data stream modeling can be divided into three stages. First, the smallest Geographic Information System (GIS) unit is defined. Second, a reasonable, accurate, and rigorous expression for spatiotemporal relationships is designed. Third, the model hierarchy architecture is determined (Tang, Ye, and Tang Citation2010). The core idea is to record the state of spatial objects at different events to track changes in spatial information over time. Several Spatio-temporal data models have been proposed. For instance, Armstrong proposed the sequential snapshot model (Armstrong Citation1988), which uses database version control technology to represent an object’s evolution process using a snapshot. To avoid storing constant data in continuous snapshots, Langran and Chrisman proposed a base state with an amendment model (Langran and Chrisman Citation1988) that recorded the difference between the contrast and base states. This modified ground-state model reduces data redundancy. However, updating the current state requires retrieving the base state and recording all the changes, leading to low query efficiency. They also proposed a spatiotemporal composite model (Langran and Chrisman Citation1988) that combines the characteristics of database version control and object version control. By marking version information on the combination of time and space, each space–time complex can store its state separately. However, it remains challenging to determine the relationship between different space and time complexes.
Based on these challenges, the proposed data cube model (Gray et al. Citation1997) effectively addresses the coupling relationship between spatiotemporal units and enables the direct retrieval of spatiotemporal queries through the corresponding subcubes. Worboys proposed an object-oriented spatiotemporal model based on three-dimensional Spatio-temporal features (Worboys, Hearnshaw, and Maguire Citation1990). This model organizes spatiotemporal data based on object-oriented principles and is useful for expressing the state and changes in spatiotemporal objects. Researchers have also explored modeling spatiotemporal objects through events or processes, including the event-based spatiotemporal data model (ESTDM) (Peuquet and Duan Citation1995) and the three-domain model (Nakata and Okada Citation2012). While these models explicitly retain all of the changes in the spatiotemporal information, they also introduce additional overhead into the system.
2.2. Stream processing and infrastructure
The development of a distributed computing framework also provides technical support for the online computing of spatiotemporal data streams. By fully integrating the computing power of multiple computers, distributed computer systems can significantly improve the efficiency of urban data-stream computing. Several large data stream computing systems have been launched in the industry, including Storm, Spark Streaming, Kafka, and Flink. These systems all use Directed Acyclic Graphs (DAGs) to abstract the logic of flow computing operations, where nodes represent data processing activities and edges represent data streams (Yu and Buyya Citation2005). One study compared popular open-source big data processing frameworks in order to promote their use in smart city applications (Magano and Braghetto Citation2018). Research has shown that flow computing systems have similar programming models and data partitioning strategies, but they have the characteristics of state management, message passing guarantee, fault-tolerant recovery, community support, and advanced language support (Isah et al. Citation2019).
With the data stream at the core, Apache Flink provides a large-scale, distributed, and stable flow processing platform, and constructs a distributed big data engine with high performance and availability. Owing to its efficient real-time data-stream processing performance, it has gained significant attention in recent years. For instance, Qadah et al. (Citation2018) combined a probabilistic event pattern prediction model with a distributed online learning protocol and utilized Apache Flink to track the real event flows associated with moving ship trajectories. Kritharakis et al. (Citation2022) leveraged Apache Flink to detect trading trends in financial streaming data. Tan et al. (Citation2021) implemented efficient real-time cardiovascular monitoring in patients with COVID-19 using the Apache Flink data processing framework.
Using a large-scale data-stream computing method for real-time computing can significantly increase the value density of the data streams. Although stream computing frameworks have been widely used for data streams, the aforementioned stream computing systems fall short of meeting the continuous access and computing requirements of multi-dimensional spatio-temporal data streams owing to the lack of support for spatial dimensions. SpatialHadoop (Eldawy and Mokbel Citation2015), SpatialSpark (You, Zhang, and Gruenwald Citation2015), and GeoSpark (Yu, Wu and Sarwat Citation2015) expand the operational ability of spatial data but do not support real-time access and processing of spatial data in a streaming environment. To address this issue, GeoFlink (Shaikh et al. Citation2020) adds spatial data types and spatial operation methods to Flink, thus providing support for the real-time computing of massive spatiotemporal big data.
The message broker and stream processing framework provide unique features for stream analysis applications such as time windows, microbatches, and stream SQL. However, they do not fully address the issues related to interoperability, high-performance computing (HPC) deployment, and resource management. Although the streaming processing framework provides an application-level scheduler, it can still face job bottlenecks when the partitioning keys require resource-intensive processing. Therefore, to fully utilize distributed server computing resources, it is essential to investigate highly parallelized operators and load-balanced streaming processing schemes.
2.3. Construction of tile pyramid
The Tile Pyramid is a multi-resolution hierarchical model similar to the Levels of Details (LoD) concept. The basic concept is to combine the adaptive optimization scheme of the multi-resolution pyramid with the ‘partition strategy’ of the pyramid hierarchical model to enhance data access efficiency (Hu et al. Citation2021).
Maptile technology has proven to be useful for achieving seamless browsing between different-resolution data. Several industries in the geographic information service sector have adopted map tiles to accelerate the processing of spatial map data, thereby providing convenient map services to customers. Notable examples are ArcGIS, MapGIS, AMAP, Google Earth, and Baidu.
The construction of a map Tile Pyramid has been widely applied in remote-sensing image processing. Guo et al. (Citation2016) integrated a parallel block-pyramid generation method for large-scale geospatial raster data into a high-performance GIS platform. Hemayed, Farghal, and Shaheen (Citation2010) used pyramid tile technology to store and retrieve remote-sensing images. However, the generation of pyramid tiles can be computationally intensive and time consuming, particularly for massive, multi-source, and multi-resolution image data. Therefore, there is a need for higher throughput and computational efficiency when constructing pyramid tiles, which requires the adoption of high-performance processing methods. With the development of parallel-computing technologies, various high-performance processing frameworks have been developed. Liu et al. (Citation2013) proposed a method for the parallel construction of Tile Pyramids of batch remote-sensing images using MapReduce. Similarly, Yang et al. (Citation2017) constructed a massive remote sensing image pyramid model using a Spark framework. To further enhance efficiency, some previous studies have optimized the pyramid construction strategies. For instance, Liu et al. (Citation2020) proposed a fast Tile Pyramid construction algorithm based on multilayer task parallelism. Guo et al. (Citation2016) constructed pyramid tiles using an adaptive tile-aggregation method. Choosing an appropriate pyramid construction strategy can significantly improve computational efficiency in a distributed environment. Moreover, local incremental computing can reduce the data latency in the stream construction process and minimize the consumption of computing resources caused by data redundancy.
This method utilizes the benefits of a distributed system to enhance the efficiency of Tile Pyramid generation. However, the framework employed was a static batch aggregation of map tiles. With urban daily management data demonstrating ‘streaming’ transmission and dynamic updating characteristics, it poses significant challenges in regard to constructing multi-level slices in a massive map tile cache in terms of efficiency.
3. Methodology
Unlike the organization of static spatiotemporal data, spatiotemporal data streams are represented as a sequence of moving objects that are continuously and dynamically updated over time. Therefore, streaming processing places greater emphasis on the efficiency and speed of data updates as opposed to simply organizing static data.
3.1. Heatmap pyramid computation framework
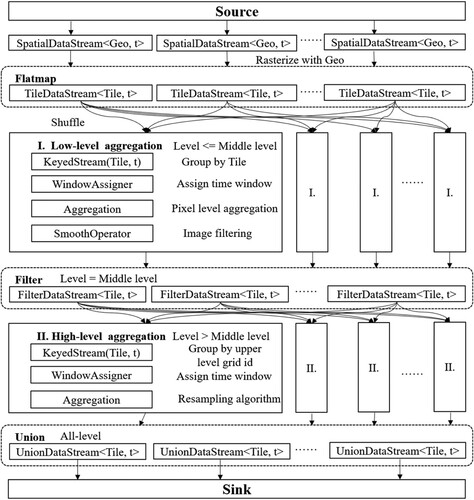
Heatmap pyramid computing is designed to efficiently process and hierarchically visualize large-scale spatiotemporal data. This approach allows scalable data aggregation and analysis at different resolutions, enabling quick insights into patterns and trends within large datasets. As shown in and Algorithm 1, to effectively manage large-scale real-time data streams, it is necessary to first construct a partitioning organizational model (ST-pyramid model) in order to partition the spatiotemporal data streams, and based on this, build a multi-resolution aggregation scheme on top of it. Second, the computation of the data-stream heatmap mainly involves four processes: rasterization, pixel aggregation, pyramid construction, and rendering. The core of the process lies in the management of states and the parallel computing of data stream processing.
Figure 1. Heatmap computation workflow.
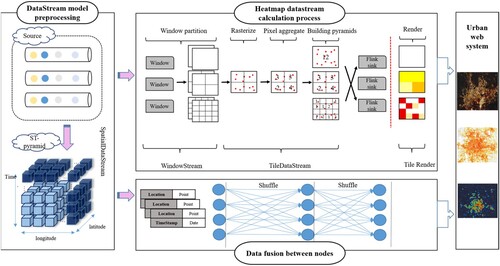
Stage 1: Rasterization. The rasterization operation works on the spatial objects in the data stream, with the goal of mapping the data stream to the corresponding tile pixels. In this study, the transformation of tile and pixel coordinates between the WGS1984 geographic coordinate system and the Web Mercator projection coordinate system was realized using Equation (1), where is the spatial level:
(1)
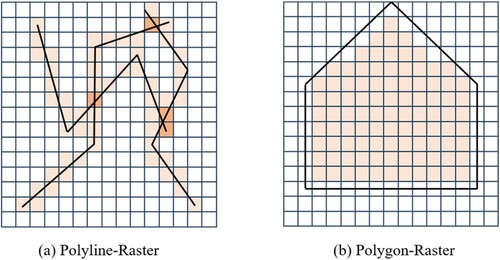
(1) When handling data streams containing linear or areal features, the same rasterization technique can also be employed in order to convert them into pixel coordinates. For linear features, such as those depicted in (a), we first extract the vertices of the polyline and then apply the renowned Bresenham line algorithm to determine an approximate pixel trajectory that closely follows the line. The core principle of the algorithm involves determining the direction of the increments by comparing the changes along the X- and Y-axes from the X position of the starting vertex to the X position of the ending vertex. Regarding areal features, as illustrated in (b), we aimed to mark all of the pixels covering the polygonal region. For each polygon in the dataset, we began by converting all vertices into pixels, and then proceeded to identify the pixels situated within the rasterized polygon boundaries.
Figure 2. Rasterization of vector objects to pixels.
Stage 2: Pixel Aggregation. As space–time objects inherently overlap and intersect with each other, they exhibit spatial proximity characteristics. Therefore, we aggregated the spatiotemporal data stream within the pixels and combined the weights of the overlapping pixels to determine the final weight of each pixel.
This was also the first aggregation at the pixel level during the Tile Pyramid construction. We provide five aggregation strategies for the pixel aggregation operator: 1. Maximum; 2. Minimum; 3. Average; 4. Sum; 5. Count. The count strategy can describe the spatial distribution of the spatiotemporal data stream, whereas other strategies can show the spatial distribution of the attribute information carried by the data stream, thus providing multi-semantic thermal analysis, such as the speed and fare of a trajectory data stream.
Stage 3: Pyramid Construction. The Rasterization and Pixel Aggregation operations are aimed at mapping the heatmap onto a two-dimensional plane. However, to accommodate the multiscale representation of the data stream, it is necessary to divide the heatmap tiles using tile-cutting technology to form a pyramid structure in the vertical space. Pyramid construction constitutes the second aggregation step in heatmap computation. The underlying concept is to generate a sequence of map-tile sets with varying spatial resolutions based on a map tile. The tile-pyramid model employs a quadtree structure in space.
Stage 4: Rendering. By constructing a Tile Pyramid, the weight of each pixel is determined by the tile to which it belongs, and the coloring operation can render each pixel to an RGB image based on its weight value. The relationship between color and weight is usually defined by mathematical equations such as linear or piecewise color functions.
3.2. ST-pyramid for spatial streaming modeling
3.2.1. ST-pyramid model
Data cube was first proposed by (Gray et al. Citation1997) as a multi-dimensional data model to organize and manage multi-dimensional data sets. It offers several multi-dimensional analysis operations at the cube level, such as Roll-up, Dice, Slice, Drill-down, and Pivot.
A spatiotemporal cube is a three-dimensional geometric structure of the data cube that enables the representation of spatiotemporal data. As early as 1970, Hägerstrand proposed using cubes to organize data (Hägerstrand Citation1970). The space–time cube model leverages the geometric properties of the time dimension, representing spatial entities as space–time bodies that facilitate simpler and more intuitive descriptions of the geographic changes. Moreover, we partitioned the data stream and focused on the state of spatiotemporal objects under window semantics. Our aim was to utilize various granularities of data units as streaming data partitioning strategies that are directly applied to load balancing in distributed environments.
To manage large-scale real-time data streams in geographic space, it is necessary to discretize both the time and spatial domains and also partition the axis boundaries through regular mapping. In this context, we propose an ST-pyramid model, as illustrated in . The bottom-layer is a data-partitioning scheme based on spatiotemporal cubes. Unique cube units can be assigned by ingesting real-time data streams and segmenting them into time windows. This model forms a multilevel pyramid structure spatially, with
representing the hierarchical views of the data. Here,
denotes the highest spatial resolution level utilizing a spatiotemporal cube partitioning scheme, with the overall spatial resolution decreasing from
to
. Each layer represents the aggregation effect of a spatiotemporal unit, creating a model with a multiresolution representation of space and time.
Figure 3. ST-pyramid model for data streaming modeling.
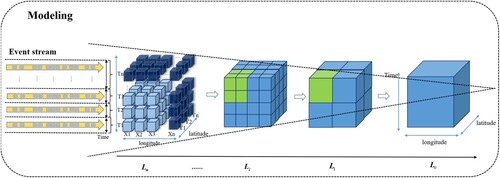
We took into account the spatial–temporal heterogeneity characteristics of urban data streams. The model uses a globally unified mesh to spatially divide the data, with each mesh unit encoded using GeoHash. For the time dimension, time Bin is used to divide the time dimension. Furthermore, by aggregating the dimensions, the ST-pyramid model can form an LoD model in which data stream objects can be expressed in different granularities. This approach is effective in handling dynamic and heterogeneous urban data streams.
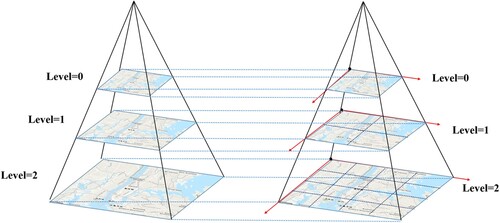
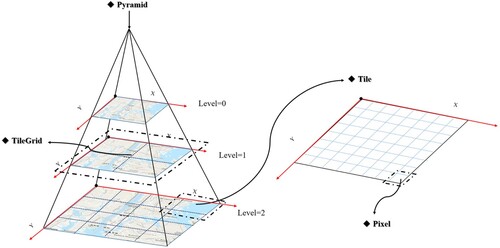
In addition, similar to the Tile Pyramid model, the ST-pyramid model constructs a vertical spatiotemporal data stream hierarchy at the spatial partitioning level. The Tile Pyramid is a multi-resolution hierarchical model that can support the multi-granularity expression of spatiotemporal data, including image data (Xia and Yang Citation2012), as shown in . The bottom layer of the pyramid represents the map level with the highest spatial resolution, corresponding to the smallest cube in the spatial dimensions of the ST-pyramid model. Each tile in the Tile Pyramid is represented by 256 × 256 pixels. We can calculate the tile size and total number of tiles in pixels by continuously and recursively subdividing in space level n using Equation (2): At spatial level n, the ratio of map tiles in one direction to the initial map-level tiles is , and the ratio of the total number of map tiles to the initial map-level tiles is
.
(2)
(2) In order to ensure unique identification of tile objects, a spatial coordinate system must be specified for the geospatial model. In this study, we adopted a globally unified subdivision framework and transformed the spherical coordinates into two-dimensional plane coordinates using the Web Mercator projection (Battersby et al. Citation2014).
Figure 4. Tile Pyramid slicing and construction.
The ST-pyramid model is a hierarchical structure with a multigranularity relationship consisting of multilayered logical objects in space and a membership relationship among these logical objects. In this study, we defined the Pixel, Tile, TileGrid, and Pyramid logical objects for the pyramid modeling, as illustrated in .
Pixel: The pixel is the smallest construction unit in the Tile Pyramid model. A pixel can be understood as one of the finest-grained cubes and can be expressed by Equation (3): It has three dimensions: time (time sequence
), space (including pyramid-level tile coordinates (
Tile: The tile is the basic unit of the pyramid model, corresponding to the map tiles, represented by a total 256×256 Pixel combinations defined by the unit time
TileGrid: The TileGrid object is a collection of all map tiles representing the current map range at a certain spatial level and is used to organize different granularity expression models, as shown in Equation (5). It is composed primarily of the time sequence
Pyramid: A multiscale spatial pyramid is formed in the unit time bin
Figure 5. ST-pyramid logical object association.
However, the partitioning strategy discussed thus far neglects the spatiotemporal differentiation characteristics of the data streams, which may not be uniformly distributed across the spatiotemporal range. The nonuniform distribution of data streams in time and space can lead to data skew in a distributed environment, resulting in varying degrees of sparsity in the ST-pyramid model and load imbalance in the distributed cluster. It is evident that the use of the ST-pyramid model and tile mapping pyramid to manage data streams still poses certain limitations and challenges.
3.2.2. Window division
The ST-pyramid model serves as a logical partitioning framework that can partition large-scale data streams while satisfying efficient indexing and updating of such data streams. Using the ST-pyramid model to partition the data stream, massive data streams can be managed in the form of cubes during stream processing. By allocating data to these cubes, computation load balancing can be achieved in a distributed environment.
Time is a crucial factor in flow computing when compared to the processing of static datasets. Therefore, when dealing with continuously growing infinite spatiotemporal data streams, windowing is utilized to partition the data stream into defined windows, allowing for aggregation analysis of data tuples within these windows.
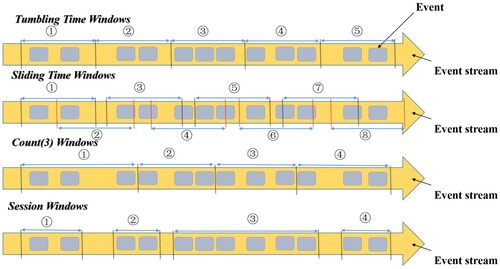
The window is divided into windows based on time, count, and session interval (see ). Both the tumbling and sliding time windows depend on the time step. A tumbling window combines data within a fixed time interval, aligns with time, and has a fixed window length without overlapping windows. A sliding window, on the other hand, slides over the data with a fixed time interval. When compared with tumbling windows, sliding windows add a sliding interval setting, allowing the data to slide within a fixed window at a certain interval. A count window is a window type based on the number of elements independent of time. A session window is created when there is a gap in the continuous data arrival. If no new data arrive within a period, the current session window is closed, and a new session window begins when new data arrive.
Figure 6. Window partition type.
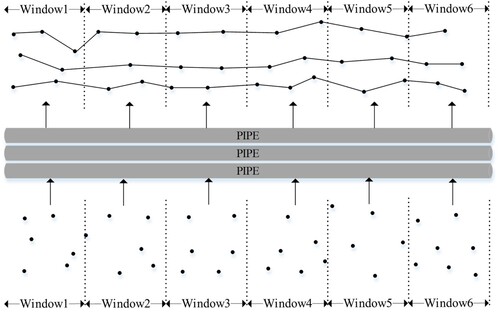
Window is the core of infinite data stream processing. The window splits an infinite data stream into finite size ‘buckets.’ Thus, we can perform computing and analysis on these ‘buckets.’ Distributed stream processing uses an operator to abstract data processing logic based on the window partitioning. The data stream flows along the pipe connected by the operator, from the upstream operator to the downstream operator, and expresses the processing of the data stream in the form of a flow to form a Directed Acyclic Graph (DAG) data stream graph to abstract the logic of stream computing operations.
Generally, the concept of an unbounded data stream refers to an infinite extension of the time dimension. However, in this study, we define unbounded spatial data as data with unbounded spatial attributes, which means that each record in the data represents a geometric object in space. To support the processing and analysis of such data, we introduce a Spatial DataStream API layer built on top of the Flink DataStream API, which includes operators that handle spatial data. In addition, we modeled mobile spatial objects in urban data streams based on location point data to create an identified mobile object data stream, as illustrated in .
Figure 7. Modeling moving objects.
3.2.3. Load balancing
Owing to the uneven distribution of data streams in time and space, the distributed environment may encounter data skewness, resulting in varying degrees of sparsity in the ST-pyramid model. Thus, developing a load-balanced heatmap aggregation strategy for the sparse ST-pyramid model is a key factor for improving the performance. First, the data stream was divided into Pixels in the ST-pyramid model and poled to multiple nodes on the server, ensuring an even distribution across the cluster. When the data stream is rasterized, it has a one-to-one mapping relationship, and there is no difference between the different data streams. Consequently, in the pixel aggregation operation, global load balancing of data stream aggregation and fusion is achieved.
In addition, to prevent the ST-pyramid model from allocating unnecessary memory during operations, we utilized a sparse matrix to organize the tile objects, thereby reducing the memory burden when constructing the ST-pyramid model. Furthermore, all Pixel objects are associated with their corresponding tile objects, which are used as data units for logical partitioning during the tile pyramid building process. However, due to the uneven spatial and temporal distribution of data streams, data skew can result in hot ‘Tiles,’ increasing the computational load on these servers. To address this load imbalance, a granular approach can be used to reduce the disparity in the distribution between time and space. For instance, during the construction of an initial tile pyramid layer, the smallest-resolution dimension division method can be employed. This way, when a hotspot ‘Tile’ appears, it can be split into multiple hotspots ‘subTiles’ for load migration and balancing.
3.3. Window-based incremental state processing
Topic-computing methods can be divided into full and incremental methods. Incremental computing can effectively reduce the data processing time and cost at the expense of additional storage space required to store intermediate results. Compared with the batch computation schemes represented by Spark, which require obtaining the entire dataset before triggering computation operations, incremental computation schemes based on window mechanisms can maintain a state variable at the backend and dynamically update the state variable for each input data stream. Hence, when the last data stream within the window is accessed, computational results can be obtained immediately.
In the proposed model, incremental computation was employed to update the tile pixels. Consequently, within each parallelism of the operator, multiple keyed states exist, each preserving the state information partitioned by tiles. The state mechanism permits partitioning of states across different TaskManager instances. To strike a balance between processing time and storage space, various state backends can be added to manage the states. Flink provides three-state backend mechanisms to manage the state information of different scales. By default, it is a memory level suitable for scenarios with small amounts of task state data. When the number of states is large, they can persist in the file system or database with the number of states limited only by the local disk capacity. This effectively prevents a situation in which the number of states explodes owing to the continuous running of Flink tasks and insufficient memory. However, the backend mechanism for persisting states requires more processing time because of persistent state storage, which requires more IO operations to read state information and update states. Therefore, these schemes are more suitable for tasks with large states, long windows, and large keys and value states.
Table
Unlike stateless computing, Flink is a stateful computing service for stream processing. As new data streams flow, stateful operator tasks read and update the state. As efficient state access is crucial for processing low-latency data, each parallel task maintains its local state to ensure timely state access.
Each stream corresponds to a pixel object. For heat map pixel aggregation, Algorithm 2 was employed using an incremental computing approach to calculate the heat value for each pixel in the tile. First, a map tile state is defined for each tile and used to store the intermediate aggregation results for each pixel in the tile. The pixel is converted into a key-value pair, HashMap, by combining the tile ID (Z, X, Y) with the key via a grouping operation. The key corresponds to the pixel ID (x, y) and the value represents the current weight of the pixel. When traversing pixels, if a pixel already exists in HashMap, then the aggregation strategy is used to update the weight stored in the HashMap. The final state of the tile pyramid model logic object can be obtained directly when the data aggregation of the defined window range is completed.
(7)
(7) The trigger for a window is defined as when the window is triggered and when the trigger behavior is determined (clearing or calculating the window). Therefore, we provide an optional trigger in the window of the pixel aggregation operator called the image filter. Gaussian Blur (Ward et al. Citation2008) is widely used in geospatial visual analysis because it can reduce image noise and detail, as shown in Equation (7). It uses a Gaussian distribution to compute the transformation of each pixel in an image. Here,
represents the blur radius and
is the standard deviation of the Gaussian distribution. In a two-dimensional space, the contour lines of the surface generated by this formula form concentric circles, exhibiting a Gaussian distribution starting from the center. The value of each pixel is the weighted average of the values of the surrounding adjacent pixels. In the convolution matrix, the value of the original pixel has the largest Gaussian distribution and weight, and the weight of the adjacent pixel becomes increasingly smaller as it moves farther away from the original pixel, which is in line with Tobler’s First Law of Geography (Tobler Citation1970). depicts the convolution matrix of Gaussian Blur.
Figure 8. Gaussian Blur matrix.
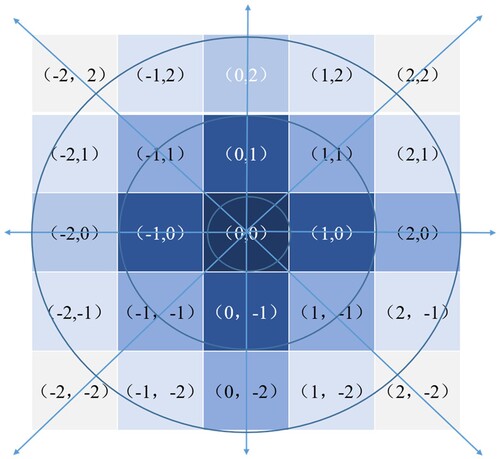
When the watermark of the time window is reached, the Gaussian Blur operator scans the pixel space of the current tile and convolves each pixel, resulting in an output of the map tile after blur processing.
3.4. Heatmap pyramid construction algorithm
This section describes the heatmap pyramid computation framework using the data-stream ST-pyramid model. We divide the window of large-scale spatiotemporal data streams to realize multisource aggregation computing and propose a scalable and efficient heatmap pyramid construction algorithm.
By representing a data stream in the ST-pyramid model, each data stream can be matched with its corresponding logical objects in the tile-pyramid model, thereby forming a logical data partition. To convert vector data into a format that can be used by the pyramid tile map service, we must encapsulate the conversion logic from SpatialDataStream to TileDataStream, where TileDataStream serves as a data stream carrier with the Tile Pyramid logical objects. Building upon this foundation, we must consider how to transform TileDataStream into a pyramid model with a multi-resolution structure.
Two-level Distributed aggregation: The generation of pyramid tiles is computationally intensive, particularly when dealing with massive, multi-source, and multi-resolution data streams. This can result in a standalone bottleneck. In order to address this issue, we have proposed a two-level aggregation algorithm based on the ST-pyramid model and leverage the advantages of distributed computing to improve processing efficiency. The resulting set of load-balanced real-time heatmap pyramid construction algorithms is shown in Algorithm 3 and .
Figure 9. Dataflow of two-level aggregation processing.
The first stage in building a heatmap pyramid involves aggregating the data streams into pixels. Real-time data streams are evenly distributed across multiple server nodes in the cluster. Because the rasterization of the data stream results in a one-to-one mapping relationship, there is no difference between the different data streams. Therefore, during pixel aggregation, global load balancing of data stream convergence and fusion can be achieved.
The second stage of building a thermal pyramid involves the aggregation of pixels to form a multigranularity pyramid spatial model based on the first-stage aggregation. Optimizing the pyramid construction strategy can effectively improve the efficiency of pyramid generation, and its core lies in extending current resolution tiles to multi-resolution map tiles.
Table
In this study, we have proposed a scalable pyramid tile-efficient aggregation algorithm with any level of the pyramid as the initial resolution layer, denoted as .
Low-level tile generation method
For the low-level tiles in the pyramid, a quadtree structure is formed in the pyramid space. In the grid operation in Equation (1), the tile and pixel coordinates of the current data stream between the layers greater than are calculated by changing the parameter level. In fact, in the generation logic of low-level tiles, because the generation of low-level tiles does not depend on the initial layer, it can be pushed to the first-level aggregation of the thermal pyramid to realize the global incremental construction of the pyramid’s two-level aggregation. This process also involved load balancing.
High-level tile generation method
We use the resampling algorithm for the pyramid’s high-level tiles to complete the upward aggregation. The basic idea is: based on the tile data of level , we resample to generate the tile data of level
to level 0 layer by layer. Specific sampling method, when generating
level tile data, using
level tile data as a sampling source. In
tile data, every four adjacent tiles as a unit is a tile set. The quadtree index realizes the aggregation operation in each tile set to generate higher-level tiles.
Due to the adoption of any level as the initial resolution level in our pyramid aggregation model, the time complexity of the model would be composed of two parts: Low-level tile generation and High-level tile generation. Assuming window partitioning, the current window receives a total of
data streams, while the desired number of pyramid levels is determined by
(In the WMTS service standard, the resolution of map tiles at level 20 can range from several meters to tens of meters, fully covering applications such as urban road networks). Additionally, we can define the pixel size of tiles as
(typically representing 256×256 pixels). Therefore, the time complexity of the pyramid aggregation model can be determined by Equation (8). The complexity of the model mainly consists of two parts. The first part involves the construction of
lower-level tiles, which can be achieved using flatmap operations, thus depending on the total data flow within the window. The second part involves the construction of
upper-level tiles, thus depending on the height of the pyramid and the pixel size of the map tiles, which is a constant-level parameter. The overall algorithmic complexity is approximately represented by
.
(8)
(8) This aforementioned complexity represents the theoretical time complexity of the model. However, the proposed framework is applied in a distributed environment, allowing certain steps of the algorithm to be executed in parallel, thereby reducing the time complexity of the algorithm. In the Low-level tile generation of the algorithm, the pixel mapping process for the trajectory points is parallelizable, whereas in the high-level tile generation, the higher-level tiles depend on data resampling from the lower-level tiles, and require task distribution only after data alignment. Therefore, in a distributed environment, if the logical execution core count (i.e. parallelism) is n, then the time complexity can be reduced to
. It is important to note that during high-level tile generation, the process of resampling higher-level tiles involves reorganizing the data from lower-level tiles. This results in shuffling of the tile data across multiple computing nodes and triggers additional IO operations. Therefore, the actual model complexity should be
, where
represents the overhead of shuffling tiles in a local area network at a constant level.
We used the overall computational complexity of the pyramid construction as the optimization objective to determine the optimal aggregation level in the algorithm. We used as the aggregation height of the pyramid. First, the computation of the low-level tile generation process involves the rasterization conversion of the real-time data stream. The flops in Equation (1) are defined as
. In the process of high-level tile generation, the amount of computation is the resampling step, and the flops of resampling aggregation are
(In fact, in this resampling algorithm, Agg is the operation of indexing the upper tiles and performing pixel aggregation). Consequently, a Tile Pyramid can be constructed from the
level, and the flops of the lower and upper levels can be seen in Equation (9).
(9)
(9) The optimization objective function is as shown in Equation (10):
(10)
(10) After determining the extreme value of the objective function
, the optimal initial aggregation level can be obtained using Equation (11).
(11)
(11) The analysis of Equation (11) shows that Total is determined by the business of the data stream. Therefore, we can analyze it from two situations:
| a. |
| ||||
| b. |
| ||||
monotonically decreases in
, and
will be the optimal aggregation level.
This study has deduced the overall computational cost of the pyramid construction as an optimization goal. Of course, in a real production environment, this also includes a data shuffle between clusters, which becomes the key factor affecting pyramid construction.
4. Experiments and discussions
4.1. System architecture
To evaluate the feasibility and efficiency of data-stream-based heatmap pyramid computation, this study deploys a heatmap construction algorithm in a distributed manner using the Flink stream processing framework. However, the full-stack data stream processing must also consider the lifecycle of the data stream. Therefore, we utilized the framework depicted in in order to construct a prototype system.
Figure 10. The system architecture of data stream processing.
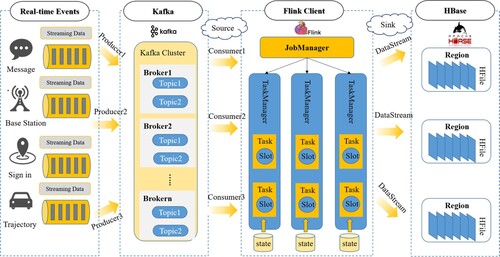
To connect the multisource data streams generated by the urban activities in real time, the Kafka framework was used to organize the multisource information flow and simulate urban data streams in a real-time production environment. Kafka is a message-queue model that supports topic message production and consumption. Using a Kafka Producer, multiple heterogeneous data streams can be unified into the message queue of the current producer. In the Flink stream processing framework, the Kafka producer can be used as a data source for obtaining real-time information by registering the consumer under the corresponding Kafka topic.
The Flink is an essential component in implementing the algorithm. The data stream is organized and modeled using the ST-pyramid model to form SpatialDataStream. After the rasterization operation, SpatialDataStream uses the map tile ID as the key and is grouped by the Keyby operator to form TileDataStream. This completes the first-level aggregation of heat flow calculations.
Second-level aggregation aims to form a multigranularity pyramid spatial model based on the first-level aggregation. The lower tiles in the pyramid can be constructed in parallel using the FlatMap operation. In order to build the TileDataStream of the upper tiles, it is necessary to involve a shuffle operation between the hierarchical tile data because the processing results of the tile data are distributed across multiple server nodes. Flink’s JobManager operates multiple task managers in a cluster for parallel processing. Each task manager had a certain number of Task Slots, which were the smallest units for resource scheduling. By decomposing the heatmap pyramid tile-construction algorithm into multiple operators and managing them in parallel using TaskManager in the Flink cluster, we can leverage the advantages of distributed computing fully to improve the computational efficiency of the algorithm.
Finally, the Flink flow computing results are stored in the NoSQL database HBase.
4.2. Environment and dataset description
Because our primary objective was to achieve efficient and real-time convergence and fusion of urban big data, we assessed the performance of our algorithm in terms of data processing time and throughput. We compared the performances of various pyramid construction strategies on real-world datasets and evaluated the scalability of the algorithm during task execution.
We built a prototype system on a cluster composed of three nodes and ran Hadoop 2.7.7, HBase 1.4.13, Flink 1.12.0, and Kafka 2.6.0 environments on JDK 1.8. Each node had the Ubuntu 20.04 LTS operating system installed, allocated 64 GB of memory and eight logical CPU cores. The experiment used the January 2009 yellow taxi manifest data from New York City as the experimental dataset, which was provided by the New York Taxi and Luxury Car Commission (TLC). We preprocessed the dataset to ensure data quality and effectiveness and finally obtained a total of 14092413 taxi records, as shown in .
Table 1. New York trajectory fields.
4.3. Experimental setup and data processing evaluation
4.3.1. Experimental setup
The efficiency and scalability of supporting the generation of a large-scale urban heat map must be determined, as it has important practical significance for urban information flow control.
Owing to the lack of open-source dynamic heatmap construction frameworks in existing research, we investigated the algorithmic logic used to construct heatmap pyramids in existing studies. In previous research, algorithms for constructing tile pyramids were mainly divided into two types. The first method generated multilayer tiles in parallel with the entire tile pyramid (Liu et al. Citation2020), whereas the second method produced map tiles step-by-step through tile resampling (Guan et al. Citation2020; Perrot et al. Citation2017). For ease of reference and as a comparative reference experiment with existing construction algorithms, we refer to the first construction strategy as Top Pyramid Tile Construction (TPTC) and the second construction strategy as Low Pyramid Tile Construction (LPTC). Additionally, our method of upward aggregation and downward mapping based on intermediate-resolution layers is called Middle Pyramid Tile Construction (MPTC).
In the construction process of the heatmap tile pyramid model, multiple system-level parameters are involved and made available to users to achieve highly flexible map tile construction solutions. Herein, we have summarized the rationale for setting the parameters within the system. First, the height of the pyramid was considered, typically set between levels 12 and 18, covering a spatial resolution range that satisfied the majority of the application requirements. However, users have the flexibility to adjust their height range to create map tiles with higher resolutions, if necessary. In alignment with the standard tile size used in Internet map tiles, all map tiles in the algorithm were sized at 256×256 pixels. Furthermore, to balance the advantages of the different pyramid construction approaches, this study recommends setting the initial aggregation level to 15.
Furthermore, regarding window selection, this study provides multiple options, including tumbling time, sliding time, count, and session windows. Among these, Tumbling and Sliding time windows are commonly used, with the window size determined by the time granularity of interest to the user and the sampling frequency of the data source. In the experiments conducted in this study, tumbling time windows were used as the window type. Additionally, achieving a certain level of aggregation effect through the window size is crucial; otherwise, it would be meaningless. However, count and session windows focus more on the number within the window and the intervals between the data inputs. Such windows are provided in the system to satisfy various business scenario requirements.
The construction of tile pyramids is typically intended for static datasets (Guan et al. Citation2020; Yang et al. Citation2017; Yu, Zhang, and Sarwat Citation2018), and a high-performance construction solution is required for stream processing. Therefore, we designed two experiments on the distributed clusters. Globally, we defined the spatial mapping level of map tiles ranging from 12 to 18 and set the initial spatial level of MPTC to 15 in the experiment. We have proposed a scalable heatmap pyramid construction algorithm that is flexible and adaptable. In this experiment, we selected three typical aggregation schemes as link operators to compare their performances on the dataset.
4.3.2. Data processing evaluation
In the first series of experiments, we partitioned the dataset into a range of 1,000,000 to 14,000,000 items. We configured the time window size of Flink to 30 s to fit the dataset density and also set the number of Task Slots to four (providing a certain degree of parallelism). To evaluate the efficiency of the algorithm under data pressure, we did not set a time interval between data items when producing data for Kafka Producer. We compared the efficiency of three construction methods in the experiment, namely, Top Pyramid Tile Construction (TPTC) and Low Pyramid Tile Construction (LPTC). Additionally, our method of upward aggregation and downward mapping based on intermediate-resolution layers is called Middle Pyramid Tile Construction (MPTC).
shows the processing efficiencies of the three pyramid aggregation strategies studied on datasets of different sizes. The experimental results indicate that LPTC exhibits a higher processing efficiency, with an average computational speed of 15.28 s per million, followed by MPTC, with an average processing speed of 30.72 s per million, whereas TPTC takes the longest time, with a processing speed of 43.13 s per million.
Figure 11. Runtime ratio for the different data volumes.
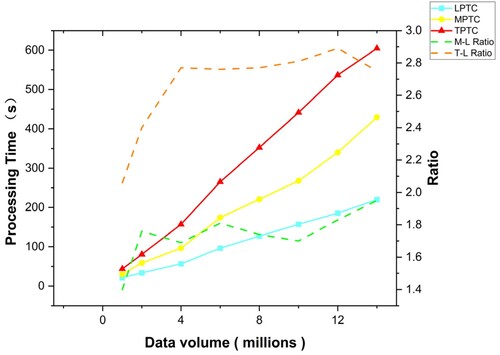
Moreover, the running time of the three aggregation strategies has a linear relationship with the amount of data, indicating that the efficiency of the pyramid construction for real-time data streams is not affected by an increase in the data volume. The dashed line in the graph represents the time consumption ratio between the different construction strategies. The M-L ratio shows the time-consumption ratio of MPTC compared to the fastest LPTC method, whereas the T-L ratio shows the time-consumption ratio of TPTC compared to LPTC. The experimental results revealed that, when the data volume was small, the M-L and T-L ratios increased in data volume. However, when the dataset was expanded to a certain scale, the M-L Ratio stabilized at 1.8, and the T-L Ratio stabilized at 2.8.
In another set of experiments, the entire dataset was used in order to investigate the throughput and data latency of the three construction strategies. We chose a 30-second event time window, and the number of Task Slots ranged from one to 24. illustrates the relationship between the throughput and processing time of the three strategies in different parallel environments. The bar chart represents the processing time of the three algorithms and the line chart represents the throughput per second.
Figure 12. Throughput for different parallelism.
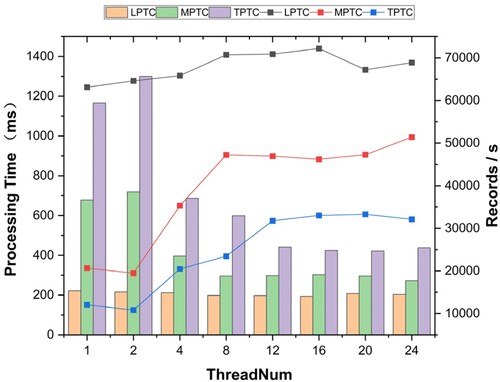
As the parallelism increases, the operation can be accelerated, and the throughputs of LPTC, MPTC, and TPTC increase to varying degrees. However, the results have shown that, when compared to the MPTC and TPTC schemes, LPTC has a minimal improvement in throughput efficiency with an increase in parallelism. This is because the LPTC adopts a resampling strategy when generating higher-level map tiles. With an increase in parallelism, the aggregation operator of the upper map tiles must perform data shuffling from more nodes. This becomes more evident when the data processing efficiency reaches its bottleneck. When compared to LPTC, the MPTC and TPTC schemes improve the processing efficiency with an increase in parallelism; however, this is still significantly lower than the throughput of the LPTC scheme. Moreover, the relationships among the three schemes are not linear. Owing to the consumption of distributed task scheduling, the processing efficiency does not increase when task parallelism reaches a certain extent. The throughputs of LPTC, MPTC, and TPTC are approximately 70, 000, 50, 000, and 30, 000, respectively.
To ensure that the simulation program and Kafka did not become performance bottlenecks, we attempted to minimize the impact of the input on the test results. Therefore, in the throughput test, in order to evaluate the throughput of the algorithm under data pressure, this study does not set the time interval between data items when producing data for Kafka Producer. In the process of the delay experiment design, we paid more attention to the inherent delay caused by the different pyramid aggregation algorithms. To avoid any data delay caused by Flink back pressure, Kafka takes data at a check-in rate of 10 checkin/millisecond to reduce the data delay caused by the data staying in Kafka. In the experiment for evaluating data delay, we configured the time window size of Flink to 30 s and set the number of task managers to four.
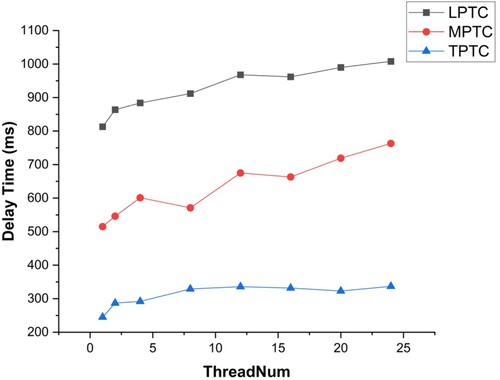
illustrates the data delay of LPTC, MPTC, and TPTC in flow processing. TPTC exhibited the lowest data delay in data stream computing, with a minimum of 252 ms/record, followed by MPTC, with a minimum of 504 ms/record, whereas LPTC incurred a relatively high delay, with a minimum of 834 ms/record. This is because LPTC adopts a two-stage aggregation logic for constructing higher pyramid tiles, which relies on the Flink Watermark to trigger the resampling operation, leading to a certain data lag. By contrast, TPTC uses global mapping to construct the pyramid; therefore, map tiles are generated immediately after the watermark is triggered under the incremental processing model. MPTC considers both LPTC and TPTC strategies, and its performance falls between. Additionally, increasing the parallelism of the three aggregation strategies resulted in an increase in the data delay to some extent. This was because, without computing pressure at the Flink job end, increasing the number of data nodes increases the shuffle operation of the data and contributes to an increased delay. However, if Flink experiences data pressure for continuous operation in a production environment, increasing the parallelism will mitigate the data latency.
Figure 13. Delay for Different parallelism.
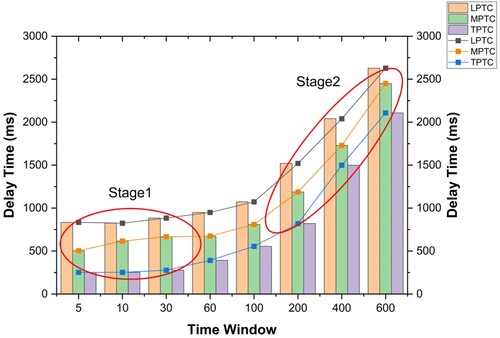
As the time window has a positive impact on data delay, we conducted additional experiments to investigate the impact of the time window on data delay. shows the data latencies of LPTC, MPTC, and TPTC under various time windows during stream processing. The results indicate that as the time window increased, the data delay of all three strategies also increased, with LPTC having the highest delay and TPTC having the lowest. Note that the stream processing delay includes both the computing delay of the data and the waiting delay in the window. In smaller time windows (Stage 1), the waiting delay is not a major component of the delay because of the data processing delay. Thus, the overall data delay changes only slightly. The average delay in LPTC was found to be 825 ms per record, in MPTC was 260 ms per record, and in TPTC was 825 ms per record. However, when the window size increased (Stage 2), the data delay was mainly influenced by the waiting time of the window. If the data stream is evenly distributed in each time window, the delay increases linearly.
Figure 14. Delay for the time window.
4.4. Discussion
To comprehensively evaluate the existing heatmap pyramid construction algorithms, we conducted systematic experiments in order to measure their performance in managing streaming data from multiple aspects. One such algorithm, which employs the TPTC concept as its core, is based on the parallel construction of a multilevel network using multilevel tasks. By mapping the data stream into multilevel map slices, the TPTC method achieves global load balancing for both data and computing. However, a drawback of TPTC is its high data redundancy. To generate each level of the map network, the spatiotemporal information of the original data stream is parsed for rasterization, which therefore increases the computational load on the system. Accordingly, the experiment also demonstrated that the TPTC method had a low throughput in a data pressure test environment. Furthermore, when we measured the data delay caused by the algorithms, we found that the TPTC method had the lowest data delay from the data stream input to the formation of the heatmap tiles in a non-pressure environment. This is because the TPTC constructs a pyramid using global mapping; therefore, it can immediately generate a map block after triggering a watermark in the incremental processing model.
The second algorithm for constructing heat map pyramids is based on the LPTC approach, which creates a hierarchical model using step-by-step aggregation. This approach solves the issue of data redundancy that occurs in the TPTC algorithm during the construction of a multilevel network. Additionally, it converts the high-level data mapping operation into a block resampling algorithm, which significantly reduces the computational complexity. The experimental results also demonstrated that the LPTC method had the highest throughput when tested under data stress. However, during the construction of higher-level pyramid tiles, the LPTC relies on the Flink watermark to trigger resampling operations, resulting in a certain degree of data delay.
Therefore, considering the characteristics of the two heatmap pyramid construction algorithms, we propose an MPTC construction strategy that combines the TPTC and LPTC algorithms. Our scalable and efficient heatmap pyramid construction algorithm starts from any level of the pyramid as the initial resolution layer and extends from that level to the poles to construct the pyramid. Our experiments showed that the algorithm effectively balances throughput and data delay. In real-life scenarios, the MPTC initial resolution layer can be adaptively selected based on the sampling frequency of the data stream, providing optimal performance between the throughput and data delay of the algorithm. Moreover, it should be noted that the MPTC algorithm is not in opposition to the TPTC and LPTC methods. In contrast, the MPTC method is compatible with both algorithms and can be transformed into the TPTC or LPTC algorithms when the initial resolution layer is selected.
Additionally, based on the experimental results, it was observed that the closer the initial resolution level was to the highest level (e.g. 18), the greater the throughput of the algorithm, but with an increase in data latency. Conversely, as the initial resolution approaches the lowest level (e.g. 12), throughput and data latency decrease. Therefore, when selecting the initial resolution level, it is advisable to consider business requirements judiciously and choose an appropriate starting level. Additionally, the size of the window impacts the data latency, as larger windows result in excessive data accumulation, thereby affecting the system performance. Thus, it is recommended that the window size be reasonably reduced based on the business logic.
The parallelism of the model can effectively enhance the performance of the algorithm; however, it is not infinitely scalable. This depended on the data density within the window. When dealing with large volumes of data, it is advisable to increase the parallelism to alleviate the running pressure on individual nodes. Conversely, when dealing with smaller data volumes, it is therefore prudent to reduce the parallelism to conserve computational resources.
Therefore, the proposed heatmap pyramid construction algorithm has the characteristics of high throughput, low latency, and flexible scalability, thereby providing timely, large-scale public services in smart city management.
4.5. Multi-dimensional aggregation analysis
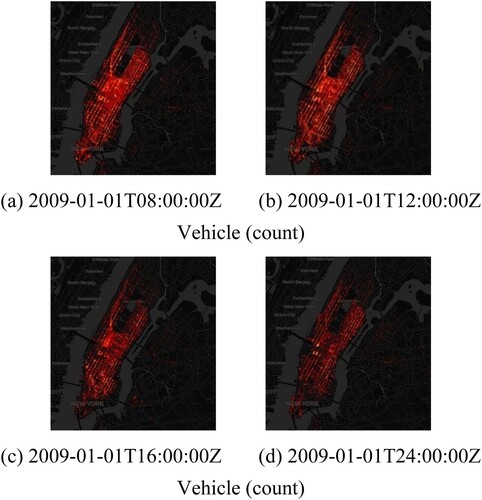
In the first-level aggregation model of the heatmap pyramid, we provided various aggregation functions in order to support multi-semantic thermal analysis. The spatial distribution of the spatiotemporal data streams can be described using a count aggregation strategy. depicts taxi activities in New York on 1 January 2009, by intercepting four typical time points throughout the day (with a time window of 1 h). It is evident that the active times of taxi activities were 8:00am and 12:00 noon. At 12:00 noon, the active area of taxis was more concentrated in the central area of New York City. By 4:00pm, the distribution of the taxi activity heatmap was significantly reduced when compared to that at 8:00am and 12:00pm, and a local thermal peak appeared in the southern region. By 12:00am, only a few areas in the middle of the active taxi area exhibited a thermal peak, and the overall thermal value of the region reached its minimum.
Figure 15. Taxi trajectory heatmap.
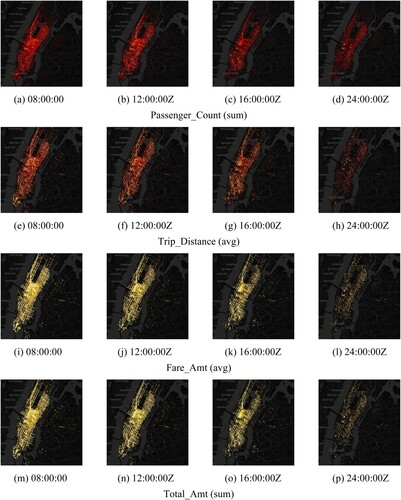
The taxi trajectory data contain multi-dimensional attribute information, and the pyramid aggregation function can be applied to each attribute in order to create a multi-temporal and multi-view urban traffic heatmap. shows a heatmap of the multi-dimensional attributes for the current taxi trajectory data, with the attribute information presented in . The pyramid aggregation function can be utilized in different application scenarios. The congestion of urban streets can be assessed by calculating a vehicle trajectory heatmap. However, the vehicle-attribute heatmap can help us analyze driving habits between different regions or streets. For instance, the Passenger_Count attribute can be used to determine if passengers in different regions prefer traveling alone or with others, the Trip_Distance attribute can explore areas where passengers prefer longer-distance travel, the Fare_Amt attribute can be used to identify the average additional costs of the area, and the Total_Amt attribute can provide information on the travel cost of the area.
Figure 16. Taxi Information Heatmap.
By integrating the various urban data sources and leveraging the flow-processing computing framework proposed in this study, real-time computation and aggregation of data stream heat maps can be achieved in the context of massive and low-latency data stream convergence. This will greatly benefit urban emergency management and also decision-making in large-scale public services, and it has significant implications for monitoring urban activities.
5. Conclusion
To establish an advanced and integrated smart city system, it is important to develop a framework that can converge and process multi-source dynamic urban data streams in real-time. However, the challenge of balancing real-time urban data stream fusion processing with real-time urban perception has become increasingly apparent. In this paper, we have proposed an ST-pyramid model for real-time data streams that uses a multigranularity spatio-temporal subdivision grid to design a spatio-temporal partition strategy. This approach has enabled the efficient retrieval and updating of real-time data streams in a distributed environment. Accordingly, we have proposed a load-balanced distributed real-time heatmap pyramid computation framework that utilizes a spatiotemporal partition strategy and a window selection mechanism. Using distributed two-stage tile aggregation processing, we have proposed a scalable and efficient heatmap pyramid construction algorithm that provides multiple types of aggregation functions to support smart city services with high throughput and low latency. In addition, we implemented a real-time urban traffic heat map prototype system based on an open-source Flink framework. Finally, using New York taxi data as an example, we evaluated the scalability and real-time processing performance of the proposed algorithm and demonstrated a multi-dimensional view of urban traffic patterns. Our experimental results show that the proposed real-time heatmap pyramid construction algorithm has high throughput, low latency, and flexible scalability, and can provide large-scale public services in smart city management.
Acknowledgements
The authors would like to thank the anonymous peer reviewers for their helpful and constructive reviews of the manuscript. At the same time, we also want to thank Taylor & Francis for providing language editing services, which have further improved the quality of the paper.
Data and code availability statement
The datasets used are openly available. The model and algorithms proposed in this study were integrated into our proposed foundational framework called Glink, which serves as a spatial extension of Flink for stream processing. This code is available at https://github.com/glink-incubator/glink.git.
Disclosure statement
No potential conflict of interest was reported by the author(s).
Additional information
Funding
References
- Amini, S., I. Gerostathopoulos, and C. Prehofer. 2017. “Big Data Analytics Architecture for Real-time Traffic Control.” In 2017 5th IEEE International Conference on Models and Technologies for Intelligent Transportation Systems (MT-ITS), 710–715. https://doi.org/10.1109/MTITS.2017.80056.05.
- Armstrong, M. P. 1988. “Temporality in Spatial Databases.” GIS/LIS 88 Proceedings: Accessing the World, 880–889.
- Battersby, S. E., M. P. Finn, E. L. Usery, and K. H. Yamamoto. 2014. “Implications of Web Mercator and its Use in Online Mapping.” Cartographica: The International Journal for Geographic Information and Geovisualization 49 (2): 85–101. https://doi.org/10.3138/carto.49.2.2313.
- Bellini, P., S. Bilotta, E. Collini, M. Fanfani, and P. Nesi. 2023. “Mobility and Transport Data for City Digital Twin Modeling and Exploitation.” In 2023 IEEE International Smart Cities Conference (ISC2), 1–7. https://doi.org/10.1109/ISC257844.2023.10293300.
- Chen, N., Y. Chen, S. Song, C.-T. Huang, and X. Ye. 2016a. “Poster Abstract: Smart Urban Surveillance Using Fog Computing.” In 2016 IEEE/ACM Symposium on Edge Computing (SEC), 95–96. https://doi.org/10.1109/SEC.2016.25.
- Chen, N., Y. Chen, Y. You, H. Ling, P. Liang, and R. Zimmermann. 2016b. “Dynamic Urban Surveillance Video Stream Processing Using Fog Computing.” In 2016 IEEE Second International Conference on Multimedia big Data (BigMM), 105–112. https://doi.org/10.1109/BigMM.2016.53.
- Dean, J., and G. Sanjay. 2008. “MapReduce: Simplified Data Processing on Large Clusters.” Communications of the ACM 51 (1): 107–113. https://doi.org/10.1145/1327452.1327492
- Eldawy, A., and M. F. Mokbel. 2015. “Spatialhadoop: A Mapreduce Framework for Spatial Data.” In 2015 IEEE 31st International Conference on Data Engineering, 1352–1363. https://doi.org/10.1109/ICDE.2015.7113382.
- El Mendili, S., Y. El Bouzekri El Idrissi, and N. Hmina. 2019. “Big Data Processing Platform on Intelligent Transportation Systems.” International Journal of Advanced Trends in Computer Science and Engineering 8 (1.4): 1099–1199. https://doi.org/10.30534/ijatcse/2019/16842019.
- Gao, H., S. Abu Bakar, S. Maulan, M. J. Mohd Yusof, R. Mundher, and K. Zakariya. 2023. “Identifying Visual Quality of Rural Road Landscape Character by Using Public Preference and Heatmap Analysis in Sabak Bernam, Malaysia.” Land 12 (7): 1440. https://doi.org/10.3390/land12071440.
- Gong, J., X. Zhang, L. Xiang, and N. Chen. 2019. “Progress and Applications for Integrated Sensing and Intelligent Decision in Smart City.” Acta Geodaetica et Cartographica Sinica 48 (12): 1482–1497. https://doi.org/10.11947/j.AGCS.2019.20190464.
- Gray, J., S. Chaudhuri, A. Bosworth, A. Layman, D. Reichart, M. Venkatrao, F. Pellow, and H. Pirahesh. 1997. “Data Cube: A Relational Aggregation Operator Generalizing Group-by, Cross-tab, and Sub-totals.” Data Mining and Knowledge Discovery 1 (1): 29–53. https://doi.org/10.1023/A:1009726021843.
- Guan, X., C. Xie, L. Han, Y. Zeng, D. Shen, and W. Xing. 2020. “MAP-Vis: A Distributed Spatio-temporal Big Data Visualization Framework Based on a Multi-Dimensional Aggregation Pyramid Model.” Applied Sciences 10 (2): 598. https://doi.org/10.3390/app10020598.
- Guo, N., W. Xiong, Q. Wu, and N. Jing. 2016. “An Efficient Tile-pyramids Building Method for Fast Visualization of Massive Geospatial Raster Datasets.” Advances in Electrical and Computer Engineering 16 (4): 3–8. https://doi.org/10.4316/AECE.2016.04001.
- Haferkamp, J., M. W. Ulmer, and J. F. Ehmke. 2023. “Heatmap-based Decision Support for Repositioning in Ride-sharing Systems.” Transportation Science 58 (1): 110–130. https://doi.org/10.1287/trsc.2023.1202.
- Hägerstrand, T. 1970. “What about People in Regional Science?” Regional Science 24 (1): 6–21. https://doi.org/10.1007/BF01936872.
- Hemayed, E. E., E. M. Farghal, and S. I. Shaheen. 2010. “Pyramid-based Multiresolution Tiling for Interactive Viewing of Remote Sensing Images.” In 2010 International Computer Engineering Conference (ICENCO), 128–133. https://doi.org/10.1109/ICENCO.2010.5720439.
- Hu, L., F. Zhang, M. Qin, Z. Fu, Z. Chen, Z. Du, and R. Liu. 2021. “A Dynamic Pyramid Tilling Method for Traffic Data Stream Based on Flink.” IEEE Transactions on Intelligent Transportation Systems 23 (7): 6679–6688. https://doi.org/10.1109/TITS.2021.3060576.
- Isah, H., T. Abughofa, S. Mahfuz, D. Ajerla, F. Zulkernine, and S. Khan. 2019. “A Survey of Distributed Data Stream Processing Frameworks.” IEEE Access 7:154300–154316. https://doi.org/10.1109/ACCESS.2019.2946884.
- Jin, J., J. Gubbi, S. Marusic, and M. Palaniswami. 2014. “An Information Framework for Creating a Smart City Through Internet of Things.” IEEE Internet of Things Journal 1 (2): 112–121. https://doi.org/10.1109/JIOT.2013.2296516.
- Kamilaris, A., A. Pitsillides, F. X. Prenafeta-Bold, and M. I. Ali. 2017. “A Web of Things Based Eco-system for Urban Computing-owards Smarter Cities.” In 2017 24th International Conference on Telecommunications (ICT), 1–7. https://doi.org/10.1109/ICT.2017.7998277.
- Karimov, J., T. Rabl, A. Katsifodimos, R. Samarev, H. Heiskanen, and V. Markl. 2018. “Benchmarking Distributed Stream Data Processing Systems.” In 2018 IEEE 34th International Conference on Data Engineering (ICDE), 1507–1518. https://doi.org/10.1109/ICDE.2018.00169.
- Kritharakis, E., S. Luo, V. Unnikrishnan, and K. Vombatkere. 2022. “Detecting Trading Trends in Streaming Financial Data Using Apache Flink.” In Proceedings of the 16th ACM International Conference on Distributed and Event-based Systems, 145–150. https://doi.org/10.1145/3524860.3539647.
- Langran, G., and N. R. Chrisman. 1988. “A Framework for Temporal Geographic Information.” Cartographica: The International Journal for Geographic Information and Geovisualization 25 (3): 1–14. https://doi.org/10.3138/K877-7273-2238-5Q6V
- Li, D., Y. Yao, and Z. Shao. 2014. “Big Data in Smart City.” Geomatics and Information Science of Wuhan University 39 (6): 631–640.
- Li, X., D. Zhang, Y. Zheng, W. Hong, W. Wang, J. Xia, and Z. Lv. 2023. “Evolutionary Computation-based Machine Learning for Smart City High-dimensional Big Data Analytics.” Applied Soft Computing 133:109955. https://doi.org/10.1016/j.asoc.2022.109955.
- Lin, A., H. Wu, G. Liang, A. Cardenas-Tristan, X. Wu, C. Zhao, and D. Li. 2020. “A Big Data-driven Dynamic Estimation Model of Relief Supplies Demand in Urban Flood Disaster.” International Journal of Disaster Risk Reduction 49:101682. https://doi.org/10.1016/j.ijdrr.2020.101682.
- Liu, Y., L. Chen, N. Jing, and W. Xiong. 2013. “Parallel Batch-building Remote Sensing Images Tile Pyramid with MapReduce.” Geomatics and Information Science of Wuhan University 38 (3): 278–282.
- Liu, H., Y. Wu, N. Jing, and S. Feng. 2020. “A Fast Tile-pyramid Construction Algorithm Based on Multilevel Task Parallelism.” IOP Conference Series: Earth and Environmental Science 513 (1): 012056. https://doi.org/10.1088/1755-1315/513/1/012056.
- Magano, F. d. C., and K. R. Braghetto. 2018. “Abstracting Big Data Processing Tools for Smart Cities.” In 2018 IEEE 37th International Symposium on Reliable Distributed Systems Workshops (SRDSW), 14–17. https://doi.org/10.1109/srdsw.2018.00014.
- McGregor, C. 2011. “A Cloud Computing Framework for Real-time Rural and Remote Service of Critical Care.” In 2011 24th International Symposium on Computer-Based Medical Systems (CBMS), 1–6. https://doi.org/10.1109/CBMS.2011.5999037.
- Meng, Y., S. Li, K. Chen, B. Li, J. e. Zhang, and G. Qing. 2023. “Research on Spatiotemporal Characteristics of Urban Crowd Gathering Based on Baidu Heatmap.” Archives of Transport 68 (4): 41–54. https://doi.org/10.61089/aot2023.1g53c194.
- Nakata, M., and K. Okada. 2012. “The Three-domain Model.” Plant Signaling & Behavior 7 (11): 1423–1427. https://doi.org/10.4161/psb.21959.
- Perrot, A., R. Bourqui, N. Hanusse, and D. Auber. 2017. “HeatPipe: High Throughput, Low Latency Big Data Heatmap with Spark Streaming.” In 2017 21st International Conference Information Visualisation (IV), 66–71. https://doi.org/10.1109/iV.2017.45.
- Peuquet, D. J., and N. Duan. 1995. “An Event-based Spatiotemporal Data Model (ESTDM) for Temporal Analysis of Geographical Data.” International Journal of Geographical Information Systems 9 (1): 7–24. https://doi.org/10.1080/02693799508902022.
- Qadah, E., M. Mock, E. Alevizos, and G. Fuchs. 2018. “A Distributed Online Learning Approach for Pattern Prediction Over Movement Event Streams with Apache Flink.” EDBT/ICDT Workshops, 109–116.
- Rathore, M. U., A. Paul, A. Ahmad, B.-W. Chen, B. Huang, and W. Ji. 2015. “Real-time Big Data Analytical Architecture for Remote Sensing Application.” IEEE Journal of Selected Topics in Applied Earth Observations and Remote Sensing 8 (10): 4610–4621. https://doi.org/10.1109/JSTARS.2015.2424683.
- Rathore, M. M., A. Paul, A. Ahmad, N. Chilamkurti, W.-H. Hong, and H. Seo. 2018. “Real-time Secure Communication for Smart City in High-speed Big Data Environment.” Future Generation Computer Systems 83:638–652. https://doi.org/10.1016/j.future.2017.08.006.
- Rathore, M. M., H. Son, A. Ahmad, A. Paul, and G. Jeon. 2017. “Real-time Big Data Stream Processing Using GPU with Spark Over Hadoop Ecosystem.” International Journal of Parallel Programming 46 (3): 630–646. https://doi.org/10.1007/s10766-017-0513-2.
- Sarwat, M., and A. Nandi. 2017. “On Designing a Geoviz-aware Database System-Challenges and Opportunities.” International Symposium on Spatial and Temporal Databases 10411:384–387. https://doi.org/10.1007/978-3-319-64367-0_21.
- Shaikh, S. A., K. Mariam, H. Kitagawa, and K.-S. Kim. 2020. “GeoFlink: A Distributed and Scalable Framework for the Real-time Processing of Spatial Streams.” In Proceedings of the 29th ACM International Conference on Information & Knowledge Management, 3149–3156. https://doi.org/10.1145/3340531.3412761.
- Shen, Y., L. Zhao, and J. Fan. 2015. “Analysis and Visualization for Hot Spot Based Route Recommendation Using Short-Dated Taxi GPS Traces.” Information 6 (2): 134–151. https://doi.org/10.3390/info6020134.
- Shu, H. 2016. “Big Data Analytics: Six Techniques.” Geo-spatial Information Science 19 (2): 119–128. https://doi.org/10.1080/10095020.2016.1182307.
- Tan, L., K. Yu, A. K. Bashir, X. Cheng, F. Ming, L. Zhao, and X. Zhou. 2021. “Toward Real-time and Efficient Cardiovascular Monitoring for COVID-19 Patients by 5G-Enabled Wearable Medical Devices: A Deep Learning Approach.” Neural Computing and Applications 35:1–14. https://doi.org/10.1007/s00521-021-06219-9.
- Tang, Y., X. Ye, and N. Tang. 2010. “Temporal Information Processing Technology and Its Application.” In Temporal Information Processing Technology and its Application, 91–112. Berlin, Germany: Springer. https://doi.org/10.1007/978-3-642-14959-7.
- Tobler, W. R. 1970. “A Computer Movie Simulating Urban Growth in the Detroit Region.” Economic Geography 46 (sup1): 234–240.
- Wang, M., and F. Vermeulen. 2020. “Life between Buildings from a Street View Image: What do Big Data Analytics Reveal About Neighbourhood Organisational Vitality?” Urban Studies 58 (15): 3118–3139. https://doi.org/10.1177/0042098020957198.
- Ward, G., E. Reinhard, and P. Debevec. 2008. “High Dynamic Range Imaging & Image-Based Lighting.” ACM SIGGRAPH 2008 classes, 1–137. https://doi.org/10.1145/1401132.1401170.
- Worboys, M. F., H. M. Hearnshaw, and D. J. Maguire. 1990. “Object-oriented Data Modelling for Spatial Databases.” International Journal of Geographical Information Systems 4 (4): 369–383. https://doi.org/10.1080/02693799008941553.
- Wu, W., and T. Zheng. 2023. “Establishing a ‘Dynamic two-Step Floating Catchment Area Method’ to Assess the Accessibility of Urban Green Space in Shenyang Based on Dynamic Population Data and Multiple Modes of Transportation.” Urban Forestry & Urban Greening 82:127893. https://doi.org/10.1016/j.ufug.2023.127893.
- Xia, Y., and X. Yang. 2012. “Remote Sensing Image Data Storage and Search Method Based on Pyramid Model in Cloud.” International Conference on Rough Sets and Knowledge Technology 7414:267–275. https://doi.org/10.1007/978-3-642-31900-6_34.
- Xu, Q., L. Xiang, H. Wang, X. Guan, and H. Wu. 2022. “GeoMapViz: A Framework for Distributed Management and Geospatial Data Visualization Based on Massive Spatiotemporal Data Streams.” IOP Conference Series: Earth and Environmental Science 1004 (1): 012017. https://doi.org/10.1088/1755-1315/1004/1/012017.
- Yang, M., H. Mei, Y. Yang, and D. Huang. 2017. “Efficient Storage Method for Massive Remote Sensing Image via Spark-based Pyramid Model.” International Journal of Innovative Computing, Information and Control 13 (6): 1915–1929.
- Yerva, S. R., F. Grosan, A. Tandrau, and K. Aberer. 2013. “Tripeneer: User-based Travel Plan Recommendation Application.” Proceedings of the International AAAI Conference on Web and Social Media 7 (1): 750–751. https://doi.org/10.1609/icwsm.v7i1.14366. https://ojs.aaai.org/index.php/ICWSM/article/view/14366.
- You, S., J. Zhang, and L. Gruenwald. 2015. “Large-scale Spatial Join Query Processing in Cloud.” In 2015 31st IEEE International Conference on Data Engineering Workshops, 34–41. https://doi.org/10.1109/ICDEW.2015.7129541.
- Yu, J., and R. Buyya. 2005. “A Taxonomy of Scientific Workflow Systems for Grid Computing.” ACM Sigmod Record 34 (3): 44–49. https://doi.org/10.1145/1084805.1084814.
- Yu, J., and M. Sarwat. 2020. “Turbocharging Geospatial Visualization Dashboards via a Materialized Sampling Cube Approach.” In 2020 IEEE 36th International Conference on Data Engineering (ICDE), 1165–1176. https://doi.org/10.1109/ICDE48307.2020.00105.
- Yu, J., J. Wu, and M. Sarwat. 2015. “GeoSpark: A Cluster Computing Framework for Processing Large-Scale Spatial Data.” In Proceedings of the 23rd SIGSPATIAL International Conference on Advances in Geographic Information Systems, 1–4. https://doi.org/10.1145/2820783.2820860.
- Yu, J., Z. Zhang, and M. Sarwat. 2018. “GeoSparkViz: A Scalable Geospatial Data Visualization Framework in the Apache Spark Ecosystem.” In Proceedings of the 30th International Conference on Scientific and Statistical Database Management, 1–12. https://doi.org/10.1145/3221269.3223040.
- Zheng, Y., F. Liu, and H.-P. Hsieh. 2013. “U-air: When Urban Air Quality Inference Meets Big Data.” In Proceedings of the 19th ACM SIGKDD International Conference on Knowledge Discovery and Data Mining, 1436–1444. https://doi.org/10.1145/2487575.2488188.