
 ?Mathematical formulae have been encoded as MathML and are displayed in this HTML version using MathJax in order to improve their display. Uncheck the box to turn MathJax off. This feature requires Javascript. Click on a formula to zoom.
ABSTRACT
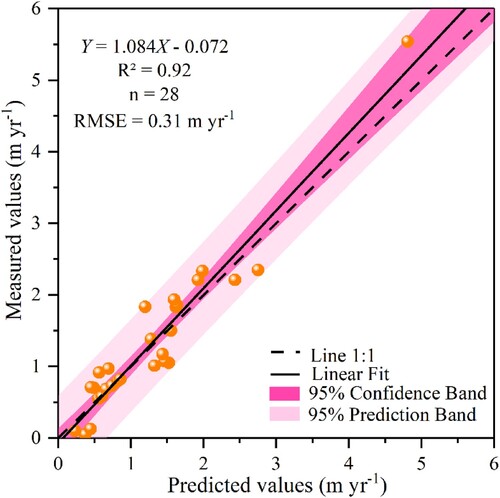
Ephemeral gully headcut erosion contributes significantly to global land degradation and increased sediment yields, but the underlying driving factors and prediction models remain poorly understood. We conduct a comprehensive quantitative analysis of ephemeral gully headcut erosion in the Loess Plateau using an optimal parameters-based geographical detector (OPGD) model, leveraging high-resolution remote sensing images. Our findings reveal a varied ephemeral gully head advance rate spanning 0.04–5.54 m yr−1 between 2009 and 2021 (average 1.37 m yr−1), with over 58% of the erosion rates falling between 0.50 and 2.00 m yr−1. Catchment area emerges as the primary driving factor, with an explanatory power of 61%. Moreover, the interactions between catchment area and slope degree, rainfall erosivity, and fractional vegetation coverage (FVC) had explanatory powers exceeding 80%. Furthermore, we developed a robust prediction model for ephemeral gully head advance rates based on the results from the OPGD model, incorporating the FVC factor. The validation of our model yielded a high coefficient of determination (R2 = 0.92 m yr−1) and low root mean square error (RMSE = 0.31 m yr−1). Our study offers new insights into ephemeral gully headcut erosion control in the Loess Plateau and serves as a valuable reference for loess regions worldwide.
1. Introduction
Soil is a vital resource underpinning global food production, human habitation, and crucial ecosystem functions. However, soil erosion directly threatens land sustainability, exacerbating flood risks and increasing the frequency of natural disasters, jeopardizing global food security and the achievement of Sustainable Development Goals (Amundson et al. Citation2015; Bhardwaj, Wuest, and Wuest Citation2017; Borrelli et al. Citation2017; FAO Citation2019; Montanarella et al. Citation2016; Pal et al. Citation2021). Ephemeral gully erosion, a distinct form soil erosion prevalent on sloping farmlands in the Loess Plateau of China, poses a particular challenge. It renders land uncultivable and readily transitions into permanent gullies, severely impacting tillage, depleting fertile topsoil, and impeding the region’s sustainable socioeconomic development.
With the advancements in remote sensing technology, high-resolution satellite images have emerged as a valuable tool in studying ephemeral gully erosion. Research in this domain has primarily focused on identifying and delineating ephemeral gullies (Dai et al. Citation2020; Liu et al. Citation2022; Yang et al. Citation2017), mapping their susceptibility (Fiorucci et al. Citation2015; Mohebzadeh et al. Citation2024), assessing of soil losses (Karydas and Panagos Citation2020; Nachtergaele and Poesen Citation1999; Reece et al. Citation2023; Teasdale and Barber Citation2008), investigating influencing factors (Tang et al. Citation2022; Vandaele et al. Citation1997), and understanding their morphological characteristics and topographical thresholds (Gudino-Elizondo et al. Citation2018; Maugnard et al. Citation2014). The ephemeral gully head is particularly important, as it is at the dynamic forefront of gully formation, where understanding the primary driving factors and predicting advancement rates are critical for implementing effective erosion control measures.
Extensive studies have identified natural and anthropogenic factors driving ephemeral gully headcut erosion, including soil, climate, terrain, vegetation, and land use. In sub-humid tropical areas, the dominant cause of ephemeral gully head advancement and expansion is high rainfall, increasing subsurface water levels above the ephemeral gully bottom and reducing soil strength and erosion durability (Pal et al. Citation2022; Rengers and Tucker Citation2015; Roy et al. Citation2022; Tebebu et al. Citation2010; Zegeye et al. Citation2016). In arid and semi-arid areas, the main causes of ephemeral gully head advancement are higher temperatures and infiltration-excess runoff under extreme rainfall, resulting in summer cracks in clayey soils next to the ephemeral gully heads (Roshan and Negahban Citation2015; Xu et al. Citation2019). Vegetation can reduce the power of runoff erosion by increasing the soil infiltration capacity and runoff resistance and reducing the runoff flow velocity. Moreover, vegetative root growth can significantly enhance the anti-scourability of soil (Feng et al. Citation2022; Guo et al. Citation2019; Mukai Citation2017; Sun et al. Citation2016). Topography (e.g. profile curvature, catchment area, slope length, slope aspect, slope degree, and altitude) also controls the initiation and development of ephemeral gully heads (Arabameri et al. Citation2021; Chaplot Citation2013; Chowdhuri et al. Citation2021; Conoscenti et al. Citation2013; Jiang et al. Citation2021; Kariminejad et al. Citation2019; Saha et al. Citation2022; Torri et al. Citation2018; Vanmaercke et al. Citation2016; Wang et al. Citation2022).
The complexity and heterogeneity of environmental factors influencing ephemeral gully headcut erosion pose challenges for traditional statistical models, which often struggle to accurately capture non-linear and interactive effects. Geographical detector models offer a promising avenue to address this challenge by detecting spatial heterogeneity and uncovering underlying driving forces (Wang et al. Citation2010), an approach that has been applied widely in the natural sciences (Xie et al. Citation2021; Zhang et al. Citation2022; Zhou et al. Citation2021; Zhu, Meng, and Zhu Citation2020). However, traditional geographical detector models often rely on professional experience and previous research when discretizing spatial data, ignoring the possible impacts of data discretization methods and the break number of spatial strata on detection results. Song et al. (Citation2020) developed an optimal parameter-based geographical detector (OPGD) model to enhance the reliability of geographic detection results, allowing for more effective extraction of spatial attributes and information. Despite these advancements, existing prediction models for ephemeral gully head advance rates mainly rely on empirical approaches, using the Thompson (Thompson Citation1964), SCS Ⅰ, and SCS Ⅱ (United States Department of Agriculture Citation1966) models. The Thompson model considers four factors – catchment area, slope degree, rainfall, and clay content – while the SCS I and SCS II models are based on catchment area and rainfall, with the SCS II model adding the factor (past average annual rate of gully head advancement). However, these models lack specificity for unique topography and climatic conditions, necessitating the development of an ephemeral gully head advance rate prediction model incorporating the relationships between ephemeral gully headcut erosion and terrain, soil, climate, and vegetation variables.
The Loess Plateau of China is the world’s largest and deepest loess deposit, covering an area of 640,000 km2. Its unique characteristics, including high porosity, loose texture, strong water permeability, and concentrated rainfall patterns, have rendered it one of the most severely eroded regions globally (Fu et al. Citation2017; Maher Citation2016; Tang et al. Citation2015; Wu et al. Citation2018). Within this expansive plateau, the hilly and gully region accounts for 22.22% of its total area and represents the most extensive geomorphic area (Zhao et al. Citation2013). Persistent challenges of ephemeral gully headcut erosion have plagued this region for a long time, removing valuable nutrients from surface soils and forming numerous gullies and fragmented terrain that have significantly impeded economic and ecological development of the Loess Plateau. In response to these challenges, the Chinese government has implemented various measures, including comprehensive watershed management initiatives and the ‘Grain for Green’ project, which have effectively mitigated soil erosion and yielded significant economic and ecological benefits across the Loess Plateau. Despite these efforts, critical aspects such as the spatial distribution of ephemeral gully headcut erosion and the interactions among its influencing factors remain poorly understood.
This study leverages high-resolution remote sensing imagery from 2009 and 2021 to evaluate the impact of various independent variables (slope degree, catchment area, profile curvature, slope aspect, vegetation, and rainfall erosivity). By identifying key driving factors, we seek to develop a robust prediction model for ephemeral gully head advance rates in the hilly and gully regions of the Loess Plateau. The study aimed to (1) map the spatial distribution characteristics of ephemeral gully headcut erosion, (2) explore the contributions and relationships of driving factors to the ephemeral gully head advance rate, and (3) develop a prediction model for the ephemeral gully head advance rate in the hilly and gully regions of the Loess Plateau. Ultimately, this research aims to enhance the understanding and management of ephemeral gully headcut erosion, offering insights into effective erosion control strategies in the region.
2. Material and methods
2.1. Study area
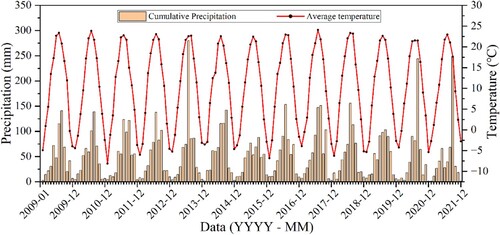
The Zhoutungou watershed is located in Ansai County, Shaanxi Province, China (36°42′10″ – 36°47′10″ N, 109°09′00″ – 109°13′45″ E, altitude 1,026–1,439 m, area 33.6 km²) ((a)). The study area is a typical small watershed in the hilly and gully region of the Loess Plateau with severe ephemeral gully erosion. There are over 2,300 ephemeral gullies in this area, with an average length of 45.84 m and width of 1.01 m, contributing to a total volume of ephemeral gully erosion reaching nearly 2.00 × 10⁴ m3 in 2021 (Liu et al. Citation2024). The predominant soil type in the study area is loessial soil, characterized by its loose structure and vertical joints, facilitating rapid water infiltration. Consequently, loessial soil is highly susceptible to erosion, with its weak erosion resistance making it prone to gully formation. The watershed experiences an average annual temperature of 10°C and an average annual precipitation of 550 mm. Notably, 75% of the precipitation occurs between July and September, with intense rainfall exacerbating soil erosion ().
Figure 1. Location of the study area. (a) Geographical location, (b) remote sensing image, and (c) ephemeral gully samples in the Zhoutungou watershed on the Loess Plateau.
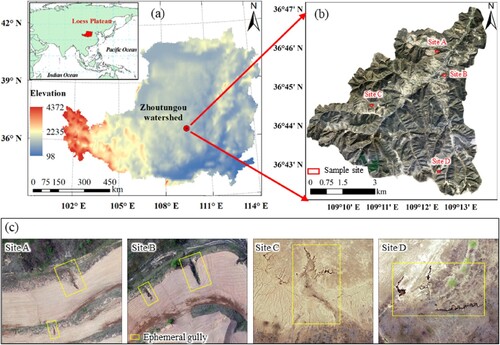
Figure 2. Monthly cumulative precipitation (orange bars) and average temperature (red curves) from 2009 to 2021 in the Zhoutungou watershed.
2.2. Remote sensing data collection
The high-resolution remote sensing data for 2009 was acquired from the QuickBird satellite, operating at an orbital altitude of 450 km. This data was processed into an RGB three-band Digital Orthophoto Map (DOM) with a spatial resolution of 0.5 m after data fusion. The high-resolution remote sensing data for 2021 was obtained from unmanned aerial vehicle (UAV), flying at an altitude of 220 m, with a spatial resolution of 0.5 m.
Before drone flight, image control points were marked in the basin using a STONEX S3+ RTK. These control points correct the imagery during unmanned aerial vehicle (UAV) image processing. Specifically, 18 image control points were designated within the Zhoutungou watershed. The selection criteria for these points encompassed a circular perimeter around the region, with additional points distributed as evenly as possible within the basin. The UAV launch site was strategically chosen in an open area with elevated altitude to maximize coverage, and minimize the number of UAV takeoff sorties. A total of 11,720 UAV images were captured and subsequently processed using Agisoft Metashape Professional software (Windows version 1.7.3) to generate a digital elevation model (DEM) with 0.15 m resolution and a DOM with 0.5 m resolution.
2.3. Research methodology
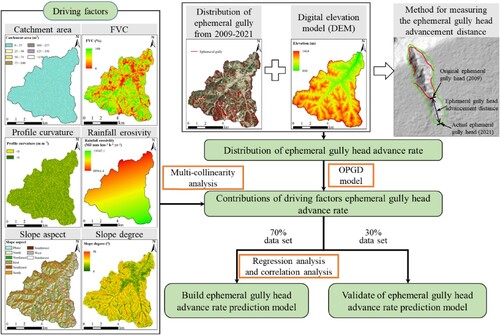
The research methodology, depicted in , commenced with the spatial distribution analysis of ephemeral gully head advance rates by overlaying the distribution of ephemeral gullies from 2009 to 2021 using a DEM. Subsequently, multicollinearity analysis was conducted to assess the interrelationships among the driving factors. Following this, the OPGD model was used to identify the key driving factors influencing ephemeral gully head advance rates. Lastly, a prediction model for ephemeral gully head advance rates was developed and validated.
Figure 3. Flowchart of the methodology used in this study.
2.3.1. Extracting ephemeral gully head location
Spatial locations of ephemeral gullies in 2009 and 2021, as extracted by Liu et al. (Citation2022), were used in this study. Ephemeral gullies exhibiting no spatial changes from 2009 to 2021 were identified based on high-resolution remote sensing images from QuickBird satellite and UAV, both with 0.5 m resolution. The process involved combining the layer of ephemeral gullies without spatial changes with the DEM layer in ArcGIS software to pinpoint the positions of ephemeral gully heads. Field investigations were conducted to verify the accuracy of these positions, ultimately determining the final positions of ephemeral gully heads. Subsequently, 92 ephemeral gullies uniformly distributed across the watershed and existing from 2009 to 2012 were selected to calculate ephemeral gully head advance rates.
2.3.2. Acquisition of driving factors
The driving factors considered in this study include terrain attributes, fractional vegetation coverage (FVC), and rainfall erosivity. Four terrain attributes, namely slope degree (Sl, °), catchment area (Ca, m2), profile curvature (Curv, m m−2), and slope aspect (Sa), were extracted from the DEM data obtained from the Shaanxi Geomatics Center of Ministry of Natural Resources of China (http://sxgis.cn/), with a 5 m resolution. These terrain factors were estimated using the terrain analysis extension in ArcGIS 10.2 (ESRI, USA). Sl refers to the slope or steepness above the ephemeral gully head, calculated using spatial analysis tools in ArcGIS software and defined by a pixel and eight adjacent pixels as the steepest slope in a plane. Ca refers to direct or indirect cumulative flow into the grid at the ephemeral gully head. Curv refers to the curvature characteristics of terrain in the direction perpendicular to the horizontal plane, showing the slope gradient with negative and positive values. Sa values in this region range from 0 to 360 degrees, including nine categories: flat, north, north east, east, southeast, south, southwest, west and northwest.
FVC – a quantitative indicator of surface conditions covered by plant communities – was calculated through dimidiate pixel model inversion on Google Earth Engine, as follows (Gutman and Ignatov Citation1998):
(1)
(1) where
is the
value of regions completely covered by bare soil, and
is the
value of regions completely covered by vegetation. After repeated comparisons,
values with a cumulative frequency of 5% and 95% were taken as
and
, respectively.
Rainfall erosivity was calculated and interpolated from precipitation data (National Meteorological Center of China, http://data.cma.cn/) in the study area and surrounding meteorological stations using the Kriging interpolation method in ArcGIS 10.2 (ESRI, USA). Rainfall erosion was calculated as follows (Zhang and Fu Citation2003):
(2)
(2) where Rj is the rainfall erosivity in the jth year, and Pj is the rainfall amount in the jth year. All data were resampled to a 5 × 5 m cell size in ArcGIS 10.2 (ESRI, USA) to ensure uniform spatial resolution.
2.3.3. Multi-collinearity analysis
Before using the OPGD model, multicollinearity among driving factors was assessed to identify and remove highly correlated variables to prevent misinterpretation of the model results (Garosi et al. Citation2019; Pourghasemi et al. Citation2017). b Tolerance and variance inflation factor (VIF) were calculated in SPSS V. 25 (IBM, USA), with a tolerance value <0.20 and a VIF value ≥5, indicating multicollinearity (Garosi et al. Citation2019; O’Brien Citation2007).
2.3.4. Optimal parameters-based geographical detector (OPGD) model
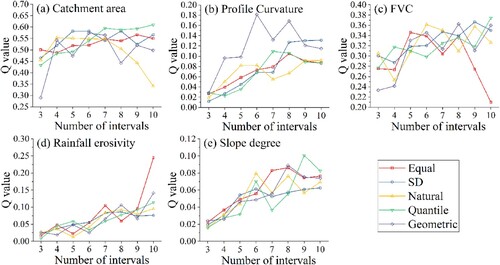
The OPGD model was constructed using Excel 2007 and comprises five components: parameter optimization, factor detector, interaction detector, risk detector, and ecological detector (Song et al. Citation2020). Before using the OPGD model, continuous variables were discretized using optimal parameters (). The optimal parameter combinations for discretization methods and break numbers varied for different explanatory variables, with a quantile break with ten intervals for catchment area and FVC, an SD break with six intervals for profile curvature, an equal break with ten intervals for rainfall erosivity, and a quantile break with nine intervals for slope degree.
Figure 4. Spatial discretization parameter optimization for each continuous variable.
Factor detection involves assessing the spatial differentiation of the dependent variable (Y) and the explanatory power of the interpretation variable (X) using the q-statistic:
(3)
(3) where h is the stratification (classification or partition) of the dependent variable Y or the independent variable X, Nh and N are the units for layer h and region, respectively,
and
are the variances of layer h and region, respectively. Q values can be transformed to a non-central F distribution and tested for significance using Eqs (4) and (5):
(4)
(4)
(5)
(5) where λ is the non-central parameter, and Yh is the mean value of layer h.
The interaction detector compares the Q values (Q (X1) and Q (X2)) to the interaction q value (Q (X1 ∩ X2)) to identify their interactions. The relationship between the variables can be categorized as: non-linear weakness (Q (X1 ∩ X2) < Min (Q (X1), Q (X2))), single-factor non-linear weakness (Min (Q (X1), Q (X2)) < Q (X1 ∩ X2) < Max (Q (X1), Q (X2))), two-factor enhancement (Q (X1 ∩ X2) > Max (Q (X1), Q (X2))), independent (Q (X1 ∩ X2) = Q (X1) + Q (X2)), or non-linear enhancement (Q (X1 ∩ X2) > Q (X1) + Q (X2)).
The risk detector evaluates whether the spatial patterns represented by mean values differ significantly among sub-regions classified by a categorical or stratified variable using the t-test, whereas the ecological detector assesses whether one explanatory variable has a greater impact than another using the F-statistic. We used the Kolmogorov–Smirnov test in SPSS software to test the normality of each variable before performing the t-test and F-statistic, with the results showing that each variable followed a normal distribution.
2.3.5. Construction and verification of the prediction model for ephemeral gully head advance rate
For constructing the prediction model, 70% of the data were selected randomly, while the remaining 30% were used for verification. Using multiple regression and correlation analysis methods, the OPGD model was used to identify the main driving factors affecting the ephemeral gully head advance rate by constructing an empirical formula of the ephemeral gully head advance rate with the main driving factors. The validity, goodness of fit, and efficiency of the model were validated using the coefficient of determination (R2) and root mean square error (RMSE), calculated as follows:
(6)
(6)
(7)
(7) where
,
,
, and
indicate the predicted, measured, mean predicted, and mean estimated ephemeral gully head advancement rates (m yr−1), respectively.
3. Results
3.1. Spatial distribution of ephemeral gully head advance rate
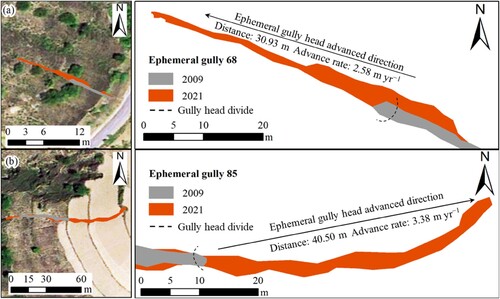
Ephemeral gully headcut erosion within the study area was concentrated primarily in the southern and western regions of the watershed ((a)). These areas are prone to soil erosion due to steep slopes and significant human disturbance. Advance rates were calculated for 92 ephemeral gully heads (Table S1). Notably, two typical ephemeral gullies, ephemeral gully 68 and ephemeral gully 85, experienced advancements of 30.93 m (advance rate 2.58 m yr−1) and 40.50 m (advance rate 3.38 m yr−1), respectively, from 2009 to 2021 (). Overall, ephemeral gully head advance rates ranged from 0.04–5.54 m yr−1 from 2009 to 2021 (average 1.37 m yr−1). (b) illustrates that rates between 0.50–1.00 m yr−1 and 1.00–2.00 m yr−1 accounted for 30.43% and 28.26% of the total, respectively, while rates >3.00 m yr−1 accounted for less than 10%.
Figure 5. (a) Spatial distribution and (b) the relative frequency of ephemeral gully head advance rates from 2009 to 2021.
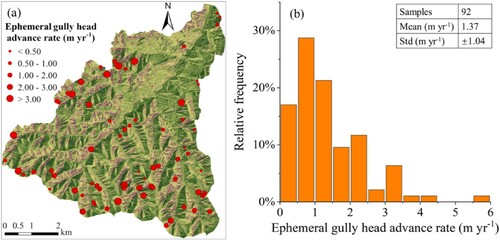
Figure 6. Ephemeral gully head advancement from 2009–2021 at two ephemeral gully sites: (a) ephemeral gully 68 and (b) ephemeral gully 85.
3.2. Multi-collinearity analysis of driving factors
A multicollinearity analysis used the six driving factors corresponding to the 92 ephemeral gully head advance rates (Table S1). presents the VIF and tolerance values for each factor. Notably, the highest VIF (1.25) and lowest tolerance (0.80) values were associated with FVC. Generally, a tolerance value <0.20 and a VIF value ≥5 indicate a multicollinearity issue (Garosi et al. Citation2019; O’Brien Citation2007). However, none of the factors exhibited values suggesting multicollinearity. Consequently, all driving factors were included in the modeling process.
Table 1. Multi-collinearity testing indices for the independent variables in the study area.
Table 2. Ephemeral gully head advance rates in other global sites.
3.3. Contributions of driving factors to ephemeral gully head advance rate
Using the OPGD model, we analyzed the contributions of driving factors to the ephemeral gully head advance rate. According to the factor detector results ((a)), catchment area exhibited the greatest explanatory power (61.00%), followed by FVC (37.43%), rainfall erosivity (24.50%), slope aspect (21.26%), profile curvature (18.12%), and slope degree (10.06%). Interactions between different driving factors significantly enhanced the explanatory power of ephemeral gully head advance rates ((b)). Bi-variable mutual enhancement was observed between catchment area and slope aspect, catchment area and FVC, and catchment area and rainfall erosivity, with all other interactions non-linear. Notably, the interaction between catchment area and slope degree emerged as the dominant factor, with an explanatory power of 81.64%, followed by catchment area and FVC (81.12%), and catchment area and rainfall erosivity (80.57%). Steeper slopes are more easily to generate surface runoff, and larger catchment areas accumulate more runoff. Therefore, the interaction between slope degree and catchment area has a greater impact on ephemeral gully erosion than catchment area with FVC and rainfall erosivity.
Figure 7. OPGD-based explanatory variable exploration of ephemeral gully head advance rate: (a) factor detector, (b) interaction detector, (c) ecological detector, and (d) risk detector.
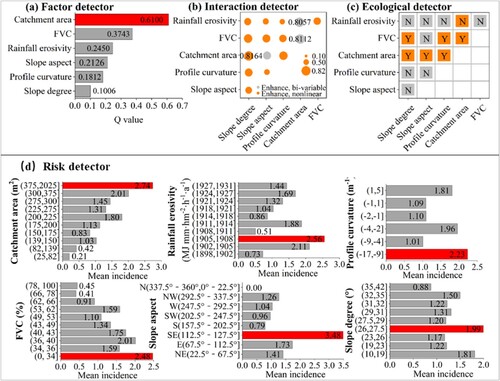
The ecological detector revealed significant differences in the spatial distribution of the ephemeral gully head advance rate between the catchment area and other driving factors and between FVC and other driving factors, except for slope aspect, using the F-statistic at a 0.05 significance level ((c)). Furthermore, the risk detector results identified high-risk areas of ephemeral gully head advance rate based on t-test results at a 0.05 significance level ((d)). These high-risk areas were characterized by catchment areas >375 m2, FVC ranging from 0 to 34%, profile curvature from –17 to –9 m m–2, cumulative rainfall erosivity from 1,905 to 1,908 MJ mm hm–2 h–1 yr–1, slope aspect from 112.5 to 127.5°, and slope degree from 26 °to 27.5°.
3.4. Relationship between main driving factors and ephemeral gully head advance rate
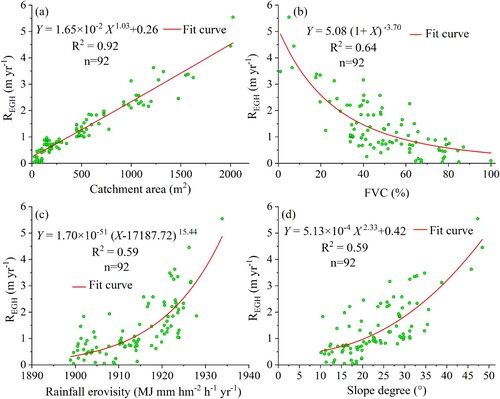
The interactions between catchment area and slope degree, rainfall erosivity, and FVC explained more than 80% of the ephemeral gully head advance rate in the OPGD model. Thus, we conducted regression analysis to explore these relationships (). The results revealed a strong power function relationship between ephemeral gully head advance rate and catchment area, slope degree, FVC, and rainfall erosivity. Specifically, the ephemeral gully head advance rate positively correlated with catchment area, slope degree, and rainfall erosivity but negatively correlated with FVC.
Figure 8. Regression function fitting curves for ephemeral gully head advance rate and (a) catchment area, (b) FVC, (c) rainfall erovisity, and (d) slope degree.
3.5. Modeling and verification of ephemeral gully head advance rate
We developed a prediction model for the ephemeral gully head advance rate using catchment area, slope degree, rainfall erosivity, and FVC as independent variables. The model was constructed based on multiple regression and correlation analyses, using 70% of the ephemeral gully heads for model building. The developed model is expressed as:
(8)
(8) where
is the ephemeral gully head advance rate (m yr–1), S is the slope of the approach channel above the ephemeral gully head (°),
is the catchment area above the ephemeral gully head (m2), R is the annual average rainfall erosivity (MJ mm hm–2 h–1 yr–1), and FVC is the fractional vegetation cover (%). The model exhibited a high coefficient of determination (
= 0.94), indicating a strong correlation between the predicted and measured values.
Based on the prediction model, we randomly selected 30% of the ephemeral gully heads to calculate the error between predicted and measured values (), resulting in a good linear fit ( = 0.92) and an acceptable error (RMSE = 0.31 m yr−1).
Figure 9. Ephemeral gully head advance rates from the field survey (measured values) and the prediction model (predicted values).
4. Discussion
4.1. Ephemeral gully head advance rate
The study revealed a wide range of ephemeral gully head advance rates (0.04–5.54 m yr−1), with an average rate of 1.37 m yr−1 from 2009 to 2021, highlighting the significant erosion dynamics occurring in the study area. Comparatively, ephemeral gully head advance rates in other semi-arid regions worldwide typically range from 0–3 m yr−1, with rates less than 1 m yr−1 recorded in Morocco, Tunisia, Romania, and Poland (). However, Ethiopia stands out with the highest recorded rate of 18.40 m yr−1. The notably higher ephemeral gully head advance rates observed in the hilly and gully areas of the Loess Plateau in China compared to other semi-arid regions can be attributed to unique combination of soil properties and climatic conditions in the region. The loose and porous nature of the loessial soil, coupled with intense and concentrated rainfall events, contributes to the heightened susceptibility to erosion. Additionally, the large catchment area above the ephemeral gully heads exacerbates erosive processes, resulting in severe headcut erosion (Hu et al. Citation2019; Li et al. Citation2022; Wang et al. Citation2020; Zhao et al. Citation2021).
4.2. Driving factors of ephemeral gully head advance rate
The OPGD model identified catchment area as the most influential single factor impacting ephemeral gully head advance rate, with the interaction between catchment area and slope degree emerging as the primary driving force. High-risk areas, characterized by elevated ephemeral gully head advance rates, were mostly distributed in regions with larger catchment areas (>375 m2), low vegetation coverage (0–34%), and specific ranges of cumulative rainfall erosivity (1,905–1,908 MJ mm hm–2 h–1 yr–1) or slope degree (26–27.5°). The catchment area plays a fundamental role in generating headcut erosion, with its size directly influencing the volume of runoff and flow kinetic energy, thus affecting the severity of headcut erosion. As a direct erosion factor, precipitation exacerbates soil erosion, particularly during high-intensity and high-frequency rainfall events (Liang et al. Citation2020; Zhao et al. Citation2020). Positive correlations between ephemeral gully head advance rate and catchment area and rainfall erosivity align with previous studies (Capra and Spada Citation2015; Han, Zheng, and Xu Citation2017; Li et al. Citation2016; Tang et al. Citation2022; Xu et al. Citation2017). Despite the uncontrollable nature of the monsoon climate on the Loess Plateau, larger catchment areas can be managed effectively through measures such as hedging or other plant engineering measures to disrupt catchment area connectivity, reduce runoff, and mitigate the impact of high-flow kinetic energy on gully head extension.
The longstanding ‘Grain for Green’ project on the Loess Plateau has yielded remarkable results (Fu et al. Citation2011; Ran et al. Citation2020; Sun et al. Citation2014), as evidenced by the negative correlation between ephemeral gully head advance rate and vegetation coverage in the study. Denser vegetation cover intercepts raindrops, reduces their velocity, and shields the soil surface from direct impact. Moreover, dense vegetation slows overland water flow, and root systems contribute to runoff reduction by enhancing soil characteristics (Chen, Guo, and Wang Citation2020; Dou et al. Citation2020; Hayas, Poesen, and Vanwalleghem Citation2017; Ran, Lu, and Xu Citation2013; Wang et al. Citation2014; Wang et al. Citation2021). Additionally, slope gradient significantly affects soil erosion, with steeper slopes dramatically increasing soil losses, particularly in areas with sparse vegetation cover (Liang and Fang Citation2021; Sun et al. Citation2014; Xu and Zhang Citation2020).
4.3. Prediction model for ephemeral gully head advance rate
Ephemeral gully headcut erosion is an indicator of severe land degradation, disrupting surrounding agricultural areas, altering watershed hydrology, and increasing sediment production (Guan et al. Citation2021). Thus, it is imperative to identify the driving factors behind ephemeral gully headcut erosion and develop a prediction model for ephemeral gully head advance rate to offer practical guidance for water and soil conservation management. While previous models such as SCS Ⅰ and SCS Ⅱ exclusively incorporated catchment area and rainfall variables, and the Thompson model included catchment area, slope degree, rainfall, and soil clay percentage to calculate ephemeral gully head advance rate (), our study revealed that four key variables – catchment area, slope degree, rainfall erovisity, and FVC – influence ephemeral gully head advance rate in the hilly and gully regions of the Loess Plateau. We integrated FVC into our prediction model, recognizing its significance as vegetation restoration efforts have substantially progressed in the hilly and gully areas of the Loess Plateau since 1999, rendering FVC an essential variable that cannot be ignored.
Table 3. Summary of global prediction models for ephemeral gully head advance rate
Between 2000 and 2020, concerted efforts to implement water and soil conservation measures such as the ‘Grain for Green’ project, sloping land conversion program, and small watershed management led to significant vegetation recovery on the Loess Plateau (Fu et al. Citation2017; Jia et al. Citation2019; Ouyang et al. Citation2016; Zhao et al. Citation2013), with NDVI values increasing by 35.66% (Chen et al. Citation2023). This vegetation recovery has reduced water and soil losses in the region, as evidenced by the significant decrease (44%) in sediment transport at the main hydrological control stations in the Yellow River in 2020, as reported in the Chinese River Sediment Official Gazette 2020 (http://xxzx.mwr.gov.cn/xxgk/gbjb/zghlnsgb/), compared to the average value recorded from 1954–2020. Our findings demonstrate a negative correlation between vegetation coverage and ephemeral gully head advance rate, affirming the pivotal role of vegetation in mitigating erosion. By incorporating FVC into the prediction model, we observed improved accuracy, highlighting the significance of accounting for vegetation dynamics in ephemeral gully headcut erosion control strategies. Furthermore, these research insights offer valuable guidance for ephemeral gully headcut erosion control on the Loess Plateau and for addressing similar challenges encountered in other regions worldwide.
4.4. Limitations and future perspectives
While our study identified key natural factors influencing ephemeral gully headcut erosion, it is important to acknowledge certain limitations and consider future research directions. Firstly, factors such as land use land cover, soil type, and geology are known to play significant roles in affecting ephemeral gully headcut erosion (Sun et al. Citation2014; Xu and Zhang Citation2020; Zhang et al. Citation2017). However, these factors were not included in our analysis due to a lack of significant differences in their distribution across ephemeral gully headcut erosion location. Future research could explore integrating these factors into the modeling framework to provide a more comprehensive understanding of ephemeral gully headcut erosion dynamics.
Secondly, our study did not explicitly consider the impact of frequent and high-intensity rainstorm events on ephemeral gully headcut erosion. Given the increasing occurrence of extreme weather events in recent years, investigating the influence of rainstorm events on ephemeral gully headcut erosion dynamics represents an important avenue for future research.
Lastly, our prediction model for ephemeral gully head advance rate is based on data from a single watershed in the hilly and gully region of the Loess Plateau. Validating and refining the model using data from multiple regional watersheds would improve its robustness and generalizability.
5. Conclusion
Ephemeral gully erosion, particularly at the gully head, poses significant challenges to soil and water conservation efforts, especially in regions like the Loess Plateau. Our study focused on ephemeral gully headcut erosion in the hilly and gully regions of the Loess Plateau, shedding light on its spatial distribution and key influencing factors. Our analysis highlighted catchment area as the most significant single factor influencing ephemeral gully head advance rates. Additionally, our OPGD model underscored the importance of interactions between catchment area and slope degree, rainfall erosivity, and vegetation coverage in predicting ephemeral gully head advance rates. Incorporating vegetation coverage (FVC) into our prediction model further enhanced its accuracy. By developing a prediction model that incorporates these driving factors, including FVC, we aim to provide land managers with a valuable tool for implementing effective soil and water conservation measures. Strategies like hedges or other bioengineering measures can increase vegetation coverage, divide catchment areas, reduce runoff accumulation, and mitigate ephemeral gully head advancement. Our research contributes to a better understanding of ephemeral gully headcut erosion and offers practical guidance for land management planning in semi-arid and arid regions like the Loess Plateau. Moreover, the insights gained from our study can inform conservation efforts in other loess regions worldwide, aiding in the sustainability of these ecologically sensitive areas.
Acknowledgments
This research was supported by the National Natural Science Foundation of China (41977064) and National Key R&D Program of China (2021YFD1900700). The authors express their gratitude to their colleagues in their research group for their help with the experiments.
Disclosure statement
No potential conflict of interest was reported by the authors.
Additional information
Funding
References
- Amundson, Ronald, Asmeret Asefaw Berhe, Jan W. Hopmans, Carolyn Olson, A. Ester Sztein, and Donald L. Sparks. 2015. “Soil and Human Security in the 21st Century.” Science 348: 1261071. https://doi.org/10.1126/science.1261071.
- Arabameri, Alireza, Fatemeh Rezaie, Subodh Chandra Pal, Artemi Cerda, Asish Saha, Rabin Chakrabortty, and Saro Lee. 2021. “Modelling of Piping Collapses and Gully Headcut Landforms: Evaluating Topographic Variables from Different Types of DEM.” Geoscience Frontiers 12 (6): 101230. https://doi.org/10.1016/j.gsf.2021.101230.
- Bhardwaj, Atul Jatinder Kaur, Melinda Wuest, and Frank Wuest. 2017. “In Situ Click Chemistry Generation of Cyclooxygenase-2 Inhibitors.” Nature Communications 8: 1. https://doi.org/10.1038/s41467-016-0009-6.
- Borrelli, Pasquale, David A. Robinson, Larissa R. Fleischer, Emanuele Lugato, Cristiano Ballabio, Christine Alewell, Katrin Meusburger, et al. 2017. “An Assessment of the Global Impact of 21st Century Land use Change on Soil Erosion.” Nature Communications 8: 2013. https://doi.org/10.1038/s41467-017-02142-7.
- Capra, Antonina, and Carmelo La Spada. 2015. “Medium-term Evolution of Some Ephemeral Gullies in Sicily (Italy).” Soil and Tillage Research 154: 34–43. https://doi.org/10.1016/j.still.2015.07.001.
- Chaplot, Vincent. 2013. “Impact of Terrain Attributes, Parent Material and Soil Types on Gully Erosion.” Geomorphology 186: 1–11. https://doi.org/10.1016/j.geomorph.2012.10.031.
- Chen, Zhouxin, Mingming Guo, and Wenlong Wang. 2020. “Variations in Soil Erosion Resistance of Gully Head Along a 25-Year Revegetation Age on the Loess Plateau.” Water 12 (12): 3301. https://doi.org/10.3390/w12123301.
- Chen, Shifeng, Qifei Zhang, Yaning Chen, Honghua Zhou, Yanyun Xiang, Zhihui Liu, and Yifeng Hou. 2023. “Vegetation Change and Eco-Environmental Quality Evaluation in the Loess Plateau of China from 2000 to 2020.” Remote Sensing 15 (2): 424. https://doi.org/10.3390/rs15020424.
- Chowdhuri, Indrajit, Subodh Chandra Pal, Asish Saha, Rabin Chakrabortty, and Paramita Roy. 2021. “Evaluation of Different DEMs for Gully Erosion Susceptibility Mapping Using in-Situ Field Measurement and Validation.” Ecological Informatics 65: 101425. https://doi.org/10.1016/j.ecoinf.2021.101425.
- Conoscenti, Christian, Valerio Agnesi, Silvia Angileri, Chiara Cappadonia, Edoardo Rotigliano, and Michael Märker. 2013. “A GIS-Based Approach for Gully Erosion Susceptibility Modelling: A Test in Sicily, Italy.” Environmental Earth Sciences 70: 1179–1195. https://doi.org/10.1007/s12665-012-2205-y.
- Dai, Wen, Guanghui Hu, Xin Yang, Xianwu Yang, Yihan Cheng, Liyang Xiong, Josef Strobl, and Guoan Tang. 2020. “Identifying Ephemeral Gullies from High-Resolution Images and DEMs Using Flow-Directional Detection.” Journal of Mountain Science 17: 3024–3038. https://doi.org/10.1007/s11629-020-6084-5.
- Dou, Yanxing, Yang Yang, Shaoshan An, and Zhaolong Zhu. 2020. “Effects of Different Vegetation Restoration Measures on Soil Aggregate Stability and Erodibility on the Loess Plateau, China.” Catena 185: 104294. https://doi.org/10.1016/j.catena.2019.104294.
- FAO. 2019. Soil Erosion: The Greatest Challenge for Sustainable Soil Management. Rome, Italy: Food and Agriculture Organization of the United Nations.
- Feng, Lanqian, Wenlong Wang, Mingming Guo, Qianhua Shi, Wenzhao Guo, Yibao Lou, Hongliang Kang, and Zhouxin Chen. 2022. “Effects of Grass Density on the Runoff Hydraulic Characteristics and Sediment Yield in Gully Headcut Erosion Processes.” Hydrological Processes 36 (8): e14643. https://doi.org/10.1002/hyp.14643.
- Fiorucci, Federica, Francesca Ardizzone, Mauro Rossi, and Dino Torri. 2015. “The Use of Stereoscopic Satellite Images to Map Rills and Ephemeral Gullies.” Remote Sensing 7 (10): 14151–14178. https://doi.org/10.3390/rs71014151.
- Frankl, Amaury, Jean Poesen, Jozef Deckers, Mitiku Haile, and Jan Nyssen. 2012. “Gully Head Retreat Rates in the Semi-Arid Highlands of Northern Ethiopia.” Geomorphology 173-174: 185–195. https://doi.org/10.1016/j.geomorph.2012.06.011.
- Fu, Bojie, Yu Liu, Yihe Lü, Chansheng He, Yuan Zeng, and Bingfang Wu. 2011. “Assessing the Soil Erosion Control Service of Ecosystems Change in the Loess Plateau of China.” Ecological Complexity 8 (4): 284–293. https://doi.org/10.1016/j.ecocom.2011.07.003.
- Fu, Bojie, Shuai Wang, Yu Liu, Jianbo Liu, Wei Liang, and Chiyuan Miao. 2017. “Hydrogeomorphic Ecosystem Responses to Natural and Anthropogenic Changes in the Loess Plateau of China.” Annual Review of Earth and Planetary Sciences 45: 223-243. https://doi.org/10.1146/annurev-earth-063016-020552.
- Garosi, Younes, Mohsen Sheklabadi, Christian Conoscenti, Hamid Reza Pourghasemi, and Kristof Van Oost. 2019. “Assessing the Performance of GIS- Based Machine Learning Models with Different Accuracy Measures for Determining Susceptibility to Gully Erosion.” Science of The Total Environment 664: 1117–1132. https://doi.org/10.1016/j.scitotenv.2019.02.093.
- Grellier, Séraphine, Jaco Kemp, Jean-Louis Janeau, Nicolas Florsch, David Ward, Sébastien Barot, Pascal Podwojewski, Simon Lorentz, and Christian Valentin. 2012. “The Indirect Impact of Encroaching Trees on Gully Extension: A 64 Year Study in a sub-Humid Grassland of South Africa.” CATENA 98: 110-119. https://doi.org/10.1016/J.CATENA.2012.07.002.
- Guan, Yabing, Shengtian Yang, Changsen Zhao, Hezhen Lou, Ke Chen, Chunbin Zhang, and Bowei Wu. 2021. “Monitoring Long-Term Gully Erosion and Topographic Thresholds in the Marginal Zone of the Chinese Loess Plateau.” Soil & Tillage Research 205: 104800. https://doi.org/10.1016/j.still.2020.104800.
- Gudino-Elizondo, Napoleon, Trent W. Biggs, Carlos Castillo, Ronald L. Bingner, Eddy J. Langendoen, Kristine T. Tangiguchi, Thomas Kretzschmar, Yongping Yuan, and Douglas Liden. 2018. “Measuring Ephemeral Gully Erosion Rates and Topographical Thresholds in an Urban Watershed Using Unmanned Aerial Systems and Structure from Motion Photogrammetric Techniques.” Land Degradation & Development 29 (6): 1896–1905. https://doi.org/10.1002/ldr.2976.
- Guo, Mingming, Wenlong Wang, Qianhua Shi, Tongde Chen, Hongliang Kang, and Jianming Li. 2019. “An Experimental Study on the Effects of Grass Root Density on Gully Headcut Erosion in the Gully Region of China’s Loess Plateau.” Land Degradation & Development 30 (17): 2107–2125. https://doi.org/10.1002/ldr.3404.
- Gutman, G., and A. Ignatov. 1998. “The Derivation of the Green Vegetation Fraction from NOAA/AVHRR Data for use in Numerical Weather Prediction Models.” International Journal of Remote Sensing 19 (8): 1533–1543. https://doi.org/10.1080/014311698215333.
- Han, Yong, Fenli Zheng, and Ximeng Xu. 2017. “Effects of Rainfall Regime and its Character Indices on Soil Loss at Loessial Hillslope with Ephemeral Gully.” Journal of Mountain Science 14: 527–538. https://doi.org/10.1007/s11629-016-3934-2.
- Hayas, Antonio, Jean Poesen, and Tom Vanwalleghem. 2017. “Rainfall and Vegetation Effects on Temporal Variation of Topographic Thresholds for Gully Initiation in Mediterranean Cropland and Olive Groves.” Land Degradation & Development 28 (8): 2540–2552. https://doi.org/10.1002/ldr.2805.
- Hu, Jinfei, Peng Gao, Xingmin Mu, Guangju Zhao, Wenyi Sun, Pengfei Li, and Limei Zhang. 2019. “Runoff-sediment Dynamics Under Different Flood Patterns in a Loess Plateau Catchment, China.” CATENA 173: 234–245. https://doi.org/10.1016/j.catena.2018.10.023.
- Ionita, Ion. 2006. “Gully Development in the Moldavian Plateau of Romania.” CATENA 68 (2-3): 133–140. https://doi.org/10.1016/j.catena.2006.04.008.
- Jia, Lizhi, Wenwu Zhao, Ruijie Zhai, Yue Liu, Meimei Kang, and Xiao Zhang. 2019. “Regional Differences in the Soil and Water Conservation Efficiency of Conservation Tillage in China.” CATENA 175: 18–26. https://doi.org/10.1016/j.catena.2018.12.012.
- Jiang, Chengcheng, Wen Fan, Ningyu Yu, and Yalin Nan. 2021. “A New Method to Predict Gully Head Erosion in the Loess Plateau of China Based on SBAS-InSAR.” Remote Sensing 13 (3): 421. https://doi.org/10.3390/rs13030421.
- Kariminejad, Narges, Mohsen Hosseinalizadeh, Hamid Reza Pourghasemi, Anita Bernatek-Jakiel, Giandiego Campetella, and Majid Ownegh. 2019. “Evaluation of Factors Affecting Gully Headcut Location Using Summary Statistics and the Maximum Entropy Model: Golestan Province, NE Iran.” Science of the Total Environment 677: 281–298. https://doi.org/10.1016/j.scitotenv.2019.04.306.
- Karydas, Christos, and Panos Panagos. 2020. “Towards an Assessment of the Ephemeral Gully Erosion Potential in Greece Using Google Earth.” Water 12 (2): 603. https://doi.org/10.3390/w12020603.
- Li, Pengfei, Jiannan Chen, Guangju Zhao, Joseph Holden, Bintao Liu, Faith Ka Shun Chan, Jinfei Hu, Peili Wu, and Xingmin Mu. 2022. “Determining the Drivers and Rates of Soil Erosion on the Loess Plateau Since 1901.” Science of the Total Environment 823: 153674. https://doi.org/10.1016/j.scitotenv.2022.153674.
- Li, Guifang, Fenli Zheng, Jia Lu, Ximeng Xu, Wei Hu, and Yong Han. 2016. “Inflow Rate Impact on Hillslope Erosion Processes and Flow Hydrodynamics.” Soil Science Society of America Journal 80 (3): 711–719. https://doi.org/10.2136/sssaj2016.02.0025.
- Liang, Shizhengxiong, and Haiyan Fang. 2021. “Quantitative Analysis of Driving Factors in Soil Erosion Using Geographic Detectors in Qiantang River Catchment, Southeast China.” Journal of Soils and Sediments 21: 134–147. https://doi.org/10.1007/s11368-020-02756-3.
- Liang, Yue, Juying Jiao, Bingzhe Tang, Binting Cao, and Hang Li. 2020. “Response of Runoff and Soil Erosion to Erosive Rainstorm Events and Vegetation Restoration on Abandoned Slope Farmland in the Loess Plateau Region, China.” Journal of Hydrology 584: 124694. https://doi.org/10.1016/j.jhydrol.2020.124694.
- Liu, Boyang, Biao Zhang, Hao Feng, Shufang Wu, Jiangtao Yang, Yufeng Zou, and Kadambot H.M. Siddique. 2022. “Ephemeral Gully Recognition and Accuracy Evaluation Using Deep Learning in the Hilly and Gully Region of the Loess Plateau in China.” International Soil and Water Conservation Research 10 (3): 371–381. https://doi.org/10.1016/j.iswcr.2021.10.004.
- Liu, Boyang, Biao Zhang, Ziming Yin, Bai Hao, Shufang Wu, Hao Feng, and Kadambot H. M. Siddique. 2024. “Ephemeral Gully Development in the Hilly and Gully Region of China's Loess Plateau.” Land Degradation & Development 35 (1): 128–141. https://doi.org/10.1002/ldr.4904.
- Maaoui, Mohamed Amine El, Mennoubi Sfar Felfoul, Mohamed Rached Boussema, and Mohamed Habib Snane. 2012. “Sediment Yield from Irregularly Shaped Gullies Located on the Fortuna Lithologic Formation in Semi-Arid Area of Tunisia.” CATENA 93: 97–104. https://doi.org/10.1016/J.CATENA.2012.02.004.
- Maher, Barbara A. 2016. “Palaeoclimatic Records of the Loess/Palaeosol Sequences of the Chinese Loess Plateau.” Quaternary Science Reviews 154: 23–84. https://doi.org/10.1016/j.quascirev.2016.08.004.
- Malik, Ireneusz. 2008. “Dating of Small Gully Formation and Establishing Erosion Rates in old Gullies Under Forest by Means of Anatomical Changes in Exposed Tree Roots (Southern Poland).” Geomorphology 93 (3-4): 421–436. https://doi.org/10.1016/j.geomorph.2007.03.007.
- Martı́nez-Casasnovas, J. A. 2003. “A Spatial Information Technology Approach for the Mapping and Quantification of Gully Erosion.” CATENA 50 (2-4): 293–308. https://doi.org/10.1016/S0341-8162(02)00134-0.
- Marzolff, Irene, and Johannes B. Ries. 2007. “Gully Erosion Monitoring in Semi-Arid Landscapes.” Zeitschrift Fur Geomorphologie 51 (4): 405–425. https://doi.org/10.1127/0372-8854/2007/0051-0405.
- Maugnard, Alexandre, Hélène Cordonnier, Aurore Degre, Pierre Demarcin, Nathalie Pineux, and Charles L. Bielders. 2014. “Uncertainty Assessment of Ephemeral Gully Identification, Characteristics and Topographic Threshold When Using Aerial Photographs in Agricultural Settings.” Earth Surface Processes and Landforms 39 (10): 1319–1330. https://doi.org/10.1002/esp.3526.
- Mohebzadeh, Hamid, Asim Biswas, Ben DeVries, Ramesh Rudra, and Prasad Daggupati. 2024. “Transferability of Predictive Models to map Susceptibility of Ephemeral Gullies at Large Scale.” Natural Hazards 120: 4527–4561. https://doi.org/10.1007/s11069-023-06377-0.
- Montanarella, Luca, Daniel Jon Pennock, Neil McKenzie, Mohamed Badraoui, Victor Chude, Isaurinda Baptista, Tekalign Mamo, et al. 2016. “World’s Soils are Under Threat.” Soil 2 (1): 79–82. https://doi.org/10.5194/soil-2-79-2016.
- Mukai, Shiro. 2017. “Gully Erosion Rates and Analysis of Determining Factors: A Case Study from the Semi-Arid Main Ethiopian Rift Valley.” Land Degradation & Development 28 (2): 602–615. https://doi.org/10.1002/ldr.2532.
- Nachtergaele, J., and J. Poesen. 1999. “Assessment of Soil Losses by Ephemeral Gully Erosion Using High-Altitude (Stereo) Aerial Photographs.” Earth Surface Processes and Landforms 24 (8): 693–706. https://doi.org/10.1002/(SICI)1096-9837(199908)24:8<693::AID-ESP992>3.0.CO;2-7.
- Nazari Samani, Aliakbar, Hassan Ahmadi, Aliasghar Mohammadi, Jamal Ghoddousi, Ali Salajegheh, Guy Boggs, and Razieh Pishyar. 2010. “Factors Controlling Gully Advancement and Models Evaluation (Hableh Rood Basin, Iran).” Water Resources Management 24: 1531–1549. https://doi.org/10.1007/s11269-009-9512-4.
- Nazari Samani, Aliakbar, Fatemeh Tavakoli Rad, Maryam Azarakhshi, Mohammad Reza Rahdari, and Jesús Rodrigo-Comino. 2018. “Assessment of the Sustainability of the Territories Affected by Gully Head Advancements Through Aerial Photography and Modeling Estimations: A Case Study on Samal Watershed, Iran.” Sustainability 10 (8): 2909. https://doi.org/10.3390/su10082909.
- Nyssen, Jan, Jean Poesen, Jan Moeyersons, MaudeVeyret-Picot Edith Luyten, Jozef Deckers, Mitiku Haile, and Gerard Govers. 2002. “Impact of Road Building on Gully Erosion Risk: A Case Study from the Northern Ethiopian Highlands.” Earth Surface Processes and Landforms 27 (12): 1267–1283. https://doi.org/10.1002/esp.404.
- O’Brien, Robert M. 2007. “A Caution Regarding Rules of Thumb for Variance Inflation Factors.” Quality & Quantity 41: 673–690. https://doi.org/10.1007/s11135-006-9018-6.
- Oostwoud Wijdenes, D. J., and R. Bryan. 2001. “Gully-head Erosion Processes on a Semi-Arid Valley Floor in Kenya: A Case Study Into Temporal Variation and Sediment Budgeting.” Earth Surface Processes and Landforms 26 (9): 911–933. https://doi.org/10.1002/esp.225.
- Ouyang, Zhiyun, Hua Zheng, Yi Xiao, Stephen Polasky, Jianguo Liu, Weihua Xu, Qiao Wang, et al. 2016. “Improvements in Ecosystem Services from Investments in Natural Capital.” Science 352 (6292): 1455–1459. https://doi.org/10.1126/science.aaf2295.
- Pal, Subodh Chandra, Rabin Chakrabortty, Alireza Arabameri, M. Santosh, Asish Saha, Indrajit Chowdhuri, Paramita Roy, and Manisa Shit. 2022. “Chemical Weathering and Gully Erosion Causing Land Degradation in a Complex River Basin of Eastern India: An Integrated Field, Analytical and Artificial Intelligence Approach.” Natural Hazards 110: 847–879. https://doi.org/10.1007/s11069-021-04971-8.
- Pal, Subodh Chandra, Rabin Chakrabortty, Paramita Roy, Indrajit Chowdhuri, Biswajit Das, Asish Saha, and Manisa Shit. 2021. “Changing Climate and Land use of 21st Century Influences Soil Erosion in India.” Gondwana Research 94: 164–185. https://doi.org/10.1016/j.gr.2021.02.021.
- Pourghasemi, Hamid Reza, Saleh Yousefi, Aiding Kornejady, and Artemi Cerdà. 2017. “Performance Assessment of Individual and Ensemble Data-Mining Techniques for Gully Erosion Modeling.” Science of The Total Environment 609: 764–775. https://doi.org/10.1016/j.scitotenv.2017.07.198.
- Ran, Lishan, Xixi Lu, and Jianchu Xu. 2013. “Effects of Vegetation Restoration on Soil Conservation and Sediment Loads in China: A Critical Review.” Critical Reviews in Environmental Science and Technology 43 (13): 1384–1415. https://doi.org/10.1080/10643389.2011.644225.
- Ran, Qihua, Xinyi Zong, Sheng Ye, Jihui Gao, and Yanyan Hong. 2020. “Dominant Mechanism for Annual Maximum Flood and Sediment Events Generation in the Yellow River Basin.” CATENA 187: 104376. https://doi.org/10.1016/j.catena.2019.104376.
- Reece, David A., John A. Lory, Timothy L. Haithcoat, Brian K. Gelder, and Richard Cruse. 2023. “Using Google Earth Imagery to Target Assessments of Ephemeral Gully Erosion.” Journal of the ASABE 66 (1): 155–166. https://doi.org/10.13031/ja.15254.
- Rengers, Francis K., and Greg E. Tucker. 2015. “The Evolution of Gully Headcut Morphology: A Case Study Using Terrestrial Laser Scanning and Hydrological Monitoring.” Earth Surface Processes and Landforms 40 (10): 1304–1317. https://doi.org/10.1002/esp.3721.
- Roshan, Gholamreza., and Saeed Negahban. 2015. “Modeling of the Effects of Climate Change on Rainy and Gully Erosion Potential of Kor-Chamriz Watershed in Fars Province.” Modeling Earth Systems and Environment 1: 26. https://doi.org/10.1007/s40808-015-0031-4.
- Roy, Paramita, Subodh Chandra Pal, Saeid Janizadeh, Rabin Chakrabortty, Abu Reza Md, Towfiqul Islam, Indrajit Chowdhuri, and Asish Saha. 2022. “Evaluation of Climate Change Impacts on Future Gully Erosion Using Deep Learning and Soft Computational Approaches.” Geocarto International 37 (26): 12709–12745. https://doi.org/10.1080/10106049.2022.2071473.
- Saha, Asish, Subodh Chandra Pal, Indrajit Chowdhuri, Abu Reza Md. Towfiqul Islam, Rabin Chakrabortty, and Paramita Roy. 2022. “Application of Neural Network Model-Based Framework Approach to Identify Gully Erosion Potential Hotspot Zones in sub-Tropical Environment.” Geocarto International 37 (26): 14758–14784. https://doi.org/10.1080/10106049.2022.2091042.
- Song, Yongze, Jinfeng Wang, Yong Ge, and Chengdong Xu. 2020. “An Optimal Parameters-Based Geographical Detector Model Enhances Geographic Characteristics of Explanatory Variables for Spatial Heterogeneity Analysis: Cases with Different Types of Spatial Data.” GIScience & Remote Sensing 57 (5): 593–610. https://doi.org/10.1080/15481603.2020.1760434.
- Sun, Wenyi, Quanqin Shao, Jiyuan Liu, and Jun Zhai. 2014. “Assessing the Effects of Land use and Topography on Soil Erosion on the Loess Plateau in China.” CATENA 121: 151–163. https://doi.org/10.1016/j.catena.2014.05.009.
- Sun, Long, Guanghui Zhang, Fa Liu, and Lili Luan. 2016. “Effects of Incorporated Plant Litter on Soil Resistance to Flowing Water Erosion in the Loess Plateau of China.” Biosystems Engineering 147: 238–247. https://doi.org/10.1016/j.biosystemseng.2016.04.017.
- Tang, Guoan, Xiaodong Song, Fayuan Li, Yong Zhang, and Liyang Xiong. 2015. “Slope Spectrum Critical Area and its Spatial Variation in the Loess Plateau of China.” Journal of Geographical Sciences 25: 1452–1466. https://doi.org/10.1007/s11442-015-1245-0.
- Tang, Jie, Yun Xie, Chuan Liu, Hanlin Dong, and Gang Liu. 2022. “Effects of Rainfall Characteristics and Contour Tillage on Ephemeral Gully Development in a Field in Northeastern China.” Soil and Tillage Research 218: 105312. https://doi.org/10.1016/j.still.2021.105312.
- Teasdale, Gregg N., and Michael E. Barber. 2008. “Aerial Assessment of Ephemeral Gully Erosion from Agricultural Regions in the Pacific Northwest.” Journal of Irrigation and Drainage Engineering 134 (6): 807. https://doi.org/10.1061/(ASCE)0733-9437(2008)134:6(807).
- Tebebu, T. Y., A. Z. Abiy, A. D. Zegeye, H. E. Dahlke, Z. M. Easton, S. A. Tilahun, A. S. Collick, et al. 2010. “Surface and Subsurface Flow Effect on Permanent Gully Formation and Upland Erosion Near Lake Tana in the Northern Highlands of Ethiopia.” Hydrology and Earth System Sciences 14 (11): 2207–2217. https://doi.org/10.5194/hess-14-2207-2010.
- Thompson, James. R. 1964. “Quantitative Effect of Watershed Variables on Rate of Gully-Head Advancement.” Transactions of the ASAE 7 (1): 54–55. https://doi.org/10.13031/2013.40694.
- Torri, Dino, Jean Poesen, Mauro Rossi, Valerio Amici, Daniele Spennacchi, and Cati Cremer. 2018. “Gully Head Modelling: A Mediterranean Badland Case Study.” Earth Surface Processes and Landforms 43 (12): 2547–2561. https://doi.org/10.1002/esp.4414.
- United States Department of Agriculture (USDA). 1966. “Procedure for Determining Rates of Land Damage, Land Depreciation and Volume of Sediment Produced by Gully Erosion.” USDA Soil Conservation Service Technical Release No. 32; USDA: Washington, DC, USA.
- Vandaele, K., J. Poesen, J. R. Marques De Silva, G. Govers, and P. Desmet. 1997. “Assessment of Factors Controlling Ephemeral Gully Erosion in Southern Portugal and Central Belgium Using Aerial Photographs.” Zeitschrift Fur Geomorphologie 41 (3): 273–287. https://doi.org/10.1127/zfg/41/1997/273.
- Vanmaercke, Matthias, Jean Poesen, Bert Van Mele, Matthias Demuzere, Amber Bruynseels, Valentin Golosov, José Fernando Rodrigues Bezerra, et al. 2016. “How Fast do Gully Headcuts Retreat?” Earth-Science Reviews 154: 336–355. https://doi.org/10.1016/j.earscirev.2016.01.009.
- Wang, Jiaxi, Conghui Fan, Yan Zhang, and Zhen Li. 2022. “Gully Head Activity and its Influencing Factors in China’s Loess Plateau.” Journal of Soils and Sediments 22: 1792–1803. https://doi.org/10.1007/s11368-022-03182-3.
- Wang, Nan, Juying Jiao, Leichao Bai, Yifeng Zhang, Yixian Chen, Bingzhe Tang, Yue Liang, Chunjing Zhao, and Haolin Wang. 2020. “Magnitude of Soil Erosion in Small Catchments with Different Land use Patterns Under an Extreme Rainstorm Event Over the Northern Loess Plateau, China.” CATENA 195: 104780. https://doi.org/10.1016/j.catena.2020.104780.
- Wang, Jinfeng, Xinhu Li, George Christakos, Yilan Liao, Tin Zhang, Xue Gu, and Xiaoying Zheng. 2010. “Geographical Detectors-Based Health Risk Assessment and its Application in the Neural Tube Defects Study of the Heshun Region, China.” International Journal of Geographical Information Science 24 (1): 107–127. https://doi.org/10.1080/13658810802443457.
- Wang, Dongdong, Zaijian Yuan, Yitong Cai, Dawei Jing, Fen Liu, Yan Tang, Ningning Song, Yangyang Li, Chunyu Zhao, and Xiuyong Fu. 2021. “Characterisation of Soil Erosion and Overland Flow on Vegetation-Growing Slopes in Fragile Ecological Regions: A Review.” Journal of Environmental Management 285: 112165. https://doi.org/10.1016/j.jenvman.2021.112165.
- Wang, Bing, Guanghui Zhang, Yangyang Shi, and X. C. Zhang. 2014. “Soil Detachment by Overland Flow Under Different Vegetation Restoration Models in the Loess Plateau of China.” CATENA 116: 51–59. https://doi.org/10.1016/j.catena.2013.12.010.
- Wu, Hongyan, Ximeng Xu, Fenli Zheng, Chao Qin, and Xu He. 2018. “Gully Morphological Characteristics in the Loess Hilly-Gully Region Based on 3D Laser Scanning Technique.” Earth Surface Processes and Landforms 43 (8): 1701–1710. https://doi.org/10.1002/esp.4332.
- Xie, Wei, Xiaoshuang Li, Wenbin Jian, Yang Yang, Hongwei Liu, Luis F. Robledo, and Wen Nie. 2021. “A Novel Hybrid Method for Landslide Susceptibility Mapping-Based GeoDetector and Machine Learning Cluster: A Case of Xiaojin County, China.” ISPRS International Journal of Geo-Information 10 (2): 93. https://doi.org/10.3390/ijgi10020093.
- Xu, Qiang, Pinglang Kou, Cuilin Wang, Ali P. Yunus, Jianqiang Xu, Shuangqi Peng, and Chaoyang He. 2019. “Evaluation of Gully Head Retreat and Fill Rates Based on High-Resolution Satellite Images in the Loess Region of China.” Environmental Earth Sciences 78: 465. https://doi.org/10.1007/s12665-019-8483-x.
- Xu, Erqi, and Hongqi Zhang. 2020. “Change Pathway and Intersection of Rainfall, Soil, and Land use Influencing Water-Related Soil Erosion.” Ecological Indicators 113: 106281. https://doi.org/10.1016/j.ecolind.2020.106281.
- Xu, Ximeng, Fenli Zheng, Glenn V. Wilson, and Min Wu. 2017. “Upslope Inflow, Hillslope Gradient, and Rainfall Intensity Impacts on Ephemeral Gully Erosion.” Land Degradation & Development 28 (8): 2623–2635. https://doi.org/10.1002/ldr.2825.
- Yang, Xin, Wen Dai, Guoan Tang, and Min Li. 2017. “Deriving Ephemeral Gullies from VHR Image in Loess Hilly Areas Through Directional Edge Detection.” ISPRS International Journal of Geo-Information 6 (11): 371. https://doi.org/10.3390/ijgi6110371.
- Yibeltal, Mesenbet, Atsushi Tsunekawa, Nigussie Haregeweyn, Enyew Adgo, Derege Tsegaye Meshesha, Tsugiyuki Masunaga, Mitsuru Tsubo, Paolo Billi, Kindiye Ebabu, Ayele Almaw Fenta, et al. 2019. “Morphological Characteristics and Topographic Thresholds of Gullies in Different Agro-Ecological Environments.” Geomorphology 341: 15–27. https://doi.org/10.1016/j.geomorph.2019.05.012.
- Zegeye, Assefa D., Eddy J. Langendoen, Cathelijne R. Stoof, Seifu A. Tilahun, Dessalegn C. Dagnew, Fasikaw A. Zimale, Christian D. Guzman, Birru Yitaferu, and Tammo S. Steenhuis. 2016. “Morphological Dynamics of Gully Systems in the Subhumid Ethiopian Highlands: The Debre Mawi Watershed.” SOIL 2 (3): 443–458. https://doi.org/10.5194/soil-2-443-2016.
- Zhang, Shanghong, Weiwei Fan, Yueqiang Li, and Yujun Yi. 2017. “The Influence of Changes in Land use and Landscape Patterns on Soil Erosion in a Watershed.” Science of the Total Environment 574: 34–45. https://doi.org/10.1016/j.scitotenv.2016.09.024.
- Zhang, Wenbo, and Jinsheng Fu. 2003. “Rainfall Erosivity Estimation Under Different Rainfall Amount.” Resources Science 25 (1): 35–41.
- Zhang, Yaru, Yi He, Yanlin Li, and Liping Jia. 2022. “Spatiotemporal Variation and Driving Forces of NDVI from 1982 to 2015 in the Qinba Mountains, China.” Environmental Science and Pollution Research 29: 52277–52288. https://doi.org/10.1007/s11356-022-19502-6.
- Zhao, Longshan, Qian Fang, Rui Hou, and Faqi Wu. 2021. “Effect of Rainfall Intensity and Duration on Soil Erosion on Slopes with Different Microrelief Patterns.” Geoderma 396: 115085. https://doi.org/10.1016/j.geoderma.2021.115085.
- Zhao, Longshan, Qian Fang, Ye Yang, Hao Yang, Tonghang Yang, and Hao Zheng. 2020. “Stemflow Contributions to Soil Erosion Around the Stem Base Under Simulated Maize-Planted and Rainfall Conditions.” Agricultural and Forest Meteorology 281: 107814. https://doi.org/10.1016/j.agrformet.2019.107814.
- Zhao, G., X. Mu, Z. Wen, F. Wang, and P. Gao. 2013. “Soil Erosion, Conservation, and eco-Environment in the Loess Plateau of China.” Land Degradation & Development 24 (5): 499–510. https://doi.org/10.1002/ldr.2246.
- Zhou, Xinzhi, Haijia Wen, Yalan Zhang, Jiahui Xu, and Wengang Zhang. 2021. “Landslide Susceptibility Mapping Using Hybrid Random Forest with GeoDetector and RFE for Factor Optimization.” Geoscience Frontiers 12 (5): 101211. https://doi.org/10.1016/j.gsf.2021.101211.
- Zhu, Lijun, Jijun Meng, and Likai Zhu. 2020. “Applying Geodetector to Disentangle the Contributions of Natural and Anthropogenic Factors to NDVI Variations in the Middle Reaches of the Heihe River Basin.” Ecological Indicators 117: 106545. https://doi.org/10.1016/j.ecolind.2020.106545.