
 ?Mathematical formulae have been encoded as MathML and are displayed in this HTML version using MathJax in order to improve their display. Uncheck the box to turn MathJax off. This feature requires Javascript. Click on a formula to zoom.
ABSTRACT
This study investigates the joint effect of air pollution and different types of green spaces (e.g. mixed forests) on stress levels in South Korea. Two periods were examined: before the COVID-19 pandemic (2017–2019) and during the COVID-19 pandemic (2020–2022). We used 16 total parameters for our Random Forest model. Stress was the dependent variable, and 15 other variables were independent parameters. Our focused independent parameters were PM10 and green spaces (forest types). Our findings show that mixed forests reduce stress, particularly when pollution levels are low. In addition, is associated with increased stress levels, and this relationship became stronger during the COVID-19. These findings indicate that protecting mixed forests and improving air quality may improve people’s mental health. This study provides insights into how cities can be made healthier and happier places to live, particularly during challenging periods such as a pandemic.
1. Introduction
Stress is a critical public health concern globally and its determining factors are complex. Long-term elevated stress can cause serious health issues (O'Connor, Thayer, and Vedhara Citation2021), with untreated long-term chronic stress associated with fatty liver, cardiovascular disorders, weight gain or loss, immune system deficiencies, gastrointestinal discomfort, and even cancer (Chen et al. Citation2020; Ndrepepa Citation2019; Rasheed Citation2016; Russell and Lightman Citation2019). Although the prevalence of stress in South Korea is comparatively lower, stress levels continue to be significant among specific populations, such as women, who have a higher susceptibility to stress (Bras Citation2018; Park, Lee, and Kim Citation2022; Lee et al. Citation2023). Furthermore, individuals from higher-income households have a lower prevalence of stress-related symptoms than those from lower-income households (Lee, Choi, and Lee Citation2022; Nochaiwong et al. Citation2021).
The positive effects of green spaces on human well-being, including both physical and mental health benefits, have long been recognized, which include parks, gardens, and urban forests, (Burnett, Olsen, and Mitchell Citation2022; Keniger et al. Citation2013; Ulrich et al. Citation1991). Furthermore, exposure to green spaces has been associated with reduced stress levels, enhanced mood, and improved cognitive functioning (Jimenez et al. Citation2021). Recent research conducted in South Korea before the COVID-19 pandemic showed that individuals who increased their visit of green spaces and were exposed to lower levels of air pollution (such as PM10, which comprises particulate matter with a diameter of 10 µm or less), showed positive improvements in their mental health outcomes (Kim and Kim Citation2017; Shin, Park, and Choi Citation2018). Conversely, individuals who reduced their visit of green spaces during the pandemic were approximately twice as likely to experience potential negative mental health issues than those who maintained or increased their use of green spaces (Heo et al. Citation2021).
Before the COVID-19 pandemic, various studies had developed an understanding of the stress-reducing effects of green spaces and the negative impact of air pollution on mental health. Several studies (Hedblom et al. Citation2019; Van den Berg et al. Citation2010; Wood et al. Citation2017; Wang et al., Citation2020; Wróblewska and Jeong Citation2021) described the beneficial effects of green spaces on stress levels, while other studies (Lu Citation2020; Xin Zhang, Zhang, and Chen Citation2017) emphasized the detrimental effects of air pollution on mental health.
The unprecedented circumstances created by the COVID-19 pandemic, which affected both humans and the environment, provided unique opportunities to study the complex relationships between green space, air pollution, and stress. These interactions received considerable attention during the pandemic (Menculini et al. Citation2021; Ugolini et al. Citation2020). Studies explored changes in green space utilization, outdoor air quality, and stress levels resulting from societal lockdowns and other restrictions. For example, several studies (Labib et al. Citation2022; Slater, Christiana, and Gustat Citation2020; Xie et al. Citation2020) investigated the impact of restricted access to green spaces on stress. Other studies (Ghahremanloo et al. Citation2021; Liu et al. Citation2021a, Citation2021b; Stratoulias and Nuthammachot Citation2020) examined the effects of lower levels of air pollution during the pandemic. Before the pandemic, limited access to green spaces and increased air pollution were linked to elevated stress levels due to reduced outdoor relaxation and the negative effects of polluted air on mental health (Braubach et al. Citation2017).
As interest in understanding the impact of the environment on human health grows, machine learning models are increasingly being used to explore complex relationships between various environmental factors and health outcomes (Reames and Bravo Citation2019). Random Forest (RF) is a widely used machine learning algorithm that can help generate accurate predictions and provide a deeper understanding of the crucial features that contribute to the effects of air pollution (PM10) and green space on stress. The algorithm’s ability to handle a range of data types, including categorical and numerical features, makes it adaptable to available datasets (Lim et al. Citation2019; Phung et al. Citation2022; Tella et al. Citation2021). In addition, the model’s capacity to manage high-dimensional data with many predictors enables it to effectively analyze complex datasets without overfitting (Jun Citation2021). A key advantage of random forest is its feature selection capability, which helps identify the most relevant features (Speiser et al. Citation2019). This reduces the risk of including irrelevant or redundant variables and improves the model’s performance. Furthermore, RF provides insights into feature importance and the relative contribution of each feature in the model’s predictions. In this study, we examine the joint effect of green space and air pollution (PM10) on stress levels within the South Korean population, both before (2018–2019) and during (2020–2021) the COVID-19 pandemic, using a random forest algorithm. The study also investigates the individual contributions of PM10 and green space to stress levels during both periods. The variables considered by random forest models are 16 physical and socioeconomic environmental features, including distinct forest types (mixed forest, deciduous forest, and evergreen forest) and PM10.
While previous studies have investigated the individual impacts of air pollution and green spaces on mental health, they have used diverse methodologies and limited datasets (Bloemsma et al. Citation2022; Dimitrov-Discher et al. Citation2022). Filonchyk et al. (Citation2021) investigated the impact of COVID-19 pandemic lockdown measures on air quality in Shanghai, noting significant reductions in key pollutants such as PM2.5 and NO2 during the early 2020 lockdown period (Phan and Fukui Citation2023). There is a notable lack of research into the combined influence of these factors on stress levels, particularly within a South Korean context (Lee, Browning, and Park Citation2023; Zhou et al. Citation2023). Therefore, the findings of this study not only improve understanding of the complex relationship between environmental factors and stress levels in South Korea but also provide useful information for to support the development of interventions and policies aimed at reducing stress and improving mental health.
2. Literature review
Recent research has shown that exposure to air pollution and green space has a significant impact on stress (Bloemsma et al. Citation2022; Dominski et al. Citation2021; Elsadek et al. Citation2019; Kruize et al. Citation2019; Markevych et al. Citation2017; Zhao and Patuano Citation2022). Several pathways have been proposed for the underlying mechanisms linking air pollution and green space to stress levels. One such pathway is the exposure to air pollutants and stressors that can activate stress through the hypothalamic–pituitary–adrenal (HPA) axis and sympathetic nervous system, leading to the release of stress hormones, such as cortisol and catecholamines (Kodavanti et al. Citation2023; Thomson Citation2019). These stress responses can trigger inflammation, oxidative stress, and dysregulation of nitric oxide synthase, which can contribute to vascular dysfunction and potentially lead to neurological and psychiatric disorders (Gehring and Gascon Citation2022; Huang et al. Citation2021; Mallhi et al. Citation2021). Forests can reduce PM10 levels, positively impacting air quality and potentially lowering stress levels among nearby populations, as indicated by the study on urban forests and respiratory health (De Oliveira E Almeida et al. Citation2020; Mikhailova et al. Citation2022). Human activities add particulate matter to the air that can interact with chemicals to degrade air quality (Inhalable Particulate Matter and Health (PM2.5 and PM10) | California Air Resources Board, Citationn.d.). Many studies have shown that an increase in particulate matter is linked to elevated stress levels (Boudier et al. Citation2022; Dimitrov-Discher et al. Citation2022; Gascon et al. Citation2015; Hicken et al. Citation2014; Jung, Cho, and Shin Citation2019; Kasdagli et al. Citation2022; Li et al. Citation2017; Liu et al. 2021; Pun, Manjourides, and Suh Citation2018; Sass et al. Citation2017; Yang et al. Citation2021; Zhang, Zhang, and Rhodes Citation2021). Several studies have shown that pollutants may increase stress and impact virus transmission (Comunian et al. Citation2020; Santurtún et al. Citation2022). In addition, studies have shown that green space can relieve stress (Kim et al. Citation2022a; Markevych et al. Citation2017; Roe et al. Citation2013).
Rapid urbanization is linked to increased air pollution and reduced green space, potentially affecting half of the global population, who now reside in urban areas (World Urban Population Citation1960–Citation2023 | Macrotrends, n.d.; Choi & Kim, Citation2022). Furthermore, in highly urbanized areas, a lack of green space can contribute to decreased outdoor activity and increased stress levels (Grahn and Stigsdotter Citation2003; Nutsford, Pearson, and Kingham Citation2013; Reyes-Riveros et al. Citation2021).
Previous research has investigated the mediating or moderating effects of PM10 and green space on stress individually (Chang et al. Citation2020; Chen et al. Citation2021; Haberzettl et al. Citation2018; Jung, Cho, and Shin Citation2019; Kabisch Citation2019; Mennis et al. Citation2021; Tao et al. Citation2021; Thomson Citation2019; Wang, Feng, and Pearce Citation2022; Wei et al. Citation2022; Wang et al. Citation2020). However, investigating the joint associations between these factors can provide unique insights. While mediation focuses on intermediate mechanisms and moderation examines conditional relationships, joint association analysis focuses on capturing the combined effects and potential interactions between variables. Therefore, investigating these joint associations can provide a more comprehensive understanding of the combined impacts of PM10 and green space on stress.
3. Methodology
3.1. Data description and variables
This study used a cross-sectional design to examine the relationship between PM10 and green space forest types and stress levels in 241 municipal districts (known as Sigungu) in South Korea (). The study focuses on the six-year period from 2017 to 2022, which encompasses both the pre-COVID-19 pandemic (2017–2019) and COVID-19 pandemic (2020–2022) periods.
Figure 1. South Korean study area showing the Sigungu municipal district boundaries.
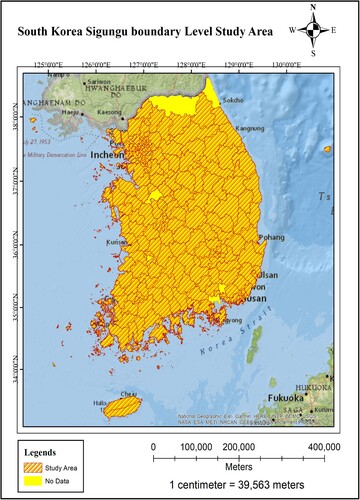
Three categories of forest cover were considered in this study: evergreen, deciduous, and mixed forest. The percentage of each forest type in each municipal district was calculated annually between 2017 and 2022 using the Moderate Resolution Imaging Spectroradiometer (MODIS; https://egis.me.go.kr/) land cover data with a resolution of 500 × 500 m from 2018 to 2021 (https://lpdaac.usgs.gov/products/mcd12q1v006/). The MODIS data was used due to its extensive accessibility, frequent spatial coverage, and long-term data record. However, due to the absence of MODIS data for 2021 and 2022, data from 2020 was used as a substitute. To account for the density of urban areas, urban and built-up land were extracted from the MODIS data. In this study, urban density is represented by the percentage of urban and built-up land, reflecting the extent of urbanization rather than direct population density, to correlate with environmental and social factors impacting stress and air pollution.
The Air Korea initiative, administered by the Korea Environment Corporation (KEC) (https://www.keco.or.kr/eng/main/main.jsp), provides information on air quality and pollution in South Korea (https://www.airkorea.or.kr). Data from 297 monitoring stations were analyzed to calculate the average annual PM10 concentration in each municipal district (Hahm and Yoon Citation2021). Ordinary kriging, which is a geostatistical interpolation technique, was used to predict values at unsampled locations based on data from nearby sampled locations (it uses spatial autocorrelation if nearby locations are likely to have similar values), extrapolating these estimations to the remainder of the country. Ordinary kriging is known for its accuracy compared to other interpolation methods (such as inverse distance weighting) particularly when spatial correlation and data distribution are considered (Son, Bell, and Lee Citation2010). The gradient (slope) of the terrain and mean temperature were also used as physical environmental variables. The mean slope was calculated for each municipal district using a 90 m digital elevation model (DEM) from the National Geographic Information Institute, and the annual mean temperature was calculated for each municipal district using the data obtained from Korea Meteorological Administration. In our study, we opted to include slope as a factor due to its potential impact on environmental dynamics and human behaviour in South Korea. There are several studies that found the association between slope and stress levels (Gao et al. Citation2023; Kim et al. Citation2022b; Mumford et al. Citation1996). Thus, we used it as one of the variables to see the importance of this factor.
Data from the Community Health Survey (CHS) were conducted in South Korea to gather data on perceived stress levels, was used for the 2017–2022 period. The characteristics of the survey population are summarized in . Sample households were selected based on housing type, and data was collected through in-person interviews with household members using a standard survey questionnaire. Survey participants were asked to rate their perceived stress levels on a Likert scale ranging from 1 (feel very much) to 4 (rarely feel). Average perceived stress levels were calculated for each municipal district to ensure consistency in the study’s interpretation. This calculation involved adding the number of respondents at each stress level, dividing by the total number of respondents in each district, and summing the number of respondents at each stress level with inverse weighting based on the stress levels reported. The perceived stress scores were reverse coded to align the scoring system with the study’s objectives, thus ranged from 1 (rarely feel) to 4 (feel very much).
Table 1. Survey population characteristics for all municipal districts in South Korea for the 2017–2022 period (unit: case (%)).
provides a summary of the variables used in the analysis. Each factor represents a unique variable that influences the relationships being studied. The descriptions summarize what each variable represents and its significance in the context of the study.
Table 2. Study variables and their descriptions.
Data from the CHS was also used to assess self-reported health status and income levels in each municipal district as covariates, providing valuable insight into the well-being of the population in each district. The survey question ‘How do you usually feel about your health?’ was used to assess self-reported health status on a scale of 1 (very good) to 5 (very bad). To calculate the average self-reported health status in each district, the number of respondents at each level was added together and divided by the total number of respondents in that district, with weights inversely proportional to the levels. The perceived health scores were reverse coded, thus ranged from 1 (very bad) to 5 (very good). Data for other variables, such as average age, percentage of males, and population density, were obtained from the KPHC for the 2017–2022 period.
3.2. Analysis
The Random Forest algorithm is available through the Random Forest package in the R software. It is an ensemble learning method that can manage complex high-dimensional datasets and achieve robust predictions in classification and regression tasks. Random forest effectively mitigates overfitting while maintaining high predictive accuracy by aggregating the predictions of multiple decision trees.
In this study, Random Forest was used to explore the relationship between PM10, green space, and stress. The model’s feature importance scores provided insights into the relative importance of different variables, enabling the identification of the key factors that influence stress levels. Bouslihim et al. Citation2022 proved Support Vector Machines (SVMs) as a better option for handling land-use data although SVMs often face challenges in efficiently processing large, noisy datasets typical of satellite imagery due to the need for extensive hyperparameter tuning and their lack of direct feature importance output. Conversely, Random Forest algorithms are better suited for such applications, offering robust performance and straightforward insights into the relevance of different features (Bouslihim et al. Citation2022). RF can help compare the importance of different variables. In this study, we did not use the RF model to rule out the less significant one, but just compare the importance and try to figure out how much the environmental factors contribute. Furthermore, we explored feature importance using two key techniques: permutation and total decrease in node impurities as measured by the Gini index. This enabled cross-validation of the results, increasing the robustness of the findings. Variables that achieved a high ranking using both techniques were considered important to perceived stress levels. These techniques were originally introduced by Breiman (Citation2001), while a model-agnostic version called Model Reliance was later proposed by Fisher, Rudin, and Dominici (Citation2019).
Multiple decision trees were constructed using Random Forest and each tree was trained on a different subset of the data, which was chosen randomly. A subset of characteristics, such as PM10 and green space, is considered for splitting at each decision tree node. The results of all the individual decision trees are combined to generate a robust stress prediction. Partial dependence plots (PDPs) were used to examine the relationships between stress levels and PM10 and green space. This enabled analysis of how stress levels vary with changing levels of PM10 and green space while controlling for other variables. Through analysis of the patterns and trends observed in the PDP curves, the influence of these environmental factors on stress levels could be identified.
Permutation importance compares the performance of a model before and after permuting the values of a specific feature to determine its importance. The permutation importance equation is as follows:
(1)
(1) Where N denotes the number of permutations for each feature.
refers to the model’s performance metric on the validation dataset (e.g. accuracy, mean squared error) using the original feature values. When the feature values are permuted,
is the model’s performance metric on the validation dataset.
The total decrease in node impurities measured by the Gini index (Gini importance), is a metric that assesses the importance of a feature in random forest models. The equation for Gini importance can be expressed as:
(2)
(2) Where the Total decrease in node impurities is the sum of the reductions achieved by a feature across all the decision trees in the random forest Model and the Total number of trees represents the number of decision trees in the model.
Impurity reduction at each node is typically calculated using the Gini index, which quantifies the impurity or inequality within a set of classes. The Gini index is defined as:
(3)
(3) Where C represents the number of classes. Pi denotes the proportion of samples belonging to class i in the node.
By summing the impurity reductions across all nodes of a specific feature in all trees, the total decrease in node impurities measures the feature’s importance in the random forest model.
Partial dependence plots can be used to investigate the relationship between a target variable and one or more features in a machine learning model. These plots represent the average response of the target variable to a specific feature while all other features remain constant. The equation for calculating partial dependence is expressed as:
(4)
(4) Where
represents the partial dependence of the feature
at a value
. N is the total number of instances in the data set.
represents the prediction made by the model
when the value of feature
in instance
is set to
(while keeping all other features unchanged).
The combination of Random Forest, permutation importance, total decrease in node impurities as measured by the Gini index, and partial dependence plots (PDPs) provides a robust approach, enabling us to extract valuable insights and draw meaningful conclusions from this research. Insights into the relationship between PM10, green space, and stress (the target variable) were gained by observing the resulting PDPs while considering the influence of other features. Therefore, the equation provided a theoretical basis for calculating the values shown on the PDP, allowing visualization of the feature’s marginal effect on the target variable within the model.
3.3. Hyper-parameter tuning
The model’s performance was optimized through a process called ‘hyper-parameter tuning’. It was carried out to identify the optimal parameters for the random forest model. Cross-validation with a 10-fold setup was used for tuning, which involved dividing the dataset into 10 equally sized subsets (folds). This process was repeated three times to ensure the reliability and robustness of the results. Two key parameters of the random forest algorithm were considered during the tuning process: the number of trees (ntree) and the number of variables considered at each split (mtry). By systematically varying these parameters and training multiple models, the performance of each model was evaluated using metrics including root mean square error (RMSE), R-squared (R2), and mean absolute error. The objective was to identify the optimal combination of parameter values that resulted in the best performance of the model. Extensive testing revealed that the best parameter values for the random forest model were mtry = 5 and ntree = 1500, resulting in improved performance and predictive accuracy. For more information on the results of the hyper-parameter tuning for the random forest model. Further information on the results of the hyper-parameter tuning of the model is included in .
Table 3. Comparison of performances of Random Forest using the hyper-parameter tuning.
4. Results
4.1. Descriptive statistics
Of the 250 municipal districts included in the initial dataset, 241 districts were used for analysis. The selection process was based on the availability of land cover data and perceived stress level data, which were not accessible for the remaining nine districts. shows the average perceived stress levels for selected districts in South Korea from 2017 to 2022, while provides descriptive statistics for these 241 districts.
Figure 2. Perceived stress levels in the municipal districts for the period before (2018–2019) and during (2020–2021) the COVID-19 pandemic.
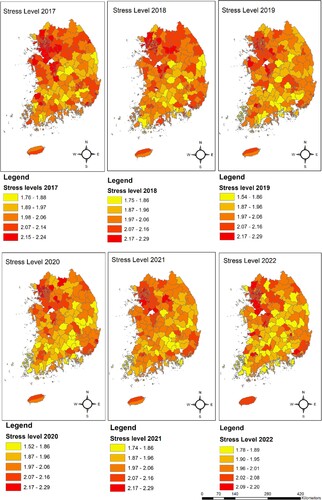
Table 4. Descriptive statistics for the municipal districts in South Korea.
These comprehensive statistics provide valuable information on a range of factors and characteristics of the municipal districts, enabling a fuller understanding of their diverse attributes and potential correlations between them. District stress levels ranged from 1.5 to 2.3, with a mean of 2.0 and a standard deviation of ± 0.1. Air quality (PM10 concentration) varied from 21.9 to 43.4 µg/m3, with an average of 33.8 µg/m3 and a standard deviation of ± 3.5. Land cover included a range of land cover types and the percentage values for these land cover types varied, with mean values generally low. The distribution of land cover types shows slight variation for evergreen forests, significant variability for deciduous forests, low variation for mixed forest and grasslands, and substantial variation for urban and built-up land.
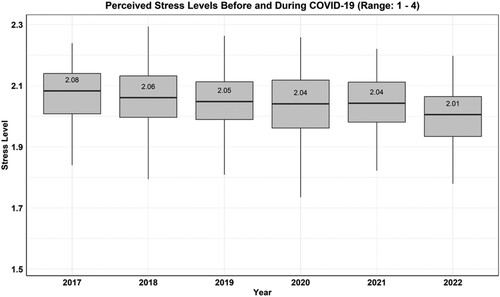
The boxplot of stress levels for the years 2017–2022 provided insights into the impact of the COVID-19 pandemic on stress dynamics (). For the period before the pandemic (2017–2019), the plot showed a discreet but noticeable downward trend in median stress levels, which reduced from 2.08 in 2017 to 2.05 in 2019. The relatively stable interquartile ranges (IQRs) during this period fluctuated only marginally between 1.99 and 2.11, indicating stress levels were consistently spread among the population. This period provides a baseline of the stress variability in a pre-COVID-19 context, against which the data from the pandemic years (2020–2022) represents a stark contrast. The years 2020 and 2021 show a limited distribution of stress levels, as reflected by tighter IQRs, which ranged between 1.98 and 2.09. The median stress level during these years decreased slightly to 2.04, signifying a slight shift in the middle trend of stress perceptions. This change suggests that while the pandemic introduced significant global stressors, it may have also produced a uniform response among individuals, potentially due to shared experiences and common public health measures. By 2022, the data exhibited a further reduction in the median stress level to 2.01, suggesting a gradual adaptation to, or acceptance of, pandemic conditions, or possibly the emergence of coping mechanisms to mitigate stress. The slight expansion of the IQR in 2022 compared to the peak pandemic years suggests a return to a wider variability in stress experiences, possibly due to the relaxation of restrictions and the resumption of normal social and economic activities. Despite global increases in stress during the COVID-19 pandemic, stress levels in South Korea decreased due to factors like improved air quality, increased family time, remote work opportunities, and adaptation to new norms. South Korea’s adoptative response was also appreciated in global community (Kim and Choi Citation2022).
Figure 3. Stress boxplots for the periods before (2017–2019) and during (2020–2022) the COVID-19 pandemic.
The analysis of PM10 levels for the 2017–2022 period reveals significant fluctuations, highlighting the potential impact of the COVID-19 pandemic on air quality. Before the pandemic, PM10 levels were relatively stable, with medians of 43.51, 40.67, and 40.41 µg/m³ in 2017, 2018, and 2019, respectively (). These figures represent a period of relative consistency in air quality metrics before the start of global health restrictions.
Figure 4. PM10 boxplots for the periods before (2017–2019) and during (2020–2022) the COVID-19 pandemic.
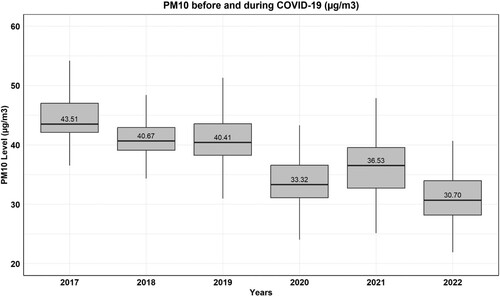
A marked reduction in PM10 levels was found during the pandemic years, with the median falling to 33.32 µg/m³ in 2020 before increasing slightly to 36.53 µg/m³ in 2021, while in 2022, the median decreased to 30.70 µg/m³. The contraction of the IQRs for these years, from 39 to 44 µg/m³ in the pre-pandemic period to 31.5–39 µg/m³ in 2020 and 32.5–39 µg/m³ in 2021, indicates a significant fall in the variability of PM10 levels.
This trend likely reflects a decrease in PM10 pollution, potentially caused by reduced industrial activity and vehicular emissions due to lockdown measures. This reduction in PM10 pollution during the pandemic is consistent with observations globally of the environmental improvements that occur when human activities decrease (Choi and Choi Citation2022; Seo et al. Citation2020a; Citation2020b). However, the slight increase in PM10 in 2021, followed by a further decrease in 2022, could signify the continuation of routine activities impacting air quality post-lockdown in 2021.
4.2. Feature importance and PDPs
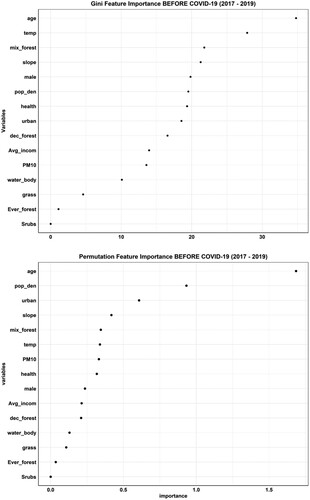
For the period before COVID-19 pandemic (2017–2019), the feature importance analysis revealed interesting insights. Among the 16 variables examined, mixed forest emerged as one of the five most prominent features, indicating it had a considerable influence on stress levels. Conversely, the importance of evergreen and deciduous forests was relatively low. Another prominent feature was PM10, which was among the seven most prominent features during this period. In addition, this variable was in 11th position according to the permutation importance analysis, suggesting that PM10 was significant and had a strong relationship with stress levels ().
Figure 5. Variables influencing stress levels in South Korea in the pre-COVID-19 pandemic period (2017–2019).
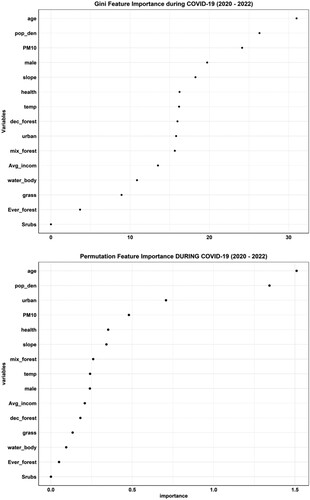
Notable changes in the importance of variables during the COVID-19 period (2020–2022) were observed compared with the pre-pandemic period. In particular, the importance of PM10 increased, becoming one of the four most influential variables, while the importance of mixed forest reduced, becoming the 10th most influential feature according to the Gini importance analysis and the seventh most important feature according to the permutation analysis (). Despite a decrease in PM10 levels, its increased perceived impact on stress during the pandemic suggests heightened public sensitivity to air quality, where even lower pollution levels significantly influence stress due to increased health and environmental awareness.
Figure 6. Variables influencing stress levels in South Korea during the COVID-19 pandemic period (2020–2022).
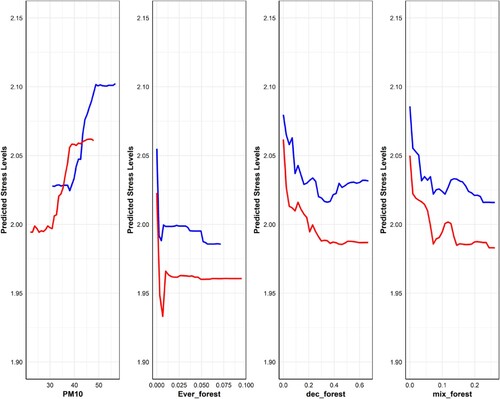
The PDP plots for the pre-COVID-19 (2017–2019) showed distinct nonlinear patterns between forest types, PM10, and stress levels. The PDPs for PM10 showed an explicit positive correlation with stress, with a reasonable increase observed pre-pandemic, suggesting an increased sensitivity to air pollution before the pandemic. Conversely, forest cover (evergreen, deciduous, and mixed forests) generally correlated with reduced stress levels, although with distinctions. Evergreen forest appeared to consistently reduce stress levels, with a sharper decline noted pre-pandemic. Deciduous forest showed a complex, non-linear relationship, with a marked decrease in stress levels followed by stabilization or a slight increase as forest coverage increased. Mixed forest demonstrated a steady reduction in stress levels with increasing forest coverage, particularly in the pre-pandemic period. This association decrease can be attributed to the overall decrease in stress levels observed during the COVID-19 pandemic, as indicated by our previous study results (Lee, Browning, and Park Citation2023).
The PDPs for both the pre-pandemic and pandemic periods provide insightful information on how PM10 levels and forest coverage can impact perceived stress (). Notably, both periods exhibited an increase in stress as PM10 concentrations increased, with a more noticeable increase in stress once PM10 levels exceeded 40 µg/m3, indicating a possible threshold where air pollution markedly affects stress. Evergreen forest coverage consistently reduced stress levels, suggesting that year-round greenery provides continuous stress mitigation. Deciduous forest had a more complex relationship with stress, generally reducing stress levels as coverage increased, particularly during the post-pandemic period, which may be due to the seasonal nature of these forests. Mixed forest also showed a reduction in stress with increasing forest coverage, highlighting the benefits of diversity within forest types. These patterns support the significant influence of environmental quality on mental health, suggesting that green spaces serve as vital buffers against the adverse effects of urban pollution on stress. This relationship remained strong despite the differing situations during the pre-pandemic and pandemic periods.
Figure 7. Nonlinear effects of PM10 and forest type on stress for the periods before (2017–2019) and during (2020–2022) the COVID-19 pandemic.
Examination of the joint association between forest type and PM10 levels on stress levels revealed a clear relationship during the pre-pandemic period (2017–2019) (). The highest levels of PM10 and the lowest levels of forest coverage were associated with the highest levels of stress across all forest types. Conversely, higher levels of evergreen forests and lower levels of PM10 were linked to lower stress levels.
Figure 8. Joint association of forest type and PM10 levels with stress levels during the pre-COVID-19 pandemic period (2018–2019).
Note: the different colors represent different stress levels, with darker colors indicating lower stress values and lighter colors indicating higher values.
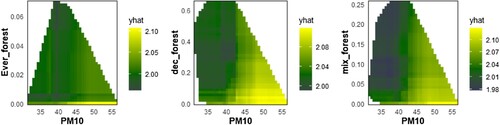
For the COVID-19 pandemic period (2020–2022), the joint association analysis identified several notable trends. Higher levels of mixed forests combined with lower levels of PM10 were associated with lower stress levels during COVID-19 pandemic compared with the pre-pandemic period (). This finding suggests that mixed forests may have played an important role in mitigating the negative effects of air pollution, particularly during the pandemic period when lower levels of air pollution levels were observed.
Figure 9. Joint association of forest type and PM10 with stress levels during the COVID-19 pandemic period (2020–2021).
Note: the different colors represent different stress levels, with darker colors indicating lower stress values and lighter colors indicating higher values.
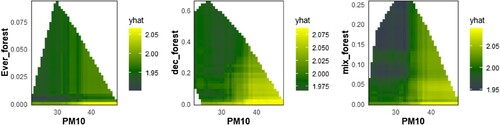
During the pre-pandemic period, a visible increase in stress levels corresponded to increasing PM10 concentrations, which was particularly evident as PM10 levels approached 55 µg/m³. This pattern was consistent across the different forest types, although with slight variations: while the evergreen and mixed forest coverages had a moderate effect on stress levels, deciduous forests showed a less clear-cut influence on stress mitigation. In contrast, the plots for the pandemic period reveal a somewhat muted response in stress levels to rising PM10 levels, suggesting that the decrease in PM10 levels, a change in environmental factors, or adaptive human behaviours during this period mitigated stress levels. Notably, the stress-reducing benefit of increased forest coverage became more pronounced, especially for the mixed forest type, which appears to provide a protective buffer against the stress-inducing effects of increasing PM10 levels. These findings highlight the potential of urban green spaces to mitigate environmental stressors and emphasize the importance of preserving and expanding urban forests to enhance public health resilience in the face of ongoing environmental challenges.
5. Discussion
The joint association analysis explored the combined impact of the types of green space of forest and PM10 levels on stress levels. Before COVID-19 (2017–2019), high levels of PM10 combined with low forest coverage were associated with elevated stress levels. Conversely, higher evergreen forests combined with lower PM10 levels demonstrated a mitigating effect against stress. These findings from PDPs emphasize the importance of considering forest coverage and air pollution levels when evaluating stress levels.
The analysis showed stress levels peaked when evergreen forests were absent. Regarding deciduous forest, PM10, and stress, the analysis clearly showed that stress levels remained elevated even in the presence of this forest type. These results suggest that evergreen forests outperform deciduous forests in terms of stress-reduction capacity to reduce stress. Deciduous forest also had a more varied influence on stress levels. This forest type, characterized by seasonal variability, potentially offers less consistent stress reduction benefits throughout the year. During spring and summer, full foliage can provide substantial green space benefits (recreational opportunities and aesthetic enjoyment) that are associated with stress reduction. However, in autumn and winter, the loss of leaves results in reduced air filtration capacity, reduced visual greenery and activity limitations that reduce recreational opportunities and stress-relief benefits during colder months, which may diminish these stress-reducing benefits (Chen et al. Citation2023; Fuller et al. Citation2007).
The analysis of the effects of the mixed forests and PM10 levels affect stress yields interesting results, with a clear pattern between with mixed forests and PM10 levels, and stress levels. The highest stress levels were found when mixed forest was absent. Interestingly, districts with the largest mixed forests coverage and the lowest PM10 levels demonstrated an almost complete absence of stress. Even in areas with the lowest PM10 values and only a small coverage of mixed forest, stress levels were low. These findings highlight the importance of mixed forests in reducing stress, suggesting that this forest type is unique in terms of stress reduction. The impact of the evergreen and deciduous forest types on stress was not as clear as that of mixed forest, suggesting that while these forest types provide crucial benefits for stress, the added species diversity in mixed forests might further enhance these benefits. This finding is consistent with another study on the beneficial effects of mixed forest green space (Liu et al., 2021).
Furthermore, the manner in which mixed forests and PM10 levels affect stress indicates that they are both important. The fact that stress levels are low when mixed forest coverage is high, even with low PM10 levels, suggests that they both influence stress levels. The joint association of PM10 and mixed forests demonstrates a stronger stress reduction effect compared to deciduous and evergreen forests. This shows that places with more green space can improve air quality better than places lacking in green space provision, which then has a beneficial effect on stress levels, which supports the findings of other studies (D’Alessandro et al. Citation2015; Meo et al. Citation2021). Conversely, the elevated stress levels associated with deciduous forest, and to an extent, evergreen forest, and PM10 exposure indicate that while both environments may contribute to reducing stress, their effects are not as great as that of mixed forest. These observations align with existing research that highlights the negative impact of air pollution on mental well-being (Abed Al Ahad et al. Citation2022; Thomson Citation2019) and emphasize the potential stress-relieving role of green spaces (Nath Citation2022).
During COVID-19 pandemic (2020–2022), an interesting trend emerged between forest type, PM10 levels, and stress. The analysis showed a stronger relationship between mixed forests and lower stress levels, particularly when combined with lower PM10 levels (Wang et al. Citation2023). This finding suggests that mixed forests may have significantly reduced the negative effects of air pollution, particularly when pollution levels were lower during the pandemic (Hu et al. Citation2021; Kandari and Kumar Citation2021).
Evergreen forests maintain their foliage throughout the year, providing constant green space benefits. The analysis suggests that evergreen forests contribute to stress reduction, particularly in urban settings where year-round greenery is relatively scarce. Continuous foliage not only provides consistent air quality benefits but also offers a constant and consistent natural setting that is crucial for mental health in densely populated urban centers. However, the analysis showed that the impact of evergreen forest on stress levels was not as pronounced as with mixed forest, suggesting that while evergreen forest provides crucial baseline benefits, the added diversity of species in a mixed forest might enhance these benefits further.
When we investigated the relationship between evergreen forest and PM10 levels and stress, our analysis showed that stress levels were higher when PM10 levels were highest. In relation to deciduous forest, PM10 levels, and stress, deciduous forest was found to be less significant than other forest types and exhibited the same trends as before the COVID-19 pandemic. During the COVID-19 period, the reduced air pollution due to the implementation of lockdown measures contributed to lower stress levels, highlighting the importance of PM10 levels on stress (Rodríguez-Urrego and Rodríguez-Urrego Citation2020). These insights highlight the adaptability of green spaces, especially mixed forests, in influencing stress levels during challenging times and emphasize the importance of diverse green spaces that can address various stressors and improve mental well-being (Chun et al. Citation2023; Li et al. Citation2023).
Analysis of stress levels during the pre-COVID-19 period (2017–2019) provided valuable information on the influence of different factors, including types of green space forests and PM10 levels. Among the 16 features examined, the type of ‘mixed forests’ of green spaces emerged as one of the prominent features, indicating their significant association with stress levels. This finding suggests that the presence of mixed forests may play a crucial role in mitigating stress levels. However, when compared to mixed forests, the importance of evergreen or deciduous forests was relatively lower.
The unique characteristics of mixed forests contribute to their effectiveness in reducing air pollution. Mixed forests, as opposed to evergreen or deciduous forests, contain diverse tree species, including coniferous and broadleaf trees (Minnesota Department of Natural Resources Citation2023). Due to this diverse composition, mixed forests have a greater capacity to capture and filter pollutants (Park et al. Citation2021), Due to this to absorb and trap airborne particles such as PM10 (Diener and Mudu Citation2021). An increased absorption of PM is associated with higher Leaf Area Index (LAI) values (which refers to the total leaf surface area per unit of ground area), as denser vegetation can effectively filter and capture airborne particles (Wróblewska and Jeong Citation2021). In South Korea, most of the country’s forests consist of coniferous trees (Forest Type Map Citation2020), which can absorb more particular matter than deciduous trees (Letter and Jäger Citation2020). Therefore, the more coniferous trees within a mixed forest, the higher its LAI. A higher LAI reflects a denser tree cover and a greater ability to capture airborne pollutants (Han et al. Citation2020; Jin et al. Citation2021; Park et al. Citation2022; Sun et al. Citation2022). This indicates that mixed forest can reduce PM10 levels in the surrounding environment, potentially leading to improved air quality and reduced stress levels among local residents.
In addition, the impact of PM10 levels on stress was greater than that of mixed forest, which indicates a significant relationship between PM10 and stress levels. As a result it shows that higher PM10 levels can increase stress levels. In different studies, particulate matter pollution, particularly PM10, has long been recognized as a major environmental stressor with negative effects for human health, including increased stress (Sosa et al. Citation2017; Trushna et al. Citation2021). These findings align with previous research highlighting the adverse effects of particulate matter pollution on human health and well-being (Kumar et al. Citation2019).
There were noticeable changes in the importance of variables during the COVID-19 pandemic period (2020–2022) compared with the pre-pandemic period (2017–2019). The significance of PM10 levels increased, with PM10 becoming one of the influential variables, suggesting a greater association with stress levels during the pandemic. The increased significance of PM10 levels during the COVID-19 period is found to be based on the unique circumstances created by the pandemic, with the global efforts to contain the COVID-19 virus leading to strict lockdown measures significantly altering human activities and industrial operations. These measures significantly reduced vehicular traffic, industrial emissions, and other sources of PM10 pollution significantly (Yao et al. Citation2023). Consequently, the previously well-established link between elevated PM10 levels and stress became even clearer during this period. The decrease in PM10 pollution may have had a greater impact on lower stress levels during this period than previously (Ju, Oh, and Choi Citation2021; Seo et al. Citation2020a, Citation2020b; Yang et al. Citation2022).
Furthermore, the importance of mixed forests green spaces increased during the COVID-19 pandemic, reinforcing the role of this forest type in reducing stress. These findings suggest that the importance of mixed forests has steadily increased over time. This increasing trend emphasizes and strengthens the understanding of the role that mixed forests has in stress reduction (Bamwesigye et al. Citation2023; Muro et al. Citation2023). Therefore, it is clear that mixed forests have a positive impact on stress reduction and have an important role in mitigating the negative effects of air pollution, particularly lower levels of pollution were observed during the COVID-19 pandemic period (Wijnands et al. Citation2022).
The PDP analysis used to visualize the relationship between the features, allowed a detailed examination of the associations between these variables and stress levels. The results for the pre-COVID-19 period (2017–2019) revealed distinct patterns of association. These associations were during the pandemic period (2020–2022), with an interesting difference noted regarding the deciduous forest type. While deciduous forest showed a nonmonotonic association with stress levels, before the pandemic, during the pandemic, this forest type exhibited a positive association. This change could be attributed to the overall decrease in stress levels observed in South Korea during the pandemic, which could have been influenced by a variety of factors including reduced traffic and industrial activities, changes in daily routines, and lower levels of air pollution (Liou et al. Citation2023; Silva, Branco, and Sousa Citation2022).
Future studies can further this research by considering several aspects. First, including a larger and more diverse sample size across various geographical regions would improve the generalizability of the findings. Furthermore, conducting longitudinal studies to examine the long-term effects of green space forest types and air pollution on stress levels would provide more comprehensive information. It would also be beneficial to investigate into the specific mechanisms by which forests, and air pollution affect stress, such as the role of nature exposure, physiological responses, and psychological factors. Furthermore, future research could look into the interactive effects of other environmental factors on stress levels, such as noise pollution, to gain a more holistic understanding of natural environments’ stress-reduction potential. Advanced statistical techniques and spatial analysis methods can also provide more detailed insights into variable relationships. Future studies can build on the findings of this research by adhering to rigorous ethical standards and maintaining academic integrity, contributing to the growing body of knowledge on the relationship between natural environments, air pollution, and stress levels.
This study presents several limitations. First, while our findings offer insights into the relationship between air pollution, green spaces, and stress in South Korea, their generalizability to other regions may be limited due to unique environmental and demographic characteristics specific to the study area. Additionally, the non-inclusion of noise factors, as our study was oriented towards natural parameters, potentially overlooking urban environmental stressors that could impact mental health. Finally, while our methodology employs sophisticated machine learning techniques to navigate complex interactions between variables, the adaptation of our framework to different geographical contexts might require modifications to handle local variations effectively.
6. Conclusions
This study enhances our understanding of the relationships between forest types, air pollution, and urban stress levels. It shows that different forest types have distinct effects on mitigating stress, with mixed forest having the greatest stress reduction benefits. Mixed forest, which comprises a combination of deciduous and evergreen trees, provides a robust buffer against the adverse effects of PM10 pollution due to its greater biodiversity and year-round foliage.
Deciduous forest, while beneficial during the spring and summer seasons when the trees are in leaf, offers less consistent advantages throughout the year due to their seasonal loss of foliage. Conversely, evergreen forest maintains its mitigating effects against stress across all seasons but does not have the overall effectiveness of mixed forest. These findings highlight the importance of incorporating different forest types in urban planning to enhance the ecological and psychological resilience of urban populations.
This study represents an important step towards integrating environmental health considerations into urban forestry management and public health policy. It highlights the need for urban planners and policymakers to prioritize forest diversity in urban landscapes as a strategic approach to combatting urban stress and promoting public health. The evidence suggests that enhancing the quality of urban green space, particularly through the creation of mixed forests, can be a critical tool in improving urban air quality and reducing the health burdens associated with stress.
In terms of future research, longitudinal studies are recommended to further explore the causal relationships between forest exposure and stress reduction. In addition, expanding the geographic scope of the research to include a diversity of urban settings would validate the generalizability of these findings and support the development of tailored green space strategies for different urban environments.
Data availability statement
The data that support the findings of this study are available from the corresponding author upon reasonable request.
Disclosure statement
No potential conflict of interest was reported by the author(s).
Additional information
Funding
References
- Abed Al Ahad, M., U. Demšar, F. Sullivan, and H. Kulu. 2022. “Air Pollution and Individuals’ Mental Well-being in the Adult Population in United Kingdom: A Spatial-temporal Longitudinal Study and the Moderating Effect of Ethnicity.” PLoS One 17 (3): 20–21. https://doi.org/10.1371/journal.pone.0264394.
- Bamwesigye, D., J. Fialova, P. Kupec, E. Yeboah, J. Łukaszkiewicz, B. Fortuna-Antoszkiewicz, and J. Botwina. 2023. “Urban Forest Recreation and Its Possible Role Throughout the COVID-19 Pandemic.” Forests 14 (6): 1254. https://doi.org/10.3390/f14061254.
- Bloemsma, L. D., A. H. Wijga, J. O. Klompmaker, G. Hoek, N. A. Janssen, E. Lebret, B. Brunekreef, U. Gehring, and U. Gehring. 2022. “Green Space, Air Pollution, Traffic Noise and Mental Wellbeing Throughout Adolescence: Findings from the PIAMA Study.” Environment International 163:107197. https://doi.org/10.1016/j.envint.2022.107197.
- Boudier, A., I. Markevych, B. Jacquemin, M. J. Abramson, S. Accordini, B. Forsberg, E. Fuertes, et al. 2022. “Long-term Air Pollution Exposure, Greenspace and Health-related Quality of Life in the ECRHS Study.” Science of the Total Environment 849:157693. https://doi.org/10.1016/j.scitotenv.2022.157693.
- Bouslihim, Y., M. H. Kharrou, A. Miftah, T. Attou, L. Bouchaou, and A. Chehbouni. 2022. “Comparing Pan-sharpened Landsat-9 and Sentinel-2 for Land-use Classification Using Machine Learning Classifiers.” Journal of Geovisualization and Spatial Analysis 6 (2). https://doi.org/10.1007/s41651-022-00130-0.
- Bras, A. L. 2018. “Mental Stress Puts Women’s Hearts at Risk.” Nature Reviews Cardiology 15 (4): 198. https://doi.org/10.1038/nrcardio.2018.23.
- Braubach, M., A. Egorov, P. Mudu, T. Wolf, C. Ward Thompson, and M. Martuzzi. 2017. “Effects of Urban Green Space on Environmental Health, Equity and Resilience.” In Nature-based Solutions to Climate Change Adaptation in Urban Areas: Linkages between Science, Policy and Practice, 187–205. https://doi.org/10.1007/978-3-319-56091-5_11.
- Breiman, L. 2001. “Random Forests.” Machine Learning 45 (1): 5–32. https://doi.org/10.1023/A:1010933404324.
- Burnett, H., J. R. Olsen, and R. Mitchell. 2022. “Green Space Visits and Barriers to Visiting during the COVID-19 Pandemic: A Three-wave Nationally Representative Cross-sectional Study of UK Adults.” Land 11 (4): 503. https://doi.org/10.3390/land11040503.
- Chang, K. K. P., F. K. Y. Wong, K. L. Chan, F. Wong, H. C. Ho, M. S. Wong, Y. S. Ho, J. W. M. Yuen, J. Y. Siu, and L. Yang. 2020. “The Impact of the Environment on the Quality of Life and the Mediating Effects of Sleep and Stress.” International Journal of Environmental Research and Public Health 17 (22): 8529. https://doi.org/10.3390/ijerph17228529.
- Chen, R., Y. Gao, R. Zhang, Z. Zhang, W. Zhang, H. Meng, and T. Zhang. 2023. “How does the Experience of Forest Recreation Spaces in Different Seasons Affect the Physical and Mental Recovery of Users?” International Journal of Environmental Research and Public Health 20 (3): 2357. https://doi.org/10.3390/ijerph20032357.
- Chen, Z., R. Tian, Z. She, J. Cai, and H. Li. 2020. “Role of Oxidative Stress in the Pathogenesis of Nonalcoholic Fatty Liver Disease.” Free Radical Biology and Medicine 152:116–141. https://doi.org/10.1016/j.freeradbiomed.2020.02.025.
- Chen, K., T. Zhang, F. Liu, Y. Zhang, and Y. Song. 2021. “How does Urban Green Space Impact Residents’ Mental Health: A Literature Review of Mediators.” International Journal of Environmental Research and Public Health 18 (22): 11746. https://doi.org/10.3390/ijerph182211746.
- Choi, S. M., and H. Choi. 2022. “Artificial Neural Network Modeling on PM10, PM2. 5, and NO2 Concentrations between Two Megacities Without a Lockdown in Korea, for the COVID-19 Pandemic Period of 2020.” International Journal of Environmental Research and Public Health 19 (23): 16338. https://doi.org/10.3390/ijerph192316338.
- Choi, J., and G. Kim. 2022. “History of Seoul’s Parks and Green Space Policies: Focusing on Policy Changes in Urban Development.” Land 11 (4): 474. https://doi.org/10.3390/land11040474.
- Chun, H., Y. Choi, I. Cho, H. Nam, G. Kim, S. Park, and S. Cho. 2023. “Indicators of the Psychosocial and Physiological Effects of Forest Therapy: A Systematic Review.” Forests 14 (7): 1407. https://doi.org/10.3390/f14071407.
- Comunian, S., D. Dongo, C. Milani, and P. Palestini. 2020. “Air Pollution and COVID-19: The Role of Particulate Matter in the Spread and Increase of COVID-19’s Morbidity and Mortality.” International Journal of Environmental Research and Public Health 17 (12): 4487. https://doi.org/10.3390/ijerph17124487.
- D’Alessandro, D., M. Buffoli, L. Capasso, G. M. Fara, A. Rebecchi, and S. Capolongo. 2015. “Green Areas and Public Health: Improving Wellbeing and Physical Activity in the Urban Context.” Epidemiologia e Prevenzione 39 (5): 8–13.
- De Oliveira E Almeida, L., A. Favaro, W. Raimundo-Costa, A. C. B. M. Anhê, D. C. Ferreira, V. Blanes-Vidal, and A. P. M. D. S. Senhuk. 2020. “Influence of Urban Forest on Traffic Air Pollution and Children Respiratory Health.” Environmental Monitoring and Assessment 192 (3). https://doi.org/10.1007/s10661-020-8142-4.
- Diener, A., and P. Mudu. 2021. “How Can Vegetation Protect us from Air Pollution? A Critical Review on Green Spaces’ Mitigation Abilities for Air-borne Particles from a Public Health Perspective-with Implications for Urban Planning.” Science of the Total Environment 796:148605. https://doi.org/10.1016/j.scitotenv.2021.148605.
- Dimitrov-Discher, A., J. Wenzel, N. Kabisch, J. Hemmerling, M. Bunz, J. Schöndorf, H. Walter, I. M. Veer, and M. Adli. 2022. “Residential Green Space and Air Pollution are Associated with Brain Activation in a Social-Stress Paradigm.” Scientific Reports 12 (1): 10614. https://doi.org/10.1038/s41598-022-14659-z.
- Dominski, F. H., J. H. L. Branco, G. Buonanno, L. Stabile, M. G. da Silva, and A. Andrade. 2021. “Effects of Air Pollution on Health: A Mapping Review of Systematic Reviews and Meta-analyses.” Environmental Research 201:111487. https://doi.org/10.1016/j.envres.2021.111487.
- Elsadek, M., B. Liu, Z. Lian, and J. Xie. 2019. “The Influence of Urban Roadside Trees and their Physical Environment on Stress Relief Measures: A Field Experiment in Shanghai.” Urban Forestry & Urban Greening 42:51–60. https://doi.org/10.1016/j.ufug.2019.05.007.
- Filonchyk, M., H. Yan, V. Hurynovich, and Z. Wang. 2021. “Impact of COVID-19 Pandemic on Air Quality Changes in Shanghai, China.” Environmental Forensics 23 (1–2): 1–6. https://doi.org/10.1080/15275922.2021.1892878.
- Fisher, A., C. Rudin, and F. Dominici. 2019. “All Models are Wrong, but Many are Useful: Learning a Variable's Importance by Studying an Entire Class of Prediction Models Simultaneously.” Journal of Machine Learning Research 20 (177): 1–81.
- Forest Type Map. 2020. http://nationalatlas.ngii.go.kr/pages/page_2339.php#prettyPhoto.
- Fuller, R. A., K. N. Irvine, P. Devine-Wright, P. H. Warren, and K. J. Gaston. 2007. “Psychological Benefits of Greenspace Increase with Biodiversity.” Biology Letters 3 (4): 390–394. https://doi.org/10.1098/rsbl.2007.0149.
- Gao, C., J. Ciren, D. Wang, Z. Zhang, R. Ge, and L. Yan. 2023. “Assessment of Psychological and Social Fitness in Healthy Adults Permanently Living at Very High Altitude.” International Journal of Environmental Research and Public Health 20 (3): 2013. https://doi.org/10.3390/ijerph20032013.
- Gascon, M., M. Triguero-Mas, D. Martínez, P. Dadvand, J. Forns, A. Plasència, and M. J. Nieuwenhuijsen. 2015. “Mental Health Benefits of Long-term Exposure to Residential Green and Blue Spaces: A Systematic Review.” International Journal of Environmental Research and Public Health 12 (4): 4354–4379. https://doi.org/10.3390/ijerph120404354.
- Gehring, U., and M. Gascon. 2022. “Invited Perspective: HEPA Filters—An Effective way to Prevent Adverse Air Pollution Effects on Neurodevelopment?” Environmental Health Perspectives 130 (6). https://doi.org/10.1289/EHP11224.
- Ghahremanloo, M., Y. Lops, Y. Choi, and S. Mousavinezhad. 2021. “Impact of the COVID-19 Outbreak on Air Pollution Levels in East Asia.” Science of the Total Environment 754:142226. https://doi.org/10.1016/j.scitotenv.2020.142226.
- Grahn, P., and U. A. Stigsdotter. 2003. “Landscape Planning and Stress.” Urban Forestry & Urban Greening 2 (1): 1–18.
- Haberzettl, P., D. J. Conklin, W. T. Abplanalp, A. Bhatnagar, and T. E. O’Toole. 2018. “Inhalation of Fine Particulate Matter Impairs Endothelial Progenitor Cell Function via Pulmonary Oxidative Stress.” Arteriosclerosis, Thrombosis, and Vascular Biology 38 (1): 131–142. https://doi.org/10.1161/ATVBAHA.117.309971.
- Hahm, Y., and H. Yoon. 2021. “The Impact of Air Pollution Alert Services on Respiratory Diseases: Generalized Additive Modeling Study in South Korea.” Environmental Research Letters 16 (6): 064048. https://doi.org/10.1088/1748-9326/ac002f.
- Han, D., H. Shen, W. Duan, and L. Chen. 2020. “A Review on Particulate Matter Removal Capacity by Urban Forests at Different Scales.” Urban Forestry & Urban Greening 48:126565.
- Hedblom, M., B. Gunnarsson, B. Iravani, I. Knez, M. Schaefer, P. Thorsson, and J. N. Lundström. 2019. “Reduction of Physiological Stress by Urban Green Space in a Multisensory Virtual Experiment.” Scientific Reports 9 (1): 10113.
- Heo, S., M. U. Desai, S. R. Lowe, and M. L. Bell. 2021. “Impact of Changed Use of Greenspace During COVID-19 Pandemic on Depression and Anxiety.” International Journal of Environmental Research and Public Health 18 (11): 5842. https://doi.org/10.3390/ijerph18115842.
- Hicken, M. T., J. T. Dvonch, A. J. Schulz, G. Mentz, and P. Max. 2014. “Fine Particulate Matter Air Pollution and Blood Pressure: The Modifying Role of Psychosocial Stress.” Environmental Research 133:195–203. https://doi.org/10.1016/j.envres.2014.06.001.
- Hu, M., Z. Chen, H. Cui, T. Wang, C. Zhang, and K. Yun. 2021. “Air Pollution and Critical Air Pollutant Assessment During and after COVID-19 Lockdowns: Evidence from Pandemic Hotspots in China, the Republic of Korea, Japan, and India.” Atmospheric Pollution Research 12 (2): 316–329. https://doi.org/10.1016/j.apr.2020.11.013.
- Huang, S., J. Qi, W. Li, J. Dong, and C. K. Van Den Bosch. 2021. “The Contribution to Stress Recovery and Attention Restoration Potential of Exposure to Urban Green Spaces in Low-density Residential Areas.” International Journal of Environmental Research and Public Health 18 (16): 8713. https://doi.org/10.3390/ijerph18168713.
- Inhalable Particulate Matter and Health (PM2.5 and PM10) | California Air Resources Board. n.d. Accessed May 10, 2023. https://ww2.arb.ca.gov/resources/inhalable-particulate-matter-and-health.
- Jimenez, M. P., N. V. DeVille, E. G. Elliott, J. E. Schiff, G. E. Wilt, J. E. Hart, and P. James. 2021. “Associations between Nature Exposure and Health: A Review of the Evidence.” International Journal of Environmental Research and Public Health 18 (9): 4790. https://doi.org/10.3390/ijerph18094790.
- Jin, E. J., J. H. Yoon, E. J. Bae, B. R. Jeong, S. H. Yong, and M. S. Choi. 2021. “Particulate Matter Removal Ability of ten Evergreen Trees Planted in Korea Urban Greening.” Forests 12 (4): 438. https://doi.org/10.3390/f12040438.
- Ju, M. J., J. Oh, and Y. H. Choi. 2021. “Changes in Air Pollution Levels after COVID-19 Outbreak in Korea.” Science of the Total Environment 750:141521. https://doi.org/10.1016/j.scitotenv.2020.141521.
- Jun, M. J. 2021. “A Comparison of a Gradient Boosting Decision Tree, Random Forests, and Artificial Neural Networks to Model Urban Land use Changes: The Case of the Seoul Metropolitan Area.” International Journal of Geographical Information Science 35 (11): 2149–2167. https://doi.org/10.1080/13658816.2021.1887490.
- Jung, M., D. Cho, and K. Shin. 2019. “The Impact of Particulate Matter on Outdoor Activity and Mental Health: A Matching Approach.” International Journal of Environmental Research and Public Health 16 (16): 2983. https://doi.org/10.3390/ijerph16162983.
- Kabisch, N. 2019. “The Influence of Socio-economic and Socio-demographic Factors in the Association between Urban Green Space and Health.” Biodiversity and Health in the Face of Climate Change, 91–119. https://doi.org/10.1007/978-3-030-02318-8_5.
- Kandari, R., and A. Kumar. 2021. “COVID-19 Pandemic Lockdown: Effects on the Air Quality of South Asia.” Environmental Sustainability 4 (3): 543–549. https://doi.org/10.1007/s42398-020-00154-6.
- Kasdagli, M. I., K. Katsouyanni, K. de Hoogh, P. Lagiou, and E. Samoli. 2022. “Investigating the Association between Long-term Exposure to Air Pollution and Greenness with Mortality from Neurological, Cardio-Metabolic and Chronic Obstructive Pulmonary Diseases in Greece.” Environmental Pollution 292:118372. https://doi.org/10.1016/j.envpol.2021.118372.
- Keniger, L. E., K. J. Gaston, K. N. Irvine, and R. A. Fuller. 2013. “What are the Benefits of Interacting with Nature?” International Journal of Environmental Research and Public Health 10 (3): 913–935. https://doi.org/10.3390/ijerph10030913.
- Kim, H., and H. Choi. 2022. “From Hwangsa to COVID-19: The Rise of Mass Masking in South Korea.” East Asian Science, Technology and Society 16 (1): 97–107. https://doi.org/10.1080/18752160.2021.2015124.
- Kim, S. J., H. B. Choi, M. Kang, C. H. Youn, L. B. Chung, and J. Lee. 2022a. “Effects of Green Space in an Apartment Complex on the Environmental Cognition and Stress Response of Residents.” Journal of People, Plants, and Environment 25 (3): 329–336. https://doi.org/10.11628/ksppe.2022.25.3.329.
- Kim, J., and H. Kim. 2017. “Demographic and Environmental Factors Associated with Mental Health: A Cross-sectional Study.” International Journal of Environmental Research and Public Health 14 (4): 431. https://doi.org/10.3390/ijerph14040431.
- Kim, E., S. Park, S. Kim, Y. Choi, J. H. Cho, and G. Kim. 2022b. “Is Altitude a Determinant of the Health Benefits of Nature Exposure? A Systematic Review and Meta-analysis.” Frontiers in Public Health 10. https://doi.org/10.3389/fpubh.2022.1021618.
- Kodavanti, U. P., T. W. Jackson, A. R. Henriquez, S. J. Snow, D. I. Alewel, and D. L. Costa. 2023. “Air Pollutant Impacts on the Brain and Neuroendocrine System with Implications for Peripheral Organs: A Perspective.” Inhalation Toxicology 35 (3–4): 109–126. https://doi.org/10.1080/08958378.2023.2172486.
- Kruize, H., N. van der Vliet, B. Staatsen, R. Bell, A. Chiabai, G. Muiños, S. Higgins, et al. 2019. “Urban Green Space: Creating a Triple Win for Environmental Sustainability, Health, and Health Equity through Behavior Change.” International Journal of Environmental Research and Public Health 16 (22): 4403. https://doi.org/10.3390/ijerph16224403.
- Kumar, P., A. Druckman, J. Gallagher, B. Gatersleben, S. Allison, T. S. Eisenman, U. Hoang, et al. 2019. “The Nexus between Air Pollution, Green Infrastructure and Human Health.” Environment International 133:105181. https://doi.org/10.1016/j.envint.2019.105181.
- Labib, S. M., M. H. Browning, A. Rigolon, M. Helbich, and P. James. 2022. “Nature's Contributions in Coping with a Pandemic in the Twenty-first Century: A Narrative Review of Evidence during COVID-19.” Science of The Total Environment 833:155095. https://doi.org/10.1016/j.scitotenv.2022.155095.
- Lee, K., M. H. Browning, and Y. M. Park. 2023. “Spatiotemporal non-Stationarity in Green Space and Stress Relationships: Recent Evidence from South Korea.” Environmental Research 220:115214. https://doi.org/10.1016/j.envres.2023.115214.
- Lee, H., D. Choi, and J. J. Lee. 2022. “Depression, Anxiety, and Stress in Korean General Population During the COVID-19 Pandemic.” Epidemiology and Health 44:e2022018. https://doi.org/10.4178/epih.e2022018. Epub 2022 January 18. PMID: 35057582; PMCID: PMC9117093.
- Lee, M.-S., J. J. Lee, S. Park, S. Kim, and H. Lee. 2023. “Is Social Support Associated with Postpartum Depression, Anxiety and Perceived Stress among Korean Women Within the First Year Postpartum?.” Journal of Psychosomatic Obstetrics & Gynecology 44 (1). http://doi.org/10.1080/0167482X.2023.2231629.
- Letter, C., and G. Jäger. 2020. “Simulating the Potential of Trees to Reduce Particulate Matter Pollution in Urban Areas Throughout the Year.” Environment, Development and Sustainability 22 (5): 4311–4321. https://doi.org/10.1007/s10668-019-00385-6.
- Li, H., J. Cai, R. Chen, Z. Zhao, Z. Ying, L. Wang, J. Chen, et al. 2017. “Particulate Matter Exposure and Stress Hormone Levels.” Circulation 136 (7) August 15: 618–627. https://doi.org/10.1161/CIRCULATIONAHA.116.026796.
- Li, S., T. Chen, F. Chen, and F. Mi. 2023. “How does the Urban Forest Environment Affect the Psychological Restoration of Residents? A Natural Experiment in Environmental Perception from Beijing.” Forests 14 (10): 1986. https://doi.org/10.3390/f14101986.
- Lim, C. C., H. Kim, M. R. Vilcassim, G. D. Thurston, T. Gordon, L. C. Chen, K. Lee, M. Heimbinder, and S. Y. Kim. 2019. “Mapping Urban Air Quality Using Mobile Sampling with Low-cost Sensors and Machine Learning in Seoul, South Korea.” Environment International 131:105022. https://doi.org/10.1016/j.envint.2019.105022.
- Liou, Y. A., T. H. Vo, K. A. Nguyen, and J. P. Terry. 2023. “Air Quality Improvement Following COVID-19 Lockdown Measures and Projected Benefits for Environmental Health.” Remote Sensing 15 (2): 530. https://doi.org/10.3390/rs15020530.
- Liu, Q., W. Wang, X. Gu, F. Deng, X. Wang, H. Lin, X. Guo, and S. Wu. 2021a. “Association between Particulate Matter Air Pollution and Risk of Depression and Suicide: A Systematic Review and Meta-analysis.” Environmental Science and Pollution Research 28 (8): 9029–9049. https://doi.org/10.1007/s11356-021-12357-3.
- Liu, F., M. Wang, and M. Zheng. 2021b. “Effects of COVID-19 Lockdown on Global Air Quality and Health.” Science of the Total Environment 755:142533. https://doi.org/10.1016/j.scitotenv.2020.142533.
- Lu, J. G. 2020. “Air Pollution: A Systematic Review of its Psychological, Economic, and Social Effects.” Current Opinion in Psychology 32:52–65. https://doi.org/10.1016/j.copsyc.2019.06.024.
- Mallhi, T. H., M. H. Butt, A. Ahmad, S. Misbah, S. Atique, and Y. H. Khan. 2021. “Air Pollutants and Neurological Disorders: From Exposure to Preventive Interventions.” Emerging Contaminants and Associated Treatment Technologies, 31–47. https://doi.org/10.1007/978-3-030-66376-6_2.
- Markevych, I., J. Schoierer, T. Hartig, A. Chudnovsky, P. Hystad, A. M. Dzhambov, S. de Vries, et al. 2017. “Exploring Pathways Linking Greenspace to Health: Theoretical and Methodological Guidance.” Environmental Research 158:301–317. https://doi.org/10.1016/j.envres.2017.06.028.
- Menculini, G., F. Bernardini, L. Attademo, P. M. Balducci, T. Sciarma, P. Moretti, and A. Tortorella. 2021. “The Influence of the Urban Environment on Mental Health during the COVID-19 Pandemic: Focus on Air Pollution and Migration—a Narrative Review.” International Journal of Environmental Research and Public Health 18 (8): 3920. https://doi.org/10.3390/ijerph18083920.
- Mennis, J., X. Li, M. Meenar, J. D. Coatsworth, T. P. McKeon, and M. J. Mason. 2021. “Residential Greenspace and Urban Adolescent Substance Use: Exploring Interactive Effects with Peer Network Health, Sex, and Executive Function.” International Journal of Environmental Research and Public Health 18 (4): 1611. https://doi.org/10.3390/ijerph18041611.
- Meo, S. A., F. J. Almutairi, A. A. Abukhalaf, and A. M. Usmani. 2021. “Effect of Green Space Environment on Air Pollutants PM2. 5, PM10, CO, O3, and Incidence and Mortality of SARS-CoV-2 in Highly Green and Less-Green Countries.” International Journal of Environmental Research and Public Health 18 (24): 13151. https://doi.org/10.3390/ijerph182413151.
- Mikhailova, T. A., O. V. Shergina, A. S. Mironova, and D. A. Chesnakov. 2022. “Accumulation of Particulate Matter by Urban Forests from Polluted Air.” Siberian Journal of Life Sciences and Agriculture 14 (5): 27–48. https://doi.org/10.12731/2658-6649-2022-14-5-27-48.
- ©Minnesota Department of Natural Resources. 2023. The Minnesota Department of Natural Resources Website (online). Accessed June 29, 2023. mndnr.gov/copyright Minnesota Department of Natural Resources 500 Lafayette Road St. Paul, MN 55155-4046. (2022, May 10). Mixed Coniferous-deciduous Forest. Minnesota Department of Natural Resources. https://www.dnr.state.mn.us/rys/pg/mixedforest.html
- Mumford, D. B., M. Nazir, F. Jilani, and I. Y. Baig. 1996. “Stress and Psychiatric Disorder in the Hindu Kush.” British Journal of Psychiatry 168 (3): 299–307. https://doi.org/10.1192/bjp.168.3.299.
- Muro, A., C. Mateo, E. Parrado, M. Subirana-Malaret, M. Moya, A. Garriga, J. Canals, A. Chamarro, and A. Sanz. 2023. “Forest Bathing and Hiking Benefits for Mental Health during the COVID-19 Pandemic in Mediterranean Regions.” European Journal of Forest Research 142 (2): 415–426. https://doi.org/10.1007/s10342-023-01531-6.
- Nath, T. K. 2022. “Urban Green Space, Green Exercise and Health Outcomes: Evidence from Kuala Lumpur, Malaysia.” In Urban Forestry and Arboriculture in Malaysia, edited by S. Maruthaveeran, W. Y. Chen, and J. Morgenroth, 343–356. Singapore: Springer Nature Singapore. https://doi.org/10.1007/978-981-19-5418-4_20.
- Ndrepepa, G. 2019. “Myeloperoxidase–A Bridge Linking Inflammation and Oxidative Stress with Cardiovascular Disease.” Clinica Chimica Acta 493:36–51. https://doi.org/10.1016/j.cca.2019.02.022.
- Nochaiwong, S., C. Ruengorn, K. Thavorn, B. Hutton, R. Awiphan, C. Phosuya, Y. Ruanta, N. Wongpakaran, and T. Wongpakaran. 2021. “Global Prevalence of Mental Health Issues among the General Population During the Coronavirus Disease-2019 Pandemic: A Systematic Review and Meta-analysis.” Scientific Reports 11:10173. https://doi.org/10.1038/s41598-021-89700-8.
- Nutsford, D., A. L. Pearson, and S. Kingham. 2013. “An Ecological Study Investigating the Association between Access to Urban Green Space and Mental Health.” Public Health 127 (11): 1005–1011. https://doi.org/10.1016/j.puhe.2013.08.016.
- O'Connor, D. B., J. F. Thayer, and K. Vedhara. 2021. “Stress and Health: A Review of Psychobiological Processes.” Annual Review of Psychology 72 (1): 663–688. https://doi.org/10.1146/annurev-psych-062520-122331.
- Park, J., J. Jung, Y. Choi, S. Mousavinezhad, and A. Pouyaei. 2022. “The Sensitivities of Ozone and PM2. 5 Concentrations to the Satellite-derived Leaf Area Index Over East Asia and its Neighboring Seas in the WRF-CMAQ Modeling System.” Environmental Pollution 306:119419. https://doi.org/10.1016/j.envpol.2022.119419.
- Park, S., S. Kim, G. Kim, Y. Choi, E. Kim, and D. Paek. 2021. “Evidence-based Status of Forest Healing Program in South Korea.” International Journal of Environmental Research and Public Health 18 (19): 10368. https://doi.org/10.3390/ijerph181910368.
- Park, J. H., H. W. Lee, and J. H. Kim. 2022. “An Analysis of Factors Influencing the Perception of Stress among Residents in Gyeongsangnam-do in COVID-19.” Journal of Health Informatics and Statistics 47 (4): 312–321.
- Phan, A., and H. Fukui. 2023. “Unusual Response of O3 and CH4 to NO2 Emissions Reduction in Japan during the COVID-19 Pandemic.” International Journal of Digital Earth 17 (1). https://doi.org/10.1080/17538947.2023.2297844.
- Phung, V. L. H., K. Oka, Y. Hijioka, K. Ueda, M. Sahani, and W. R. W. Mahiyuddin. 2022. “Environmental Variable Importance for Under-five Mortality in Malaysia: A Random Forest Approach.” Science of The Total Environment 845:157312. https://doi.org/10.1016/j.scitotenv.2022.157312.
- Pun, V. C., J. Manjourides, and H. H. Suh. 2018. “Association of Neighborhood Greenness with Self-perceived Stress, Depression and Anxiety Symptoms in Older US Adults.” Environmental Health 17 (1): 1–11. https://doi.org/10.1186/s12940-017-0345-y.
- Rasheed, N. 2016. “Prolonged Stress Leads to Serious Health Problems: Preventive Approaches.” International Journal of Health Sciences 10 (1): v–vi. https://doi.org/10.12816/0031211.
- Reames, T. G., and M. A. Bravo. 2019. “People, Place and Pollution: Investigating Relationships Between Air Quality Perceptions, Health Concerns, Exposure, and Individual-and Area-level Characteristics.” Environment International 122:244–255.
- Reyes-Riveros, R., A. Altamirano, F. De La Barrera, D. Rozas-Vásquez, L. Vieli, and P. Meli. 2021. “Linking Public Urban Green Spaces and Human Well-being: A Systematic Review.” Urban Forestry & Urban Greening 61:127105. https://doi.org/10.1016/j.ufug.2021.127105.
- Rodríguez-Urrego, D., and L. Rodríguez-Urrego. 2020. “Air Quality during the COVID-19: PM2. 5 Analysis in the 50 Most Polluted Capital Cities in the World.” Environmental Pollution 266:115042. https://doi.org/10.1016/j.envpol.2020.115042.
- Roe, J. J., C. W. Thompson, P. A. Aspinall, M. J. Brewer, E. I. Duff, D. Miller, R. Mitchell, and A. Clow. 2013. “Green Space and Stress: Evidence from Cortisol Measures in Deprived Urban Communities.” International Journal of Environmental Research and Public Health 10 (9): 4086–4103. https://doi.org/10.3390/ijerph10094086.
- Russell, G., and S. Lightman. 2019. “The Human Stress Response.” Nature Reviews Endocrinology 15 (9): 525–534. https://doi.org/10.1038/s41574-019-0228-0.
- Santurtún, A., M. L. Colom, P. Fdez-Arroyabe, A. Del Real, I. Fernández-Olmo, and M. T. Zarrabeitia. 2022. “Exposure to Particulate Matter: Direct and Indirect Role in the COVID-19 Pandemic.” Environmental Research 206:112261. https://doi.org/10.1016/j.envres.2021.112261.
- Sass, V., N. Kravitz-Wirtz, S. M. Karceski, A. Hajat, K. Crowder, and D. Takeuchi. 2017. “The Effects of Air Pollution on Individual Psychological Distress.” Health & Place 48:72–79. https://doi.org/10.1016/j.healthplace.2017.09.006.
- Seo, J. H., H. W. Jeon, U. J. Sung, and J. R. Sohn. 2020a. “Impact of the COVID-19 Outbreak on Air Quality in Korea.” Atmosphere 11 (10): 1137. https://doi.org/10.3390/atmos11101137.
- Seo, J. H., J. S. Kim, J. Yang, H. Yun, M. Roh, J. W. Kim, S. Yu, et al. 2020b. “Changes in Air Quality During the COVID-19 Pandemic and Associated Health Benefits in Korea.” Applied Sciences 10 (23): 8720. https://doi.org/10.3390/app10238720.
- Shin, J., J. Y. Park, and J. Choi. 2018. “Long-term Exposure to Ambient Air Pollutants and Mental Health Status: A Nationwide Population-Based Cross-Sectional Study.” PLoS One 13 (4): e0195607.
- Silva, A. C. T., P. T. Branco, and S. I. Sousa. 2022. “Impact of COVID-19 Pandemic on Air Quality: A Systematic Review.” International Journal of Environmental Research and Public Health 19 (4): 1950. https://doi.org/10.3390/ijerph19041950.
- Slater, S. J., R. W. Christiana, and J. Gustat. 2020. “Peer Reviewed: Recommendations for Keeping Parks and Green Space Accessible for Mental and Physical Health During COVID-19 and Other Pandemics.” Preventing Chronic Disease 17. https://doi.org/10.5888/pcd17.200204.
- Son, J. Y., M. L. Bell, and J. T. Lee. 2010. “Individual Exposure to Air Pollution and Lung Function in Korea: Spatial Analysis Using Multiple Exposure Approaches.” Environmental Research 110 (8): 739–749. https://doi.org/10.1016/j.envres.2010.08.003.
- Sosa, B. S., A. Porta, J. E. C. Lerner, R. B. Noriega, and L. Massolo. 2017. “Human Health Risk due to Variations in PM10-PM2. 5 and Associated PAHs Levels.” Atmospheric Environment 160:27–35. https://doi.org/10.1016/j.atmosenv.2017.04.004.
- Speiser, J. L., M. E. Miller, J. Tooze, and E. Ip. 2019. “A Comparison of Random Forest Variable Selection Methods for Classification Prediction Modeling.” Expert Systems with Applications 134:93–101. https://doi.org/10.1016/j.eswa.2019.05.028.
- Stratoulias, D., and N. Nuthammachot. 2020. “Air Quality Development during the COVID-19 Pandemic Over a Medium-Sized Urban Area in Thailand.” Science of the Total Environment 746:141320. https://doi.org/10.1016/j.scitotenv.2020.141320.
- Sun, S., W. Xiang, S. Ouyang, Y. Hu, Z. Zhao, X. Xu, K. Yue, et al. 2022. “Higher Canopy Interception Capacity of Forests Restored to the Climax Stage in Subtropical China.” Hydrological Processes 36 (3): e14538. https://doi.org/10.1002/hyp.14538.
- Tao, Y., L. Kou, Y. Chai, and M. P. Kwan. 2021. “Associations of Co-exposures to Air Pollution and Noise with Psychological Stress in Space and Time: A Case Study in Beijing, China.” Environmental Research 196:110399. https://doi.org/10.1016/j.envres.2020.110399.
- Tella, A., A. L. Balogun, N. Adebisi, and S. Abdullah. 2021. “Spatial Assessment of PM10 Hotspots Using Random Forest, K-nearest Neighbour and Naïve Bayes.” Atmospheric Pollution Research 12 (10): 101202. https://doi.org/10.1016/j.apr.2021.101202.
- Thomson, E. M. 2019. “Air Pollution, Stress, and Allostatic Load: Linking Systemic and Central Nervous System Impacts.” Journal of Alzheimer's Disease 69 (3): 597–614. https://doi.org/10.3233/JAD-190015.
- Trushna, T., V. Dhiman, D. Raj, and R. R. Tiwari. 2021. “Effects of Ambient Air Pollution on Psychological Stress and Anxiety Disorder: A Systematic Review and Meta-analysis of Epidemiological Evidence.” Reviews on Environmental Health 36 (4): 501–521. https://doi.org/10.1515/reveh-2020-0125.
- Ugolini, F., L. Massetti, P. Calaza-Martínez, P. Cariñanos, C. Dobbs, S. K. Ostoić, A. M. Marin, et al. 2020. “Effects of the COVID-19 Pandemic on the use and Perceptions of Urban Green Space: An International Exploratory Study.” Urban Forestry & Urban Greening 56:126888. https://doi.org/10.1016/j.ufug.2020.126888.
- Ulrich, R. S., R. F. Simons, B. D. Losito, E. Fiorito, M. A. Miles, and M. Zelson. 1991. “Stress Recovery During Exposure to Natural and Urban Environments.” Journal of Environmental Psychology 11 (3): 201–230.
- Van den Berg, A. E., J. Maas, R. A. Verheij, and P. P. Groenewegen. 2010. “Green Space as a Buffer Between Stressful Life Events and Health.” Social Science & Medicine 70 (8): 1203–1210. https://doi.org/10.1016/j.socscimed.2010.01.002.
- Wang, R., Z. Feng, and J. Pearce. 2022. “Neighbourhood Greenspace Quantity, Quality and Socioeconomic Inequalities in Mental Health.” Cities 129:103815. https://doi.org/10.1016/j.cities.2022.103815.
- Wang, X., L. Meng, Y. Liu, and H. Wei. 2023. “Facial Expressions of Urban Forest Visitors Jointly Exposed to Air Pollution and Regional Climate.” Forests 14 (8): 1571. https://doi.org/10.3390/f14081571.
- Wang, R., B. Yang, Y. Yao, M. S. Bloom, Z. Feng, Y. Yuan, J. Zhang, et al. 2020. “Residential Greenness, Air Pollution and Psychological Well-being among Urban Residents in Guangzhou, China.” Science of The Total Environment 711:134843. https://doi.org/10.1016/j.scitotenv.2019.134843.
- Wei, Q., Y. Ji, H. Gao, W. Yi, R. Pan, J. Cheng, Y. He, et al. 2022. “Oxidative Stress-mediated Particulate Matter Affects the Risk of Relapse in Schizophrenia Patients: Air Purification Intervention-Based Panel Study.” Environmental Pollution 292:118348. https://doi.org/10.1016/j.envpol.2021.118348.
- Wijnands, J. S., K. A. Nice, S. Seneviratne, J. Thompson, and M. Stevenson. 2022. “The Impact of the COVID-19 Pandemic on Air Pollution: A Global Assessment Using Machine Learning Techniques.” Atmospheric Pollution Research 13 (6): 101438.
- Wood, L., P. Hooper, S. Foster, and F. Bull. 2017. “Public Green Spaces and Positive Mental Health–Investigating the Relationship Between Access, Quantity and Types of Parks and Mental Wellbeing.” Health & Place 48:63–71. https://doi.org/10.1016/j.healthplace.2017.09.002.
- World Urban Population 1960–2023 | MacroTrends. n.d. Accessed May 10, 2023. https://www.macrotrends.net/countries/WLD/world/urban-population.
- Wróblewska, K., and B. R. Jeong. 2021. “Effectiveness of Plants and Green Infrastructure Utilization in Ambient Particulate Matter Removal.” Environmental Sciences Europe 33 (1): 1–24. https://doi.org/10.1186/s12302-021-00547-2.
- Xie, J., S. Luo, K. Furuya, and D. Sun. 2020. “Urban Parks as Green Buffers during the COVID-19 Pandemic.” Sustainability 12 (17): 6751. https://doi.org/10.3390/su12176751.
- Yang, M., L. Chen, G. Msigwa, K. H. D. Tang, and P. S. Yap. 2022. “Implications of COVID-19 on Global Environmental Pollution and Carbon Emissions with Strategies for Sustainability in the COVID-19 era.” Science of the Total Environment 809:151657. https://doi.org/10.1016/j.scitotenv.2021.151657.
- Yang, J., S. Qu, M. Liu, X. Liu, Q. Gao, W. He, J. S. Ji, and J. Bi. 2021. “Gray Cityscape Caused by Particulate Matter Pollution Hampers Human Stress Recovery.” Journal of Cleaner Production 279:123215. https://doi.org/10.1016/j.jclepro.2020.123215.
- Yao, Z., Y. Wang, X. Qiu, and F. Song. 2023. “Impact of Anthropogenic Emission Reduction during COVID-19 on Air Quality in Nanjing, China.” Atmosphere 14 (4): 630. https://doi.org/10.3390/atmos14040630.
- Zhang, X., X. Zhang, and X. Chen. 2017. “Happiness in the Air: How Does a Dirty sky Affect Mental Health and Subjective Well-Being?” Journal of Environmental Economics and Management 85:81–94. https://doi.org/10.1016/j.jeem.2017.04.001.
- Zhang, R., C. Q. Zhang, and R. E. Rhodes. 2021. “The Pathways Linking Objectively-Measured Greenspace Exposure and Mental Health: A Systematic Review of Observational Studies.” Environmental Research 198:111233. https://doi.org/10.1016/j.envres.2021.111233.
- Zhao, S., and A. Patuano. 2022. “International Chinese Students in the UK: Association between Use of Green Spaces and Lower Stress Levels.” Sustainability 14 (1): 89. https://doi.org/10.3390/su14010089.
- Zhou, W., Q. Wang, R. Li, A. Kadier, W. Wang, F. Zhou, and L. Ling. 2023. “Combined Effects of Heatwaves and Air Pollution, Green Space and Blue Space on the Incidence of Hypertension: A National Cohort Study.” Science of the Total Environment 867:161560. https://doi.org/10.1016/j.scitotenv.2023.161560.