
 ?Mathematical formulae have been encoded as MathML and are displayed in this HTML version using MathJax in order to improve their display. Uncheck the box to turn MathJax off. This feature requires Javascript. Click on a formula to zoom.
ABSTRACT
Urban digital twins and realistic three-dimensional (3D) scenes have further enhanced the ever-increasing demand for building models. Airborne Laser Scanning (ALS) point clouds are the predominant data source for 3D building reconstruction owing to their highly detailed spatial features. However, information on the reconstruction of compound buildings (i.e. buildings with diverse plane structures or various roof structures) is lacking. Existing methods often produce building models that suffer from topological inconsistencies and/or geometric errors. To address these issues, this study proposes an automatic building reconstruction approach based on ALS point cloud that offers both modeling flexibility and geometric consistency. Specifically, a structure-aware partitioning algorithm that partitions a complex building roof into several regular roof patches is incorporated. Subsequently, a primitive model library comprising representative primitives suitable for building reconstruction is created. Suitable primitive model selection and reconstruction optimization are employed to ensure the accuracy and compactness in the final model. To comprehensively evaluate the performance, two typical ALS point cloud datasets are tested. Experiments demonstrate the generated models can achieve a boundary consistency of 92% while ensuring Root Mean Square Error below 0.09 m. Comparative experiments with state-of-the-art methods further validate the effectiveness of the proposed approach in compound building reconstruction.
1. Introduction
Urban digital twins and realistic three-dimensional (3D) scenes are integral components of the digital earth that have further enhanced the ever-increasing demand for 3D building structure reconstruction (Guo et al. Citation2021). Geographic Information System (GIS)-based 3D building models can represent the spatiotemporal information required for smart city applications (Guo et al. Citation2024). In particular, structural building models are essential in various multiple geospatial applications such as urban planning (Liu et al. Citation2021), intelligent transportation (Anand et al. Citation2019), disaster assessment (Vetrivel et al. Citation2018), and deformation monitoring (Awrangjeb, Gilani, and Siddiqui Citation2018). Over the past few decades, Airborne Laser Scanning (ALS) technology has been widely used to efficiently capture accurate and highly detailed spatial data of urban scenes. ALS point cloud-based building structure reconstruction has attracted considerable attention from the photogrammetry, remote sensing, and computer vision communities (Bauchet and Lafarge Citation2019; Qin, Hu, and Dai Citation2018). However, owing to the limitations of existing methods, achieving robust and accurate building structure reconstruction remains challenging.
ALS point clouds can describe the details of building roofs well; however, they fail to fully capture the facades of buildings (Huang et al. Citation2022; Wu et al. Citation2017). Therefore, previous studies have primarily focused on roof reconstruction. Nevertheless, several significant obstacles can hinder the task: (1) Noise or outliers, missed points caused by occlusions, and varying point densities can greatly impact modeling precision (Chen et al. Citation2022). (2) Numerous compound buildings exist in urban scenes, presenting challenges during crucial steps (e.g. segmentation, assembly, and optimization) in the modeling process (Li et al. Citation2022; Weixiao et al. Citation2023). (3) Urban buildings have various roof structures (e.g. flats, gables, hip roofs), requiring more flexible and generic primitive model libraries to achieve precise modeling (Jain and Susan Citation2013; Shao et al. Citation2021).
Extensive studies have attempted to address these challenges and enhance the effectiveness, robustness, and accuracy of ALS data-based roof reconstruction. Existing methods can be primarily categorized into data-, model-, and hybrid-driven. Data-driven methods extract geometric features directly from point clouds and assemble them into complete models by considering the topological relationships between them (Chen et al. Citation2020; Poullis Citation2013; Wang et al. Citation2020). Although these methods preserve the building details well, the results lack geometric consistency and are susceptible to noise and missing points. Model-driven methods create primitive model libraries that cover multiple building roofs. A primitive model can match point clouds by changing its size and/or shape (Dehbi, Koppers, and Plümer Citation2019; Li, Zhang, and Shan Citation2020; Zhang, Li, and Shan Citation2021). Model-driven methods are more robust and geometrically consistent; however, they may miss building details. The key to hybrid-driven methods lies in achieving the optimal reconstruction result by striking a balance between data and primitive models (Malihi et al. Citation2016; Li, Rottensteiner, and Heipke Citation2019). Hybrid-driven methods achieve more accurate models than those achieved using model-driven methods; however, for datasets with dozens of buildings, the processing time is longer, and the model volume is significantly larger. Considering the above, in this study, a model-driven method is adopted for the urban scene dataset.
This study focuses on a novel model-driven method for generating frame-structured rooftop models, particularly for urban scenes with a multitude of compound buildings. The main contributions of this study are summarized as follows: (1) A novel structure-aware partitioning method for handling compound buildings with diverse plane structures is introduced; regular partitioning of complex structures is implemented, and good results are achieved. (2) A primitive model library comprising representative primitives in the urban scene is established, balancing the diversity and effectiveness of reconstruction. (3) An energy function for selecting the optimal primitive model for each partitioned regular roof patch is introduced; the function measures the degree of matching between the roof patch and each primitive model transformed by the non-rigid Coherent Point Drift (CPD) algorithm.
The remainder of this paper is organized as follows: Section 2 presents an overview of recent studies on ALS point cloud-based building modeling and summarizes their advantages and disadvantages. Section 3 presents the reconstruction method, including a regular structure-aware partitioning of the building roof, suitable primitive model selection, and reconstruction optimization. Section 4 presents the experimental results and relevant analyses. Finally, Section 5 concludes the study.
2. Related works
ALS point cloud-based building modeling has been a highly researched topic over the past few decades. This section presents a perspective on the core techniques, including primitive model library creation and assembly, and reviews existing building modeling methods.
2.1. Creation of primitive model library
Primitive model libraries are a fundamental requirement for model-driven methods. The creation of a flexible primitive model library is crucial for achieving effective and accurate modeling. In general, more diverse primitive models enable more accurate results. Therefore, the development of primitive model libraries that accommodate complex building roofs in urban scenes is an important research topic in the domain of model-driven methods.
Initial studies on primitive model libraries focused only on common individual roof structures. Zhang and Fan (Citation2022) integrated LiDAR point clouds with optical imagery to primitive models with clear edges and proposed simple primitive models with cubic or hip roof structures. Subsequently, a parametric approach was employed to standardize the geometric characteristics of the primitive models. Huang, Brenner, and Sester (Citation2013) designed three primitive sets consisting of a limited number of planes, achieving building modeling with only a few parameters. However, this approach is applicable only in simple urban scenarios. Eventually, additional primitive models were added. For instance, Gooding, Crook, and Tomlin (Citation2015) defined a primitive with a ridge length that was less than 35% of the footprint length of the hip primitive, whereas a length that was greater than 68% of the footprint length was considered as the long hip primitive. Zheng, Weng, and Zheng (Citation2017) categorized roof types based on the orientation of the roof surface. A gable roof is defined as a roof with two upward-sloping sides that converge at the ridge. A hip roof is characterized by all sides sloping towards the ridge, albeit usually with gentler slopes compared to those of a gable roof. In recent years, primitive model libraries have been further expanded. The BuildingReconstruction software (Buyukdemircioglu, Kocaman, and Isikdag Citation2018) includes 32 CityGML-format roof types for automatic reconstruction. In addition, Zhang, Li, and Shan (Citation2021) developed a secondary primitive library for model bonding to address the challenges encountered during roof reconstruction, such as chimneys and attics, thereby facilitating the handling of more complex scenarios.
These methods can perform well in scenes with individual buildings and simple horizontal structures. However, there is a lack of primitive model libraries that consider ubiquitous compound buildings that do not meet the accuracy requirements for reconstruction. Therefore, it is necessary to develop more general and detailed primitives as well as a flexible structure partitioning strategies to expand the applicability of modeling.
2.2. Primitive model assembly
Substantial research focuses also on the primitive model assembly, involving two key techniques: primitive recognition and geometric fitting. Primitive recognition employs traditional or deep learning-based methods to make the primitive model match the point cloud. Geometric fitting ensures that the shape, size, and position of the primitives are consistent with the point cloud.
For primitive recognition, deep learning-based methods have attracted the attention of researchers (Chen et al. Citation2021; Ponciano et al. Citation2021; Yang, Hou, and Li Citation2023; Zhang et al. Citation2019). Bittner et al. (Citation2019) conducted a study on the classification of roofs, including flat and non-flat roofs, utilizing a 50-cm resolution satellite image within a conflict network. In contrast, Pohle-Fröhlich et al. (Citation2019) evaluated the performances of PointNet, PointNet++, and U-Net in 3D roof segmentation based on slope orientation and found that PointNet++ and U-Net outperform other methods in terms of accuracy. To further improve the automation and efficiency of 3D roof segmentation, Zhang et al. (Citation2022) proposed a two-branch network comprising an instance and a semantics branch. The extracted instance and semantics features are aggregated to obtain a more discriminative feature, thereby improving the accuracy of semantic predictions. Learning-based methods offer the advantage of a high recognition accuracy when trained on sufficient labeled samples. However, the labeling process is labor-intensive and time-consuming.
Considering the difficulties associated with deep learning-based methods, in traditional methods, Vo et al. (Citation2015) applied a coarse-to-fine strategy to detect plane primitives based on the similar geometric properties of adjacent points and improved the efficiency by octree-based voxelization. The topological information between the geometric elements of the roof is also typically utilized to recognize the roof. Wang, Peethambaran, and Chen (Citation2018) applied the Roof Topology Graph (RTG) to describe the topological information of building roofs. Li et al. (Citation2022) further expanded the four types of sloping roofs, namely shed, gable, hip, and pyramid, and recognized them by selecting the primitives matching the most with the point cloud. The primitive model with the highest score was determined as the best match by introducing three score functions and measuring the matching results. Dey et al. (Citation2023) promoted 3D building reconstruction by segmenting different feature points (such as boundaries, folded edges, and roof points) on the building roof and then used the obtained feature points to establish the relationship between feature lines and roof patches.
After primitive recognition, geometric fitting entails further determination of the parameters of each primitive, such as length, width, height, center position, and rotation angle. Zhang, Li, and Shan (Citation2021) simplified the parameters of primitives into two distinct categories, namely shape and position parameters, and used PointNet++ for their determination. This method can also be extended to construct superstructures, such as attics and chimneys. Similarly, to optimize the processing time, non-learning studies focusing on parameter determination were also conducted. Dehbi et al. (Citation2021) proposed an active sampling strategy that pairs data samples to form surfaces, enabling the extraction of essential parameters, including azimuth, inclination, ridge height, internal accuracy, and consistency. Li et al. (Citation2022) employed an improved RANSAC multi-primitive segmentation framework for roof patch segmentation. This method involved an energy function to facilitate parameter determination, effectively addressing the challenges of sparse and partially missing point clouds. Tarsha Kurdi et al. (Citation2023) achieved cylindrical modeling by determining the axis and cross-section. A new method for automatically generating cross-sections was introduced. In addition, potential points related to the building decoration were used to improve the building models. These methods only consider the geometric inconsistencies between primitives, resulting in poor detail accuracy in the final model.
In general, there are traditional geometry-based and deep learning-based methods for modeling 3D building roof models from ALS point cloud. The geometry-based methods can be further divided into model-driven (top-down) and data-driven (bottom-up) approaches. Model-driven methods attempt to approximate building structures using a combination of predefined simple primitives. The key challenges lie in constructing the basic roof shapes into appropriate primitives and combining them correctly based on geometric positioning (Huang, Brenner, and Sester Citation2013; Li and Shan Citation2022; Li, Zhang, and Shan Citation2020; Xiong et al. Citation2015). Data-driven methods, on the other hand, first extract geometric features (points, lines, planes) from the point cloud using segmentation, and then analyze the topologies of these features to reconstruct the roof model (Li et al. Citation2017; Nan and Wonka Citation2017; Ochmann, Vock, and Klein Citation2019; Valero, Bosché, and Forster Citation2018). For deep learning-based methods, the neural networks are employed to assist various aspects of 3D building reconstruction, such as detecting vertices and edges, predicting roof types, and constructing topological graphs. However, these approaches are often limited by the availability of labeled 3D building model data (Jiang et al. Citation2023; Li et al. Citation2022; Yu, Liu, and Zhang Citation2022; Zhang, Li, and Shan Citation2021).
3. Method
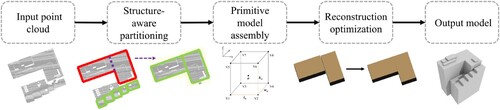
The framework is shown in and comprises three main components: (1) regular structure-aware partitioning, (2) primitive model assembly, and (3) reconstruction optimization. Specifically, the input data needs to be preprocessed to remove ground points and retain roof. This paper performs clustering on roofs and classifies them as regular or irregular roof patches using the Minimum Bounding Rectangle (MBR) method. For irregular roof patches, a structure-aware partitioning algorithm is employed to further partition them into regular roof patches. Subsequently, a primitive model library that encompasses common building roof types in the urban scene is created. Primitive models are selected and parameterized to best match the regular roof patches. Finally, reconstruction optimization is performed on the primitives to obtain a watertight model by eliminating geometric errors and addressing topological inconsistencies.
Figure 1. Framework of the proposed method.
3.1. Regular structure-aware partitioning of building roofs
A regular structure-aware partitioning algorithm is proposed to adaptively partition a building roof into several regular roof patches. The partitioning algorithm consists of two parts: irregular roof patch recognition (Section 3.1.1) and irregular roof patch partitioning (Section 3.1.2).
3.1.1. Irregular roof patch recognition using MBR
A roof patch is a contiguous region in a point cloud. In the partitioning algorithm, roof patches are utilized as fundamental units. To extract roof patches, the Density-Based Spatial Clustering of Applications with Noise (DBSCAN) algorithm (Kumar and Reddy Citation2016; Zhang et al. Citation2022) is applied because of its ability to aggregate proximate and densely populated points into groups. This algorithm is based on density clustering and the clustering of areas with sufficient space density into a point set. For compound buildings, in order to ensure the extraction accuracy of the roof patches, we process the rough and fine extraction through multiple clustering.
Both regular and irregular roof patches are observed in compound buildings after clustering. Regular roof patches are defined as roof patches with rectangular horizontal contours and no hollow regions inside, whereas irregular roof patches are not defined as such. To improve the modeling accuracy, an irregular roof patch recognition method was designed based on the MBR (Kwak and Habib Citation2014). Specifically, the points of each roof patch are divided into equal-sized grids along a rectangle constructed using the minimum and maximum coordinates of the point cloud, as depicted in . The grid resolution has been determined through multiple experiments and is set to 1 m in this study. The accumulated area of grids containing falling points is calculated as Sgrid, and the rectangular area is SMBR, as shown in EquationEq. 1(1)
(1) . A grid with no falling points is not counted.
(1)
(1) where N denotes the number of all grids, Δ denotes the grid resolution, p denotes a point in grid, card denotes the cardinality of grids, and l and w denote the length and width of the MBR of a roof patch, respectively.
Figure 2. Irregular roof patch recognition based on the Minimum Bounding Rectangle (MBR) method (top view).
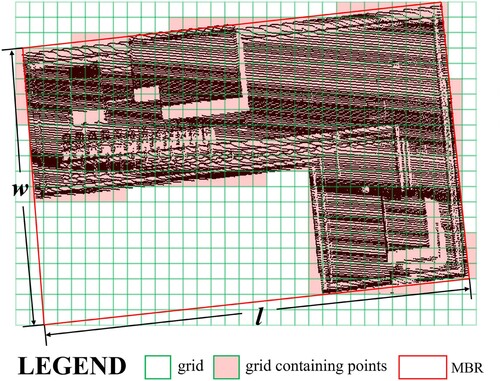
Considering the geometric characteristics of roof patches, the area of their horizontal contours is always less than or equal to the MBR area. The MBR ensures that all points are included while maintaining the smallest possible area, with the area SMBR being usually larger than the grid area Sgrid. In particular, regular roof patches exhibit small area differences, whereas irregular roof patches often have significant area variations and can thus be readily distinguished. Based on this, this study calculates the discriminant factor IFR indicating whether a roof patch is regular or not, as shown in EquationEq. 2(2)
(2) .
(2)
(2) where γ denotes the partition threshold (γ = 0.3 is suggested; the discussion on the specific value is presented in Section 4.4). If the area difference between SMBR and Sgrid is larger than SMBR • γ, the horizontal contour of the roof patch differs significantly from a rectangle, i.e. the roof patch is irregular.
3.1.2. Irregular roof patch partitioning
To facilitate subsequent primitive-based modeling and ensure the modeling accuracy of compound buildings, it is necessary to further partition each irregular roof patch into regular roof patches that are easy to reconstruct. A regular structure-aware partitioning method is proposed that partitions an irregular roof patch into multiple regular roof patches by analyzing the corner points on the roof contour and ridge (only for sloping roofs). The main steps are as follows:
Step 1: For each irregular roof patch, the alpha-shape method of Li, Rottensteiner, and Heipke (Citation2019) is used to extract the outer contour, the value of alpha is determined as 1 m based on the average point density of the datasets selected in this paper and the region-growing algorithm of Wang et al. (Citation2020) is used to detect the planes.
Step 2: From the detected planes, the plane closest to the highest point is identified, and the included angle between the normal and vertical vectors is calculated. If the included angle is less than a certain threshold (i.e. 10°), the roof patch is treated as a flat roof; otherwise, it is treated as a sloping roof.
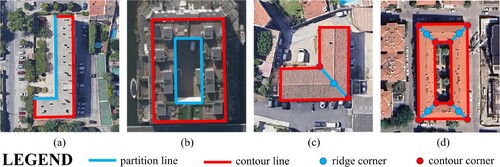
Step 3: For each flat roof, if the outer contour is a concave polygon, the building typically exhibits either an L-shaped (as shown in a) structure roof. The RANSAC algorithm is employed to detect each outer contour line and select one passing through the concave point as the partition line. For an outer contour with multiple concave points like C-shaped of E-shaped, the line passing through two concave points is prioritized as the partition line. If the outer contour is a convex polygon, the buildings are usually ring-shaped (as shown in b). The inner contour lines are extracted as partition lines.
Step 4: For each sloping roof, if the outer contour is a concave polygon (L-shaped, as shown in c), the corner points of the roof contour and ridge are extracted by intersecting the planes. The concave point and its nearest contour and ridge corners are selected to form the partition plane. In the case of a convex polygon (as shown in d), the corner points are divided into ridge corners and inner and outer contour corners. A ridge corner, its nearest inner contour corner, and the nearest outer contour corner are selected to form a partition plane.
Step 5: The irregular roof patches are partitioned into several regular roof patches based on the formed partition planes. It is possible to partition multiple times until all results meet the criteria for determining regular roof patches.
Figure 3. L – and ring-shaped structure roofs (a. L-shaped flat roof; b. ring-shaped flat roof; c. L-shaped sloping roof; d. ring-shaped sloping roof).
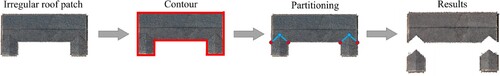
The partitioning procedure is shown in , taking a C-shaped sloping roof as an example.
Figure 4. Partitioning procedure.
3.2. Primitive model assembly for reconstruction
Considering the common characteristics of urban building structures, a novel primitive model library encompassing nine types of primitive models is designed. This study attempts to use as few entries as possible to build them, thereby improving the adaptability and flexibility of the library. Primitives have rectangular footprints that align with the common architectural design of most buildings.
3.2.1. Primitive model library creation
Owing to the complexity and diversity of roof types, it is essential to create a primitive model library. Complex primitives can enhance the modeling accuracy; however, they also introduce additional parameters, which may reduce the generality. Therefore, an ideal primitive model library should strike a balance between diversity and the use of as few parameters as possible.
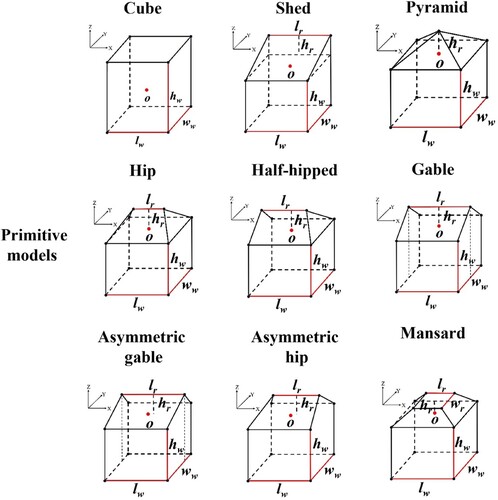
To achieve this, nine primitive models are designed in the library. These primitives cover the common roof forms of buildings in the urban scene. The nine primitive models and their control parameters are shown in . For each primitive model, the control parameters define the spatial attributes. These parameters include shape and position parameters. The former describe the shape and size of the primitive model, including the wall length lw, wall width ww, wall height hw, roof height hr, roof length lr and roof width wr; the latter describe the precise orientation and position of the primitive model, which are defined by the center point position o and the rotation angle k around the Z-axis.
Figure 5. Primitive model library and control parameters.
3.2.2. Suitable primitive model selection
Multiple regular roof patches are obtained after partitioning. A suitable primitive model from the primitive model library is selected to best match each regular roof patch. However, the transformation between the roof patch and the primitive model is non-rigid. In contrast, the non-rigid CPD algorithm (Myronenko and Song Citation2010) determines a transformation between the reference point cloud and the possible deformed point cloud, guaranteeing optimal registration between them. The algorithm exhibits robust and accurate performance in processing point clouds with noise, point density variation, and conclusions. Compared with traditional registration methods, it shows robust and accurate performance in processing point clouds with noise, point density variation and conclusions. Therefore, this study applies the non-rigid CPD algorithm to achieve the best match between any primitive model and the roof patch.
For each primitive model, the sampled point cloud is marked as T, and the point cloud of the roof patch is marked as Q. The transformation is shown in Eq.3:
(3)
(3) where P is the transformed point cloud of T, G is a Gaussian distribution matrix of T, W is a transformation coefficient matrix, and GW is the displacement matrix. The Expectation Maximization (EM) optimization is used to calculate the GW. Specifically, the E-step is used to construct the probability distribution of pmn. The M-step updates the displacement, as shown in EquationEq. 4
(4)
(4) :
(4)
(4) where M and N represent the total numbers of points in T and Q, respectively, Ti and Qj represent points in T and Q, respectively, σ2 is the covariance, w is the amount of noise (0 < w < 1), and Gi is an exclusive matrix for Ti. After transforming T, we obtain P, which aligns closely with Q. It is noteworthy that P is not identical to Q because of the differences in the number of points and positions of adjacent points that do not completely overlap.
An energy function is then devised to compute the degree of matching between P and Q. Each primitive model in the primitive model library is evaluated, and the one with the highest score is designated as the optimal primitive model, as shown in EquationEq. 5(5)
(5) :
(5)
(5) where EOverlapping is the overlapping term, EVarying is the varying term, and λ is the weight coefficient for balancing them. The computational result of the energy function can be regarded as a measure of the degree of matching. A higher value of E indicates a better match between the primitive model and roof patch. The overlapping term is used to quantify the degree of overlap between P and Q and is calculated using EquationEq. 6
(6)
(6) :
(6)
(6) where ai is a point in Q, and bj is its nearest point in P. EOverlapping amplifies the difference between ai and bj through the distance: When the two points are closer, point ai contributes a higher score to EOverlapping. This process is repeated for each primitive model in the library, resulting in an EOverlapping value for that specific primitive model with respect to the original point cloud. The varying term primarily focuses on the roof parameters that influence the roof structure within the control parameters. These parameters include roof height hr, roof length lr, and roof width wr. The variations in these three parameters directly affect the roof type, leading to changes in the primitive model type. EVarying is calculated using EquationEq. 7
(7)
(7) :
(7)
(7) where α and β are weight coefficients. D(•) denotes the parameter difference calculated using P and Q. A smaller difference between the roof parameters results in a greater contribution to EVarying.
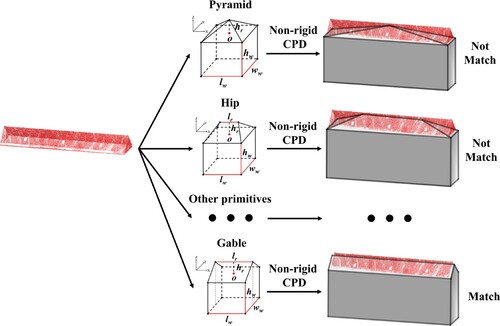
In this algorithm, each primitive model in the library is iterated, and its degree of matching with the original point cloud is computed using the energy function. Finally, the primitive model with the highest matching degree is selected as the suitable primitive model. This procedure is illustrated in .
Figure 6. Procedure of the suitable primitive model selection algorithm.
3.3. Reconstruction optimization
Once multiple primitive models are obtained, it is necessary to eliminate geometric errors and address topological inconsistencies. To quantify the geometric discrepancies between adjacent primitives, an improved Hausdorff distance (Taha and Hanbury Citation2015) is employed according to EquationEq. 8(8)
(8) :
(8)
(8) where A and B represent the point clouds sampled from the surfaces adjacent to the two primitives, hd(A, B) and hd(B, A) denote the one-way Hausdorff distances from A to B and B to A, respectively, and d(,) denotes the Euclidean distance. The distance between the two point clouds is calculated by averaging the point-to-point distances. A smaller value of HD(,) indicates smaller geometric discrepancies between the adjacent primitives.
In the case of compound buildings, the potential geometric errors between primitive models can be categorized into four types: ① rotation angle error of adjacent primitives (a); ② crack error (b); ③ intersection error (c); ④ alignment error of adjacent primitives (d).
Figure 7. All possible geometric errors (a. rotation angle error; b. crack error; c. intersection error; d. alignment error).
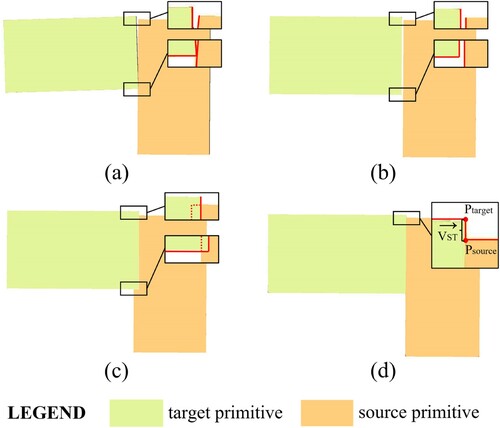
Processing is not only applicable to individual errors but also to complex errors that involve multiple errors within adjacent primitives. The specific steps are as follows:
Step 1: Rotation angle error adjustment. Since adjacent primitives have been approximately assembled, a slight angle adjustment is performed within a specified range (e.g. −5° to +5°) to achieve rotational consistency within the model. The rotation center is set as the center of the source primitive, and the target primitive is incrementally rotated by a small angle (e.g. 0.1°). The position yielding the smallest discrepancies is determined as the final position of the target primitive.
Step 2: Crack or intersection error elimination. The average distance between the adjacent surfaces of the target and source primitives is calculated as the correction width. Using the direction and correction width, a displacement vector is determined and applied to the target primitive to resolve cracks or intersection errors.
Step 3: Alignment error correction. The two nearest corner points from the target and source primitives, namely Ptarget and Psource, respectively, are selected. A horizontal displacement vector
is calculated from Psource to Ptarget, as shown in Eq.9. The target primitive is then adjusted by applying the horizontal displacement vector to align the adjacent primitives.
4. Experiments
4.1. Dataset description
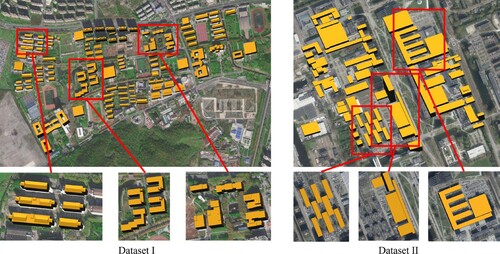
To test the proposed method, two ALS point cloud datasets are selected as experimental datasets. Dataset Ⅰ comprises over 100 individual buildings within the campus of Nanjing University of Information Science & Technology (NUIST). Dataset Ⅱ is AHN3 – an openly available ALS point cloud dataset that covers the entire Netherlands. AHN3 includes numerous buildings with diverse plane structures and is therefore suitable for verifying the performance of modeled buildings with complex horizontal layouts. provides an overview of the raw point clouds in the two datasets and lists a detailed description of the dataset parameters.
Figure 8. Overview of raw point clouds.
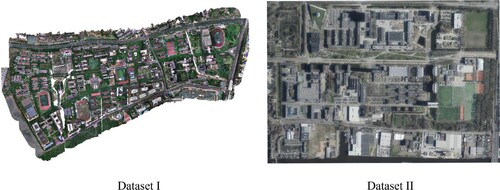
Table 1. Detailed descriptions of dataset parameters.
4.2. Reconstruction result evaluation
4.2.1. Visual results
To visually present the global distribution of the building models and showcase the reconstruction details, the reconstruction results (depicted as orange models) are displayed alongside the background images in Google Earth in . Additionally, three magnified views are included below each main scene to highlight specific details.
Figure 9. Three-dimensional (3D) views of the reconstruction models and their corresponding background images.
shows the reconstruction results and distribution of all buildings in the two datasets. In the magnified views of Dataset Ⅰ, various roof types, including cube, hip, and mansard, have been successfully reconstructed. Additionally, the method demonstrates its ability to produce favorable results for buildings with complex horizontal layouts, such as L-shaped, H-shaped, and even more intricate roof structures, as shown in the magnified views of Dataset Ⅱ.
4.2.2. Procedure results from modeling typical buildings
A selection of typical buildings from the two datasets is presented in to demonstrate the procedure results of the proposed method. These buildings represent various compound building types and exhibit distinct characteristics, rendering them suitable for evaluating the performance of the proposed method. Specifically, the buildings in the second, fourth, and fifth rows demonstrate complex horizontal layouts, including L-shaped, C-shaped, ring-shaped, and other configurations. The buildings in the first and third rows show intricate roof structures, such as stepped roofs and non-standard shapes. Furthermore, the structures in the last two rows are intricate compound buildings characterized by both complex horizontal layouts and roof structures.
Figure 10. Procedure results (a. google earth images; b. building point clouds; c. extraction results of roof patches; d. partitioning results in red box; e. primitive model assembly in green box; f. final models).
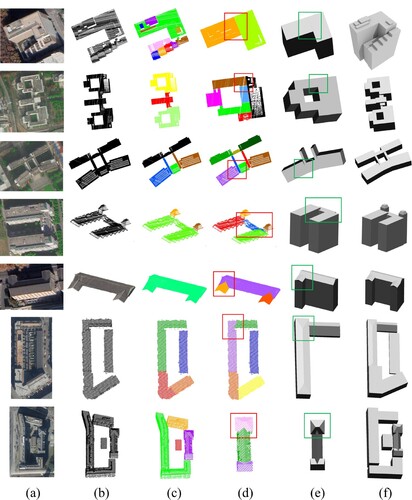
(c) illustrates the successful extraction of multiple roof patches with varying shapes or heights, including large continuous surfaces such as ceilings and intricate structures such as attics (e.g. first row in ). This indicates that the method efficiently preserves not only the primary building structure but also intricate details. Additionally, the method partitions irregular roof patches by considering the roof structures, as shown in the red box in (d). The robustness of the primitive selection algorithm is demonstrated even for roof patches with small areas.
The optimized models exhibit closely joined primitives, and there are no noticeable geometric errors in the final models. This is particularly evident in cases where multiple primitives belong to a single irregular roof patch, as depicted in the green box in (d) and (e). The absence of jagged incisions resulting from geometric errors indicates that the method can withstand the impact of intermediate operations and generate watertight models.
4.2.3. Reconstruction accuracy assessment
A set of representative buildings was selected from the two datasets to highlight the details, as shown in . The first row shows the reconstruction models, the second row shows the corresponding aerial images, and the third row shows the models overlaid with the building point cloud. The accuracy of the reconstruction is demonstrated by combining the point clouds with the reconstruction models. The colors in the visualization are assigned based on the distances between the points and their nearest surfaces in the model. Blue indicates a small modeling error, whereas red indicates a large modeling error.
Figure 11. Set of models for accuracy assessment (a-c. Dataset I; d-f. Dataset II).
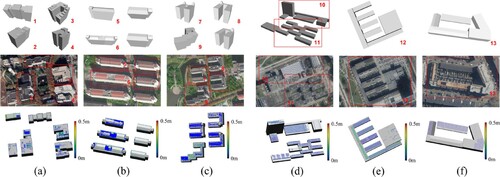
The proposed method successfully reconstructs roof structures with different patterns and eliminates geometric errors between primitives. The final models presented in are generally compact. Importantly, all primitives exhibit large blue areas, indicating a high reconstruction accuracy for multiple primitives. Notably, in the third row, the area occupied by blue is significantly larger than those occupied by the other colors. Besides efficiently reconstructing complex structures and various roof types, the method also captures and displays additional superstructures, which are shown in blue.
The quantitative results of the buildings shown in are provided in . Regression analysis is conducted between the Root Mean Square Error (RMSE) (Huang et al. Citation2022), Maximum Error (ME), and Intersection over Union (IoU) (Zhang et al. Citation2022) and the processing time. The diagrams are shown in .
Figure 12. Distribution of the RMSE, ME and IoU (a. RMSE/ME of buildings in two datasets, b. IoU of buildings in two datasets).
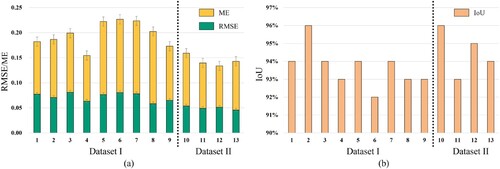
Table 2. Accuracy evaluation of reconstruction models. (Building NO. corresponds to ).
and show that the errors of buildings with hip structures (Buildings 5-6) and mansard roofs (Buildings 7-8) are slightly higher than those of buildings comprising only cube primitives (Buildings 1-2). This is primarily owing to the increased computational complexity involved in the reconstruction of such complex roof structures. Nevertheless, even for buildings with multiple different primitives, the RMSE remains below 0.09 m, and IoU exceeds 92%, as indicated in . This demonstrates that the proposed method maintains a high level of reconstruction accuracy even in the presence of diverse primitive compositions.
Furthermore, for buildings with diverse plane structures (Buildings 10-13), shows that the RMSE and ME values of the reconstruction models are relatively low. This indicates that the method is effective in handling buildings with diverse plane structures while still achieving accurate reconstructions. Nevertheless, buildings with diverse plane structures may result in a more complex footprint, leading to an IoU decrease.
4.3. Performance assessment and hyper-parameter discussion
A compound building point cloud is sampled to generate a set of point clouds with varying densities for performance evaluation. A parameter, namely Subdivision Level (SL), is introduced to represent the degree of subdivision. A higher SL corresponds to reduced point density. The modeling results for different point densities are presented in a, and a summary of the results is provided in .
Figure 13. Performance assessment (a. varying point density data reconstruction; b. Gaussian noise data reconstruction).
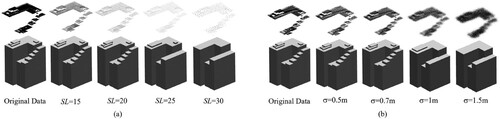
Table 3. Reconstruction performance of data with varying point density.
a demonstrates that when the point span is less than 1 m, even after significant down-sampling, the reconstruction models can retain all essential features of the sparse data samples, such as stepped roofs and attics. However, when the point span exceeds 1 m, a portion of the points exceeds the minimum clustering density set by the DBSCAN algorithm. Consequently, the clustering algorithm may fail to extract the correct roof patches, leading to a loss of certain features in the reconstruction results.
Gaussian noise is introduced into the original point cloud to assess the robustness of the proposed method in relation to noise. In b, the noise level σ represents the point density, with a higher noise level corresponding to sparser points. When σ is below 1 m, the reconstruction models can preserve all the important features, including stepped roofs and superstructures. However, when the noise level σ exceeds 1 m, an excessive number of noise points fill the gaps in the stepped roofs, causing the clustering algorithm to treat them as a single cluster. This can result in loss of detail and reduced accuracy in the reconstruction.
provides an overview of the performance of the proposed method for different noise levels in the input data. Notably, increasing the noise level does not alter the total number of point clouds, but only affects the point span. When the noise level exceeds the minimum distance between two actual surfaces in a building, detecting the appropriate roof planes becomes challenging, leading to incorrect model generation. However, when the noise level σ is below 1 m, the model’s RMSE remains below 0.12 m. This demonstrates the robustness of the reconstruction process regarding handling different noise levels in the point clouds.
Table 4. Reconstruction performance of data with different noise levels.
To evaluate the impact of the partition threshold on the reconstruction, a C-shaped building is selected, and the partition threshold is varied multiple times while keeping the other steps of the reconstruction process unchanged. This allows the generation of a set of reconstruction models for comparison.
This study includes a discussion regarding the selection of the partition threshold in EquationEq. 2(2)
(2) , and a value of γ = 0.3 is chosen. This value is determined through multiple tests on finding the most suitable threshold. As shown in , when the partition threshold is set below 0.3, redundant partitions are generated. As highlighted by the red box, the mansards are not fully integrated within the main C-shaped building. This can be attributed to redundant partitions that cause inaccuracies during determining the dimensions of the main structure. These errors affect the overall reconstruction of the model structure. Conversely, if the partition threshold is set too high, incomplete partitioning occurs. The shows the reconstruction accuracy under different threshold conditions. Therefore, γ = 0.3 is a satisfactory partition threshold that strikes a balance between redundancy and completeness in the partitioning process.
Figure 14. Partition threshold comparison.
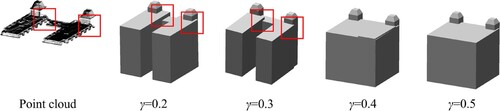
Table 5. Reconstruction performance of data with different partition threshold.
4.4. Comparison experiment
To provide a comprehensive evaluation, the proposed method is compared with several state-of-the-art building reconstruction methods, namely the Polyfit (Nan and Wonka Citation2017), Optimal Model Fitting (OMF) (Zhang, Li, and Shan Citation2021), and RANSAC-MPR (Li et al. Citation2022) methods. This experiment assesses the strengths and weaknesses of the proposed method in relation to those of these existing methods. The reconstruction models generated by each method are visually represented by combining colored points with the corresponding reconstruction models, as depicted in . This visual representation allows a qualitative assessment of the reconstruction accuracy achieved using each method ().
Figure 15. Comparative evaluation of compound building reconstruction results (a. building with stepped roof, b. C-shaped building, c. ring-shaped building).
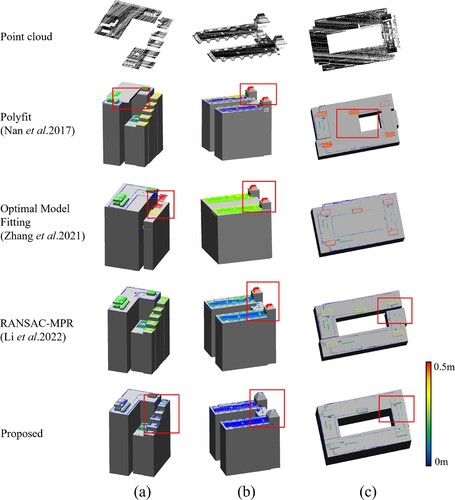
Table 6. Performances of different methods.
The second row in shows that the Polyfit method can generate consistent surfaces on a large scale. However, it does not strictly adhere to geometric relationships, as evidenced by instances in which the ceiling is not parallel to the horizontal plane. further supports this observation, as the Polyfit method exhibits the highest RMSE, indicating relatively large errors in the reconstruction. The OMF method employs deep learning for roof-type recognition; however, it is applicable only to individual buildings. As depicted in the third row of , OMF underperforms in case of compound buildings, such as C-shaped or ring-shaped structures, mistakenly filling empty regions and leading to significant errors in the reconstruction process. The RANSAC-MPR method can handle complex structures, and shows that it achieves the lowest RMSE among the three methods; however, it lacks a reconstruction optimization step. As depicted in the fourth row of , there are noticeable misalignments and cracks in the reconstruction models. Notably, the RANSAC-MPR method employs a primitive model library with only four primitives, resulting in certain deficiencies in the reconstruction accuracy for some buildings. For instance, in b, the mansard roof is incorrectly reconstructed as a cube, and the corresponding point cloud is highlighted in red, indicating a modeling error.
5. Conclusion
This study presents a fully automatic approach for modeling compound 3D buildings using ALS point clouds. The proposed method reconstructs compound building point clouds into multiple primitives through regular structure-aware partitioning and suitable primitive model selection. The final model is obtained through reconstruction optimization. Extensive experiments conducted on various datasets demonstrate that the reconstructed model achieves RMSE below 0.09 m, ME below 0.15 m, and IoU exceeding 92%. This method exhibits strong robustness in relation to both sparse point clouds and noise, ensuring the accurate appearance and reconstruction of both individual and compound buildings. Overall, this method achieves a fast and effective compound building reconstruction using ALS point clouds.
Importantly, the current primitive model library includes only roof primitives, which are sufficient for reconstructing the majority of buildings in urban areas. However, the method cannot effectively handle curved surfaces. In the future, expanding the primitive model library to include other primitives, such as spheres and cylinders, could further enhance its versatility and capabilities.
Disclosure statement
No potential conflict of interest was reported by the author(s).
Data availability statement
The data that support the findings of this study are available from the corresponding author, upon reasonable request.
Additional information
Funding
References
- Anand, B., V. Barsaiyan, M. Senapati, and P. Rajalakshmi. 2019. “Real Time LiDAR Point Cloud Compression and Transmission for Intelligent Transportation System.” IEEE 89th Vehicular Technology Conference (VTC2019-Spring). IEEE, 1–5.
- Awrangjeb, M., S. A. N. Gilani, and F. U. Siddiqui. 2018. “An Effective Data-Driven Method for 3-d Building Roof Reconstruction and Robust Change Detection.” Remote Sensing 10 (10): 1512. https://doi.org/10.3390/rs10101512.
- Bauchet, J. P., and F. Lafarge. 2019. “City Reconstruction from Airborne LiDAR: A Computational Geometry Approach.” ISPRS Annals of the Photogrammetry, Remote Sensing and Spatial Information Sciences IV-4/W8: 19–26. https://doi.org/10.5194/isprs-annals-IV-4-W8-19-2019.
- Bittner, K., M. Körner, F. Fraundorfer, and P. Reinartz. 2019. “Multi-Task cGAN for Simultaneous Spaceborne DSM Refinement and Roof-Type Classification.” Remote Sensing 11 (11): 1262. https://doi.org/10.3390/rs11111262.
- Buyukdemircioglu, M., S. Kocaman, and U. Isikdag. 2018. “Semi-automatic 3D City Model Generation from Large-Format Aerial Images.” ISPRS International Journal of Geo-Information 7 (9): 339. https://doi.org/10.3390/ijgi7090339.
- Chen, H., W. Chen, R. Wu, and Y. Huang. 2021. “Plane Segmentation for a Building Roof Combining Deep Learning and the RANSAC Method from a 3D Point Cloud.” Journal of Electronic Imaging 30 (5): 053022–053022. https://doi.org/10.1117/1.JEI.30.5.053022.
- Chen, Z., X. Xiang, H. Zhou, and T. Hu. 2020. “Data-Driven Reconstruction for Massive Buildings Within Urban Scenarios: A Case Study.” 2020 IEEE 9th Data Driven Control and Learning Systems Conference (DDCLS), IEEE, 982–988.
- Chen, J., Y. Xu, S. Lu, R. Liang, and L. Nan. 2022. “3-D Instance Segmentation of MVS Buildings.” IEEE Transactions on Geoscience and Remote Sensing 60: 1–14. https://doi.org/10.1109/TGRS.2022.3183567.
- Dehbi, Y., A. Henn, G. Gröger, V. Stroh, and L. Plümer. 2021. “Robust and Fast Reconstruction of Complex Roofs with Active Sampling from 3D Point Clouds.” Transactions in GIS 25 (1): 112–133. https://doi.org/10.1111/tgis.12659.
- Dehbi, Y., S. Koppers, and L. Plümer. 2019. “Probability Density Based Classification and Reconstruction of Roof Structures from 3d Point Clouds.” The International Archives of the Photogrammetry, Remote Sensing and Spatial Information Sciences 42: 177–184. https://doi.org/10.5194/isprs-archives-XLII-4-W16-177-2019.
- Dey, E. K., M. Awrangjeb, F. Tarsha Kurdi, and B. Stantic. 2023. “Machine Learning-Based Segmentation of Aerial LiDAR Point Cloud Data on Building Roof.” European Journal of Remote Sensing 56 (1): 2210745. https://doi.org/10.1080/22797254.2023.2210745.
- Gooding, J., R. Crook, and A. S. Tomlin. 2015. “Modelling of Roof Geometries from low-Resolution LiDAR Data for City-Scale Solar Energy Applications Using a Neighbouring Buildings Method.” Applied Energy 148: 93–104. https://doi.org/10.1016/j.apenergy.2015.03.013.
- Guo, B., Y. Ge, X. Xiao, C. Wang, J. Gong, and D. Li. 2024. “Full-automatic High-Precision Scene 3D Reconstruction Method with Water-Area Intelligent Complementation and Mesh Optimization for UAV Images.” International Journal of Digital Earth 17 (1): 2317441. https://doi.org/10.1080/17538947.2024.2317441.
- Guo, H., D. Liang, F. Chen, and Z. Shirazi. 2021. “Innovative Approaches to the Sustainable Development Goals Using Big Earth Data.” Big Earth Data 5 (3): 263–276. https://doi.org/10.1080/20964471.2021.1939989.
- Huang, H., C. Brenner, and M. Sester. 2013. “A Generative Statistical Approach to Automatic 3D Building Roof Reconstruction from Laser Scanning Data.” ISPRS Journal of Photogrammetry and Remote Sensing 79: 29–43. https://doi.org/10.1016/j.isprsjprs.2013.02.004.
- Huang, J., J. Stoter, R. Peters, and L. Nan. 2022. “City3D: Large-Scale Building Reconstruction from Airborne LiDAR Point Clouds.” Remote Sensing 14 (9): 2254. https://doi.org/10.3390/rs14092254.
- Jain, P. K., and S. Susan. 2013. “An Adaptive Single Seed Based Region Growing Algorithm for Color Image Segmentation.” Annual IEEE India Conference (INDICON), IEEE, 1–6.
- Jiang, T., Y. Wang, Z. Zhang, S. Liu, L. Dai, Y. Yang, X. Jin, and W. Zeng. 2023. “Extracting 3-D Structural Lines of Building from ALS Point Clouds Using Graph Neural Network Embedded with Corner Information.” IEEE Transactions on Geoscience and Remote Sensing.
- Kumar, K. M., and A. R. M. Reddy. 2016. “A Fast DBSCAN Clustering Algorithm by Accelerating Neighbor Searching Using Groups Method.” Pattern Recognition 58: 39–48. https://doi.org/10.1016/j.patcog.2016.03.008.
- Kwak, E., and A. Habib. 2014. “Automatic Representation and Reconstruction of DBM from LiDAR Data Using Recursive Minimum Bounding Rectangle.” ISPRS Journal of Photogrammetry and Remote Sensing 93: 171–191. https://doi.org/10.1016/j.isprsjprs.2013.10.003.
- Li, M., F. Rottensteiner, and C. Heipke. 2019. “Modelling of Buildings from Aerial LiDAR Point Clouds Using TINs and Label Maps.” ISPRS Journal of Photogrammetry and Remote Sensing 154: 127–138. https://doi.org/10.1016/j.isprsjprs.2019.06.003.
- Li, Z., and J. Shan. 2022. “RANSAC-based Multi Primitive Building Reconstruction from 3D Point Clouds.” ISPRS Journal of Photogrammetry and Remote Sensing 185: 247–260. https://doi.org/10.1016/j.isprsjprs.2021.12.012.
- Li, L., N. Song, F. Sun, R. Wang, J. Yao, and S. Cao. 2022. “Point2Roof: End-to-End 3D Building Roof Modeling from Airborne LiDAR Point Clouds.” ISPRS Journal of Photogrammetry and Remote Sensing 193: 17–28. https://doi.org/10.1016/j.isprsjprs.2022.08.027.
- Li, L., F. Yang, H. Zhu, D. Li, Y. Li, and L. Tang. 2017. “An Improved RANSAC for 3D Point Cloud Plane Segmentation Based on Normal Distribution Transformation Cells.” Remote Sensing 9 (5): 433. https://doi.org/10.3390/rs9050433.
- Li, Z., W. Zhang, and J. Shan. 2020. “Holistic Parameteric Reconstruction of Building Models from Point Clouds.” arXiv Preprint ArXiv:2005.09226, https://doi.org/10.48550/arXiv.2005.09226.
- Liu, Y. K., H. Y. Liu, Y. Q. Li, S. B. Zhao, and Y. L. Yang. 2021. “Building BIM Modeling Based on Multi-Source Laser Point Cloud Fusion.” Journal of Geographical Information Science 23: 764–773.
- Malihi, S., M. J. Valadan Zoej, M. Hahn, M. Mokhtarzade, and H. Arefi. 2016. “3D Building Reconstruction Using Dense Photogrammetric Point Cloud.” The International Archives of the Photogrammetry, Remote Sensing and Spatial Information Sciences 41: 71–74. https://doi.org/10.5194/isprs-archives-XLI-B3-71-2016.
- Myronenko, A., and X. Song. 2010. “Point set Registration: Coherent Point Drift.” IEEE Transactions on Pattern Analysis and Machine Intelligence 32 (12): 2262–2275. https://doi.org/10.1109/TPAMI.2010.46.
- Nan, L., and P. Wonka. 2017. “Polyfit: Polygonal Surface Reconstruction from Point Clouds.” Proceedings of the IEEE International Conference on Computer Vision, 2353–2361.
- Ochmann, S., R. Vock, and R. Klein. 2019. “Automatic Reconstruction of Fully Volumetric 3D Building Models from Oriented Point Clouds.” ISPRS Journal of Photogrammetry and Remote Sensing 151: 251–262. https://doi.org/10.1016/j.isprsjprs.2019.03.017.
- Pohle-Fröhlich, R., A. Bohm, P. Ueberholz, M. Korb, and S. Goebbels. 2019. “Roof Segmentation based on Deep Neural Networks.” In Proceedings of the 14th International Joint Conference on Computer Vision. Imaging and Computer Graphics Theory and Applications (VISIGRAPP 2019), Vol. 4: VISAPP, edited by A. Tremeau, G. Farinella, and J. Braz, 326–333. Prague, Czech Republic: SciTePress.
- Ponciano, J., M. Roetner, A. Reiterer, and F. Boochs. 2021. “Object Semantic Segmentation in Point Clouds – Comparison of a Deep Learning and a Knowledge-Based Method.” ISPRS International Journal of Geo-Information 10 (4): 256. https://doi.org/10.3390/ijgi10040256.
- Poullis, C. 2013. “A Framework for Automatic Modeling from Point Cloud Data.” IEEE Transactions on Pattern Analysis and Machine Intelligence 35 (11): 2563–2575. https://doi.org/10.1109/TPAMI.2013.64.
- Qin, N., X. Hu, and H. Dai. 2018. “Deep Fusion of Multi-View and Multimodal Representation of ALS Point Cloud for 3D Terrain Scene Recognition.” ISPRS Journal of Photogrammetry and Remote Sensing 143: 205–212. https://doi.org/10.1016/j.isprsjprs.2018.03.011.
- Shao, J., W. Zhang, A. Shen, N. Mellado, S. Cai, L. Luo, N. Wang, G. Yan, and G. Zhou. 2021. “Seed Point Set-Based Building Roof Extraction from Airborne LiDAR Point Clouds Using a top-Down Strategy.” Automation in Construction 126: 103660. https://doi.org/10.1016/j.autcon.2021.103660.
- Taha, A. A., and A. Hanbury. 2015. “An Efficient Algorithm for Calculating the Exact Hausdorff Distance.” IEEE Transactions on Pattern Analysis and Machine Intelligence 37 (11): 2153–2163. https://doi.org/10.1109/TPAMI.2015.2408351.
- Tarsha Kurdi, F., E. Lewandowicz, Z. Gharineiat, and J. Shan. 2023. “Modeling Multi-Rotunda Buildings at LoD3 Level from LiDAR Data.” Remote Sensing 15 (13): 3324. https://doi.org/10.3390/rs15133324.
- Valero, E., F. Bosché, and A. Forster. 2018. “Automatic Segmentation of 3D Point Clouds of Rubble Masonry Walls, and its Application to Building Surveying, Repair and Maintenance.” Automation in Construction 96: 29–39. https://doi.org/10.1016/j.autcon.2018.08.018.
- Vetrivel, A., M. Gerke, N. Kerle, F. Nex, and G. Vosselman. 2018. “Disaster Damage Detection Through Synergistic use of Deep Learning and 3D Point Cloud Features Derived from Very High Resolution Oblique Aerial Images, and Multiple-Kernel-Learning.” ISPRS Journal of Photogrammetry and Remote Sensing 140: 45–59. https://doi.org/10.1016/j.isprsjprs.2017.03.001.
- Vo, A. V., L. Truong-Hong, D. F. Laefer, and M. Bertolotto. 2015. “Octree-based Region Growing for Point Cloud Segmentation.” ISPRS Journal of Photogrammetry and Remote Sensing 104: 88–100. https://doi.org/10.1016/j.isprsjprs.2015.01.011.
- Wang, S., G. Cai, M. Cheng, J. M. Junior, S. Huang, Z. Wang, S. Su, and J. Li. 2020. “Robust 3D Reconstruction of Building Surfaces from Point Clouds Based on Structural and Closed Constraints.” ISPRS Journal of Photogrammetry and Remote Sensing 170: 29–44. https://doi.org/10.1016/j.isprsjprs.2020.09.004.
- Wang, R., J. Peethambaran, and D. Chen. 2018. “Lidar Point Clouds to 3-D Urban Models: A Review.” IEEE Journal of Selected Topics in Applied Earth Observations and Remote Sensing 11 (2): 606–627. https://doi.org/10.1109/JSTARS.2017.2781132.
- Weixiao, G. A. O., L. Nan, B. Boom, and H. Ledoux. 2023. “PSSNet: Planarity-Sensible Semantic Segmentation of Large-Scale Urban Meshes.” ISPRS Journal of Photogrammetry and Remote Sensing 196: 32–44. https://doi.org/10.1016/j.isprsjprs.2022.12.020.
- Wu, B., B. Yu, Q. Wu, S. Yao, F. Zhao, W. Mao, and J. Wu. 2017. “A Graph-Based Approach for 3D Building Model Reconstruction from Airborne LiDAR Point Clouds.” Remote Sensing 9 (1): 92. https://doi.org/10.3390/rs9010092.
- Xiong, B., M. Jancosek, S. O. Elberink, and G. Vosselman. 2015. “Flexible Building Primitives for 3D Building Modeling.” ISPRS Journal of Photogrammetry and Remote Sensing 101: 275–290. https://doi.org/10.1016/j.isprsjprs.2015.01.002.
- Yang, S., M. Hou, and S. Li. 2023. “Three-Dimensional Point Cloud Semantic Segmentation for Cultural Heritage: A Comprehensive Review.” Remote Sensing 15 (3): 548. https://doi.org/10.3390/rs15030548.
- Yu, Y., J. G. Liu, and Y. J. Zhang. 2022. “HexDom: Polycube-Based Hexahedral-Dominant Mesh Generation.” In Mesh Generation and Adaptation. SEMA SIMAI Springer Series, Vol. 30, edited by R. Sevilla, S. Perotto, and K. Morgan, 137–155. Cham: Springer.
- Zhang, H., Z. Duan, N. Zheng, Y. Li, Y. Zeng, and W. Shi. 2022. “An Efficient Class-Constrained DBSCAN Approach for Large-Scale Point Cloud Clustering.” IEEE Journal of Selected Topics in Applied Earth Observations and Remote Sensing 15: 7323–7332. https://doi.org/10.1109/JSTARS.2022.3201991.
- Zhang, C., and H. Fan. 2022. “An Improved Multi-Task Pointwise Network for Segmentation of Building Roofs in Airborne Laser Scanning Point Clouds.” The Photogrammetric Record 37 (179): 260–284. https://doi.org/10.1111/phor.12420.
- Zhang, W., Z. Li, and J. Shan. 2021. “Optimal Model Fitting for Building Reconstruction from Point Clouds.” IEEE Journal of Selected Topics in Applied Earth Observations and Remote Sensing 14: 9636–9650. https://doi.org/10.1109/JSTARS.2021.3110429.
- Zhang, J., X. Zhao, Z. Chen, and Z. Lu. 2019. “A Review of Deep Learning-Based Semantic Segmentation for Point Cloud.” IEEE Access 7: 179118–179133. https://doi.org/10.1109/ACCESS.2019.2958671.
- Zheng, Y., Q. Weng, and Y. Zheng. 2017. “A Hybrid Approach for Three-Dimensional Building Reconstruction in Indianapolis from LiDAR Data.” Remote Sensing 9 (4): 310. https://doi.org/10.3390/rs9040310.