
 ?Mathematical formulae have been encoded as MathML and are displayed in this HTML version using MathJax in order to improve their display. Uncheck the box to turn MathJax off. This feature requires Javascript. Click on a formula to zoom.
ABSTRACT
3D waterlogging visualisation is an immersive method to understand how water accumulates in specific areas. Since urban waterlogging involves complex subsystems above and below the ground, augmented reality (AR) visualisation is especially effective for risk perception. In this paper, a 3D visualisation method for urban road waterlogging based on mobile augmented reality is proposed. The waterlogging situation is simulated by integrating open-source Storm Water Management Model (SWMM) and Weighted Cellular Automata 2D Inundation Model (WCA2D). The 3D pipe network and road inundation volume objects are constructed and organised as the basic geospatial objects for AR visualisation. Then, the simulated flow results are mapped and fused with 3D objects, achieving enhanced waterlogging visualisation based on mobile augmented reality. The method is applied to a case study in Wuhan, China. The results demonstrate that underground pipe drainage and surface runoff processes can be presented intuitively from the perspective of mobile AR. The scene rendering organised by the multilevel index is smooth, with an FPS of more than 30 frames. This research provides methodological and practical references for the general public to increase waterlogging awareness and make emergency decisions.
1. Introduction
In recent years, extreme rainstorm disasters have occurred frequently due to global climate disorders (Tellman et al. Citation2021). With the advancement of urbanisation, changes in land use and land cover (LULC) have greatly changed the surface environment and drainage system of cities, thereby increasing the risk of waterlogging (Shrestha et al. Citation2018). Urban waterlogging is a complex spatiotemporal evolution process involving the mutual influence of various subsystems, such as heavy rain, underground pipe network drainage, and surface runoff. Urban road networks are highly vulnerable to waterlogging disasters because of low terrain and interconnections, which tend to cause traffic congestion and even casualties (Lu et al. Citation2022; Pyatkova et al. Citation2019). Waterlogging simulation, based on hydrological or hydrodynamic models, is an effective way of analysing the occurrence of waterlogging in a specific urban area (Yang et al. Citation2022). Since waterlogging simulations are complicated, visualisation through graphical representations is essential for the general public to better understand the potential impact of waterlogging.
Traditional visualisation methods for waterlogging simulations primarily focus on two-dimensional mapping (Bakhtiari et al. Citation2023; Leedal et al. Citation2010; Wang et al. Citation2018). Since the data in real three-dimensional (3D) space are projected to a two-dimensional (2D) plane, the geospatial position and topological information in the altitude dimension are lost. The terrain distribution and inundated depth cannot be presented completely and objectively, which is vital to understanding the waterlogging process. With the development of computer graphics cards and scientific visualisation software, 3D visualisation has been applied to waterlogging results (Chen et al. Citation2021; Macchione et al. Citation2019; Wang et al. Citation2019; Zhi et al. Citation2020). Virtual reality (VR) creates a virtual 3D environment, enabling users to simulate actions in the real world. VR-based waterlogging visualisation provides more realistic sensing and user-friendly interactions than normal 3D visualisation (Dang et al. Citation2023; Rong et al. Citation2020; Sermet and Demir Citation2022; Zhang, Zhang, et al. Citation2020). Users can experience immersion and realism for dynamic waterlogging details in virtual geographic environments. However, VR-based waterlogging visualisation also has some limitations. Creating a virtual waterlogging scene isolates users from real-world surroundings. It is difficult for people to connect feelings of disaster in virtual reality with real-world waterlogging scenarios for emergency response (Zhang, Gong, et al. Citation2020). Additionally, VR-based waterlogging visualisation involves massive amounts of geographic data and efficient 3D rendering, typically requiring high-performance computer hardware support (Dang et al. Citation2023). As a result, its usage scenarios and multiuser interactions are limited.
Augmented reality (AR) is a new technology that overlays real scenarios with computer-generated objects or information (Van Krevelen and Poelman Citation2010). Compared with the total virtual environments in VR, AR uses a real-world setting, which enhances the perception of the user and interaction with the user's surroundings. Researchers have conducted studies on AR flood visualisation by overlaying virtual flood scenes onto real-world environments (Li et al. Citation2021; Rydvanskiy and Hedley Citation2021). Since mobile devices with 3D graphics capabilities are increasingly ubiquitous, mobile augmented reality offers easy ways for users to interact with the real geospatial world. Mobile augmented reality technology is widely used in applications such as flood visualisation (Haynes, Hehl-Lange, and Lange Citation2018), building damage assessment (Kim, Kerle, and Gerke Citation2016), and fieldwork surveys (Gazcón et al. Citation2018). For urban waterlogging disasters, mobile augmented reality is suitable for enhancing people's sense and interaction with road inundation. However, mobile augmented reality-based waterlogging visualisation still faces some challenges. As waterlogging simulations involve multisource heterogeneous data, especially for underground pipe network and inundated area data, representing these large-scale geospatial objects in the AR scene is a problem (Zhi et al. Citation2019). Moreover, since the waterlogging simulation result is closely related to the pipe drainage and surface runoff processes, coupling the simulation model with the corresponding 3D objects to express the dynamic change process is also challenging.
In this paper, we address these challenges to propose a 3D visualisation method for urban road waterlogging based on mobile augmented reality. Waterlogging simulations, including pipe drainage simulations and surface runoff simulations, are achieved by integrating open-source SWMM and WCA2D models based on geographic information systems (Zeng, Wang, and Lai Citation2022). The overflowed pipe nodes acquired by SWMM are used as the input to WCA2D, and the road inundations are extracted. A 3D pipe network and inundation volume objects are constructed and organised as the basic geospatial objects for AR visualisation. Then, the waterlogging simulation results and 3D objects are mapped and fused dynamically. Augmented reality is based on a mobile camera, positioning, and posture information and is implemented by the spatial overlay of a camera photo and a 3D waterlogging scene. As a result, the pipe drainage and surface runoff processes are visualised by the mobile AR platform.
The remainder of the paper is structured as follows. Section 2 introduces the overall research framework. Section 3 proposes a methodology to couple waterlogging simulations with 3D objects via mobile augmented reality. The application and experimental results are presented in Section 4, and the discussion and future work are presented in Section 5. Finally, Section 6 presents the conclusions of this paper.
2. Overall framework
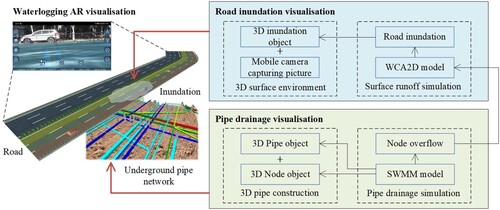
In this study, 3D waterlogging visualisation includes pipe drainage visualisation, road inundation visualisation, and waterlogging AR visualisation. An overview of the framework is shown in . First, 3D pipe network objects, including 3D pipes, joints, and facilities, are built based on vector pipeline and pipe node data. 3D pipe drainage visualisation is achieved by coupling SWMM simulations with 3D pipe network data. By obtaining the overflowed pipe nodes from the SWMM, a surface runoff simulation is conducted based on the WCA2D model. The road inundation area and depth information are extracted for inundation volume construction. Finally, the scenario of combining pipe drainage and road inundation is visualised in augmented reality, which is fused depending on the mobile positioning and camera posture. As a result, mobile augmented reality-based 3D road waterlogging is presented.
Figure 1. Overall research framework.
3. Methodology
3.1. Pipe drainage visualisation
The 3D pipe network objects and drainage simulation are coupled to realize interactive 3D pipe drainage visualisation.
3.1.1. 3d pipe network construction
The underground pipe network is an important city infrastructure, and relevant municipal departments maintain detailed vector pipe network data. A two-dimensional pipe drainage network consists of pipelines and pipe nodes; pipe node data could include joint and facility data. A pipe joint is a connector between two or more pipelines, such as an elbow, tee, or cross. A pipe facility is a device that connects pipelines, such as a well, grate, or valve. As shown in , 3D pipe network objects are constructed based on 2D vector pipe data.
Figure 2. 3D pipe network construction.
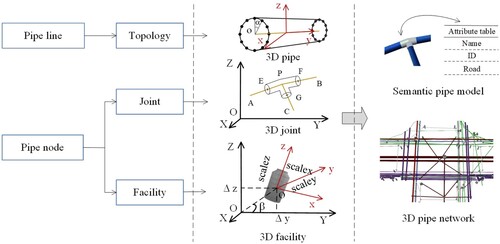
The 3D pipe mesh is built using the topological pipeline and the attribute information in the local 3D Cartesian coordinate system and then transformed into the global spherical coordinate system. The pipe mesh and texture are mapped correspondingly to enhance the realism of the 3D pipe model. A 3D pipe joint object is constructed by connecting multibranch tubes to adjacent pipes (Hu, Guo, and Zhang Citation2020). The 3D facility model is loaded from the standard facility model library and converted to the appropriate pose by scaling, rotating, and translating. Finally, the 3D pipe, joint, and facility objects are organised and associated with the semantic attribute information. To visualise a 3D underground pipe network, the model data are shifted above the terrain, or the terrain imagery is set to be transparent.
3.1.2. Pipe drainage rendering
Storm Water Management Model (SWMM) is a dynamic rainfall-runoff simulation model widely used in urban areas. The SWMM focusses on modelling drainage networks, which can simulate not only single rainfall events but also continuous rainfall-runoff processes (Randall et al. Citation2019). The SWMM is adopted to dynamically acquire the flow depths of the pipe and well object. Pipe drainage visualisation is achieved by coupling 3D pipe network objects and drainage simulations. To dynamically present the pipe drainage situation, texture mapping is applied to the 3D pipe network objects. The flow effects are simulated by dynamically adjusting the flow depth texture and mapping it onto the pipe and well mesh, as shown in .
Figure 3. 3D pipe drainage rendering: (a) pipe flow rendering; (b) well flow rendering.
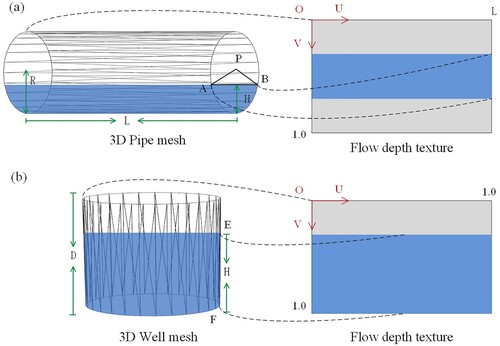
For pipe flow rendering, the texture coordinates of each vertex are computed for texture mapping. The water texture is dynamically generated based on the pipe water level exported by the SWMM simulation, where the parts with flowing water are blue and the rest are grey. The pipe radius is denoted as R, the pipe length is L, and the flow depth is H. The points A and B are on the water surface in the pipe, so the flowing water part of the texture is mapped on pipe arc AB ((a)). The 2D texture coordinate system of the pipe object is built where the origin is on the top point of the pipe mesh, the U axis is along the pipeline, and the V axis is counterclockwise along the pipeline. According to the water level of the pipeline, the computation of the texture coordinates can be divided into two situations as follows:
| (1) | When the flow depth meets the condition | ||||
| (2) | When the flow depth meets the condition | ||||
3.2. Road inundation visualisation
The 3D road inundation visualisation is achieved by integrating the waterlogging simulation and water volume rendering.
3.2.1. Integrating SWMM and WCA2D
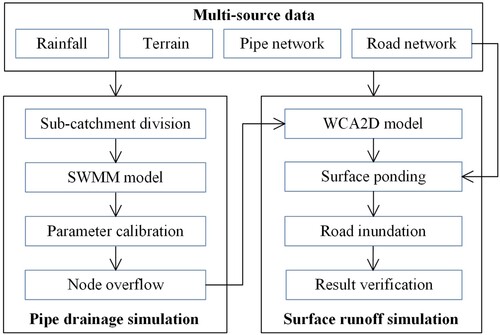
Waterlogging simulation is implemented by coupling pipe drainage and surface runoff models. Weighted Cellular Automata 2D Inundation Model (WCA2D) is an effective urban flood simulation package. However, the WCA2D model lacks modules for runoff generation and pipe network convergence, and thus cannot fully and realistically represent the entire process of actual rainfall, runoff generation and convergence, pipe network overflow, and slope overflow. According to Zeng, Wang, and Lai (Citation2022), the open-source SWMM and WCA2D models are interactively integrated to extract urban inundated areas. The critical point of the integrated simulation is to take the overflowed pipe nodes exported by SWMM as the input of WCA2D for surface runoff modelling.
The specific construction of the SWMM-WCA2D model is shown in . First, the waterlogging simulation involves data from different departments, such as planning, surveying, mapping, hydrology, and meteorology. Multisource data are processed on unified spatial scale, sampling frequency, and coordinate system. Then, the study area is divided into subcatchments based on terrain and land use data, and the SWMM model is constructed. According to the Manning coefficients in the model manual, combined with the relevant parameters obtained by calculating the subcatchment area, SWMM is calibrated. Then, the overflowed pipe nodes are used as the input to the WCA2D model, and the corresponding raster data are exported. The inundated area located on the road surface is extracted by geospatial analysis, including vector transformation and layer overlay. The road inundation area and depth information are obtained according to the integrated simulation. Finally, the road inundation positions, areas and depths are verified with a real waterlogging scene.
Figure 4. SWMM-WCA2D integration.
3.2.2. Road inundation rendering
Based on the SWMM-WCA2D simulation, the average depth of the road inundation area is calculated to then calculate the water volume for 3D visualisation. Assuming that the raster cell collection of the inundated area is list and that the inundated depth of the k-th cell is dk, the average depth of the inundated area can be calculated:
(4)
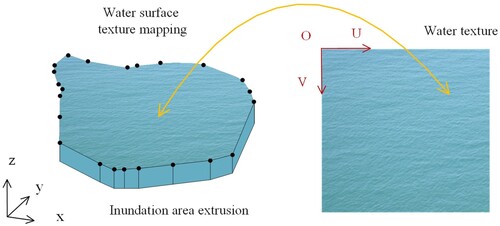
(4) If the vector inundated area is directly loaded in mobile AR, the surface data tend to jitter violently as the mobile phone deflects. To enhance the effect of water objects in the AR, the water surface polygon and the average depth are coupled to construct the 3D water volume, as shown in . A local 3D Cartesian coordinate system is established with the centre point of the inundated area as the origin. All the vertices of the inundation area are converted to local coordinates. Then, the inundated surface is extruded vertically downwards into a 3D water model based on the average depth. The top inundation surface is processed with actual water material to enhance the fluctuation and light effects.
Figure 5. Inundation object rendering.
The inundation surface colour is dynamically calculated by GLSL programming for efficient rendering (Zhang, Liu, et al. Citation2020). The RGB colour of the water surface is calculated via Formula (5). The opacity of the water surface is adjusted by changing the alpha channel value of the colour.
(5)
(5) where Cwater is the final water color, Cpicture, Cambient, Cdiffuse, Cspecular, and Creflect are the corresponding texture color, ambient color, diffuse color, specular color, and reflected color. The parameters a, b, c, and d are the coefficients lying between 0 and 1, which can be interactively adjusted by users for different rendering effects.
3.3. Waterlogging AR visualisation
The pipe drainage and road inundation are visualised based on mobile augmented reality. The 3D objects are organised by the multilevel index and fused with the real-world picture by spatial transformation.
3.3.1. Waterlogging AR scheduling
Due to hardware limitations, loading all the massive 3D data into the phone at once will cause a lag. Due to the large number of 3D objects in pipe networks and inundated volumes, data scheduling is important for efficient waterlogging AR visualisation. Since the pipe network and inundation are mainly distributed along roads, a multilevel data scheduling method considering road distribution is proposed for data organisation ().
Figure 6. Multi-level data scheduling.
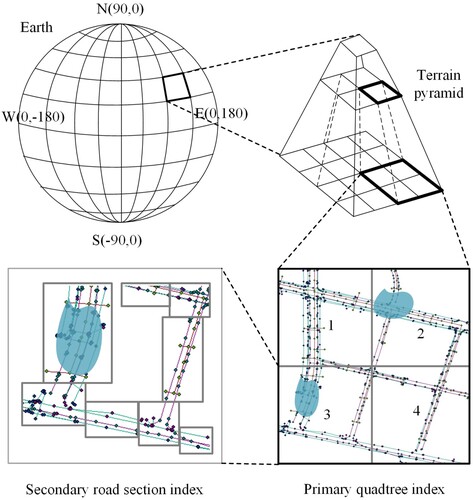
The simulated 3D objects are first organised based on a standard quadtree index by referring to the terrain pyramid structure of the virtual globe (Zhang et al. Citation2019). The primary index determines the tile where the 3D model data are located based on their location and extent. Then, the underground pipe network and inundation objects are associated with specific road sections. When the viewed road section is determined, the simulated model data are loaded according to the secondary index. The 3D pipe network model data are processed using the software MagicPipe3D (http://www.magic3d.net) and organised in 3D Tiles format (Woo, Onsen, and Kim Citation2023). The waterlogging volume data are organised according to the multilevel data index. To quickly find the corresponding overflow pipe network node when road waterlogging occurs, the indices of pipes and inundations are established based on the tile ID and road ID. The indices of the pipe and inundation zone can be expressed as follows:
(6)
(6)
3.3.2. Waterlogging AR fusion
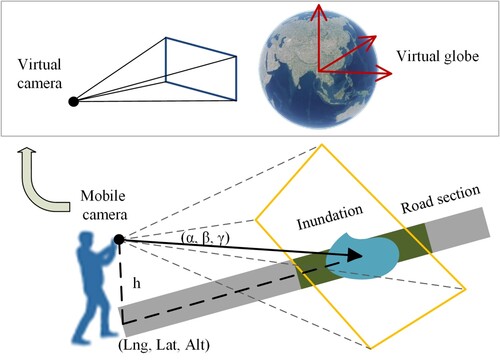
The critical point of waterlogging augmented reality is to accurately fuse the inundation objects with the camera photo. In a standard 3D GIS engine, the virtual globe is controlled by the position and transformation matrix of the virtual camera (Huang, Chen, and Zhou Citation2020). Similarly, the shooting range is controlled by the phone's camera, which determines the rendering results in mobile augmented reality. Therefore, the main objective of mobile augmented reality is to synchronously overlap the position of the mobile camera with that of the virtual camera of the virtual globe. In the AR view, the real-time camera photo of the mobile phone is loaded as the background image of the virtual globe. The virtual globe is set to be fully transparent, allowing the 3D underground pipe network and inundation model to blend with the mobile camera photo. As a result, the waterlogging AR effect is achieved.
As shown in , the location of the virtual camera is determined by the GPS location of the mobile phone. Assuming that the latitude and longitude coordinates of the user are (Lng, Lat), the terrain in the position is Alt, and the user's height is h, the position of the mobile camera is calculated and set as follows:
(7)
(7) The transformation matrix of the virtual camera in 3D GIS is set depending on the position of the mobile camera. Due to the difference in the coordinate system between the positions of the mobile phone and the virtual camera, it is necessary to establish a mapping relationship between them. The transformation matrix includes the rotation transformation, screen transformation, and world transformation. The rotation matrix is associated with the mobile camera position, and the screen transformation is determined by the horizontal or vertical view of the mobile phone. It is assumed that (α, β, γ) are the gyroscope rotation parameters of the mobile phone, and the inundation objects are transformed by the ZXY-ordered rotation matrix. The rotation matrix is calculated as follows:
(8)
(8) Finally, the virtual camera posture of the virtual globe is controlled based on the mobile camera posture and position. The final transformation matrix of the mobile camera is calculated based on the rotation transformation, screen transformation, and world transformation. The overall transformation is calculated as follows:
(9)
(9)
Figure 7. Waterlogging AR fusion.
4. Application and results
4.1. Study area and data
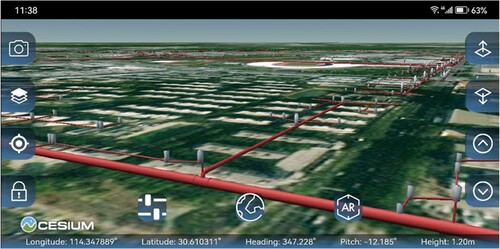
Wuhan is the capital city of Hubei Province, China. Since Wuhan is located in the northern subtropical monsoonal humid climate zone, it is vulnerable to rainstorm waterlogging disasters (Xiao et al. Citation2023). In July 2016, Wuhan experienced a heavy rainstorm, leading to severe waterlogging in more than 200 main traffic arteries (Du, Gong, and Chen Citation2022). A typical district in the Economic and Technological Development Zone of Wuhan, which covers an area of 2.1 km2, is selected as the study area. As shown in , the remote sensing data is from Tianditu, and the DEM data is from Google. In order to simulate more accurate road inundation areas, the resolution of the DEM is 1m*1 m, which is resampled using the bilinear interpolation method. The vector underground pipe network data is from Wuhan Surveying and Mapping Institute. According to the methods in Sections 3.2.1 and 3.4.1, the 3D pipe network data is constructed and organised as 3D Tiles (). The vector road network data is sourced from OpenStreetMap, and it is corrected based on the Baidu Maps road network and verified with the actual roads. The coordinate system of the satellite image, DEM, underground pipe network, and road network data are all processed into WGS 1984.
Figure 8. Study area and data.
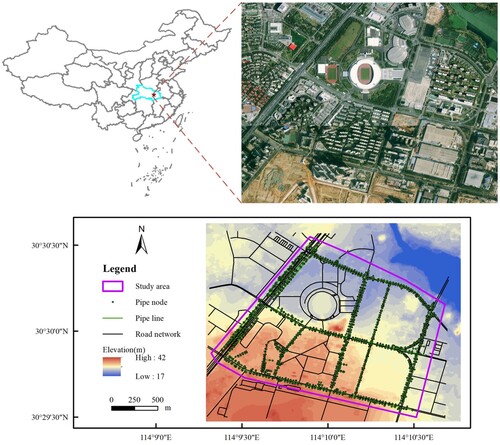
Figure 9. Mobile AR system.
4.2. Rainstorm design
In the rainstorm design, the return period was adopted to describe the rainfall frequency, and the duration was applied to measure the rainfall pattern. According to the rainstorm standard of Wuhan (Wuhan Market Supervision Administration 2021), the return period is designed to be from 2 years to 100 years. The rainstorm scenario with a rainfall return period of 10 years, rainfall duration of 3 h, peak rainfall in the 70th minute, and total rainfall amount of 103.88 mm is used as a typical case in this study. The rainstorm formula for the experimental area is as follows:
(10)
(10) where q is the rainfall intensity (L/(s·hm2)), P is the return period (a), and t is the rainfall duration (min).
4.3. Mobile AR system
The mobile AR system is designed for 3D waterlogging visualisation. It consists of an application server and a mobile client. The application server implements urban waterlogging simulation and exports inundation information. The open-source SWMM and WCA2D models are coupled and interact based on GIS using Python programming. The simulation results are transformed and published as OGC web services, including 3D Tiles, Web Feature Service (WFS), and Web Map Tile Service (WMTS).
The mobile client is developed based on JavaScript programming, and the Cordova (https://github.com/apache/cordova-android) tool is used to package the Android app. The Cesium library (https://github.com/CesiumGS/cesium) is an open-source JavaScript package for world-class 3D globes and maps that is widely used for 3D visualisation. In this study, Cesium is used as the 3D GIS engine for waterlogging visualisation. As shown in , the mobile client contains two view modes: map mode and AR mode. The system UI includes five parts: the left control sidebar, the right adjustment sidebar, the middle view switch toolbar, and the bottom state panel. The system UI is implemented based on Vue (https://vuejs.org). The 3D Tiles (https://github.com/CesiumGS/3d-tiles) format of the pipe network data is loaded and visualised in map mode. In AR mode, the smartphone acquires the GPS location and camera posture for AR visualisation. The waterlogging AR effect is achieved by superimposing virtual 3D pipe drainage and inundation volume objects over the real-time photo canvas.
4.4. Visualisation effects
4.4.1. Waterlogging simulation effects
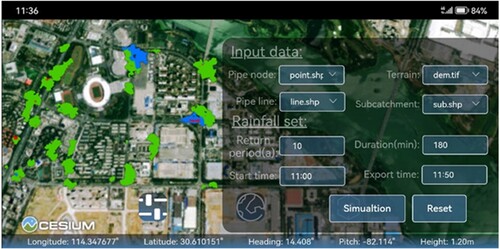
The waterlogging simulation includes pipe drainage and surface runoff and is implemented by integrating the SWMM and WCA2D models. In the SWMM construction, the subcatchment is divided based on the terrain and land use data (), and parameters such as the slope and impermeability of the subcatchment area are calculated. According to the experiential Manning coefficients in the model manual, the impervious Manning coefficient is set to 0.015 s/m-3, the previous Manning coefficient is set to 0.24 s/m-3, the pipe roughness coefficient is set to 0.013, the maximum infiltration rate is set to 50.8 mm/h, the minimum infiltration rate is set to 6.6 mm/h, and the attenuation coefficient is set to 4. The data are converted into a.inp file as the input of the SWMM model. In the surface runoff simulation stage of WCA2D, the terrain data are transformed into a.asc file, and the overflowed pipe nodes exported by SWMM are converted into a.csv file, which are all used as inputs to the WCA2D model. The simulated inundation results are compared and verified with the waterlogging risk map released by the Wuhan Municipal Water Affairs Authority (http://news.cnhubei.com/xw/wuhan/201605/t3619064.shtml). The dynamic waterlogging simulation results are shown in . The urban inundations mainly focussed on the areas around the road surface. As the heavy rain continued, the inundation on the road surface gradually increased ((b)), reaching a severe waterlogging state at 4200 s ((c)). As shown in , users can interactively modify the waterlogging simulation inputs and parameters of the mobile AR system. The simulation result at 3000 s is published as WMTS and visualised in map mode.
Figure 10. Subcatchment division.
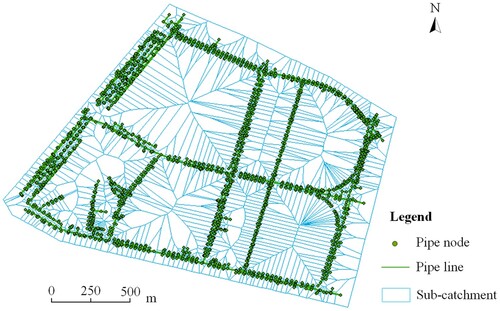
Figure 11. Dynamic waterlogging simulation: (a) simulation result at 1800 s; (b) simulation result at 3000 s; (c) simulation result at 4200 s;
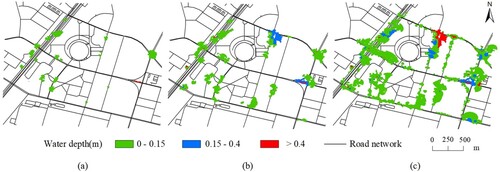
Figure 12. Interactive model interface and waterlogging map visualisation.
4.4.2. AR-based pipe drainage effects
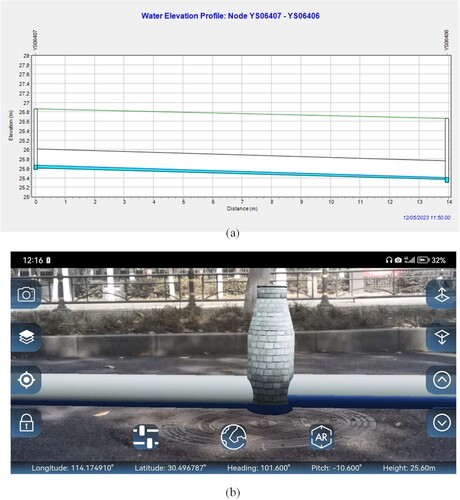
According to the pipe drainage simulation, the modelling result of the SWMM is exported as a.out file. The water level of each pipeline or pipe node can be searched by the specific ID and time. (a) shows the water elevation profile of the pipeline at a SWMM simulation time of 3000 s. The flow depth of the pipeline with ID ‘YS06407-YS06406’ is 0.067894 meters, and the flow depth of the pipe node with ID ‘YS06407’ is 0.163616 meters. In AR mode, the GPS positioning and camera posture of the mobile phone are acquired in real time. The 3D pipe node with ID ‘YS06407’ and the connected pipelines are mapped with the corresponding flow depth textures and finally overlayed with the actual camera scene for AR visualisation ((b)). Due to the jitter caused by the mobile positioning and gyroscope accuracy, the AR effects can be adjusted through the posture lock on the left sidebar and the offset adjustment tool on the right sidebar. The drainage situation of the pipe network is visualised intuitively and interactively based on mobile augmented reality.
Figure 13. Pipe network drainage visualisation: (a) pipe water elevation profile by SWMM; (b) AR-based pipe flow visualisation.
4.4.3. AR-based road inundation effects
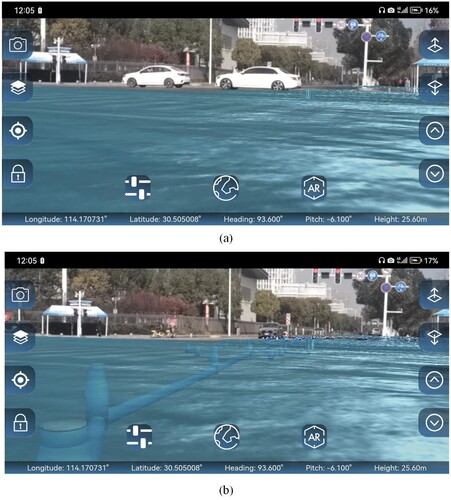
According to the SWMM-WCA2D simulation, the inundated area is exported as a.asc file. The vector border and average depth of the inundations are extracted from the raster data, and the inundated volume is constructed based on the extrusion algorithm. The top surface of the inundation volume is mapped with dynamic water texture, and the opacity of the water surface is set to 0.7. The road inundation AR visualisation of the simulation at 3000 s is shown in (a). The inundated volume is synchronously overlayed with the actual street picture, which can enhance users’ sense of and interaction with the road waterlogging situation. The whole urban waterlogging process is presented through mobile augmented reality by combining 3D pipe network drainage with surface inundation ((b)). The overflowed rainwater grates and wells related to road inundation are visualised, which is helpful in identifying risk sources. Mobile AR-based visualisation enhances users’ perceptions of and interactions with waterlogging and its surroundings. This study is helpful for raising waterlogging awareness among the general public.
Figure 14. Inundation AR visualisation: (a) road water level; (b) integration of the pipe drainage and road inundation.
4.5. Rendering efficiency
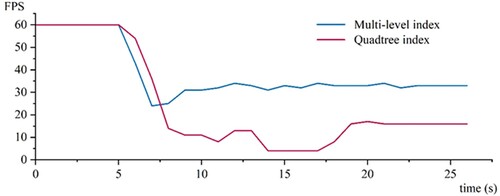
The variable frame per second (FPS) is adopted to evaluate the rendering efficiency of the waterlogging AR visualisation. The experiment is conducted on the Honor 30 smartphone. The CPU is an Octa-core (1 × 2.58 GHz Cortex-A76 + 3 × 2.40 GHz Cortex-A76 + 4 × 1.84 GHz Cortex-A55), the GPU is a Mali-G77, and the RAM is 8 GB. Mobile phone shooting is based on a horizontal screen. The experiment is conducted for AR rendering comparisons using different 3D data indices. The rendering efficiency curves of the standard quadtree index and the multilevel index are shown in . Due to the large amount of data in the 3D pipe network and inundation objects, the FPS decreases quickly according to the quadtree index. Mobile AR rendering has an obvious lag when loading 3D data and thus tends to be unsmooth. The minimum FPS is 4, and the stabilised FPS is approximately 16. In comparison, the mobile AR waterlogging visualisation created by the multilevel index proposed in this paper is more stable. The minimum FPS is 24, and the maintained FPS is approximately 33. The entire process of loading and rendering 3D model data in the AR system did not show any obvious lag. As a result, the 3D data organised by the multilevel index are more efficient and stable for waterlogging AR visualisation.
Figure 15. Rendering efficiency comparison.
5. Discussion and future work
Urban waterlogging disasters have occurred frequently in recent years, often causing serious casualties and huge economic losses. Waterlogging visualisation is an effective and intuitive tool for representing urban inundation information based on multisource spatiotemporal data. Traditional waterlogging visualisation methods involving common 3D representations or virtual reality can express spatial information at high altitudes and enhance user immersion (Dang et al. Citation2023; Zhi et al. Citation2019). However, these representations isolate users from the real-world environment, which is not conducive to connecting risk perception with real-world waterlogging scenarios. In comparison, mobile augmented reality-based waterlogging visualisation can interact with inundation formation on real-world streets. By overlaying virtual objects onto real-world pictures, mobile augmented reality is a good way for the general public to understand the waterlogging process better. Through augmented reality visualisation on mobile phones, users can more easily feel the scope, depth, location and other information of waterlogging on roads, thereby enhancing public safety awareness. In this study, 3D waterlogging visualisation is created by coupling SWMM-WCA2D simulations and 3D model objects; then, the results are finally fused with real-world scenes via mobile augmented reality.
However, the method proposed in this paper still has some limitations. First, the stability and effectiveness of mobile augmented reality need to be further improved. Due to the limited accuracy of mobile phone positioning and gyroscopes, AR images are prone to spatial jitter (Lo, Regenbrecht, and Zollmann Citation2023). Although fine-tuning positioning and locking posture through human‒mobile interactions can improve the jitter problem, real-time high-precision positioning and geospatial computing algorithms must be further studied to achieve better results. Moreover, the AR implementation in this article uses camera transformations to superimpose 3D objects, which lacks geospatial tracking and extraction of photo content. AR visualisation effects are expected to be further enhanced by combining camera controls and photo extraction (Liu, Li, and Gruteser Citation2019). Second, dynamic AR visualisation should be strengthened. The current pipe drainage representation by texture mapping of 3D objects is updated based on a specific time interval, and the inundation volume must be rebuilt based on the updated simulation results. These methods can easily cause the system to be unsmooth and inefficient. Further research on incremental updating methods for 3D waterlogging objects is needed, and the rendering efficiency of mobile augmented reality should be further improved. Third, the usability of the mobile AR system needs to be further tested. Since subjective feelings after using the system cannot be quantitatively evaluated from parameters, the Post-Study System Usability Questionnaire (PSSUQ) will be used to evaluate the users experiences (Sauro and Lewis Citation2016). The questionnaire for the general public should include system effectiveness, visualisation effect, and interactive operability questions, and each question will be evaluated by a different score.
6. Conclusions
In this paper, we propose a 3D visualisation method for urban road waterlogging based on mobile augmented reality. The waterlogging simulation is constructed by integrating open-source SWMM and WCA2D models, and the exported flow conditions are coupled with the 3D pipe network and inundation objects. The 3D objects are organised by a multilevel index, and the pipe drainage and road inundation scenarios are fused and rendered via mobile augmented reality. A case study in Wuhan, China, was conducted to demonstrate the effectiveness of the visualisation method. The experimental results show that the method can achieve a good augmented visualisation of the urban waterlogging process, and the rendering is smooth at FPS greater than 30 frames. The proposed method is expected to provide methodological and practical references for the general public to increase waterlogging awareness and make emergency decisions.
Mobile AR waterlogging visualisation provides a more intuitive and realistic experience than traditional 3D and VR waterlogging visualisation. Due to the disadvantages of image jitter and discontinuous animation, future studies will be conducted to improve the effect and efficiency of waterlogging AR visualisations. Moreover, mobile AR visualisation can be applied to other disaster geovisualisation cases, such as mudslides, earthquakes, and explosions. Mobile AR visualisation for these disasters will be further studied.
Acknowledgements
The authors would like to thank the anonymous peer reviewers for their helpful and constructive reviews of the manuscript.
Disclosure statement
No potential conflict of interest was reported by the author(s).
Data availability statement
The data except the underground pipeline network that support the findings of this study are available from the corresponding author upon reasonable request.
Additional information
Funding
References
- Bakhtiari, Vahid, Farzad Piadeh, Kourosh Behzadian, and Zoran Kapelan. 2023. “A Critical Review for the Application of Cutting-Edge Digital Visualisation Technologies for Effective Urban Flood Risk Management.” Sustainable Cities and Society 104958. https://doi.org/10.1016/j.scs.2023.104958.
- Chen, Zipeng, Kun Li, Jianhua Du, Yi Chen, Ronggang Liu, and Yi Wang. 2021. “Three-Dimensional Simulation of Regional Urban Waterlogging Based on High-Precision DEM Model.” Natural Hazards 108 (3): 2653–2677. https://doi.org/10.1007/s11069-021-04793-8.
- Dang, Pei, Jun Zhu, Yuxuan Zhou, Yuting Rao, Jigang You, Jianlin Wu, Mengting Zhang, and Weilian Li. 2023. “A 3D-Panoramic Fusion Flood Enhanced Visualization Method for VR.” Environmental Modelling & Software 169:105810. https://doi.org/10.1016/j.envsoft.2023.105810.
- Du, Wenying, Yue Gong, and NengCheng Chen. 2022. “PSO-WELLSVM: An Integrated Method and its Application in Urban Waterlogging Susceptibility Assessment in the Central Wuhan, China.” Computers & Geosciences 161:105079. https://doi.org/10.1016/j.cageo.2022.105079.
- Gazcón, Nicolás F, Juan M Trippel Nagel, Ernesto A Bjerg, and Silvia M Castro. 2018. “Fieldwork in Geosciences Assisted by ARGeo: A Mobile Augmented Reality System.” Computers & Geosciences 121:30–38. https://doi.org/10.1016/j.cageo.2018.09.004.
- Haynes, Paul, Sigrid Hehl-Lange, and Eckart Lange. 2018. “Mobile Augmented Reality for Flood Visualisation.” Environmental Modelling & Software 109:380–389. https://doi.org/10.1016/j.envsoft.2018.05.012.
- Hu, Zihe, Jing Guo, and Xuequan Zhang. 2020. “Three-dimensional (3D) Parametric Modeling and Organization for web-Based Visualization of City-Scale Pipe Network.” ISPRS International Journal of Geo-Information 9 (11): 623. https://doi.org/10.3390/ijgi9110623.
- Huang, Wumeng, Jing Chen, and Mengyun Zhou. 2020. “A Binocular Parallel Rendering Method for VR Globes.” International Journal of Digital Earth 13 (9): 998–1016. https://doi.org/10.1080/17538947.2019.1620883.
- Kim, W., N. Kerle, and M. Gerke. 2016. “Mobile Augmented Reality in Support of Building Damage and Safety Assessment.” Natural Hazards and Earth System Sciences 16 (1): 287–298. https://doi.org/10.5194/nhess-16-287-2016.
- Leedal, David, Jeff Neal, K. Beven, Peter Young, and P. Bates. 2010. “Visualization Approaches for Communicating Real-Time Flood Forecasting Level and Inundation Information.” Journal of Flood Risk Management 3 (2): 140–150. https://doi.org/10.1111/j.1753-318X.2010.01063.x.
- Li, Weilian, Jun Zhu, Lin Fu, Qing Zhu, Yakun Xie, and Ya Hu. 2021. “An Augmented Representation Method of Debris Flow Scenes to Improve Public Perception.” International Journal of Geographical Information Science 35 (8): 1521–1544. https://doi.org/10.1080/13658816.2020.1833016.
- Liu, Luyang, Hongyu Li, and Marco Gruteser. 2019. “Edge Assisted Real-time Object Detection for Mobile Augmented Reality.” In Paper Presented at the The 25th Annual International Conference on Mobile Computing and Networking. https://doi.org/10.1145/3300061.3300116.
- Lo, Wei Hong, Holger Regenbrecht, and Stefanie Zollmann. 2023. “Sports Visualization in the Wild: The Impact of Technical Factors on User Experience in Augmented Reality Sports Spectating.” IEEE Computer Graphics and Applications. https://doi.org/10.1109/MCG.2023.3308958.
- Lu, Xiaohui, Faith Ka Shun Chan, Wei-Qiang Chen, Hing Kai Chan, and Xinbing Gu. 2022. “An Overview of Flood-Induced Transport Disruptions on Urban Streets and Roads in Chinese Megacities: Lessons and Future Agendas.” Journal of Environmental Management 321:115991. https://doi.org/10.1016/j.jenvman.2022.115991.
- Macchione, Francesco, Pierfranco Costabile, Carmelina Costanzo, and Rosa De Santis. 2019. “Moving to 3-D Flood Hazard Maps for Enhancing Risk Communication.” Environmental Modelling & Software 111:510–522. https://doi.org/10.1016/j.envsoft.2018.11.005.
- Pyatkova, Katya, Albert S. Chen, David Butler, Zoran Vojinović, and Slobodan Djordjević. 2019. “Assessing the Knock-on Effects of Flooding on Road Transportation.” Journal of Environmental Management 244:48–60. https://doi.org/10.1016/j.jenvman.2019.05.013.
- Randall, Mark, Fubao Sun, Yongyong Zhang, and Marina Bergen Jensen. 2019. “Evaluating Sponge City Volume Capture Ratio at the Catchment Scale Using SWMM.” Journal of Environmental Management 246:745–757. https://doi.org/10.1016/j.jenvman.2019.05.134.
- Rong, Youtong, Ting Zhang, Yanchen Zheng, Chunqi Hu, Ling Peng, and Ping Feng. 2020. “Three-Dimensional Urban Flood Inundation Simulation Based on Digital Aerial Photogrammetry.” Journal of Hydrology 584:124308. https://doi.org/10.1016/j.jhydrol.2019.124308.
- Rydvanskiy, Ruslan, and Nick Hedley. 2021. “Mixed Reality Flood Visualizations: Reflections on Development and Usability of Current Systems.” ISPRS International Journal of Geo-Information 10 (2): 82. https://doi.org/10.3390/ijgi10020082.
- Sauro, Jeff, and James R. Lewis. 2016. Quantifying the User Experience: Practical Statistics for User Research. Cambridge: Morgan Kaufmann.
- Sermet, Yusuf, and Ibrahim Demir. 2022. “GeospatialVR: A web-Based Virtual Reality Framework for Collaborative Environmental Simulations.” Computers & Geosciences 159:105010. https://doi.org/10.1016/j.cageo.2021.105010.
- Shrestha, Sangam, Binod Bhatta, Manish Shrestha, and Pallav K Shrestha. 2018. “Integrated Assessment of the Climate and Landuse Change Impact on Hydrology and Water Quality in the Songkhram River Basin, Thailand.” Science of the Total Environment 643:1610–1622. https://doi.org/10.1016/j.scitotenv.2018.06.306.
- Tellman, Beth, Jonathan A Sullivan, Catherine Kuhn, Albert J Kettner, Colin S Doyle, G. Robert Brakenridge, Tyler A Erickson, and Daniel A Slayback. 2021. “Satellite Imaging Reveals Increased Proportion of Population Exposed to Floods.” Nature 596 (7870): 80–86. https://doi.org/10.1038/s41586-021-03695-w.
- Van Krevelen, DWF, and Ronald Poelman. 2010. “A Survey of Augmented Reality Technologies, Applications and Limitations.” International Journal of Virtual Reality 9 (2): 1–20. https://doi.org/10.20870/IJVR.2010.9.2.2767.
- Wang, Yuntao, Albert S. Chen, Guangtao Fu, Slobodan Djordjević, Chi Zhang, and Dragan A. Savić. 2018. “An Integrated Framework for High-Resolution Urban Flood Modelling Considering Multiple Information Sources and Urban Features.” Environmental Modelling & Software 107:85–95. https://doi.org/10.1016/j.envsoft.2018.06.010.
- Wang, Chen, Jingming Hou, David Miller, Iain Brown, and Yang Jiang. 2019. “Flood Risk Management in Sponge Cities: The Role of Integrated Simulation and 3D Visualization.” International Journal of Disaster Risk Reduction 39:101139. https://doi.org/10.1016/j.ijdrr.2019.101139.
- Woo, Kyongil, Adrian Onsen, and WonSok Kim. 2023. “Implementation of a 3D WebGIS for Dynamic Geo-Referencing of 3D Tiles on the Virtual Globe.” Journal of Geographic Information System 15 (05): 440–457. https://doi.org/10.4236/jgis.2023.155022.
- Xiao, Shuai, Lei Zou, Jun Xia, Yi Dong, Zhizhou Yang, and Tianci Yao. 2023. “Assessment of the Urban Waterlogging Resilience and Identification of its Driving Factors: A Case Study of Wuhan City, China.” Science of the Total Environment 866:161321. https://doi.org/10.1016/j.scitotenv.2022.161321.
- Yang, Kexin, Hao Hou, Yao Li, Yan Chen, Luoyang Wang, Pin Wang, and Tangao Hu. 2022. “Future Urban Waterlogging Simulation Based on LULC Forecast Model: A Case Study in Haining City, China.” Sustainable Cities and Society 87:104167. https://doi.org/10.1016/j.scs.2022.104167.
- Zeng, Zhaoyang, Zhaoli Wang, and Chengguang Lai. 2022. “Simulation Performance Evaluation and Uncertainty Analysis on a Coupled Inundation Model Combining SWMM and WCA2D.” International Journal of Disaster Risk Science 13 (3): 448–464. https://doi.org/10.1007/s13753-022-00416-3.
- Zhang, Guoyong, Jianhua Gong, Yi Li, Jun Sun, Bingli Xu, Dong Zhang, Jieping Zhou, Ling Guo, Shen Shen, and Bingxiao Yin. 2020. “An Efficient Flood Dynamic Visualization Approach Based on 3D Printing and Augmented Reality.” International Journal of Digital Earth 13 (11): 1302–1320. https://doi.org/10.1080/17538947.2019.1711210.
- Zhang, Xuequan, Jin Liu, Zihe Hu, and Ming Zhong. 2020. “Flow Modeling and Rendering to Support 3D River Shipping Based on Cross-Sectional Observation Data.” ISPRS International Journal of Geo-Information 9 (3): 156. https://doi.org/10.3390/ijgi9030156.
- Zhang, Xuequan, Peng Yue, Yumin Chen, and Lei Hu. 2019. “An Efficient Dynamic Volume Rendering for Large-Scale Meteorological Data in a Virtual Globe.” Computers & Geosciences 126:1–8. https://doi.org/10.1016/j.cageo.2019.01.018.
- Zhang, Xuequan, Mingda Zhang, Liangcun Jiang, and Peng Yue. 2020. “An Interactive 4D Spatio-Temporal Visualization System for Hydrometeorological Data in Natural Disasters.” International Journal of Digital Earth 13 (11): 1258–1278. https://doi.org/10.1080/17538947.2019.1701110.
- Zhi, Guozheng, Zhenliang Liao, Wenchong Tian, Xin Wang, and Juxiang Chen. 2019. “A 3D Dynamic Visualization Method Coupled with an Urban Drainage Model.” Journal of Hydrology 577:123988. https://doi.org/10.1016/j.jhydrol.2019.123988.
- Zhi, Guozheng, Zhenliang Liao, Wenchong Tian, and Jiang Wu. 2020. “Urban Flood Risk Assessment and Analysis with a 3D Visualization Method Coupling the PP-PSO Algorithm and Building Data.” Journal of Environmental Management 268:110521. https://doi.org/10.1016/j.jenvman.2020.110521.