
 ?Mathematical formulae have been encoded as MathML and are displayed in this HTML version using MathJax in order to improve their display. Uncheck the box to turn MathJax off. This feature requires Javascript. Click on a formula to zoom.
ABSTRACT
This study constructs a directed weighted network among traditional village buildings based on directional similarity and utilizes social network analysis to identify influential buildings affecting spatial order. Key findings include: 1) Centrality Measures; Weighted degree, eigenvector, and betweenness centrality quantify the influence of building nodes in terms of quantity, quality, and importance, respectively. 2) Influential Buildings; High centrality buildings are not necessarily ‘star buildings’. Their impact is implicit and local, contrasting with the explicit and holistic influence of ‘star buildings’. 3) Community Structure; The village forms seven sub-communities with a modularity of 0.681, reflecting ideal community division. Community consistency is influenced by factors like size, the presence of ancient buildings, and morphology. 4) Spatial Order; Centrality distribution among nodes varies between communities. Communities rich in ancient buildings show a complex, organic order, suggesting self-organization, while those with modern buildings exhibit a more rigid layout, indicating imposed order. This research offers methodological insights for traditional village spatial morphology and provides guidance for conservation and planning.
1. Introduction
Traditional villages represent the world's largest cultural heritage and are a crucial focus of the United Nations Sustainable Development Goals (SDGs) 11.4 on community heritage (United Nations Citation2015), holding significant research value. These villages possess dual characteristics of both tangible and intangible culture (Lu and Ahmad Citation2023). Precisely because of their unique attributes, the spatial practices in traditional villages are more sensitive to external interventions. Despite numerous conservation and restoration efforts to respect the original spatial form of the villages, there remains substantial disruption of the native spatial form through various spatial practices, leading to the alienation of the overall architectural layout.
From this perspective, the crux of the issues in traditional village spatial practices may not lie in cultural value orientation, but rather in the depth and precision of the exploration of morphological patterns in the theory and methods of village spatial morphology, as well as the effectiveness of guidance for spatial practices (Yang Citation2020). This study aims to delve deeper into underlying principles behind the ‘why’ of village spatial morphology, to elucidate ‘unwritten rules’ governing village architectural layouts and to identify the key nodes that shape the spatial form of the village. This can guide the protective planning practices of traditional village spatial morphology today, allowing the planned form to seamlessly integrate with the village's organic growth. It poses a significant challenge, akin to a ‘Sword of Damocles,’ hanging over contemporary practices in traditional villages and rural spaces at large.
The study of rural settlement spatial form began in Western developed countries, influenced by historical factors. Western geographers, represented by Johann Georg Kohi and A. Meitzen, initiated systematic research on settlement morphology from the 1840s. By the twentieth century, French geographers such as Vidal de la Blache and his student Jean Brunhes proposed the theory of human-environment relationships and conducted comprehensive analyses of the relationship between rural settlements and the natural environment (Wang and Liu Citation2020). Following this, the German geographer W. Christaller established Central Place Theory, which advanced the theoretical research on rural settlement spatial systems (Whatmore Citation1993). Demangeon further deepened the research achievements on rural settlement spatial morphology (Cloke Citation1999). These studies have important paradigmatic significance for later research on rural settlement spatial form. Entering the 1960s, influenced by the quantitative revolution in the field of geography, research on village form began to extensively apply quantitative research methods, leading to numerous studies on rural settlement types and forms (Mandal Citation1979; Owen Citation1996; Tunçdilek Citation1974). The ‘cultural turn’ in geography in the 1990s drove a social inclination in the study of rural settlement spatial morphology, with some scholars emphasizing the need to focus on the role of social relationships and human decision-making in shaping village spatial forms (Singh and Khan Citation1999; Sinha Citation1990; McGrath Citation1998). From the unique perspective of architecture, research has delved into how rural settlement spatial form responds to climate and the historical evolution of rural settlement forms and their environmental adaptation (Bodach, Lang, and Hamhaber Citation2014; Gou et al. Citation2015; Sun Citation2013). In contrast to the diminishing importance of rural settlement spatial form issues in developed countries, China's unique dual urban‒rural system has led to a growing prominence of rural problems. The study of village forms has gradually entered the research focus of both the architectural and geographical disciplines in China (Che, Wen, and Wang Citation2009), with numerous scholars conducting extensive work on village spatial form types, influencing factors, and evolution mechanisms (Jin Citation1988; Li and Chen Citation1994; Liu Citation1997; Peng Citation1992; Che and Bao Citation2006; Ma Citation2006). International research tends to focus more on the transformation of village spaces (Bański and Wesołowska Citation2010; Paquette and Domon Citation2003). In general, research on rural settlement spatial forms has shifted its perspective from natural elements to economic and social factors and its paradigm from material space analysis to social and humanistic aspects, while the methods, data analysis tools, and visualization techniques applied are relatively limited compared to research on urban spatial morphology.
Furthermore, advancements in computer technology and the integration of spatial analysis techniques have not only introduced new visualization methods but also incorporated numerous quantitative research methods from urban morphology into the study of rural settlement spatial forms. Techniques such as Geodetector (Wang et al. Citation2021; Yang et al. Citation2021), statistical analysis, and other related methods are widely applied for factor detection and morphology type classification (Ye and Li Citation2018). Theoretical and methodological approaches to the study of traditional village spatial forms have become more diverse. Various research methods, such as spatial syntax (Chen et al. Citation2018; Tao, Chen, and Lin Citation2013), GIS technologies and methods (Duan et al. Citation2022; Sevenant and Antrop Citation2007), morphology index (Zhu and Liu Citation2023), fractal dimensions (Gong et al. Citation2023; Yang, Song, and Pu Citation2020; Zhang et al. Citation2023), gravity models (Wang et al. Citation2023), genomics graphs (Hu et al. Citation2020; Liu, Zeng, and Liu Citation2023; Yin et al. Citation2023), and graph theory with topological analysis (Figlus and Musiak Citation2020; Peng, Qiu, and Wang Citation2023), have been widely applied. Furthermore, research into ‘cultural spaces’ and ‘public spaces’ has expanded the value and significance of traditional village spatial forms (Chen, Xie, and Li Citation2020; Yang et al. Citation2023; Yu et al. Citation2020). These studies, whether from a methodological or theoretical perspective, have extended our understanding of traditional village spatial forms. It is evident that research on the spatial form of traditional villages is continuously expanding and deepening, both in terms of methodological theories and conceptual understanding. However, current studies on the patterns of spatial form are mostly macroscopic, and many research efforts, based on a priori cognition, have utilized various quantitative methods to interpret the empirical summaries of village spatial form by predecessors. There is less involvement in how microscopic architectural entities evolve into the macroscopic form of the village.
The spatial form of traditional villages and the inherent logic of their rules are expressed and manifested through the layout and arrangement of village buildings. The layout and arrangement of buildings convey different rules of form construction, and this combination of rules forms a specific spatial organizational structure. This structure conveys the spatial order of the village. Particularly in traditional villages where construction technology is limited, the building process and evolution are bottom-up. Ancient people often determined the spatial layout of new buildings based on existing structures, and individual buildings aggregated according to certain specific rules to form a mature spatial form. Therefore, understanding this spatial organizational relationship, or spatial order, from the perspective of the relationships between buildings is especially necessary. In terms of understanding village spatial order from the perspective of village buildings, scholars have suggested analyzing the quantitative relationships between three basic indicators: direction, distance, and area between buildings (Wang Citation2009; Pu Citation2012). Furthermore, Deng et al. (Citation2021) utilized building directional rank as a representation of housing direction and explored the deeper logic behind traditional village spatial forms by using concepts from social network analysis. Reflecting on the past to understand the present, it is evident that analyzing the spatial order of traditional villages based on the directional and other order elements between buildings is a viable approach to revealing the logic of traditional village order. The network analysis method, which considers individual buildings as nodes and the relationships between buildings as edges, seems to be an optimal solution that can integrate and quantitatively express the relationships between buildings.
However, existing research on the relationships between buildings still primarily focuses on deducing the logical form from the quantitative relationships between building nodes, without fully considering how building nodes contribute their strength in terms of status and manner. Considering that traditional village buildings are the product of human activities and inherently possess social attributes, the centrality analysis of network nodes in social network analysis can dissect the role and importance of building nodes within the entire network, making it highly adaptable to this study. On the other hand, merely considering whether there is a relationship between buildings is insufficient to accurately quantify the strength of this relationship; therefore, a reasonable weighting method is key to accurately analyzing the relationships between buildings. Based on these considerations, this paper selects the directional relationship between houses and takes into account distance and building age, creatively constructing a directed weighted network. Using social network analysis methods, the centrality of building nodes is analyzed, revealing the advantage differences in the contribution of buildings to the village's spatial form. Furthermore, a community analysis is conducted on the building nodes to uncover the intrinsic factors affecting the morphological expressions within different communities. Through this research, we can gain insight into the formation and evolution mechanisms of traditional village spatial order. Additionally, this study expands the research methods of traditional village spatial forms, provides a unique perspective for the study of traditional village spatial order, offers a new case for the application of social network analysis in the field of spatial analysis, and has guiding significance for the spatial practice of traditional villages.
2. Materials
2.1. Case study: Banliang Village
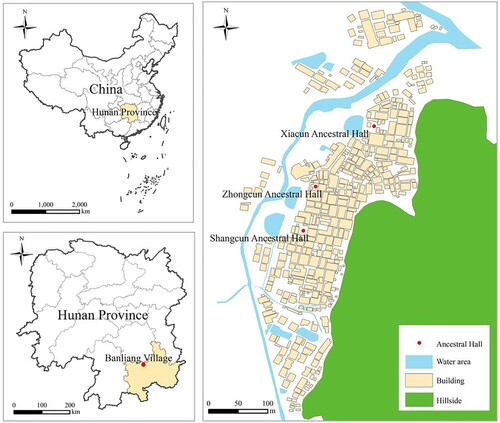
Banliang Village is located in the jurisdiction of Gaoting Township, Yongxing County, Chenzhou City, Hunan Province. It is situated against the Elephant Ridge, extends over a vast and flat area, takes advantage of the mountainous terrain, and boasts a grand scale (Yang et al. Citation2023). The village is divided into three clusters: Shangcun, Zhongcun, and Xiacun, each with its own ancestral hall, arranged behind three crescent-shaped ponds in front of the village (). The village was established at the end of the Song Dynasty and the beginning of the Yuan Dynasty. The entire village shares the same surname and ancestry, being one of the main ancestral origins of the local Liu family, whose ancestors can be traced back to Liu Bang. With the deep exploration of its historical and cultural values, Banliang Village has successively received various government honors and policy support, including being recognized as one of the first National Scenic Tourist Villages with Unique Features, a Chinese Village of Historical and Cultural Significance, one of the first batch of Traditional Chinese Villages, a Cultural and Tourist Destination for Traditional Chinese Architecture, a National 4A-level Tourist Attraction, and a National Ecological and Cultural Village. Despite having a history of over 600 years, the village still maintains over 360 historically intact buildings. It encapsulates the entirety of the Geomantic Omen culture, lineage culture, and traditions of southern Hunan Province. Banliang Village serves as a living museum of ancient dwellings in the southern Hunan region and is a repository of ancient Chinese lineage rituals, Confucian traditions, Geomantic Omen beliefs, philosophical consciousness, architectural techniques, ecological wisdom, and more. It is renowned as the ‘Number One Village in Southern Hunan Province’, noted for its vast scale, comprehensive preservation, unique geomantic omen, and profound cultural heritage. This village serves as a typical case study for research on traditional village architectural layouts and the exploration of ancient wisdom in spatial construction.
Figure 1. Location Map of Banliang Village.
2.2. Data sources, model construction, and data processing
2.2.1. Data sources
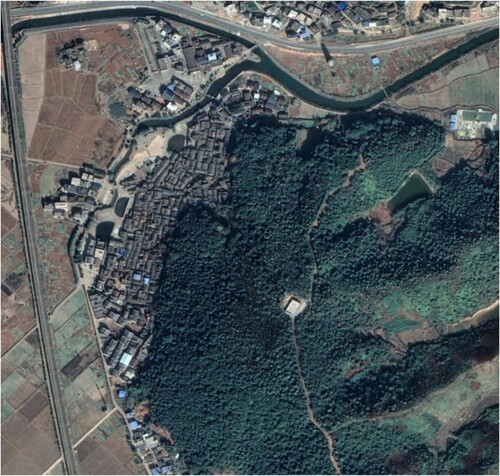
The primary data source of this study is the planning documents of Banliang Village, which include two-dimensional architectural plans drawn based on field measurements. To assist in the measurement and verification of the accuracy of the architectural plans, we utilized high-resolution satellite imagery provided by the Centre National d'Études Spatiales (CNES) and Airbus Group (). These images offer a high-altitude perspective of Banliang Village, helping us confirm the location and layout of buildings. It should be noted that the satellite imagery in this study serves primarily as an auxiliary tool; therefore, we did not conduct an in-depth analysis of the detailed parameters of the images. Since the focus of this research is primarily on the ancient architectural complexes within the village's core conservation area, the data pre-processing retained only the ancient architectural complexes within the core conservation area of Banliang Village.
Figure 2. Satellite Image of Banliang Village (Caption: This satellite image of Banliang Village is provided by the Centre National d'Études Spatiales (CNES) and Airbus Group (Airbus). The image was captured on December 31, 2020. For presentation purposes, the image has been cropped and compressed).
2.2.2. Model construction and data processing
Traditional villages are the result of aggregating architectural units, forming specific organizational structure relationships. At the same time, they create a spatial form of the settlement. As shown in , these two aspects are mutually corresponding on a two-dimensional plane. The organizational structure relationship formed between architectural units is essentially the integration of the local order relationships formed between them.
Figure 3. Schematic Diagram of the Relationship between Spatial Form and Spatial Order in Traditional Villages.
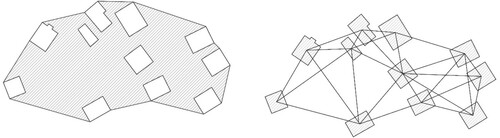
Therefore, the spatial form exhibited by traditional villages comes from the orderly aggregation of architecture. It can be said that the organizational structure relationship between buildings defines the spatial form of traditional villages, and the spatial form is the spatial manifestation of the organizational structure relationship between buildings.
The process of architectural units aggregating based on certain organizational relationships is the ordering process of traditional villages. To explore this ordering process, we selected the directional similarity between buildings as the quantitative expression of the relationship between them and constructed the corresponding asymmetric weighted matrix model M = M (i, j). This matrix model stores the directional similarity weight between every two buildings, taking into account distance and age. Therefore, this network model is a directed weighted network composed of nodes and edges. Nodes represent buildings, and edges represent relationships between buildings. In this paper, we use directional similarity between buildings as the relationship indicator. Edges have weights indicating the degree of directional similarity between two buildings. Since buildings have chronological order, older buildings can influence the direction of newer buildings, hence the edges are directional. By using social network analysis methods, we calculate the centrality of each architectural unit based on the directional similarity weight. This reveals how these architectural units shape the spatial form of the entire traditional village in terms of their identity and manner of influence.
(1)
(1) The processing flow of the entire model is as follows:
Generating two representation Matrices; Use ArcGIS Pro 3.0 based on two-dimensional vector data of the buildings in the planning documents of Banliang Village and their corresponding satellite imagery of Banliang Village to retain 361 core buildings. With further Python processing, the longest axis passing through the centroid of each polygon building was calculated, along with the shortest straight-line distance to the nearest edge of another polygon building. The coordinates of the starting and ending points of the longest axis were transformed into vector form. The cosine similarity formula (Equation (2)) was then applied to calculate the directional similarity between each pair of buildings. This process generated a 361 × 361 matrix representing the directional similarity between buildings, denoted as Matrix 1, which characterizes the differences in orientation between the buildings. By calculating the shortest straight-line distance between the nearest edges of buildings, a 361 × 361 matrix was obtained to represent the distances between buildings. This matrix is referred to as Matrix 2 and characterizes the spatial distances between the buildings. Using a social network analysis method and taking into account control variables and the directional similarity characteristics between buildings, the directional similarity matrix was transformed into a 361 × 361 directional similarity weighted matrix. This was used to construct a weighted network graph, with buildings as network nodes and weighted directional similarity as edge weights, to explore the significance of building nodes in the spatial morphology of the village.
Constructing the weighted matrix; These control variables were introduced include the distance between buildings, indicating how far each building can influence surrounding buildings, and the chronological order of construction between buildings. These variables were introduced to account for the impact that each building has on nearby buildings and the differences in construction periods between buildings.
Designing the distance variable; The choice of a 30-meter distance for considering mutual influence between buildings was based on the following factors. First, this paper regards the order relationships between village buildings as representations of social relationships and culture within the village. Buildings convey these order relationships through spatial means, which involves people's perceptual experiences of space. Referring to the social visibility distance data mentioned in Gehl's (Citation2001) book Life Between Buildings and relevant data from the Standard Values and Formulas for Human Engineering (Quoted in (Wang Citation2009)), supervised by the Japanese scholar Sato Masahiko, 30 meters represents the range within the recognition field where closely interacting elements are located. Second, in calculating the distances between all buildings, the approach used is to measure the shortest straight-line distance between the closest edges of vectorized building polygons. This method is preferred over measuring the distance between the centroids of buildings, as it eliminates errors that might arise from solely considering centroid distances while ignoring the closest edge-to-edge distances between buildings. Last, given the presence of 361 building nodes in the dataset and considering computational efficiency as well as the visual clarity of the network graph, the inclusion of a 30-meter distance control variable helps eliminate direction similarity values that are not significant due to buildings being too far apart to have a meaningful connection. Based on the 30-meter distance control variable and using Matrix 2 for numerical adjustments, if the distance between building nodes i and j exceeds 30 meters, the value in Matrix 1 for i and j is set to 0. If the distance is less than or equal to 30 meters, the value remains unchanged, resulting in Matrix 3.
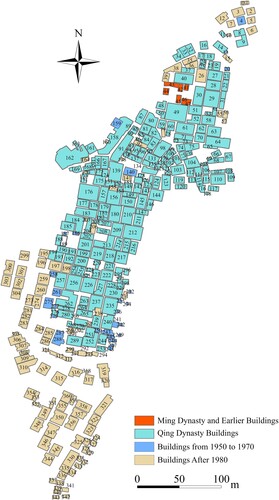
When introducing the control variable based on building age, older buildings, due to their earlier construction, can influence newer buildings in terms of order. Conversely, the influence does not apply in the opposite direction. Buildings constructed during the same period are considered to be able to influence each other, as they lack detailed time division due to a lack of corresponding data. Based on the classification of building ages according to the planning data for Banliang Village, buildings are categorized into four levels: those from the Ming Dynasty and earlier are rated as 4, those from the Qing Dynasty are rated as 3, those from the 1950s to the 1970s are rated as 2, and those from the 1980s onward are rated as 1 (). It is worth noting that the primary focus of this paper is the preserved core ancient buildings. However, the evolution and development of traditional villages have spanned a long historical period. It is difficult to ascertain whether relatively modern buildings were constructed at the same location after the destruction, disappearance, or even constructive damage of earlier buildings. Therefore, this paper also includes the analysis of buildings dating from the 1950s onward that are intermixed with well-preserved architectural clusters. In fact, newly constructed buildings are often built on sites of heavily damaged or vanished structures. Whether constructed by residents as spontaneous, bottom-up initiatives or built as part of a planned preservation effort to harmonize with the architectural aesthetics of the surroundings, new buildings are subject to the constraints of neighboring structures in terms of their order during construction.
After establishing the building age grades, adjustments were made to matrix 3 based on the building age ratings. If building node i had a lower age rating than building node j, the value of i and j in matrix 3 was set to 0; otherwise, the value remained unchanged, resulting in matrix 4.
Figure 4. Key Architectural Era Assessment Chart.
3. Methodology
The spatial form of traditional village architecture is manifested through the arrangement and composition of buildings within the village. Certain key architectural nodes have a significant impact on the overall or local order of the village. These key buildings play a crucial role in transmitting order information, allowing the entire village to exhibit harmony and coherence in terms of order. Simultaneously, within the village, some buildings are closely connected, forming small architectural communities, and the internal situations within each community may also differ. Therefore, a macro-level analysis of the traditional village landscape and site selection is insufficient to comprehensively understand this complex characteristic of traditional villages. It is necessary to focus on the role of the buildings themselves in shaping the village's form and explore the roles these building nodes play in the transformation of the village from spontaneous, disordered development to a perceptible, organized village form. The dissimilarity in orientation between buildings is a crucial metric for measuring the orderliness of individual buildings in traditional villages. Therefore, this paper takes the similarity in orientation between the core buildings of Banliang Village as a quantitative representation of the strength of relationships between village houses. It also introduces two control variables: distance and building age. Using a method based on social network analysis, buildings are treated as nodes, orientation similarity is used as edge weights, and a directed weighted network is constructed. This network is then subjected to centrality analysis to identify key building nodes within the network. Additionally, subgroup analysis is conducted on building nodes to reveal the network's clustering structure and internal connections among building nodes.
3.1. Orientation similarity
This article uses the difference in orientation similarity between buildings as a quantitative representation of the relationships between buildings. The core process is as follows: 1) Obtain the coordinates of the endpoints of the long axis of each building. 2) Subtract the starting point coordinates from the endpoint coordinates to derive vector components representing the direction of each building. 3) Calculate the cosine similarity between the vector components of each pair of buildings to determine the degree of orientation similarity. This approach quantifies the directional relationships between the buildings, which is a crucial metric for measuring the orderliness of individual buildings in traditional villages.
Given two vectors A and B, where A = () and B = (
), we have the following formula:
(2)
(2) The directional similarity between two buildings is calculated using Equation (2), where the value of
represents the direction similarity between their vector components. This equation can calculate the direction similarity between every pair of buildings, resulting in matrix 1. The value of
falls within the range of (−1,1). A value closer to 1 indicates that the two vectors are more similar, while a value closer to – 1 suggests that the vectors have opposite directions. A value near 0 implies that the vectors are nearly orthogonal. When calculating the directional similarity between buildings, we consider complete opposition and complete alignment in direction as being parallel, meaning that the buildings maintain consistency in direction. Therefore, values of directional similarity falling between (−1,0) are normalized to the range (0,1). Simultaneously, orthogonal vectors also indicate good order between two buildings and are considered to be aligned in direction (Pu Citation2012). In light of this, we need to reassign weights to the data adjusted with the two control variables (distance and building age) in the data processing section. In other words, we make adjustments to matrix 4. When direction similarity values are closer to 0 or 1, their weight values are greater, indicating stronger direction consistency. When these values tend toward the middle, the weight values are smaller, indicating weaker direction consistency. After reassigning weights, we obtain matrix 5. This matrix considers both the influence of distance and building age on the sequential relationship and the characteristic of direction difference between buildings. Following Equation 1, the weighted asymmetric matrix contains values between (0,1), where values closer to 1 signify stronger directional relationships between buildings, while values closer to 0 indicate weaker relationships.
3.2. Centrality of building nodes
Centrality is one of the most important and commonly used concepts in social network analysis. It is a measure of the central position of nodes within a network and reflects differences in a node's position or significance within the network (Camacho et al. Citation2020), Because matrix 5 introduces the influence of building age, the network graph is a directed weighted network graph. Unlike traditional network analysis, which only considers whether nodes are connected or not, without considering the strength or weight of connections, weighted network analysis provides a more accurate and realistic representation of the strength of influence between nodes. Therefore, in this study, we chose centrality metrics such as weighted out-degree, weighted in-degree, weighted degree centrality, weighted eigenvector centrality, and weighted betweenness centrality to identify key building nodes within the network.
3.2.1. Weighted out-degree/weighted in-degree, weighted degree centrality
In a weighted network, weighted out-degree refers to sum of the weights of connections emanating from a building node. If a node is connected to many other nodes and these connections have significant edge weights, its weighted out-degree will be high. This indicates the node's influence in terms of the quantity and strength of its outgoing relationships. Conversely, weighted in-degree represents the sum of the weights of all incoming edges to a building node. If a node is connected to by many other nodes and these incoming connections have substantial edge weights, its weighted in-degree will be high. This suggests the node's importance in terms of the quantity and strength of its incoming relationships from other nodes in the network.
(3)
(3)
(4)
(4) In Equation (3),
represents the weighted out-degree of building node i, E denotes the set of all edges in the network, (i, j) signifies a directed edge from node i to node j, and
represents the weight between nodes i and j. The weighted out-degree measures both the quantity and quality of the influence that a building node exerts on other nodes. A higher weighted out-degree implies that the node influences more nodes, and the influence on these nodes (based on direction similarity) is greater.
In Equation (4), represents the weighted in-degree of building node i, E denotes the set of all edges in the network, (j, i) signifies a directed edge pointing to node i, and
represents the weight between nodes j and i. The weighted in-degree measures both the quantity and quality of the influence that other building nodes have on this particular node. A higher weighted in-degree suggests that the node is influenced by more other nodes, and the influence from these nodes (based on direction similarity) is greater. Furthermore, weighted degree centrality assesses a node's importance comprehensively based on both its weighted out-degree and weighted in-degree. Its formula is shown in Equation (5).
(5)
(5) In Equation (5),
denotes the weighted degree centrality of node i,
represents the weighted out-degree of node i, and
presents the weighted in-degree of node i. The weighted degree centrality takes into account both a node's weighted out-degree and weighted in-degree. The higher the weighted degree centrality, the more it indicates that the node has multiple high-weight connections with other nodes. This metric offers a more comprehensive explanation of a node's influence in the network.
3.2.2. Weighted eigenvector centrality and weighted betweenness centrality
The weighted eigenvector centrality of a node is calculated by analyzing its connection to neighboring building nodes with high influence. The formula is as follows:
(6)
(6) In Equation (6),
represents the weighted eigenvector centrality of node i. In a network of building nodes, a higher
value indicates that the building nodes connected to this node have higher centralities, making these connected building nodes more important.
is the eigenvalue of the eigenvector,
is the set of neighboring nodes of node i,
is a matrix representing whether there is an edge (weighted by directional similarity) between node i and node j (an adjacency matrix),
represents the weight of the edge between node i and j, and
represents the Weighted Eigenvector Centrality of neighboring node j of node i.
The weighted betweenness centrality of a node examines its ability to act as a mediator in information transmission. It takes into account the number of paths a node participates in within the network, as well as the weights on these paths, thus measuring the node's contribution to information transfer. In a traditional village architectural node network, due to the constraints of distance and visibility, buildings cannot directly influence those that are farther away or not directly visible. However, this does not mean that a building has no influence on those other buildings; it can indirectly affect those other buildings by influencing the buildings it can directly affect. Nodes with high weighted betweenness centrality play a significant intermediary role in transmitting directional information between many nodes. The formula for calculating this centrality is as follows:
(7)
(7) In Equation (7),
represents the weighted betweenness centrality of node i. A larger
value indicates a greater contribution of that node to transmitting directional information.
represents the number of shortest paths from node k to node j that pass through node i,
represents the weight of the edge from node k to node j, and
represents the total number of shortest paths from node k to node j.
This article also defines the term ‘star building’ to distinguish it from key buildings that stand out in terms of centrality. A ‘star building’ refers to those public buildings with a larger individual volume and serving certain social functions; they are often the spiritual or psychological centers of the villagers. For example, the ancestral hall is the most common type in traditional Chinese villages. To conduct experiments, this paper primarily relied on ArcGIS Pro 3.0, Python 3.9, and Gephi 0.10.1 for the data processing and graphical visualization.
3.3. Building node community analysis
With Python 3.9, community analysis was performed on building nodes with NetworkX. Moreover, the Python-Louvain library was utilized to identify subgroups of building nodes with high cohesion and low coupling within the network and explore the internal factors that contributed to the morphology within different communities.
4. Results
4.1. Analysis of building node centrality results
Calculations in Python 3.9 were used to obtain the weighted in-degree, weighted out-degree, weighted degree centrality, weighted eigenvector centrality, and weighted betweenness centrality for nodes. lists the top 10% of building nodes based on various centrality measures.
Table 1. Ranking of Building Node Centrality (Top 10% of Building Nodes by Each Centrality Metric).
From , it can be observed that building nodes 96, 83, and 133 have the highest values for weighted out-degree, weighted in-degree, and weighted degree centrality. These three nodes consistently rank in the top three for all three centrality measures, indicating that they are connected to the highest number of other building nodes, and these connections carry significant weight. Weighted out-degree, weighted in-degree, and weighted degree centrality measure the influence of building nodes based on both the quantity of direct connections to other nodes and the magnitude of direction similarity weights. First, these three nodes have the highest number of connected edges in the entire node network, meaning they can influence a larger number of buildings and are influenced by a greater number of buildings within the network. Furthermore, considering the spatial positions of these three nodes within Banliang Village (as shown in ), these nodes are in close spatial proximity to each other. They are all located within the range where they can directly influence each other. This indicates that with these three nodes as focal points, the area around them has the highest building density within the entire network, and the buildings are closest to each other in terms of spatial distance. Finally, since the building node network is a weighted network, the direction similarity weight between building nodes is the primary factor considered. From this perspective, in combination with other nodes in close proximity to these three building nodes in spatial terms, these nearby nodes are also located in the most densely built-up areas. Some of them even have connection counts no lower than the nodes 96, 83, and 133. However, these nodes do not perform as well as nodes 96, 83, and 133 in these three centrality indicators. This suggests that nodes 96, 83, and 133 have very high direction similarity weights with the surrounding buildings, and they are highly coordinated with the neighboring buildings in terms of direction. In summary, when considering the weighted out-degree, in-degree, and weighted degree centrality, the building nodes with high centrality scores, particularly nodes 96, 83, and 133, connect to a significant number of other building nodes and have high direction similarity weights. These nodes are crucial and influential in the entire building node network. It is worth noting building 251, which has a relatively high weighted out-degree (ranking fourth), but due to its low weighted in-degree, its weighted degree centrality is not very high. This is because most of the buildings around building 251 have lower historical ratings, mostly modern buildings, while building 251 dates back to the Qing Dynasty, hence its higher weighted out-degree. On the other hand, considering and observing and displays the number of edges connected to building nodes 96 and 251, along with the average direction similarity weights. represents a self-network graph based on weighted degree centrality between building nodes 96 and 251, with node size indicating their respective weighted degree centrality values.
Figure 5. Self-Network Graph of Nodes 96 (a) and 251 (b) in the Building Network Based on Weighted Degree Centrality.
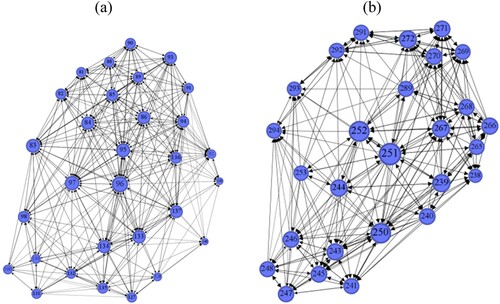
Table 2. A Comparison of Connection Count and Average Self-Orientation Similarity Weight for Nodes 96 and 251 in the Building Network.
From the self-network graph of building node 251 (b) with building node 96 (a), it can be observed that the degree centrality of the surrounding building nodes of 251 is generally lower than those surrounding 96. According to , the number of buildings connected to building node 251 is also lower than that of building node 96, but its average direction similarity weight is higher than that of building node 96. Considering that the connection pattern of building node 251 is mainly outward, it can be concluded that building 251's influence on the surrounding buildings in terms of direction is not inferior to building 96's influence on its surroundings. This indicates that buildings with closer construction periods rely more on buildings with older construction periods in terms of directionality.
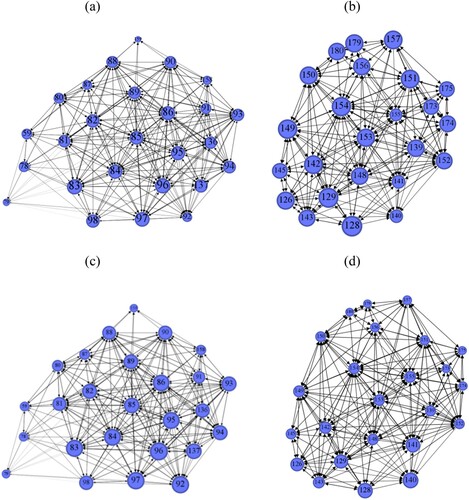
Looking at the results for weighted eigenvector centrality, building 96 has the highest score, which is expected since it is the node with the highest weighted degree centrality. However, it is worth noting that a high weighted degree centrality does not necessarily guarantee a high weighted eigenvector centrality. The latter also depends on the centrality scores of the buildings directly connected to it. As shown in , building 154 and building 85 have quite similar weighted degree centrality scores, but in terms of weighted eigenvector centrality, building 154 significantly lags behind building 85. Looking at , where (a) and (b), as well as (c) and (d), respectively, represent self-network comparisons of buildings 85 and 154 based on weighted degree centrality and weighted eigenvector centrality, it is apparent that building 154 has a similar number of connections to building 85. In terms of weighted degree centrality, their performance is quite similar. However, due to the lower importance of the nodes to which they are connected, the weighted eigenvector centrality of building 154 is significantly lower than that of building 85. This indicates that the buildings surrounding building 154 do not perform as well in terms of overall directional similarity compared to building 85. These buildings have lower directional similarity weights with the nodes to which they are directly connected, resulting in limited influence on the surrounding building nodes in terms of direction. Therefore, buildings with high weighted eigenvector centrality are essential nodes in the network. They are directly connected to nodes with high weighted degree centrality, allowing them to obtain direction information from these highly influential nodes. This enables them to receive the most direct and comprehensive direction information, maintaining a strong directional similarity. These buildings represent the area with the highest directional similarity to the surrounding building nodes in Banliang Village, making them the most consistent nodes in terms of overall direction.
Figure 6. Self-network Comparison Graphs for Building Nodes 85 and 154 Based on Eeighted Degree Centrality (a, b) and Weighted Eigenvector Centrality (c, d).
From the results of weighted betweenness centrality, building 102 has the highest value. This indicates that the influence of other buildings around building 102, which is beyond its visual or social perspective, is mostly indirect, with building 102 serving as a bridge. Additionally, building 102 does not lose much information when transmitting directional information. This helps maintain a high and consistent directional similarity weight with the building nodes at both ends of the bridge. Similar to building 102, other buildings, such as buildings 99, 72, and 212, have closely following weighted betweenness centrality values. These buildings with high weighted betweenness centrality serve as hubs in maintaining the overall directional similarity within the village. In other words, they play a crucial role in shaping the village as a whole. The order within traditional villages is primarily established upon a self-organizing mechanism from the bottom-up. Consequently, the influence of buildings on other buildings or certain elements on buildings is greatly limited by visibility and distance. Their direct influence extends to a certain depth. However, this does not mean that they cannot impact buildings beyond their direct range. Their influence is propagated through buildings with high weighted betweenness centrality. Because of these intermediary points, relevant order information is transmitted to other buildings. The order information remains relatively consistent as it is passed through these intermediary points, but it also undergoes subtle deviations as the distance increases. This results in the entire village exhibiting a gradient of organic states it is not entirely uniform like a consciously planned structure, nor is it completely chaotic. Instead, it is a gradual, traceable, and organic state with some level of order.
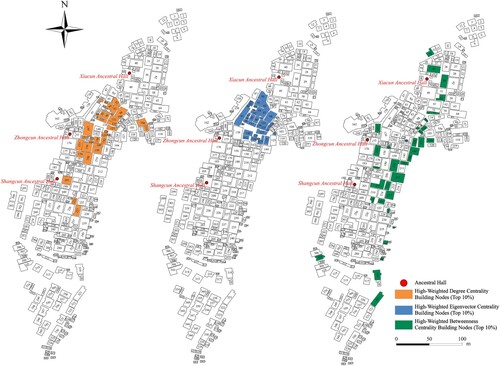
In summary, the weighted in and out-degree, weighted degree centrality, weighted eigenvector centrality, and weighted betweenness centrality of nodes are measurements of their influence based on the quantity, quality, and importance of connections. Examining the spatial positions of buildings with high centrality (), it becomes evident that nodes with high weighted degree centrality and weighted eigenvector centrality are generally concentrated, particularly those with high weighted eigenvector centrality. This indicates that these nodes have significant influence over local directions, forming a group of building nodes within the entire village that exhibit strong local directional characteristics. The buildings with high weighted betweenness centrality exhibit a more dispersed spatial distribution, as they serve as bridges for directional information across the entire village. Their distribution spans throughout the village, highlighting their crucial role in maintaining the spatial consistency of the village. However, these nodes might not be the ‘star buildings’ that people typically focus on in their daily lives, such as larger individual structures that serve specific social functions or communal buildings, which are often the centers of social interaction. For instance, ancestral halls are usually social hubs, but the centrality of buildings around ancestral halls in Shangcun, Zhongcun, and Xiacun does not stand out significantly (). In contrast, buildings with high weighted degree centrality and high weighted eigenvector centrality are predominantly located near a particular ancestral hall and are closely distributed around it. This indicates that Banliang Village generally adheres to the conventions of clan culture. The ancestral hall itself does not have prominent centrality due to its location, which is not in the village center, nor does it have the highest building density. However, its influence and contribution to the spatial form of the village are evident through the buildings within a certain distance around it. It could be said that these hidden high-centrality buildings act as spokespeople for ‘star buildings’, such as ancestral halls. The ‘star buildings’, due to their location and limited proximity, may have a more constrained depth of influence, but they can still exert their impact through these hidden key buildings.
Figure 7. Spatial Distribution of High Centrality Building Nodes (Top 10%).
4.2. Analysis of building node community results
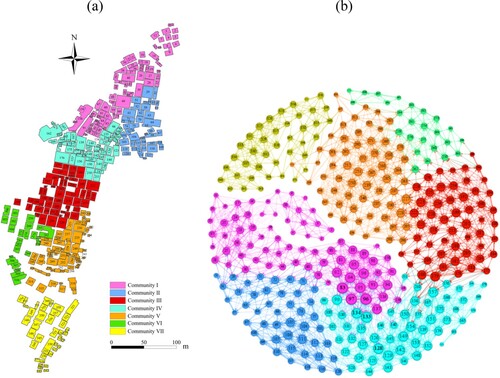
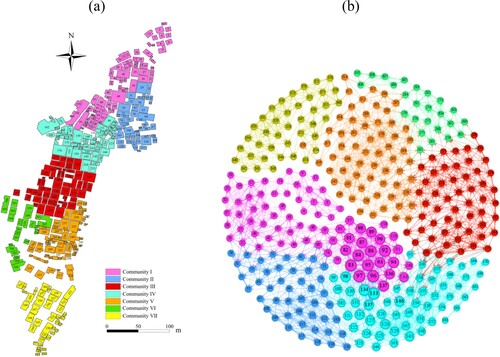
According to the division of building node communities, the buildings in Banliang Village are divided into 7 highly cohesive building subgroups (), with a modularity of 0.681. In general, a modularity higher than 0.5 represents a relatively ideal community division, indicating close connections within the communities and weaker connections between them.
Table 3. Building Node Community Size, Proportion of Historic Buildings, and Average Directional Similarity.
shows that Community I is the largest in terms of size, representing 21.33% of the total number of buildings. Community VI is the smallest, comprising 6.93% of the total number of buildings. The Ming and Qing Dynasty buildings are primarily concentrated in the first four communities. Calculate the overall average direction similarity weight based on the average direction similarity weight of nodes within the community. While nodes within the community still have some connections with nodes from other communities, the majority of the connections are within the community. Therefore, this weight value can to some extent indicate the level of consistency in direction among the buildings within the community. Community III has the highest average direction similarity, which is 0.952. This indicates that the buildings within Community III exhibit the highest level of direction similarity and order. Considering the weight relationships between the buildings at the edge of Community III and the buildings from other communities, in combination with the high internal direction similarity of 0.952, it suggests that the nodes at the edge of Community III have very high direction similarity weight values with the buildings within other communities. This further underscores that there are several key building nodes within Community III.
In terms of the proportion of Ming and Qing dynasty buildings within the communities, Community III stands out with a percentage of 81.48%. A large number of Ming and Qing dynasty buildings in this community maintain relatively consistent orientations, resulting in the best order within this community. Therefore, Community III can be considered the core community of Banliang Village, where the buildings exhibit the highest directional similarity among themselves. Although Communities I, II, and IV also have a significant proportion of Ming and Qing dynasty buildings, the size of Community I is the largest. It covers a considerable spatial extent, and in some cases, buildings within this community are not directly connected. Relatively long distances can lead to the loss of directional information during transmission, resulting in a lower average weight within this community. Community II, on the other hand, has the highest percentage of Ming and Qing dynasty buildings, at 95.65%. However, its proximity to the mountain (as seen in and ) restricts its expansion, causing the overall direction of building extension to deviate from that of the entire village. This has resulted in a lower average directional similarity weight within Community II. This observation highlights that during periods of lower productivity, people had limited capabilities to transform nature and had to comply with the rigid constraints of natural factors. This underscores the fundamental constraints imposed by natural elements. Due to the influence of these natural factors, the extension direction of Community II resulted in many buildings extending into Community IV. Consequently, numerous building nodes extended from Community IV have lower directional weights. This, in turn, affects the overall weight of Community IV. Community VII primarily consists of modern buildings constructed after 1980 and maintains relatively high average weight values. This could be attributed to the newer nature of the buildings in Community VII, which are likely to have a stronger planning intent, resulting in a higher level of consistency. On the other hand, communities V and VI have fewer Ming and Qing era buildings, yet the overall directional order in Banliang Village is well maintained. As a result, their average weight values are not low.
From the perspective of the Weighted Out-Degree, In-Degree, and Degree Centrality of nodes within the communities, as shown in , (a) depicts the spatial positions of the building node communities, while (b) shows the community network based on node weighted degree centrality. Different colors represent different communities, and node size indicates the size of Weighted Degree Centrality. It can be observed that the buildings with high Weighted Out-Degree, in-degree, and degree centrality, such as 96, 83, 97, 84, are mostly located in Community I. When considering the positions of these nodes within the village, they are situated on the periphery of Community I, at the boundaries with Community IV and Community II. However, there are no nodes with high Weighted Out-Degree, In-degree, and Degree Centrality at the center of Community I. This is determined by the morphology of Community I. Community I has a significant north‒south span, while the east‒west span is relatively small. Consequently, most buildings exhibit an elongated distribution. Only at the intersections between communities where the east‒west span is greater and when there is an overall increase in building density do we find nodes with high weighted out-degree, in-degree, and degree centrality. For example, buildings 133 and 98, located on the border of Community IV, intersecting with Communities I and II, building 227, located on the border of Community V, intersecting with Community IV, and building 180, located on the border of Community III, intersecting with Community IV, are all situated at the intersection points of communities. They are in central positions at these intersections and have high weighted out-degree, in-degree, and degree centrality. This is because this location has the highest building density, providing more opportunities to influence other buildings or be influenced by them. Therefore, most nodes with high weighted out-degree, in-degree, and degree centrality are located in these areas. Buildings located at the border of Community II, intersecting with Communities I and IV, do not exhibit particularly high weighted out-degree, in-degree or degree Centrality. This is primarily due to the constraints imposed by the terrain, which results in a lower average directional similarity weight within Community II. Even though these buildings are located at the border of the community, their own directional similarity with other buildings is low, which explains their lack of centrality. This shows that within the architectural node network, weighted out-degree, in-degree, and degree centrality are influenced not only by the number and weight of direct connections but also by the inherent morphology and building density distribution within the communities.
Figure 8. Spatial Location Map of Building Node Communities (a) and Building Node Community Network Graph Based on Weighted Degree Centrality (b).
From the perspective of the weighted eigenvector centrality of internal nodes, as shown in , the node size represents the weighted eigenvector centrality. Observing the graph, it can be seen that most of the nodes with high weighted eigenvector centrality are located at the edges of Community I, intersecting with Communities II and IV. For example, buildings numbered 96, 97, 92, 83, 95, and 84, among others, are situated in these positions. Hence, even though Community I has a relatively low average directional similarity weight, the presence of many high weighted eigenvector centrality nodes within the community highlights the importance of Community I within the network. Additionally, the buildings in Community III exhibit relatively uniform weighted eigenvector centrality, with all having decent centrality scores, which aligns with Community III having the highest average directional similarity. The region at the edge of Community IV connecting with Community I is the most concentrated area of high-weighted eigenvector centrality nodes in the entire weighted network. The nodes within Community IV situated in this area have higher centrality scores because they are connected to many high-weighted eigenvector centrality buildings.
Figure 9. Spatial Location Map of Building Node Communities (a) and Building Node Community Network Graph Based on Weighted Eigenvector Centrality (b).
Community IV has the highest number of high-weighted betweenness centrality nodes, as shown in . Considering , where the size of the nodes in graph (b) represents the nodes’ weighted betweenness centrality, we can observe that Community IV connects with Communities I, II, and III. It has the most neighboring communities out of all communities and includes almost all the Ming and Qing dynasty buildings in the entire village. The complex directional information transfer between these four communities is primarily facilitated by the nodes within Community IV, acting as bridges for the transmission of directional information. Examining , which shows a partial self-community network of high betweenness centrality buildings, with nodes in different colors representing their membership in different communities and node sizes indicating the size of their weighted betweenness centrality, we can see that buildings with high weighted betweenness centrality connect different communities. For instance, buildings 99 (a) and 102 (b) connect Communities II and IV, buildings 134 (c) and 167 (d) connect Communities I and IV, and building 157 (e) connects Communities III and IV. These nodes have higher weighted betweenness centrality because they are positioned at community boundaries. Similar examples include building 221 (f) on the edge of Community III, connecting Communities III and V, and building 72 (g) on the edge of Community II, connecting Communities II, I, and IV. Communities V, VI, and VII are relatively dispersed in terms of their buildings and are spatially distant from the first four communities that have a higher concentration of Ming and Qing dynasty buildings. In these communities, the directional information transmission for most modern and contemporary buildings is quite generalized and lacks a strong sense of direction. They are also physically distant from other communities, resulting in limited reception of directional information from other communities. As a result, there are fewer buildings with high weighted betweenness centrality in these communities. It is evident that the more recent architectural groups are characterized by a higher level of overall cohesiveness, indicating that when constructing buildings within these communities, there was a more top-down approach with a strong emphasis on planned order. While these structures tend to be more regular in form, they may lack the dynamism found in older, more organically developed communities. Additionally, the abundance of high weighted betweenness centrality nodes in Community IV is closely related to its relatively large size within the seven communities The larger a community is, the more intermediary nodes it requires internally to facilitate the transmission of directional information. Similarly, Community I is the largest in size and has a considerable vertical span. Therefore, its three high-weighted betweenness centrality nodes (30, 34, and 40) are spatially located closer to the center of Community I. Given its larger vertical dimension, there is a need for these buildings situated near the community center to transmit directional information within the community. Likewise, both Community III and Community V are relatively large, requiring a greater number of high-weighted centrality nodes to connect the buildings within their communities.
Figure 10. Spatial Location Map of Building Node Communities (a) and Building Node Community Network Graph Based on Weighted Betweenness Centrality (b).
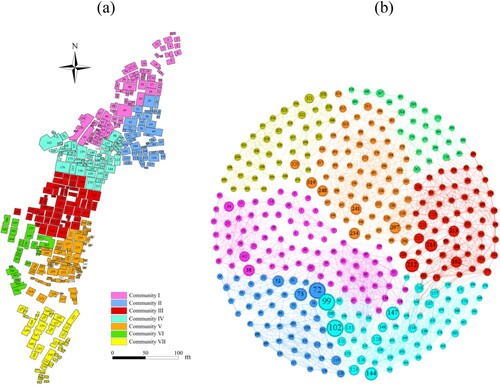
Figure 11. Self-Network Graph of Select High Weighted Betweenness Centrality Building Nodes (a-g).
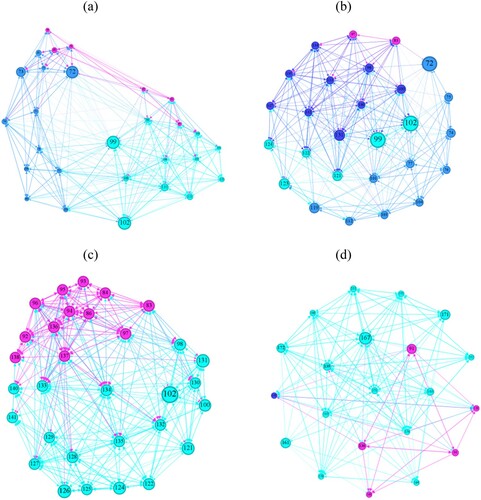
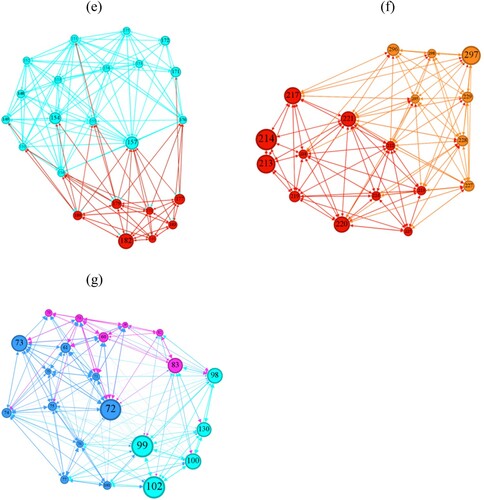
Table 4. Number and Proportion of Nodes with High Weighted Betweenness Centrality within Communities.
From the results above, it is evident that the centrality of nodes is closely related to various factors within the village, including building density, construction era, community size, community location, and community shape. Communities with more uniform shapes and higher building density tend to have higher centralities of nodes. These communities often have internal nodes with higher weighted out/in-degree and weighted degree centrality due to their high directional similarity with other nodes. Communities with more neighboring communities, clear differences in construction eras within the community, and larger community sizes tend to have more high-weighted betweenness centrality nodes.
5. Discussion
The orderliness of traditional villages is a complex issue that is difficult to fully consider. For this article, there are still several aspects that need further discussion:
Natural environment and resource endowments: The natural geographical environment, such as the landscape and terrain, defines the most basic morphological characteristics of traditional villages. In the case of Banliang Village, the mountainous and river-facing environment has led the village to expand along the mountain and river directions, presenting a relatively elongated spatial layout. Resource endowments, such as land, forests, and water sources, also affect the spatial form of traditional villages. These factors have influenced the spatial development of Banliang Village as well.
Building area differences: The difference in building area affects the overall spatial order of traditional villages. The smaller the difference in building area between buildings, the more regular the buildings appear visually. However, compared to the greater sense of disorder brought by large differences in direction and distance between buildings, the impact of differences in building area is smaller. Considering the difference in area as a weight is an area that can be improved in future research.
Other key nodes: Many other nodes such as squares, ponds, bridges, and other non-building elements are also key nodes that can release or transmit order information. These nodes are mostly endowed with certain cultural meanings by people. Incorporating more key nodes into consideration and quantifying the order information released or transmitted by these nodes is the focus of the next step of research.
Centrality indicators and community division: The completeness and applicability of the centrality indicators selected in this article still need to be further verified in many case studies. Additionally, the results of building community division differ depending on the algorithm used, and multi-algorithm comparison and verification interpretation is the focus of subsequent work.
6. Conclusion
This study investigated social network analysis methods based on the directional relationships between village buildings. Specifically, Banliang Village is used as a typical case to construct the network analysis of the building nodes. On the one hand, it identified crucial building nodes that upheld the overall spatial order of Banliang Village. Furthermore, the study delved into the division of building node communitie to improve the analytical methods and promote perspectives for understanding traditional village spatial order. This research holds significance both in theory and practice. The main conclusions are as follows:
The weighted degree centrality, weighted eigenvector centrality, and weighted betweenness centrality of nodes measure the influence of architectural nodes from the aspects of quantity, quality, and importance, respectively. When considering edge weights in all three centrality metrics, the following can be observed: nodes with high weighted degree centrality emphasize their key positions by influencing a greater number of architectural nodes; nodes with high weighted eigenvector centrality strengthen their influence by directly connecting with highly central architectural nodes; and nodes with high weighted betweenness centrality act as bridges for directional information diffusion in the entire village, playing a crucial role in maintaining the stability of the village's spatial form. Furthermore, from the comparison of the three different architectural node centralities, it is evident that newer buildings in terms of construction date tend to rely more on older buildings in terms of spatial directionality.
The key buildings with high centrality are not the ‘star buildings’ in the village, and these two categories of buildings contribute to the formation of the village's spatial order in different ways. ‘Star buildings’ shape the village's spatial order in an explicit, intuitive, and holistic manner due to their social functions and cultural significance. In contrast, buildings with high centrality affect the spatial order in a subtle, indirect, and localized manner, often escaping people's attention and remaining challenging to discover.
Based on the architectural node network connectivity patterns, the buildings in Banliang Village can be divided into 7 sub-communities with a modularity of 0.681, indicating an ideal result for architectural node community division. Community III has the highest average direction similarity weight among all communities, making it the most directionally consistent community. The degree of directional consistency among architectural nodes within a community is influenced by factors such as community size, the number of Ming and Qing dynasty buildings within the community, and the community's morphology.
The centrality of nodes varies unevenly between communities. In general, communities with a higher proportion of older Ming and Qing dynasty buildings have more prominent central nodes, while the opposite is true for communities dominated by more recent buildings. Similarly, communities with a larger proportion of Ming and Qing dynasty buildings exhibit a more complex internal order, displaying an organic layout that suggests a form of self-organizing order. Conversely, communities mainly consisting of modern and contemporary buildings appear more uniform overall, but the heavier traces of human planning result in a more rigid and less flexible arrangement of architectural nodes, indicating a certain degree of externally imposed order.
Geolocation information
The case study area of this research is located within Gaoting Township, Yongxing County, Chenzhou City, Hunan Province, China.
Acknowledgments
The authors would like to express their gratitude to the editors and referees. Thanks also go to Dr. Jing Fu for her assistance and guidance during the submission process.
Data availability statement
The high-resolution satellite imagery data utilized in the empirical study, along with the Python code for extracting directional information between buildings, calculating the shortest edge distance between buildings, and constructing the directed weighted matrix, can be downloaded from Figshare at https://figshare.com/s/9c95aa99c13b73ab72da. Please note that the planning documents cannot be shared due to confidentiality constraints.
Disclosure statement
No potential conflict of interest was reported by the author(s).
Additional information
Funding
References
- Bański, Jerzy, and Monika Wesołowska. 2010. “Transformations in Housing Construction in Rural Areas of Poland's Lublin Region—Influence on the Spatial Settlement Structure and Landscape Aesthetics.” Landscape and Urban Planning 94 (2): 116–126. https://doi.org/10.1016/j.landurbplan.2009.08.005.
- Bodach, Susanne, Werner Lang, and Johannes Hamhaber. 2014. “Climate Responsive Building Design Strategies of Vernacular Architecture in Nepal.” Energy and Buildings 81:227–242. https://doi.org/10.1016/j.enbuild.2014.06.022.
- Camacho, David, Ángel Panizo-Lledot, Gema Bello-Orgaz, Antonio Gonzalez-Pardo, and Erik Cambria. 2020. “The Four Dimensions of Social Network Analysis: An Overview of Research Methods, Applications, and Software Tools.” Information Fusion 63:88–120. https://doi.org/10.1016/j.inffus.2020.05.009.
- Che, Z., and J. Bao. 2006. “Research on Tourism Development of Traditional Villages and the Change of Form.” Planners 22 (6): 45–60.
- Che, Z., S. Wen, and H. Wang. 2009. “Review and Prospect of the Researches on Chinese Village Morphology in the Past 20 Years.” Areal Research and Development 28 (4): 35–39. https://doi.org/10.3969/j.issn.1003-2363.2009.04.008.
- Chen, C., B. Li, J. Yuan, and W. Yu. 2018. “Spatial Morphology Cognition of Traditional Village Based on Space Syntax: A Case Study of Qinchuan Village of Hangzhou.” Economic Geography 38 (10): 234–240. https://doi.org/10.15957/j.cnki.jjdl.2018.10.028.
- Chen, Xiaohua, Wanzhen Xie, and Hongbo Li. 2020. “The Spatial Evolution Process, Characteristics and Driving Factors of Traditional Villages from the Perspective of the Cultural Ecosystem: A Case Study of Chengkan Village.” Habitat International 104:102250. https://doi.org/10.1016/j.habitatint.2020.102250.
- Cloke, Paul. 1999. “The Country.” In Introducing Human Geographies, edited by Paul Cloke, Philip Crang, and Mark Goodwin, 256–267. London, UK: Edward Arnold.
- Deng, Y., X. Fu, W. Zheng, and H. Zhang. 2021. “Representation, Measurement and Attribution of Spatial Order of Traditional Villages in Southern Hunan.” Geographical Research 40 (10): 2722–2742. https://doi.org/10.11821/dlyj020210651.
- Duan, Yapeng, Liangqing Yan, Ziling Lai, Qianting Chen, Youying Sun, and Li Zhang. 2022. “The Spatial Form of Traditional Villages in Fuzhou Area of Jiangxi Province Determined Via Gis Methods.” Frontiers of Earth Science, 1–13. https://doi.org/10.1007/s11707-022-0986-1.
- Figlus, Tomasz, and Łukasz Musiak. 2020. “Analysis of Morphological Changes of Rural Settlement Patterns after World War II in the Metropolitan Area of Łódź Using a Graph Theory Based Method.” Environmental & Socio-economic Studies 8 (4): 57–72. https://doi.org/10.2478/environ-2020-0023.
- Gehl, Jan. 2001. Life between Buildings: Using Public Space. Copenhagen: The Danish Architectural Press.
- Gong, Lei, Jianzhu Yang, Chong Wu, and Hui Zhou. 2023. “Fractal Characteristics of the Spatial Texture in Traditional Miao Villages in Qiandongnan, Guizhou, China.” Sustainability 15 (17): 13218. https://doi.org/10.3390/su151713218.
- Gou, Shaoqing, Zhengrong Li, Qun Zhao, Vahid M. Nik, and Jean-Louis Scartezzini. 2015. “Climate Responsive Strategies of Traditional Dwellings Located in an Ancient Village in Hot Summer and Cold Winter Region of China.” Building and Environment 86:151–165. https://doi.org/10.1016/j.buildenv.2014.12.003.
- Hu, Zui, Yunyuan Deng, Peilin Liu, and Huijun Peng. 2020. “The Semiotic Mechanism of Cultural Landscape Genes of Traditional Settlements.” Acta Geographica Sinica 75 (4): 789–803.
- Jin, Qi Ming. 1988. “The History and Current Trends of Research on Rural Settlement Geography in China.” Acta Geographica Sinica 43 (4): 311–317. https://doi.org/10.11821/xb198804003.
- Li, Y., and Z. Chen. 1994. “Preliminary Study on the Geographical Features of Rural Settlements in North Shaanxi.” Arid Land Geography 17 (1): 46–52. https://doi.org/10.13826/j.cnki.cn65-1103/x.1994.01.008.
- Liu, Peilin. 1997. Ancient Village: A Harmonious Gathering Space. Shanghai, People’s Republic of China: Shanghai Joint Publishing Press.
- Liu, Peilin, Can Zeng, and Ruirui Liu. 2023. “Environmental Adaptation of Traditional Chinese Settlement Patterns and Its Landscape Gene Mapping.” Habitat International 135:102808. https://doi.org/10.1016/j.habitatint.2023.102808.
- Lu, Yong, and Yahaya Ahmad. 2023. “Heritage Protection Perspective of Sustainable Development of Traditional Villages in Guangxi, China.” Sustainability 15 (4): 3387. https://doi.org/10.3390/su15043387.
- Ma, Hang. 2006. “Persistence and Transformation of Chinese Traditional Villages—Rethinking the Planning of Traditional Settlements.” Urban Planning Forum 161:102–107.
- Mandal, R. B. 1979. Introduction to Rural Settlements. New Delhi: Concept Publishing Company.
- McGrath, Brendan. 1998. “The Sustainability of a Car Dependent Settlement Pattern: An Evaluation of New Rural Settlement in Ireland.” The Environmentalist 19 (2): 99–107. https://doi.org/10.1023/A:1006688916802.
- Owen, Stephen. 1996. “Sustainability and Rural Settlement Planning.” Planning Practice & Research 11 (1): 37–48. https://doi.org/10.1080/02697459650036431.
- Paquette, Sylvain, and Gérald Domon. 2003. “Changing Ruralities, Changing Landscapes: Exploring Social Recomposition Using a Multi-Scale Approach.” Journal of Rural Studies 19 (4): 425–444. https://doi.org/10.1016/S0743-0167(03)00006-8.
- Peng, Yigang. 1992. Analysis of Traditional Village and Town Settlement Landscape. Beiing, People’s Republic of China: China Architecture & Building Press.
- Peng, Yue, Hui Qiu, and Xinlu Wang. 2023. “The Influence of Spatial Functions on the Public Space System of Traditional Settlements.” Sustainability 15 (11): 8632. https://doi.org/10.3390/su15118632.
- Pu, Xincheng. 2012. “Quantitative Research on the Integrated Form of the Two-Dimensional Plan to Traditional Rural Settlement.” PhD diss., Zhejiang University. https://kns.cnki.net/kcms2/article/abstract?v=0kbmF0AymBAY6MUG-JEAKg1FqXPNiL-0gkzCZvhZnL2hyTB2bkng5H_Cmp1NAYojA7YJtD2pyZsMaGiwhzKJ2xqAynlPWF_hnBgMit-r_0B2p3p3ZU74Fpja__lxWbDeM8L5D2TUNmCLngIC4gZeVQ==uniplatform=NZKPTlanguage=CHS.
- Sevenant, Marjanne, and Marc Antrop. 2007. “Settlement Models, Land Use and Visibility in Rural Landscapes: Two Case Studies in Greece.” Landscape and Urban Planning 80 (4): 362–374. https://doi.org/10.1016/j.landurbplan.2006.09.004.
- Singh, Jai P., and Mumtaz Khan. 1999. “Hindu Cosmology and the Orinetation and Segregation of Social Groups in Villages in Northwestern India.” Geografiska Annaler: Series B, Human Geography 81 (1): 19–39. https://doi.org/10.1111/j.0435-3684.1999.00046.x.
- Sinha, Amita. 1990. “Social and Spatial Order in Villages in India.” Landscape Research 15 (3): 12–19. https://doi.org/10.1080/01426399008706318.
- Sun, Feifei. 2013. “Chinese Climate and Vernacular Dwellings.” Buildings 3 (1): 143–172. https://doi.org/10.3390/buildings3010143.
- Tao, Wei, Hongye Chen, and Jieyong Lin. 2013. “Spatial Form and Spatial Cognition of Traditional Village in Syntactical View: A Case Study of Xiaozhou Village, Guangzhou.” Acta Geographica Sinica 68 (2): 209–218.
- Tunçdilek, Necdet. 1974. “Types of Rural Settlements and Their Characteristics.” In Turkey: Geographic and Social Perspectives, edited by Peter Benedict, Erol Tiiiner Tekin, and Patina Mansur, 48–70. Leiden: E.J. Brill.
- United Nations. 2015. “Transforming Our World: The 2030 Agenda for Sustainable Development.” Resolution adopted by the General Assembly, United Nations, New York, USA. https://sdgs.un.org/2030agenda.
- Wang, Yun. 2009. Space Concept in Traditional Settlement Structure. Beijing, People’s Republic of China: China Architecture & Building Press.
- Wang, Dan, and Zuyun Liu. 2020. “Progress and Implications of International Rural Space Research.” Journal of Geography and Cartography 3 (1): 84–99. https://doi.org/10.24294/jgc.v3i1.1308.
- Wang, P. J., J. H. Zhang, F. Sun, S. S. Cao, Y. Kan, C. Wang, and D. Xu. 2021. “Spatial Distribution and the Impact Mechanism of Traditional Villages in Southwest China.” Economic Geography 41:204–213. https://doi.org/10.15957/j.cnki.jjdl.2021.09.021.
- Wang, Jing, Yaping Zhang, Guofu Yang, Yinyi Wang, Xiaomeng Cheng, and Bin Xu. 2023. “Spatial Reconstruction of Traditional Villages Towards Synergistic Development in the Fuchun River Basin Based on the Gravity Model.” Land 12 (5): 1037. https://doi.org/10.3390/land12051037.
- Whatmore, Sarah. 1993. “Sustainable Rural Geographies?” Progress in Human Geography 17 (4): 538–547. https://doi.org/10.1177/030913259301700408.
- Yang, Xi. 2020. “Advances in Quantitative Research Methodologies for the Spatial Layout of Rural Settlement in Recent 20 Years.” Urban Planning Inter-National 35 (4): 72–80. https://doi.org/10.19830/j.upi.2018.340.
- Yang, Fuduan, Yindi Dou, Bohua Li, Xingyue Liu, and Peilin Liu. 2023. “Symbolic Consumption and Field Transformation: The Evolution and Reconstruction of Cultural Space in Traditional Villages.” Geographical Research 42 (8): 2172–2190. https://doi.org/10.11821/dlyj020220954.
- Yang, Fu-Duan, Yin-Di Dou, Yun Yi, Xing-Yue Liu, Bo-Hua Li, and Pei-Lin Liu. 2023. “The mechanism and path of common prosperity of tourism-driven traditional villages from the perspective of catalysis:Taking Banliang village in Hunan province as an example.” Journal of Natural Resources 38 (2): 357–374. https://doi.org/10.31497/zrzyxb.20230206.
- Yang, Y., J. Hu, D. Liu, Y. Y. Jia, and L. Jiang. 2021. “Spatial Structure Identification and Influence Mechanism of Miao Traditional Villages in Guizhou Province.” Economic Geography 41:232–240. https://doi.org/10.15957/j.cnki.jjdl.2021.02.025.
- Yang, Xi, Ke Song, and Fuan Pu. 2020. “Laws and Trends of the Evolution of Traditional Villages in Plane Pattern.” Sustainability 12 (7): 3005. https://doi.org/10.3390/su12073005.
- Ye, M., and Z. Li. 2018. “A Typological Study of the Traditional Villages Spatial Plan Form Based on the Clustering Analysis.” Industrial Construction 48:50–55. https://doi.org/10.13204/j.gyjz201811011.
- Yin, L., P. Liu, B. Li, J. Qi, Z. Hu, and Y. Deng. 2023. “Map of Traditional Settlement Landscape Morphology Gene: A Case Study of the Xiangjiang River Basin.” Scientia Geographica Sinica 43 (6): 1053–1065. https://doi.org/10.13249/j.cnki.sgs.2023.06.012.
- Yu, Y., Y. Zhao, Z. Zeng, and X. Wang. 2020. “The Demand Tendency of Identification Technology for Cultural Spaces of Traditional Villages in Southwest China.” Guizhou Ethnic Studies 41 (6): 74–78. https://doi.org/10.13965/j.cnki.gzmzyj10026959.2020.06.012.
- Zhang, Chunming, Wanru Xiong, Tiandong Shao, Yiyang Zhang, Zhide Zhang, and Fei Zhao. 2023. “Analyses of the Spatial Morphology of Traditional Yunnan Villages Utilizing Unmanned Aerial Vehicle Remote Sensing.” Land 12 (11): 2011. https://doi.org/10.3390/land12112011.
- Zhu, Quan, and Shuang Liu. 2023. “Spatial Morphological Characteristics and Evolution of Traditional Villages in the Mountainous Area of Southwest Zhejiang.” ISPRS International Journal of Geo-Information 12 (8): 317. https://doi.org/10.3390/ijgi12080317.