Article title: Visualisation for analysing evolutionary dynamics of fashion trends
Authors: Takao Furukawa, Chikako Miura, Kaoru Mori, Sou Uchida, Makoto Hasegawa
Journal: International Journal of Fashion Design, Technology and Education
DOI: https://doi.org/10.1080/17543266.2019.1587789
In this article Figures 1, 2, 4, 6, 7, and 8 have been replaced due to copyright problem.
These figures have now been replaced as correction notice.
Figure 1. An example of fashion trends.
Figure 2. An example of fashion trends. (a) A part of dendrogram. (b) Pictures corresponding to sub-tree leaves forming a cluster.
Figure 4. The networks created by cluster analysis as a hierarchical cluster technique.
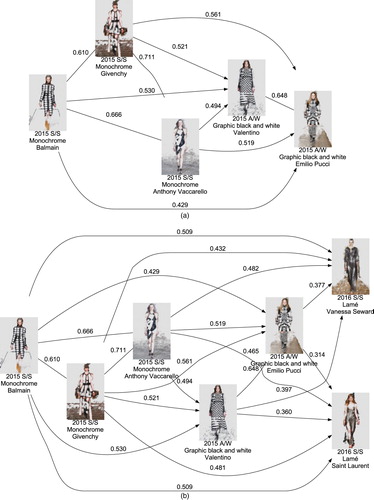
Figure 6. The networks created by s-means as a non-hierarchical clustering technique. (a) Number of clusters: 130. (b) Number of clusters: 120. (c) Number of clusters: 75.
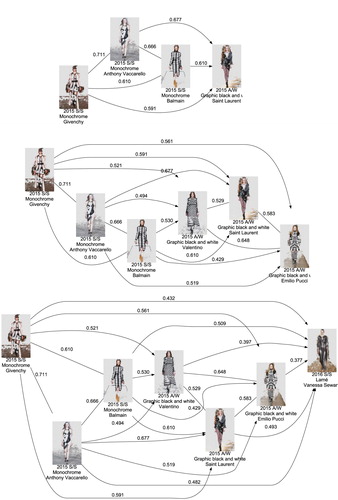
Figure 7. Examples of persisting fashion trends present in the networks. (a) Fashion trend derived from Tuxedos in 2013 S/S. (b) Fashion trend reaching to Pop art in 2015 S/S.
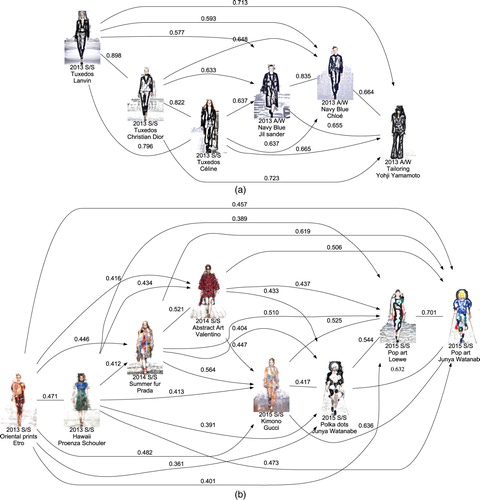
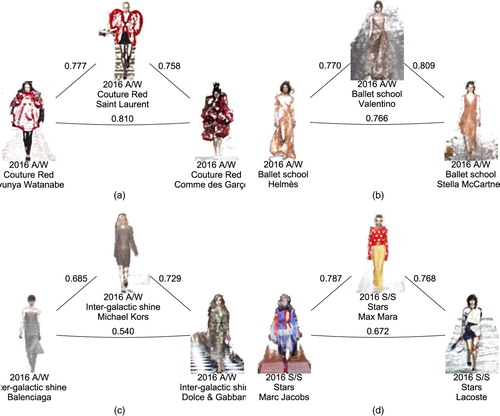
Figure 8. Examples of short-term fashion trends present in the networks. (a) Couture red in 2016 A/W. (b) Ballet school in 2016 A/W. (c) Inter-galactic shine in 2016 A/W. (d) Stars in 2016 S/S.