
ABSTRACT
The aim of this study was to evaluate the suitability of current sizing systems adopted by brands, for an athletic female population and try to identify areas of improvement in current sizing and grading methods used. This information can be used to engineer accurately fitting lower-body sports compression leggings for the target demographic. Size and shape data of sixty-three athletic females was collected using 3D body scanning. The data was compared to size charts of three commercially available sports compression leggings manufactured by different brands as well as Alvanon's UK sizing and grading standards. Results show that athletic females are not catered for by current products. 28 women (44.44%) fell between sizes for at least one measurement across the three brands. Participant's measurements indicate differing body shapes to the standard ‘hourglass’ shape presented by the Alvanon UK sizing standards, used by companies as a basis for their sizing systems.
Introduction
Sports compression garments
Sports compression garments (SCGs) are highly elastic and are worn by athletes to improve their performance as well as to prevent injuries and aid recovery (Kraemer et al., Citation1998; Pérez-Soriano et al., Citation2019). They are constructed so that the garment dimensions are smaller than those of the wearer’s body, enabling pressure to be applied to the skin and the underlying tissue (Brubacher, Apeagyei, Venkatraman, & Tyler, Citation2017; MacRae, Cotter, & Laing, Citation2011). This compression that is externally applied, is thought to narrow the veins, increasing blood flow (Pérez-Soriano et al., Citation2019). Therefore, larger quantities of oxygenated blood can be delivered to the muscles, preventing the accumulation of lactic acid, which can reduce fatigue and delayed onset muscle soreness (DOMS) during recovery (Troynikov et al., Citation2010). SCGs are also believed to aid muscle fibre alignment, which in turn decreases muscle oscillation and risk of injury (Allsop, Citation2012; Troynikov et al., Citation2010).
In order to achieve consistent pressure delivery and assist blood flow, accurate fit and graduated pressure through the compression garment is essential. Graduated compression refers to the pressure application that increases distally from the heart (Kim & Choi, Citation2023), so for lower-body compression, the highest pressures will be delivered to the ankle, and will decrease towards the crotch. The physiological effect of this pressure application method is recognised throughout literature (Kim & Choi, Citation2023). If the garment is loose or fabric folds and bunching becomes an issue, no pressure will be delivered to the body (Brubacher et al., Citation2017). Inversely, if the SCG is too tight, negative effects can be felt by the wearer (Mosti & Partsch, Citation2010) resulting in restricted circulation (Xiong & Tao, Citation2018) and pressure necrosis, affecting heart and lung function (Wang & Zhang, Citation2013). Despite this, very often, researchers looking into the effectiveness of these garments fail to analyse the fit and state the pressure magnitude of the garments being tested (Pérez-Soriano et al., Citation2019), leading to controversial conclusions. Unless the fit and pressure application is considered, conclusions regarding the garment’s effectiveness can’t be made, and results may be invalid.
3D Body scanning for SCG development
3D body scanning can quickly provide accurate body measurements (Gill, Citation2015) that can be used for clothing development. These measurements form the basis of sizing systems to allow consumers to make informed sizing decisions before purchase. They are used for ready-to-wear clothing, in order to satisfy as much of the target population as possible whilst keeping costs to a minimum (Cheng & Kuzmichev, Citation2019; Petrova, Citation2007). Current size charts are created by considering the key dimensions for the garment, the measurement ranges of the target population (Petrova, Citation2007), and adding ease allowances to the body dimensions (Beazley, Citation1999). The apparel industry is able to benefit from the use of 3D body scanning to evaluate the size and shape of their specific target markets, however the majority of pattern drafting is still based on manual anthropometric measurements (Gill, Citation2015). Brands identify a target market, which is often defined by age, gender and geographical location. However, sizing systems assume that the entire population defined by these characteristics have the same morphological traits (Gill, Citation2015). Even people with the same anthropometric measurements can have a different body shape, which will greatly affect how a garment fits.
There is little to no research into the sizing of sports compression garments (Brubacher, Citation2020), reinforced with a paucity in standards for sizing, grading or even the amount of pressure and its variation over the body to elicit ergogenic effects. Sizing methodologies for sports compression leggings are often based on traditional hosiery and trouser production methods, due to a lack of understanding in many key areas necessary to execute an accurately fitting and functioning product. Creating size charts for SCGs is complex due to additional considerations such as negative ease allowance and properties of the constituent fabric (Gill & Chadwick, Citation2009; Liu et al., Citation2017).
As compression garments are worn for improving performance and can cost a premium, in comparison to standard sportswear, brands target professional and amateur athletes and those who are serious about regular physical activity. The body dimensions of these women differ from the general population due to exercise-related changes in musculature (Gaurav, Singh, & Singh, Citation2010; Radu, Popovici, & Puni, Citation2015). Radu et al. (Citation2015) conducted a study which compared the anthropometrical status of athletes (volleyball and handball players) and non-athletes. Results demonstrated a significant difference between the chest, waist and hip circumference of the handball players and non-athletes and almost all measurements recorded were higher for the athletes compared with the non-athletes. Tsunawake et al. (Citation1995) have also noted that athletes have lower-body fat than non-athletes. A study by Nemeth, Park, and Mendle (Citation2020) found that lean and non-lean sporting participants had difficulties finding well fitted lower-body garments due to high musculature in that region of the body. Measurement data of the participants suggested that this be due to differences in body proportions between athletes and non-athletes. Despite this, it seems that brands have little consideration for athletic body types when creating their size charts. In order to create sizing systems for these products, you need to consider the anthropometric features of the wearer (Lee, Citation2014). One company that is trying to address the fit issues of athletes is Barbell Apparel, who have developed trousers that cater for the musculature around the buttocks and thigh areas (Nemeth et al., Citation2020). However, this focused specifically on non-sporting attire. This study aims to (1) assess whether the current approaches to sizing and grading of compression leggings are suitable for athletic women, and (2) identify differences between athletic bodies and the Alvanon standard dress forms.
Methodology
Data extraction
The study utilised an anonymised data set of 1000 body scans that have been collected at the University of Manchester over a period of 5 years. For this study, only an athletic female population was needed for analysis, therefore the body scans were sorted, and filtered by sex, age and physical activity, to define a relevant sub-data set. Since the study focuses on female participant, male participants were discarded first. The data set included information about the participants’ age and average hours of exercise performed per week. In order to identify an athletic population, it was decided that the subject must complete a minimum of five hours of exercise per week, any subjects exercising less than five hours a week were excluded from the dataset. A minimum of five hours per week was chosen as it is double that of the NHS guidelines for a regular adult (The NHS, Citation2021). Age was then considered, where anyone over 50 years of age were ruled out, due to natural changes in the body during the aging process (Gába & Přidalová, Citation2014; Kyle et al., Citation2006). Any subjects that had not declared the quantity of exercise performed too were removed. This left 63 subjects that were included in this study.
Participants
Participants in this study consisted of 63 females aged 19–49 (28.13±8.25) years, who complete between 5 and 15 (7.90±2.95) hours of exercise per week. The population included women from various ethnic backgrounds; ethnicity has an influence on body morphology (Makhanya, de Klerk, Adamski, & Mastamet-Mason, Citation2014); however, this is not focus of this study. Participants with a white ethnic background represented the majority of the population (71.43%).
Size chart selection
Size charts from three compression garment brands were selected (Skins, Australia; 2XU, Australia; Adidas, Germany), as they are among the leading brands in SCGs, and also provide a varied size offering to their consumers. Skins and 2XU specialise in SCGs, whereas Adidas is a far bigger sportswear brand that offers compression leggings, but does not claim true compression unlike the other two brands. They were chosen so that a comparison could be made between two compression brands as well as compression leggings from a non-specialist brand. The size charts were taken from the respective brands’ official websites (Adidas UK, Citationn.d.; Skins Compression, Citation2020; 2XU UK, Citationn.d.).
The Alvanon dress form standards for the UK were chosen as they are used by companies to develop their size charts. Whilst this is not focused on compression garments, the dimensions of the mannequins are based on an ‘hourglass’ body shape for an entire UK female population. A comparison of the Alvanon UK standard body shape and the athletic population is conducted in this study.
Measurement selection
The Size Stream SS14 body scanner (Size Stream, USA) captured approximately 100 body measurements of each subject. Not all the dimensions captured by the scanner were necessary for this study. The measurements chosen to analyse were those that corresponded to the measurements given by either one of the brand’s size charts, or by Alvanon in their women’s dress form standards for the UK (Alvanon, Citationn.d.). Five measurements were therefore chosen to compare: waist, hip and thigh circumferences, height and weight.
Analysis
Microsoft Excel was used to arrange the data and compare measurements from the scan data and the online size charts. IBM SPSS software 28.0.1.1 (IBM, UK) was then used for statistical analysis. A Kendall’s Tau-b correlation test was used to identify if there is a correlation between the height and weight measurements of the 55 participants who had both measurements recorded (8 of the 63 did not have a recorded weight). SPSS was used to plot the height and weight variables onto a scatter plot to see the correlation between the two variables and predict the outcomes of the Kendall’s Tau-b correlation. This test was also performed in the SPSS software, using a two-tailed approach.
The participants’ body measurements were compared with the corresponding key dimensions in each of the three size charts, to determine if they were catered for and how they would be categorised. The waist and hip circumference measurements of the Alvanon dress forms were compared with the corresponding measurements of the 2XU and Adidas size charts to identify whether the size charts are based around the ‘standard’ body shape, rather than athletic bodies.
To understand the differences between the Alvanon standard dress forms and the bodies that have been scanned, the individual whose waist circumference was the closest to each of the Alvanon dress forms was highlighted and then their hip and thigh circumferences were compared.
Results and discussion
Size chart comparison
The size chart given by Adidas offers seven size designations (2XS – 2XL), with 1 cm intervals between them, minimising the chance of consumers falling between sizes (). 2XU is similar to Adidas in that it offers six alphanumeric size designations (2XS – XL), all with 1 cm intervals between them (). They both use waist and hip circumferences as key dimensions. The measurement range for each size varies for Adidas, ranging from 3 to 9 cm for waist circumference and 3–7 cm for hip circumference, whereas for 2XU the range is 4 cm for all sizes and variables.
Table 1. Adidas and 2XU size chart comparison.
The waist and hip circumference measurements were compared with the athletic population data. For Adidas, 6 of the 63 participants (9.52%) did not fit into the waist measurements in the size chart, 5 (7.94%) of which also did not fit into the hip dimensions. These leaves six females unable to purchase this garment and approximately 90% of the study population whose measurements are covered by the size chart. However, of the 57 women with qualifying dimensions, there were a number who fell in-between sizes, despite the intervals being very small. This represented 14.04% (8) for the waist circumference and 12.28% (7) for the hip measurement, but only one participant fell in-between sizes for both measurements. Out of the 44 females who would be able to find a size for both variables, 47.73% (21) fall into a different size designation for each measurement. This leads to confusion regarding size selection and leaves only 23 females (36.51%) able to confidently find a size using the size chart provided.
Despite certain similarities between the two brands (Adidas and 2XU), Adidas managed to cater for a greater percentage of the population, with 19.05% (12) of the women unable to fit into the waist measurement range and 14.29% (9) for the hip measurement range of the 2XU size chart. 8 out of 63 (12.7%) participants were not able to select a size for either dimension. It was found that there was also a larger number of women who fell between two size designations. 29.41% (15) for the waist circumference and 19.61% (10) for the hip circumference, respectively. Approximately 6% (3) fell in-between sizes for both measurements, over three times the amount of Adidas. There are 27 women that were given a single size for both measurements, and of those, 74.04% (20) were given two different sizes, leaving just 11% (7) of the total study population able to accurately pick a size using the 2XU size chart. This is less than a third of whom Adidas can cater for.
The SKINS’ size chart is displayed differently to the other two brands. Instead of providing individual measurement ranges for the key variables in the size chart, the consumer must rely on using their height and weight measurements to locate a position on the chart, which then determines the size. The shaded areas in the chart correspond to a size designation and the gaps between the shaded areas are between sizes. Due to the measurement intervals being 5 cm, it is difficult to pinpoint the exact location of the measurements, unless the measurements are placed in the middle of a shaded area or identical to each interval. This size chart depends on having both measurements to locate the size whereas for the other brands, it is possible for the consumer to choose a size even based on one measurement if necessary. Using height and weight in this size chart is problematic. Dimensions used in a size chart should correlate with each other (Bradtmiller, Citation2013), however based on the results of Kendall’s Tau-b correlation test, there is little correlation (τb = 0.069) between the height and weight measurements of the 55 participants who have both measurements recorded (8 of the 63 did not have a recorded weight). Size designations in this size chart are more dependent on weight rather than height; the majority of the height range is covered in all five sizes, but the weight is the variable defining each size.
Size charts should provide a clear interface for the consumer to aid size selection (Ashdown, Citation2014), but due to the lack of clarity regarding grade boundaries, selecting the appropriate sizes was challenging. Even though the Skins size chart states that if you fall between sizes, to select the smaller size, it is still not often clear. The chart relies on consumer interpretation, which will differ between consumers. One size was also selected overall rather than separate sizes per measurement. The coverage was the best of all the size charts, with 95.24% coverage for height and 92.73% coverage for weight. No participant was excluded from both height and weight dimensions, but due to the choice of key dimensions and presentation of the size chart, it could be argued that confidently selecting an accurate fitting pair of compression leggings is not feasible. The 37.5% (15) of the females that fell between sizes were, as per Skins’ instructions, given the smaller size, which aids the consumer’s choice but may induce higher garment interface pressures than desired.
The waist, hip and thigh circumference measurements of the 48 participants who were allocated a size between XS-XL were extracted and a measurement range for both variables for each size identified (). Both the waist and hip variables display measurement ranges that increase with size, however the measurements for each size overlap considerably and ranges are large. For waist and hip circumferences, the overlap between sizes is as significant as 10.86 and 8.51 cm, respectively. The thigh circumference measurements were far less uniform with both the smallest and largest circumferences falling into the size S rather than the XS and XL, as expected. The measurement ranges are inconsistent overlap and so that some participants could find themselves fitting into all 5 size designations. Ranges between the grade boundaries of a single size category, were as considerable as 41.3 cm, which is often bigger than the offered measurement range for an entire size chart. The substantial dimensional ranges reinforce the notion that compression garment sizing based on height and weight is inaccurate when the garment pressure relies heavily on limb circumferences, according to Laplace’s Law. According to these ranges, pressure would vary significantly between females in each size, similar findings have been found in previous research (Hill, Howatson, van Someren, Davidson, & Pedlar, Citation2015; Jakeman, Byrne, & Eston, Citation2010).
Table 2. Waist, hip and thigh circumference distribution per size for Skins sizing.
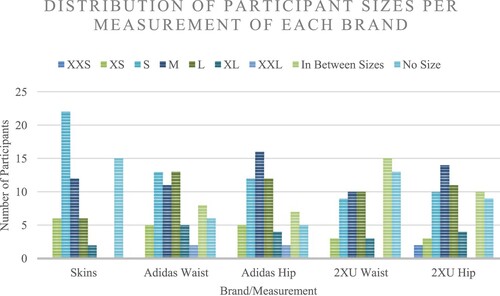
When comparing the three size charts of the commercial leggings, the sizing across different brands is very different. The sizes given to each participant were compared across waist and hip circumference measurements for both Adidas and 2XU and the overall size given by Skins (). shows the quantity of participants who fell into each of the seven size categories, as well as participants whose measurements were outside of the measurement ranges of the size chart and not given a size, and those who fell between sizes. 28 women (44.44%) fell between sizes for at least one measurement across the three brands, proving the need to minimise grade intervals, especially for SCGs where accurate fit is essential. shows the 2XU waist circumference had more women who could not choose a size or fell in-between sizes than were given a size. The graph demonstrates that the participants mostly fell into sizes S, M and L, as typically expected. Adidas was the only brand to offer size XXL and is therefore the only measurements to have participants in that category. XXS size was offered by both Adidas and 2XU, however only two participants were categorised in this size for 2XU’s hip measurement. 35% of the population were categorised as a size S in the Skins size chart, which was far more than for the other variables (Figure 1). Potentially, the reasons behind the large allocation of size S are (1) the fact that they offer less size categories than the other two, (2) eight participants fell in-between S-M sizes and therefore were categorised as a S, whereas other brands were left with 7–15 participants in-between sizes. (3) It is possible that changing the measurement ranges for athletic populations may allow more women to purchase the garments and create a more even population distribution between sizes, although an uneven distribution is common. Four participants were unable to match a size for any of the three brands, whilst only two females (3.17%) fell into the same size (small) category for all five sizes given across the different charts. The findings emphasise the inconsistency between brands, making size selection difficult for consumers and the lack of standardisation and knowledge of best practise. The lack of theoretical understanding is clear.
Figure 1. Comparison of the participants’ size distribution of each measurement across the 3 brands.
Comparison of athletic bodies and standard body forms
Alvanon’s UK Women’s size chart (), included six numeric sizes (8–18), typically used in ready-to-wear clothing. This Alvanon standard displays the measurements of their dress forms which would generally attract apparel companies developing their own size charts, rather than consumers. The dress forms are supposedly representative of a standard UK female body and the measurements would be used to drive product development. The Alvanon chart was used to evaluate whether these standard body dimensions are appropriate for lower-body compression garment development for athletic females. Of the 17 measurements used in the chart, three measurements were chosen to compare with the data. Waist, low-hip and thigh circumferences were chosen as they are lower-body measurements used in the sizing of compression leggings. The thigh circumference was chosen as limb circumferences have been highlighted in other research as dimensions that should be used in compression garment sizing (Brubacher, Citation2020).
Table 3. Alvanon size chart.
The Alvanon dress form fit sizes XS – XL for the Adidas leggings. The same size was given to both circumferences for all but one dress form. The size 12 fell in both the small and medium sizes. When compared to the 2XU size chart, the dress form measurements were consistently exactly the upper boundary of each size and variable. The dress form sizes 8–18 represent sizes 2XS – XL for the 2XU garments. Overall, the dress forms fit perfectly within the measurement ranges given by Adidas and 2XU, demonstrating the type of body (target consumer) the sizing system is based on. The drop values between the waist and hip circumferences are 26 cm for all Alvanon dress forms, assuming a constant relationship between these measurements across sizes. Examining the drop values for the 63 participants found an average drop value of 24.76 cm, which is fairly close to the forms, however the values showed huge variability through the population (range = 23.07 cm). This could lead to fit problems around the waist and hip areas. The standard ‘hourglass’ body shape is evidently used as the basis for the creation of the sports compression leggings, which explains the difficulties with placing the athletic bodies within the size charts.
The differences between the hip and thigh circumferences of the dress forms and corresponding scan were as big as 7.85 and 11.60 cm, respectively. Thigh circumferences differed consistently more across sizes. For the Alvanon sizes 8–12 the hip and thigh circumferences of the scan were larger than the dress form, however for sizes 14–18 the opposite was true. This comparison shows how the athletic bodies do not conform to the standard body shape of the dress form. Dimensions do not necessarily all increase at the same rate as size increases, as the dress forms suggest due to variations in morphology even in the athletic population.
Conclusion
This study assessed the sizing and grading methods of three brands’ compression leggings and evaluated whether these methods were appropriate for athletic females. The Alvanon UK standards, represented by the dress forms, were also compared to the size charts and to the body measurements of the participants. The outcome of this research aims to benefit the compression garment industry and aid future sizing and grading studies for lower-body SCGs. A large majority of the female population could not confidently be categorised into one size for the sports compression leggings, because they either were not catered for in the size chart at all, they fell in-between sizes, or they fit into different size categories depending on the variable in the size chart. Only two participants were able to consistently pick the same size across brands and measurements, highlighting the variability in sizing methodologies and a lack of understanding in the area of compression garment sizing. Variability is common across brands within the fashion industry, however for compression garments, target demographic, desired pressure application and therefore fit should be comparable. From this study it can be concluded that the sizing and grading used by brands do not cater for an athletic female body, but for an assumed standard hourglass shape (Alvanon Standards). It is clear from the comparison between the UK standards and the athletic scan data that there is a large disparity between the two body types, which have a great effect on how the compression leggings will fit and ultimately deliver pressure. SCGs are designed for those regularly participating in physical activity to benefit their performance and recovery, so particularly for those brands it is important to consider that their target demographic will have different body shapes and sizes to a regular population. Further research into categorising body characteristics of athletic females for use in compression garment sizing is necessary.
The main limitation of this study is not knowing the type of exercise performed by the participants. Although age boundaries were set to avoid as much ambiguity as possible, it is not certain what each individual considered to be ‘exercise’. Future research could scan a larger sample size of athletic females and ask specifically the type of exercise performed. Ideally to achieve optimum accuracy, sport-specific studies should be conducted to allow for variations in body shape and size between different disciplines.
Disclosure statement
No potential conflict of interest was reported by the author(s).
Additional information
Funding
References
- 2XU UK. (n.d.). Refresh recovery compression tights. [online] Retrieved 3 March, 2021, from https://uk.2xu.com/products/refresh-recovery-compression-tights-wa4420b-womens-black-nero?dwvar_WA4420b_color = BLACK_NERO&lang = en_GB#lang = en_GB&start = 1&sz = 24
- Adidas UK. (n.d.). Women's bottoms size guidance. [online]. Retrieved 5 March, 2021, from https://www.adidas.co.uk/help/size_charts/women-pants_shorts
- Allsop, C. A. (2012). An evaluation of base layer compression garments for sportswear.
- Alvanon. (n.d.). Alvanon standard UK women. [online] Retrieved 18 January, 2021. https://www.ALVANON.com/
- Ashdown, S. P. (2014). Creation of ready-made clothing: The development and future of sizing systems. In M.-E. Faust & S. Carrier (Eds.), Designing apparel for consumers (2nd ed. Vol. 10, pp. 17–34). Manchester, UK: Elsevier. doi:10.1533/9781782422150.1.17.
- Beazley, A. (1999). Size and fit: The development of size charts for clothing — part 3. Journal of Fashion Marketing and Management: An International Journal, 3(1), 66–84. doi:10.1108/eb022549
- Bradtmiller, B. (2013). Scan-to-Pattern clothing systems: A systematic approach. Proc. of the 4th International Conference on 3D Body Scanning Technologies, November, 379–383. doi:10.15221/13.379.
- Brubacher, K. (2020). Comparison and evaluation of sizing systems used in commercial women’s compression sportswear. Proceedings, 49(1), 140. doi:10.3390/proceedings2020049140
- Brubacher, K., Apeagyei, P., Venkatraman, P., & Tyler, D. (2017). Design of sports compression garments: Exploring the relationship between pressure distribution and body dimensions. 8th Asia-Pacific Congress on Sports Technology.
- Cheng, Z., & Kuzmichev, V. E. (2019). Research on the male lower torso for improving underwear design. Textile Research Journal, 89(9), 1623–1641. doi:10.1177/0040517518775925
- Gába, A., & Přidalová, M. (2014). Age-related changes in body composition in a sample of Czech women aged 18-89 years: A cross-sectional study. European Journal of Nutrition, 53(1), 167–176. doi:10.1007/s00394-013-0514-x
- Gaurav, V., Singh, M., & Singh, S. (2010). Anthropometric characteristics, somatotyping and body composition of volleyball and basketball players. Journal of Physical Education and Sports Management, 1(3), 28–32.
- Gill, S. (2015). A review of research and innovation in garment sizing, prototyping and fitting. Textile Progress, 47(1), 1–85. doi:10.1080/00405167.2015.1023512
- Gill, S., & Chadwick, N. (2009). Determination of ease allowances included in pattern construction methods. International Journal of Fashion Design, Technology and Education, 2(1), 23–31. doi:10.1080/17543260903018990
- Hill, J. A., Howatson, G., van Someren, K. A., Davidson, S., & Pedlar, C. R. (2015). The variation in pressures exerted by commercially available compression garments. Sports Engineering, 18(2), 115–121. doi:10.1007/s12283-015-0170-x
- Jakeman, J. R., Byrne, C., & Eston, R. G. (2010). Lower limb compression garment improves recovery from exercise-induced muscle damage in young, active females. European Journal of Applied Physiology, 109(6), 1137–1144. doi:10.1007/s00421-010-1464-0
- Kim, H. S., & Choi, H. E. (2023). Corresponding measurement-based patternmaking method for leggings using three-dimensional body scanning technology. Journal of Engineered Fibers and Fabrics, 18), doi:10.1177/15589250231163773
- Kraemer, W. J., Bush, J. A., Newton, R. U., Duncan, N. D., Volek, J. S., Denegar, C. R., … Sebastianelli, W. J. (1998). Influence of a compression garment on repetitive power output production before and after different types of muscle fatigue. Sports Medicine, Training and Rehabilitation, 8(2), 163–184. doi:10.1080/15438629809512525
- Kyle, U. G., Melzer, K., Pichard, C., Picard-Kossovsky, M., Kayser, B., & Gremion, G. (2006). Eight-Year longitudinal changes in body composition in healthy Swiss adults. Journal of the American College of Nutrition, 25(6), 493–501. doi:10.1080/07315724.2006.10719564
- Lee, Y. S. (2014). Developing apparel sizing systems for particular groups. In D. Gupta & N. Zakaria (Eds.), Anthropometry, apparel sizing and design (pp. 197–254). Elsevier Ltd. doi:10.1533/9780857096890.2.197.
- Liu, K., Zeng, X., Bruniaux, P., Wang, J., Kamalha, E., & Tao, X. (2017). Fit evaluation of virtual garment try-on by learning from digital pressure data. Knowledge-Based Systems, 133, 174–182. doi:10.1016/j.knosys.2017.07.007
- MacRae, B. A., Cotter, J. D., & Laing, R. M. (2011). Compression garments and exercise: Garment considerations, physiology and performance. Sports Medicine, 41(10), 815–843. doi:10.2165/11591420-000000000-00000
- Makhanya, B. P., de Klerk, H. M., Adamski, K., & Mastamet-Mason, A. (2014). Ethnicity, body shape differences and female consumers’ apparel fit problems. International Journal of Consumer Studies, 38(2), 183–191. doi:10.1111/ijcs.12079
- Mosti, G., & Partsch, H. (2010). Is low compression pressure able to improve venous pumping function in patients with venous insufficiency? Phlebology, 25(3), 145–150. doi:10.1258/phleb.2009.009023
- Nemeth, M. C., Park, H., & Mendle, J. (2020). Collegiate female athletes’ body image and clothing behaviors. Fashion and Textiles, 7(1), doi:10.1186/s40691-020-0207-z
- Pérez-Soriano, P., Sanchis-Sanchis, R., Jimenez-Perez, I., Gil-Calvo, M., Priego Quesada, J. I., & Aparicio, I. (2019). Compression garments in sport. In A. Subic (Ed.), Materials in sports equipment (2nd ed., pp. 487–520). Elsevier. doi:10.1016/B978-0-08-102582-6.00017-4.
- Petrova, A. (2007). Creating sizing systems. In S. Ashdown (Ed.), Sizing in clothing: A volume in woodhead publishing series in textiles (pp. 57–87). Elsevier Ltd. doi:10.1533/9781845692582.57.
- Radu, L.-E., Popovici, I.-M., & Puni, A.-R. (2015). Comparison of anthropometric characteristics between athletes and Non-athletes. Procedia - Social and Behavioral Sciences, 191, 495–499. doi:10.1016/j.sbspro.2015.04.368
- SKINS Compression. (2020). Size guide | SKINS compression. [online] Retrieved 10 November, 2020, from https://www.skinscompression.com/size-guide/
- The NHS. (2021). Physical activity guidelines for adults aged 19 to 64. The NHS. [online] Retrieved 4 June, 2022, from https://www.nhs.uk/live-well/exercise/exercise-guidelines/physical-activity-guidelines-for-adults-aged-19-to-64/
- Troynikov, O., Ashayeri, E., Burton, M., Subic, A., Alam, F., & Marteau, S. (2010). Factors influencing the effectiveness of compression garments used in sports. Procedia Engineering, 2(2), 2823–2829. doi:10.1016/j.proeng.2010.04.073
- Tsunawake, N., Tahara, Y., Yukawa, K., Katsuura, T., Harada, H., & Kikuchi, Y. (1995). Characteristics of body shape of female athletes based on factor analysis. Applied Human Science, 14(1), 55–61. doi:10.2114/ahs.14.55
- Wang, Y., & Zhang, P. (2013). The effect of physical-mechanical properties on dynamic pressure of compression garment. International Journal of Clothing Science and Technology, 25(2), 131–144. doi:10.1108/09556221311298637
- Xiong, Y., & Tao, X. (2018). Compression garments for medical therapy and sports. Polymers, 10(6), 1–20. doi:10.3390/polym10060663