
Abstract
Purpose: The Universal Declaration of Human Rights enshrines the rights to communication and education and measuring access to these rights for children with disabilities is fundamental. The UNICEF/Washington Group Child Functioning Module (CFM) is being promoted to measure progress against the Sustainable Development Goals for children with disabilities. This cross-sectional diagnostic accuracy study in Fiji compares parent and teacher CFM responses to the Intelligibility in Context Scale for 463 primary-aged students with and without speech difficulties.
Method: Receiver operating characteristic curves were constructed to analyse CFM accuracy and determine optimal cut-off points; inter-rater reliability between teachers and parents was calculated.
Result: Parent responses to the CFM speech questions achieved an area under the curve of 0.98, indicating “excellent” diagnostic accuracy. Teachers achieved 0.92 (“very good”). The Youden Index identified the optimal cut-off as “some difficulty”.
Conclusion: The CFM appears effective when used by parents or teachers for distinguishing between children with and without speech difficulties. While identified as the optimal cut-off statistically, the “some difficulty” category identifies too many children without speech difficulties to be simplistically applied to funding eligibility. The CFM should be used as a screening tool, followed by further assessment to confirm eligibility.
Introduction
The rights to communication and education, originally outlined in the Universal Declaration of Human Rights (United Nations, Citation1948), were reinforced in the Convention on the Rights of Persons with Disabilities (United Nations, Citation2006). The current global development framework, the Sustainable Development Goals, strongly supports these rights for children with disabilities and encourages all countries to prioritise spending to achieve the goals. The government of Fiji ratified the Convention on the Rights of Persons with Disabilities in March 2017 and is committed to inclusive and quality education. For children with speech difficulties, this includes providing learning support needs such as augmentative and alternative communication and access to communication specialists such as speech-language pathologists. However, providing resources requires means of estimation and accountability, for which accurate numbers are required. Methods to identify children with disabilities in schools in Fiji have been relatively ad hoc and standardised clinical assessments are seldom performed (Sprunt, Hoq, Sharma, & Marella, Citation2017).
This study was undertaken within an education sector strengthening program funded by the Australian government. An intention of the Fiji government and the program was to establish a means for disability-disaggregation of the government’s Education Management Information System, which collects and integrates information about education activities. The government recognised the need for a valid and reliable disability identification tool feasible for urban, rural and remote schools. The tool selected as a candidate for this purpose was the Child Functioning Module (CFM) as it is relatively short, can be administered without medical expertise, and enables categorisation by severity of functional difficulty.
Child Functioning Module
To improve international comparability of child disability statistics, UNICEF and the Washington Group on Disability Statistics developed the CFM (available from www.washingtongroup-disability.com). It was designed as an interviewer-administered tool for parents/caregivers for incorporating into population censuses and surveys (Crialesi, De Palma, & Battisti, Citation2016). There is consensus by United Nations agencies and disability peak bodies that the CFM be used to compare children with and without disabilities to disaggregate the Sustainable Development Goal indicators (UNDP et al., Citation2016).
The CFM was developed with the International Classification of Functioning, Disability and Health for Children and Youth (World Health Organization, Citation2007) as its conceptual framework and includes 24 questions covering 14 functioning domains, including communication. Items are scored on a Likert scale of severity: no difficulty, some difficulty, a lot of difficulty and cannot do at all, and children are considered at risk of disability if the proxy has responded “a lot of difficulty” or “cannot do at all” to any one item.
The CFM has undergone extensive cognitive testing (Massey, Chepp, Zablotsky, & Creamer, Citation2014; Mont, Alur, Loeb, & Miller, Citation2016) and field testing (Crialesi et al., Citation2016). Detailed domain-specific field tests are unpublished. Visser et al. (Citation2016) assessed diagnostic accuracy of the CFM in a population of 2–4 year olds in rural South Africa, using access to a care dependency grant as the proxy for the reference standard test as it is based on a medical assessment of disability. Sensitivity/specificity of the full CFM was 0.60/0.84. However, transferability of these findings is questionable as the study only had five children with disabilities. In the context of a population survey (Mactaggart, Cappa, Kuper, Loeb, & Polack, Citation2016; Mactaggart, Kuper, Murthy, Oye, & Polack, Citation2016), the 2014 draft CFM was tested in Cameroon and India against clinical tests for vision, hearing, musculoskeletal impairment and history of epilepsy. Findings for the full CFM highlighted a large proportion of people with disabilities were missed at the “a lot of difficulty” cut-off level. Authors recommended that people identified having “some difficulty” should receive subsequent clinical assessments to identify a higher proportion of people with disabilities. This study did not test the CFMs ability to identify children with speech difficulties.
Data used in Education Management Information Systems are completed by schools, so it is critical that the CFM performs acceptably when used by teacher respondents; this has not been tested previously. In order to ensure communication and education rights of children with speech difficulties are met, it is critical they are identified in data systems. This study aimed to test the validity of the CFM in identifying children with speech difficulties and reliability between teacher and parent responses.
Study objectives
This paper reports findings from within a broader study that examined the entire Child Functioning Module (Sprunt et al., Citation2017). Study objectives for this paper were:
To determine the diagnostic accuracy and optimal cut-off level of the CFM in identifying primary school children with speech difficulties in Fiji compared to a reference standard, the Intelligibility in Context Scale.
To determine the inter-rater reliability of the CFM between teachers and parents in Fiji for identifying primary school children with speech difficulties.
Method
Study design and sampling
Approvals were obtained from the University of Melbourne’s Human Research Ethics Committee and the Fiji Ministry of Education’s ethics committee and all subjects had written consent. This study required responding to two questionnaires (see Procedures); respondents were parents/caregivers and teachers of each child. This paper uses the CFM speech questions plus additional questionnaire items on learning support needs, assistive technology and hearing examination results.
A cross-sectional study was undertaken in Fiji from March–July 2015. Children were recruited from five mainstream schools and 10 special schools in Fiji covering the four administrative divisions. Sample size was estimated based on minimum number required to achieve sensitivity or specificity of 0.85 (Flahault, Cadilhac, & Thomas, Citation2005). A minimum of 52 children with speech difficulties (cases) and 52 children without speech difficulties (controls) were required. All children (5–15 years) in the special schools and all children in the mainstream schools previously identified by the school to have disabilities, plus selected controls with no disabilities matched by age, sex, ethnicity and location were invited to participate.
Participant demographics
The sample included 463 children with mean ± SD age of 10.2 ± 2.6 years (range: 5–15) in classes 1–8. Of these, 55.3% (n = 256) were male and 63.5% (n = 294) were from i-Taukei (Fijian) ethnic background (). Of the parents/caregivers, more than half were mothers (57.7%, n = 267), 22.5% (n = 104) fathers and 19.9% (n = 92) grandparents, aunties, uncles and guardians. Ninety-nine teachers participated.
Table I. Demographic characteristics of student participants (n = 463).
Procedure
Index test: Child Functioning Module
The index test was the Child Functioning Module (CFM, 5–17 years) draft current at February 2015, with permission from UNICEF and the Washington Group. The wording of the two questions on speaking are: (1) “When (child’s name) speaks, does he/she have difficulty being understood by people inside of this household?”, and (2) “When (child’s name) speaks, does he/she have difficulty being understood by people outside of this household?”. The questions aim to distinguish between people who are more familiar and less familiar to the child. For each question, the interviewer states: “Would you say (name) has: no difficulty, some difficulty, a lot of difficulty or cannot do at all?”
The CFM was translated from English to Fijian and Fiji-Hindi by two separate bilingual speakers for each language, back-translated, then pretested according to the guidelines of the Washington Group (UNESCAP, Citation2010) using cognitive interviews with 10 teachers and 10 parents of children with disability. On the teacher questionnaire, questions were adapted to: (1) “When (child’s name) speaks, does he/she have difficulty being understood by people inside of his/her main classroom?”, and (2) “When (child’s name) speaks, does he/she have difficulty being understood by people outside of his/her main classroom?”, which distinguishes between understanding by people more familiar and less familiar to the child.
Reference Standard Test: Intelligibility in Context Scale
The Intelligibility in Context Scale (ICS) (McLeod, Harrison, & McCormack, Citation2012), administered to parents, was the reference standard test. This comprises seven questions related to frequency with which different people understand the child, using a Likert scale from “always” to “never”. English, Fijian and Fiji-Hindi versions (available http://www.csu.edu.au/research/multilingual-speech/ics) were used.
The ICS was selected for several reasons: at time of data collection, there were no speech-language pathology services in Fiji and no speech assessment tools developed or validated in Fiji (Hopf, McLeod, & McDonagh, Citation2017). It can be administered by non-specialists. It can be used irrespective of language or number of languages spoken by the child (McLeod, Crowe, & Shahaeian, Citation2015; Washington, McDonald, McLeod, Crowe, & Devonish, Citation2017), which is important in Fiji where many people are multilingual (Hopf, McLeod, & McDonagh, Citation2018). It assesses intelligibility and comprehensibility, which are comparable constructs to CFM questions on difficulty being understood when speaking. The ICS had already been rigorously translated into Fijian and Fiji-Hindi and has been widely used both with children with speech sound disorders (McLeod et al., Citation2012; Ng, To, & McLeod, Citation2014) and with typically developing speech (McLeod et al., Citation2012; Ng et al., Citation2014; Phạm, McLeod, & Harrison, Citation2017). It has good internal consistency, sensitivity, and a significant difference in scores between children with and without speech sound disorders (McLeod et al., Citation2015). The Hopf, McLeod, and McDonagh (Citation2017) Fijian ICS validation study with 65 typically developing children aged 5–10 showed mean scores of 4.6 for main language and 4.4 for Fiji-English, which were not influenced by age, gender, school year, main language spoken or socioeconomic indicators.
The ICS has some limitations as a reference standard for this diagnostic accuracy study. It is usually used with 4–5 year olds. Correlation coefficients for criterion validity were weak to moderate (Evans, Citation1996) across a range of ICS studies (McLeod et al., Citation2015; McLeod et al., Citation2012; Neumann, Rietz, & Stenneken, Citation2016; Ng et al., Citation2014). In the only study reporting ICS sensitivity and specificity using receiver operating characteristic (ROC) curve analysis (Ng et al., Citation2014), diagnostic accuracy of the ICS was 0.69, which is below the ≥0.70 cut-off for the category labelled “fair” (Hsieh, Citation2012). That study included 72 Cantonese-speaking pre-school children (39 with and 33 without speech sound disorders) and the reference standard was the Hong Kong Cantonese Articulation Test. Implications of these limitations relate to the importance of diagnostic certainty of the ICS and presented some challenges in using the ICS to distinguish cases from controls.
Determination of cases and controls using the ICS
The ICS must convincingly distinguish cases from controls to enable measurement of sensitivity and specificity of the index test, the CFM. To achieve diagnostic certainty, the meaning of the ICS scores in the sample was interrogated by analysing five variables from the dataset. Four variables were from the parent and teacher questionnaires (learning support needs, assistance required with communication, levels of difficulty being understood and use of relevant assistive devices) and the fifth being presence of hearing impairment identified in audiometric assessment (>40dBA) (Sprunt et al., Citation2017). If children scored positively on one or more of these variables, they were coded as “potential speech sound disorder”. Of the 263 children coded “potential speech sound disorder”, 97.7% scored positively on more than one variable. The spread of “potential speech sound disorder” across the ICS scores was examined to identify an ICS cut-off score, which distinguished cases from controls.
The ICS cut-off for cases and controls was determined a posteriori and the data and method used to determine the cut-offs are presented together for clarity. series 1 shows the distribution of all student scores on the ICS (n = 463), where 5 indicates the highest and 1 the lowest score of intelligibility. series 2 shows the percentage of the 263 children with “potential speech sound disorder” across ICS scores. To illustrate, of the children with the lowest possible ICS score (1.0), 100% had a “potential speech sound disorder”, whereas of the children with the highest ICS score (5.0), only 2% had a “potential speech sound disorder”.
Figure 1. Series 1 shows the distribution of Intelligibility in Context Scale scores across the whole sample (n = 463). Series 2 shows the percentage of children with potential speech sound disorder (Group 1, Group 2, Group 3), distributed across Intelligibility in Context Scale scores (n = 263).
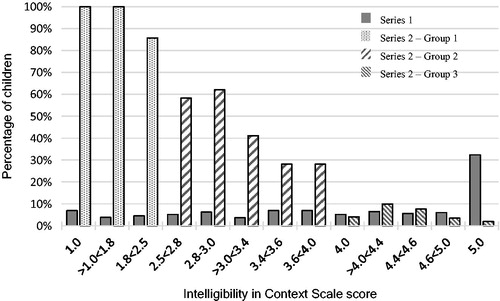
This distribution identified three distinct groupings: Group 1 (n = 71, 96% with potential speech sound disorder) scored <2.5; Group 2 (n = 134, 42.5% with potential speech sound disorder) scored 2.5 < 4.0; and Group 3 (n = 257, 3.1% with potential speech sound disorder) scored ≥4.0. As seen from the percentages in each group, Group 1 (cases) and Group 3 (controls) provide clear classification, but Group 2 is a mixture of children with and without potential speech sound disorder, who would require further assessment to avoid diagnostic uncertainty. Group 2 was excluded to reduce uncertainty in case/control allocation.
Implementation of index test and reference standard
Data were collected through assessment camps over two to five days at each school. The CFM and ICS were interviewer-administered with a parent/caregiver for each child, using the parents’ preferred language. The parent was requested to consider the ICS in relation to the child’s main language, similar to work by Hopf, McLeod, and McDonagh (Citation2017). Teachers self-administered the CFM during the camp or within a week. Teachers and parents were blinded to each other’s responses.
Analysis
Estimating and comparing measures of diagnostic accuracy
Using IBM SPSS Statistics 24, descriptive statistics were calculated for participant demographics and cross-tabulations used to explore distribution of CFM responses across cases and controls. Spearman’s Rho correlation coefficient was used to analyse the relationship between parent responses on being understood by people inside (more familiar) and outside (less familiar) the household, and similarly between teacher responses on being understood by people inside (more familiar) and outside (less familiar) the main classroom. It was also used to analyse the relationship between parent and teacher responses using a combined variable (recommended by the Washington Group), which took the highest level of difficulty reported for inside or outside. Correlation coefficients were classified as very high (0.90–1.00), high (0.70 < 0.90), moderate (0.50 < 0.70), low (0.30 < 0.50) and negligible (0.00 < 0.30) (Hinkle, Wiersma, & Jurs, Citation2003).
Sensitivity was calculated as proportion of children identified by the CFM (at different cut-offs) having difficulty being understood, out of the total number of “cases” (children with ICS score <2.5). Specificity was calculated as proportion of children identified by the CFM (at different cut-offs) not having difficulty being understood, out of the total number of “controls” (children with ICS score ≥4.0).
ROC curves were constructed separately for parent and teacher responses to determine the area under the curve, which is an overall figure of diagnostic accuracy combining sensitivity and specificity. Area under the curve interpretations were classified as excellent (0.96–1.0), very good (0.9 < 0.96), good (0.8 < 0.9), fair (0.7 < 0.8), poor (0.6 < 0.7), and useless (0.5 < 0.6) (Hsieh, Citation2012). ROC curves used dichotomous clinical variables, differentiated as case or control. The Youden Index, based on the optimal balance between sensitivity and specificity on the ROC curve, was calculated to determine cut-off points for each question and respondent type (parent/teacher). Sensitivity, specificity and likelihood ratios were calculated for each respondent type, for each of the two CFM questions (inside/outside) and for the combined variable. Likelihood ratios indicate how many times more (or less) likely a test result of a given level is obtained when the target condition is present than when it is absent. Likelihood ratios are independent of prevalence of the target condition (Spitalnic, Citation2004) and were therefore used instead of predictive values.
Result
Parent responses were available for 71 cases and 257 controls and teacher responses for 67 cases and 203 controls.
Correlations
There was “very high” correlation between the two questions on the parent version (n = 328; r = 0.91; p < .001) and a “high” correlation between the two questions on the teacher version (n = 270; r = 0.80; p < .001). Using the combined variable (inside and outside), parent responses showed a “high” correlation with teacher responses (n = 269; r = 0.73; p < .001).
Cross tabulation of the CFM results by the ICS results
presents the spread of CFM responses across the ICS scores. Parents reported the vast majority of controls as having “no difficulty” being understood by people inside the household (93.0%) and outside the household (89.1%) and more than 66% of the cases had “a lot of difficulty” (23.9% inside; 31.0% outside) or “cannot do at all” (42.3% inside; 43.7% outside). “Some difficulty” described over 25% of the cases and very few of the controls on the two questions.
Table II. Cross tabulation of Child Functioning Module (CFM) results by Intelligibility in Context Scale (ICS) results for Group 1 (cases, with speech difficulties) and Group 3 (controls, with typical speech).
Teachers reported cases as having lower levels of difficulty being understood by people inside and outside the main classroom than parents inside and outside the household (). This may be due to teachers in special schools in this study having sign language and augmentative and alternative communication skills. On the other hand, teachers ranked controls as having slightly more difficulty being understood than parents. Teachers described nearly a third of cases and close to 20% of controls as having “some difficulty”.
Diagnostic accuracy of the CFM
shows results of the ROC curve analysis. For parent responses, the area under the curve was ≥96% for all variables (inside, outside and combined variable), which means it is an “excellent” test in distinguishing between children, who score <2.5 and those who score ≥4.0 on the ICS, as a proxy for children with and without speech difficulties respectively. For each of these variables, the Youden Index showed “some difficulty” as the optimal cut-off. Higher cut-offs increase specificity but sensitivity is compromised considerably. The cut-offs “a lot of difficulty” and “cannot do at all” showed positive likelihood ratios (+LR) ranging from 64.2 to 116.3 indicating “large and conclusive” (OMERAD, Citation2008) results, however confidence intervals were very wide. Parent responses for “inside” show less convincing + LR, but still conclusive at 12.8 at the cut-off “some difficulty” with much narrower confidence intervals. The most conclusive –LRs are at the cut-off “some difficulty”.
Table III. Area under the curve, sensitivity, specificity, likelihood ratios and optimal cut-off points on the Child Functioning Module (CFM), parent vs. teacher responses.
For teacher responses, the area under the curve was lower than for parents, with 0.81 for inside, 0.92 for outside and 0.91 for the combined variable, signifying a “very good” test in distinguishing between children who score <2.5 and those who score ≥4.0 on the ICS, as a proxy for children with and without speech difficulties respectively. As with parent responses, the Youden Index showed “some difficulty” as the optimal cut-off for teacher responses. Again, higher cut-offs increase specificity, but sensitivity is appreciably compromised. +LRs only showed a “small increase in the likelihood” (OMERAD, Citation2008) of SD at the cut-off “some difficulty”, but show “large and conclusive” increases in the likelihood of SD at the cut-off “a lot of difficulty”. -LRs for teacher responses were more conclusive at the level of “some difficulty” but only when “outside the classroom” is utilised.
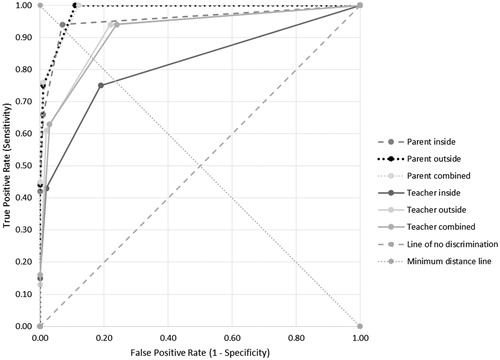
provides a visual representation of the ROC curve comparison. The combined parent variable performs similarly to the parent outside variable, offering the best diagnostic accuracy. The most accurate teacher question is “outside the main classroom”. The least accurate question is teacher responses to “inside the main classroom”. The sensitivity of the “outside” question is higher than the “inside” question for both parent and teacher responses, which is logical. UNICEF/Washington Group (Citation2015) note that children with speech difficulties may be able to communicate with household members attuned to their gestures or speech idiosyncrasies, but may face more significant difficulties with people less familiar to them. This means a child with moderate speech difficulty may not be identified by the “inside” question but is more likely to be identified by the “outside” question.
Figure 2. Receiver operating characteristic curves comparison of CFM questions on difficulty being understood.
Discussion and conclusion
The CFM was designed to be undertaken with parents/caregivers in censuses and surveys. This study evaluated whether the CFM could be used for a different purpose – by teachers to identify children with speech difficulties, for the purpose of disability disaggregation of Fiji’s Education Management Information System. The study investigated the accuracy of the CFM against a reference standard, the ICS.
Interpreting the diagnostic accuracy results requires consideration of the main study limitation – lack of certainty about whether children with ICS scores 2.5–3.86 should be regarded as a case or a control. This meant excluding 134 children with those scores, leaving 71 cases and 257 controls, resulting in analysis that is undoubtedly based on cases with higher levels of impairment. This increases the risk of “spectrum effect”, a sampling bias that can lead to higher estimates of sensitivity and specificity (Rutjes, Reitsma, Vandenbroucke, Glas, & Bossuyt, Citation2005). For future use of the ICS as a reference test in limited resource settings, a subsequent speech assessment for children scoring between 2.5–3.86 would enable including all participants thus mitigating “spectrum effect”, whilst avoiding the costs of conducting speech assessments with the entire sample.
Results showed the CFM has acceptable accuracy when used by either parents or teachers. For parent responses areas under the curve ranged from 0.96–0.98, indicating an “excellent test” for either the “inside” or “outside” questions or the combined variable, which takes the highest level of difficulty reported for either of these two questions. Whilst accuracy of teacher responses was lower than parents, the CFM still appears to be a “very good test” (area under the curve =0.92) when undertaken by teachers using the “outside the main classroom” question or the combined variable. The “inside the main classroom” question has a lower accuracy (area under the curve =0.81), which may imply redundancy of this question. Before assuming it is redundant, further work is needed to explore its use in informing learning support provision. The higher agreement amongst parent responses than teachers is consistent with findings in the Harrison, McLeod, McAllister, and McCormack (Citation2017) study comparing parent and teacher responses on the Parent Evaluation of Developmental Status to clinical diagnosis by a speech-language pathologist. Further study is recommended to understand factors influencing the differences between teacher and parent accuracy.
Initial findings from this study suggest the “outside” question may be more sensitive than the “inside” question at all cut-off levels. The implication for national surveys and censuses, for which the CFM is designed, is that it may be reasonable to only include the “outside” question if cost per question is an imperative. Research on larger datasets is recommended to investigate this issue.
The optimal cut-off to identify children with speech difficulties was “some difficulty” for both parent and teacher responses as determined by the Youden Index. Negative likelihood ratios also pointed to “some difficulty” as the optimal cut-off, however, the positive likelihood ratios challenged these findings, indicating a far higher likelihood of children having speech difficulties at the cut-off “a lot of difficulty”. However, as noted by Sonis (Citation1999), likelihood ratios at extreme values can be imprecise due to sparse data resulting in wide confidence intervals, which was a limitation of this study. A larger sample size or further analysis collapsing the categories “a lot of difficulty” and “cannot do at all” may enable narrower confidence intervals and less ambiguousness around the likelihood ratios.
Providing support to teachers in using the CFM and instigating further assessment and referral processes are important features of a disability disaggregation system. These are highlighted by two issues in this study: (1) the large size of the “inconclusive” group (n = 134); and (2) despite the optimal cut-off being statistically identified as “some difficulty”, this masks the reality that 22% of cases and 38% of controls were labelled “some difficulty” by teachers. That is, a policy that simply uses the cut-off “some difficulty” to identify children with speech difficulties is not satisfactory for determining funding allocations. To ensure that the rights and needs of all children with speech difficulties are met, and that resources are spent on children who meet eligibility standards, the MoE must continue to implement its recently developed system (Access to Quality Education Program, Citation2017) of further assessing relevant children identified through the student learning profile form. This form uses CFM as its basis and incorporates additional information on learning support needs. Research on effectiveness of this system is critical.
This study included participants with overlapping speech difficulties, hearing impairment and difficulties learning, the associations between which have been previously documented (Dittrich & Rona, Citation2008; McKean et al., Citation2017; McLeod & McKinnon, Citation2007). We did not attempt to test the accuracy of the CFM in identifying children with a diagnosable speech disorder, nor children with speech difficulties in the absence of concomitant conditions. Research comparing the CFM to full speech-language assessment results is recommended to establish which types of communication disorders are picked up through the CFM. As the Ministry of Education has instigated a policy with a conservative cut-off “some difficulty”, which prompts further assessment, the detection of broader communication disorders will be enabled. Acknowledging the lack of permanent speech-language pathology services in Fiji (Hopf & McLeod, Citation2015; Hopf, McLeod, McDonagh, Wang, & Rakanace, Citation2017), wherever possible children with speech difficulties should be supported by communication specialists.
Declaration of interest
No conflict of interest is reported.
Acknowledgements
Authors thank students, families and staff of the study schools, partner agencies Pacific Disability Forum and Pacific Islands Forum Secretariat, staff from Access to Quality Education Program and especially to Kitione Ravulo.
Additional information
Funding
Related Research Data
References
- Access to Quality Education Program. (2017). Fiji education management information system (FEMIS) disability disaggregation package: Guidelines and forms. Retrieved from http://www.education.gov.fj/images/FEMISdisabilitydisaggregation-packageFinal.pdf
- Crialesi, R., De Palma, E., & Battisti, A. (2016). Building a module on child functioning and disability. In B. Altman (Ed.), International measurement of disability: Purpose, method and application. The work of the Washington Group (pp. 151–166). Dordrecht, Germany: Springer. doi:10.1007/978-3-319-28498-9
- Dittrich, W.H., & Rona, T. (2008). Educating children with complex conditions: Understanding overlapping and co-existing developmental disorders. Los Angeles, CA: Sage.
- DeLong, E., DeLong, D., & Clarke-Pearson, D. (1988). Comparing the areas under two or more correlated receiver operating characteristic curves: A nonparametric approach. Biometrics, 44, 837–845. doi:10.2307/2531595
- Evans, J.D. (1996). Straightforward statistics for the behavioral sciences. Pacific Grove, CA: Brooks/Cole Pub.
- Flahault, A., Cadilhac, M., & Thomas, G. (2005). Sample size calculation should be performed for design accuracy in diagnostic test studies. Journal of Clinical Epidemiology, 58, 859–862. doi:10.1016/j.jclinepi.2004.12.009
- Harrison, L.J., McLeod, S., McAllister, L., & McCormack, J. (2017). Speech sound disorders in preschool children: Correspondence between clinical diagnosis and teacher and parent report. Australian Journal of Learning Difficulties, 22, 35–48. doi:10.1080/19404158.2017.1289964
- Hinkle, D.E., Wiersma, W., & Jurs, S.G. (2003). Applied statistics for the behavioral sciences (5th ed.). Boston, MA: Houghton Mifflin.
- Hopf, S.C., & McLeod, S. (2015). Services for people with communication disability in Fiji: Barriers and drivers of change. Rural and Remote Health, 15, 2863.
- Hopf, S.C., McLeod, S., & McDonagh, S.H. (2017). Validation of the Intelligibility in Context Scale for school students in Fiji. Clinical Linguistics and Phonetics, 31, 487–502. doi:10.1080/02699206.2016.1268208
- Hopf, S.C., McLeod, S., & McDonagh, S.H. (2018). Linguistic multi-competence of Fiji school students and their conversational partners. International Journal of Multilingualism, 15, 72–91. doi:10.1080/14790718.2016.1241256
- Hopf, S.C., McLeod, S., McDonagh, S.H., Wang, C., & Rakanace, E.N. (2017). Communication disability in Fiji: Community self-help and help-seeking support. International Journal of Speech-Language Pathology, Advance online publication. doi:10.1080/17549507.2017.1337226
- Hsieh, J. (2012). Receiver operating characteristic (ROC) curve. In S. Boslaugh (Ed.), Encyclopedia of epidemiology (pp. 896–898). Thousand Oaks, CA: Sage.
- Mactaggart, I., Cappa, C., Kuper, H., Loeb, M., & Polack, S. (2016). Field testing a draft version of the UNICEF/Washington Group module on child functioning and disability. ALTER: European Journal of Disability Research, Journal Europeen De Erche Sur Le Handicap, 10, 345–360. doi:10.1016/j.alter.2016.09.003
- Mactaggart, I., Kuper, H., Murthy, G.V.S., Oye, J., & Polack, S. (2016). Measuring disability in population based surveys: The interrelationship between clinical impairments and reported functional limitations in Cameroon and India. PLoS One, 11, 1–18. doi:10.1371/journal.pone.0164470
- Massey, M., Chepp, V., Zablotsky, B., & Creamer, L. (2014). Analysis of cognitive interview testing of child disability questions in five countries. Hyattsville, MD: National Center for Health Statistics. Retrieved from https://wwwn.cdc.gov/qbank/…/Massey_NCHS_2014_UNICEF_Child_Disability.pdf
- McKean, C., Reilly, S., Bavin, E.L., Bretherton, L., Cini, E., Conway, L., … Mensah, F. (2017). Language outcomes at 7 years: Early predictors and co-occurring difficulties. Pediatrics, 139, 1–10. doi:10.1542/peds.2016-1684
- McLeod, S., Crowe, K., & Shahaeian, A. (2015). Intelligibility in Context Scale: Normative and validation data for English-speaking preschoolers. Language, Speech, and Hearing Services in Schools, 46, 266–276. doi:10.1044/2015_LSHSS-14-0120
- McLeod, S., Harrison, L.J., & McCormack, J. (2012). The Intelligibility in Context Scale: Validity and reliability of a subjective rating measure. Journal of Speech, Language, and Hearing Research, 55, 648–656. doi:10.1044/1092-4388(2011/10-0130)
- McLeod, S., & McKinnon, D.H. (2007). The prevalence of communication disorders compared with other learning needs in 14,500 primary and secondary school students. International Journal of Language and Communication Disorders, 42, 37–59. doi:10.1080/13682820601173262
- Mont, D., Alur, S., Loeb, M., & Miller, K. (2016). Cognitive analysis of survey questions for identifying out-of-school children with disabilities in India. In B. Altman (Ed.), International measurement of disability: Purpose, method and application. The work of the Washington Group (pp. 167–181). Dordrecht, Germany: Springer. doi:10.1007/978-3-319-28498-9
- Neumann, S., Rietz, C., & Stenneken, P. (2016). The German Intelligibility in Context Scale (ICS-G): Reliability and validity evidence. International Journal of Language and Communication Disorders, 52, 585–594. doi:10.1111/1460-6984.12303
- Ng, K., To, C., & McLeod, S. (2014). Validation of the Intelligibility in Context Scale as a screening tool for preschoolers in Hong Kong. Clinical Linguistics and Phonetics, 28, 316–328. doi:10.3109/02699206.2013.865789
- OMERAD. (2008). Evidence-Based Medicine Course - Diagnosis: Likelihood Ratios. Office of Medical Education Research and Development. Retrieved from http://omerad.msu.edu/ebm/index.html
- Phȧm, B., McLeod, S., & Harrison, L.J. (2017). Validation and norming of the Intelligibility in Context Scale in Northern Vietnam. Clinical Linguistics and Phonetics, 31, 665–681. doi:10.1080/02699206.2017.1306110
- Rutjes, A., Reitsma, J., Vandenbroucke, J., Glas, A., & Bossuyt, P. (2005). Case-control and two-gate designs in diagnostic accuracy studies. Clinical Chemistry, 51, 1335–1341. doi:10.1373/clinchem.2005.048595
- Sonis, J. (1999). How to use and interpret interval likelihood ratios. Family Medicine, 31, 437.
- Spitalnic, S. (2004). Test properties 2: Likelihood ratios, Bayes’ formula, and receiver operating characteristic curves. Hospital Physician, 40, 53–58.
- Sprunt, B., Hoq, M., Sharma, U., & Marella, M. (2017). Validating the UNICEF/Washington Group Child Functioning Module for Fijian schools to identify seeing, hearing and walking difficulties. Disability and Rehabilitation, Advance online publication. doi:10.1080/09638288.2017.1378929
- UNDP, ILO, UNICEF, WHO, OHCHR, UNFPA, … IDDC. (2016). Disability data disaggregation joint statement by the disability sector. Retrieved from http://www.washingtongroup-disability.com/wp-content/uploads/2016/01/Joint-statement-on-disaggregation-of-data-by-disability-Final.pdf
- UNESCAP. (2010). Guidelines for cognitive and pilot testing of questions for use in surveys. Bangkok, Thailand: UNESCAP. Retrieved from http://www.unescap.org/sites/default/files/Disability-question-testing-guidelines.pdf
- UNICEF & Washington Group. (2015). Survey module on child functioning and disability – interview guidelines. New York: UNICEF & Washington Group. Unpublished document.
- United Nations. (2006). Convention on the rights of persons with disabilities and optional protocol. New York, NY: United Nations. Retrieved from https://www.un.org/development/desa/disabilities/convention-on-the-rights-of-persons-with-disabilities.html
- United Nations. (1948). Universal declaration of human rights. Geneva, Switzerland: United Nations. Retrieved from http://www.un.org/en/universal-declaration-human-rights/
- Visser, M., Nel, M., Bronkhorst, C., Brown, L., Ezendam, Z., Mackenzie, K., … Venter, M. (2016). Childhood disability population-based surveillance: Assessment of the Ages and Stages Questionnaire Third Edition and Washington Group on Disability Statistics/UNICEF module on child functioning in a rural setting in South Africa. African Journal of Disability, 5, e1–e9. doi:10.4102/ajod.v5i1.265
- Washington, K.N., McDonald, M.M., McLeod, S., Crowe, K., & Devonish, H. (2017). Validation of the Intelligibility in Context Scale for Jamaican Creole-speaking preschoolers. American Journal of Speech-Language Pathology, 26, 750–761. doi:10.1044/2016_AJSLP-15-0103
- World Health Organization. (2007). International classification of functioning, disability and health, children and youth version ICF-CY. Retrieved from http://apps.who.int/iris/bitstream/10665/43737/1/9789241547321_eng.pdf