
Abstract
Comparative studies on plant species have not distinguished between two inherently different applications of the idea of a trade-off. In the first case, the theoretical trade-off between two variables leads to a trend line, about which there is a degree of scatter. Any two species in the study are expected, in theory, to show a true trade-off, i.e. feature A must decrease for feature B to increase. This I call the ‘trend line’ type of plot. In the second case, the species are expected to fill a considerable part of the space defined by two axes and the theoretical trade-off leads to a boundary line which limits the extent of the cloud of points. In this case, many interspecific comparisons are not expected to show evidence of a trade-off, but those on the boundary line are expected to do so. This I call the ‘boundary line’ type of plot. In both types of plot, species within a given clade may show a true trade-off, while large numbers of unrelated species do not.
First, I undertake to show, by means of examples, the reality of the distinction made above, and to demonstrate that statistically significant and ecologically important negative correlations between features A and B in the ‘trend line’ type of plot can be accompanied by huge variation from the trend line. Second, for plots of the ‘boundary line’ type, I undertake to show that authors have not always tested sufficiently rigorously the constraint lines concerning combinations of supposedly incompatible tolerances, and have not allowed for the absence of certain combinations of unfavourable conditions in the field and consequent lack of selection pressure for the evolution of species with a combination of extreme tolerances.
I review two examples of each kind of constrained evolution. First, I take the worldwide leaf economics spectrum and the negative correlation between growth rate in high light and survival rate in deep shade. Second, I review the supposed incompatibilities between shade tolerance and drought tolerance, and between waterlogging tolerance and drought tolerance.
I conclude that the term ‘trade-off’ is used too loosely. The common lack of true trade-offs has made possible the species richness of present-day vegetation. Also, small numbers of species have evolved combinations of tolerances that might seem improbable. Not enough research is being aimed at understanding the mechanistic basis of variation about trend lines, and the crossing of supposed boundary lines.
Introduction
Studies on trade-offs in plants have been made at the level of the individual, population and species. My concern in this review is wholly with comparisons of species. Penetrating reviews of the problems encountered in studying trade-offs at the level of the individual and population have been provided by Stearns (Citation1989), who used almost entirely animal examples, and by De Jong and Klinkhamer (Citation2005), who wrote about plants.
Stearns (Citation1989) and De Jong and Klinkhamer (Citation2005) took for granted the meaning of ‘trade-off’. But for my review, it is imperative to have an explicit definition. I propose that we accept the definition currently given by Wiktionary: “Any situation in which the quality of one thing must be decreased for another to be increased”. This definition is brief and unequivocal, and clearly compatible with that given in the Oxford English Dictionary (Simpson and Weiner Citation1989): “a balance achieved between two desirable but incompatible features; a sacrifice made in one area to obtain benefits in another”. The key feature that I believe to be important in the Wiktionary definition is that “the quality of one thing must be decreased for another to be increased”. It is not sufficient for there to be a statistically significant chance that the quality of one thing will be decreased for another to be increased.
This tight definition of what I shall call a ‘true trade-off’ is clearly not the one taken for granted in many published comparisons of plant species. The term ‘trade-off’ is commonly used where a statistically significant negative relationship is found between the values for two variables A and B, and within the data set, there are many cases where species 1 has a greater value for variable A than species 2, but does not have a lower value for variable B. The statistically significant trend provides evidence of one or more ‘constraints’, but the frequent difference in variable A, without a difference in variable B, shows that it has been possible for many species to avoid the expected trade-off.
It is important to realise that two quite different kinds of graphical plot involve trade-offs. The ‘trend line’ type is exemplified where all individual plants belonging to numerous species have a given amount of plant dry mass to be used in a certain way, and it can be divided into larger or smaller units. Take for example seed production, and suppose that the species vary in their mean seed mass. A plot of mean seed mass on seed number is expected to yield a trend line with some degree of scatter as in . A true trade-off involves sliding along the trend line.
Figure 1. Two kinds of relationship between variables which have been investigated in respect of constraints affecting plants: (a) any constraint(s) apply on both sides of the trend line relating two aspects of plant performance, and the existence of a true trade-off is shown in any given interspecific comparison by complementary significant differences in properties A and B, and (b) any constraint(s) apply only on the side of the trend line towards higher values as any combination of lower values is feasible for plants in general, and the existence of a constraint for plants in general is shown by a sharply defined boundary to the cloud of points.
The ‘boundary line’ type of graphical plot can be illustrated by one involving indices of two kinds of tolerance, say tolerances for high temperatures and low temperatures. It might be supposed that plants with all combinations of low to moderate values for the two indices will be found to exist, but that plants able to tolerate both very high and very low temperatures have not been able to evolve. If that were true, and we made a plot of one tolerance on the other, we would see a cloud of points with a constraint line forming the upper right boundary and an empty area at the top right corner, as in . Any true trade-off that applies to vascular plants in general would be represented by sliding along the boundary line.
The simplest kind of study leading to a plot of the trend line type is that where the sum of the value for property A and that for property B is the same for all species, e.g. a plot of proportion of plant dry mass allocated to shoot against proportion allocated to root. This case where a true trade-off is bound to be found in every interspecific comparison does not help us with the problem of formulating a critical approach to the vast majority of plots of the trend line type made in the literature. In these there is bound to be scatter about the regression line for two reasons. First, where a collection of species shows a significant negative correlation between two properties, any two species may be enabled to avoid a true trade-off because they differ not only in properties A and B, but also in property C or properties C and D, or C, D and E, etc. As Garland (Citation2014) wrote, “nature has more ‘degrees of freedom’ than assumed by simple conceptualizations that predict trade-offs”. Second, any two species may appear not to show a true trade-off because of errors of determining the true mean values for properties A and B.
Ideally, every investigation of trade-offs of the trend line type should cope with this issue by considering in turn all possible pairs in the study, and use the errors of the estimated mean values for properties A and B to determine whether or not the species ‘differ significantly’ (say, P < 0.05) in both respects. Thus, an ideal investigation will find first whether or not there is a statistically significant negative correlation between the values for properties A and B, and second, what proportion of all species pairs show a true trade-off, i.e. complementary significant differences in properties A and B. It is the incidence of true trade-offs which will be the measure of biological significance, i.e. the evolutionary impact of the relevant constraint. Then attention should be given to understanding the ways in which true trade-offs are not found in 100% of the species pairs. Unfortunately, almost none of the published investigations of possible trade-offs in interspecific comparisons provide errors about the mean values for the properties studied.
In the case of graphical plots of the boundary line type, the first objective is to identify the slope and intercepts of the boundary line that appears to apply to vascular plants generally. There is bound to be some fuzziness about the constraint line for the same reasons as there is spread about the trend line type of plot: differences between species in properties C, D, E etc., and errors of measurement of mean values. It is probably best to use quantile regression, seeking the 95% quantile line. It will often be interesting to compare the intercepts on the two axes to find what proportion of the greatest known tolerance is indicated by the intercept. Is it quite different, for example, on the shade tolerance and drought tolerance axes?
Two subtypes may be recognised among plots of the boundary line type; those with a considerable proportion of species having values close to 0 for one or both of the variables studied (as in ), and those with few species or none having values close to 0 for one or both of the variables. In the latter case, the points may occupy either a band or a wedge-shaped area rather than the triangular area seen in . In order to determine whether the points occupy a band or a wedge-shaped area, it will be necessary to determine whether the 95% and 5% quantiles are significantly different in slope.
A significantly steeper slope for the 95% quantile than for the 5% was found by Grubb et al. (Citation2005) for a plot of log mean seed dry mass on log normal maximum height of plants in tropical lowland rainforest in north-eastern Australia (upper slope, 2.05 ± 0.25 [1 SE]; lower slope, 0.97 ± 0.50). The rationale was simple; for tall tree species it is feasible to have seeds of a huge range of sizes, but for low-growing herbs only small to very small seeds are feasible.
The boundary line and triangular distribution of points below it, seen in , based on the best performances of n species, should not be confused with the similar-looking plot obtained when the performances of the individuals of one species in a given community are plotted against density (number per unit area), as in the study of Goldberg (Citation1987) on herbaceous plants in an old-field community in North America. In the latter case, the performances of many individuals fell below the boundary line because they suffered some extra detrimental factor (their genetic make-up or some biological or physical hazard).
A result paralleling that of Goldberg (Citation1987) can be found where species rather than individuals are the object of interest. An example is where the rate of loss of leaf area to invertebrate herbivores is plotted against leaf fracture toughness; there is evidence that toughness can set an upper limit to loss rate of leaf area, but that many species lose area more slowly than forecast by their toughness so that the points representing them lie well below the boundary line (Grubb et al. Citation2008). The simplest explanations are that the population sizes of the invertebrate herbivores involved are held down by predation and/or parasitism or physical hazards, or that the leaves have significant chemical deterrents in addition to their toughness.
Returning to plots of the trend line type, it will be informative to consider the incidence of true trade-offs not only within the total collection of species in a given plant community or landscape area but also within relatively tightly defined clades (genera, tribes and smaller families). We may expect a higher incidence within clades because the species are less likely to differ appreciably in properties C, D, E, etc., as well as in properties A and B.
In plots of the boundary line type true trade-offs (defined as for pairs of species in plots of the trend line type) are most likely to be found among species near to the overall boundary line. However, it is of course possible that true trade-offs will be found among species in particular clades ‘lost’ in the mass of points below the boundary line that appears to limit plants generally in terms of what can evolve.
I do not attempt a comprehensive review of studies on proposed trade-offs and constraints. Instead, I consider in some detail two examples involving relationships of the trend line type, and two involving the boundary line type. In the first two cases, my emphasis is on thinking about the mechanistic basis and ecological significance of the scatter about the trend lines. In the second two cases, my major concern is with how to test a proposed fundamental constraint, and how species escape the constraint, but I also have to examine critically the theory behind the supposed incompatibilities of certain tolerances. In the ‘Discussion’ I consider briefly other contexts in which true trade-offs are not found, and propose directions for future research.
Example 1. The worldwide leaf economics spectrum
The highly cited paper of Wright et al. (Citation2004a), which introduced the concept of the worldwide leaf economics spectrum, used data from many hundreds of species to test the relationships among six key variables: the maximum measured net assimilation rate per unit leaf dry mass (Amass), dark respiration rate (Rmass), foliar nitrogen concentration (Nmass) and P concentration (Pmass), leaf dry mass per unit fresh area (LMA) and leaf life span (LL). The paper is of exceptional value, because it not only shows unequivocally worldwide trends but also the enormous scatter about the trend lines. As the authors point out, all of the interrelationships and the existence of great variation had been established in previous papers. However, the new data compilation by them was much larger and therefore the trends were more convincing and the variation more striking. All the interrelationships between the six variables were linear, as for the three variables shown in , and none of them was isometric. For example, a 10-fold decrease in LMA coincided with 21-fold increase in Amass, and a 10-fold increase in LMA coincided with a 30-fold increase in LL. I suspect that most ecologists had not previously thought about these anisometries and their implications.
Figure 2. The three-way relationships among three of the six variables used by Wright et al. (Citation2004a) to define the ‘worldwide leaf economics spectrum’, based on data for 706 species; the direction of the data cloud in three-dimensional space is shown in the shadows projected on the wall and floor of the space. Reprinted by permission from Macmillan Publishers Ltd [Nature] copyright 2004.
![Figure 2. The three-way relationships among three of the six variables used by Wright et al. (Citation2004a) to define the ‘worldwide leaf economics spectrum’, based on data for 706 species; the direction of the data cloud in three-dimensional space is shown in the shadows projected on the wall and floor of the space. Reprinted by permission from Macmillan Publishers Ltd [Nature] copyright 2004.](/cms/asset/880cb409-4a3e-47d3-a02b-87be9060648a/tped_a_1048761_f0002_b.gif)
I cannot agree with the authors’ statement “We find that these economic traits covary tightly across all species” (p. 823). That might be the impression given by the log-log plots, but there are endless examples of species comparisons where no true trade-off is present. For example, Amass can vary by an order of magnitude among species with an LMA of 100 g m−2, and LMA can vary by an order of magnitude among species with an Nmass of 1%. In an early paper, Reich (Citation1993, p. 724), wrote concerning the interrelations among Amass, Nmass, LMA and LL, “Several authors have argued that these inter-relationships arise from and are a requirement of simple trade-offs between attributes that maximise either productivity or persistence….” That was written long before the huge data set had become available. The new hypothesis proposed by Shipley et al. (Citation2006) to explain the worldwide leaf economics spectrum is still rooted in the idea of ‘simple trade-offs’. I cannot see that we can continue with the idea of ‘simple trade-offs’ in this context.
I also disagree with the assertion of Wright, Reich, Westoby et al. (Citation2004a, p. 826) “it seems that a mixture of physiological causation and the demands of competitiveness constrain species data points within tightly bounded domains of trait space”. All of the clouds of points, like the one in , have ragged edges which are all the more significant because the plots are on log scales. This second disagreement is in essence an extension of the first.
In another paper, the lead authors of Wright et al. (Citation2004a) have emphasised that in some smaller sets of data even certain basic expectations are not met, e.g. there may be a very weak relationship between Amass and Nmass, while there is a tight relationship between Amass and LMA, as in taken from the study of Wright et al. (Citation2004b). The authors provide a valuable and explicit analysis of the relationship between Nmass and LMA in samples of different sizes, and emphasise the need for caution about generalising from small data sets, which was first highlighted by Reich (Citation1993). incidentally shows clearly how the relationships among frequently studied variables can be much tighter within clades.
Figure 3. The Amass–Nmass–SLA relationships for Australian species of Eucalyptus (filled circles), Acacia (triangles) and Hakea (open circles), all axes log-scaled; SLA (specific leaf area) is the inverse of LMA used in (from Wright et al. Citation2004b). Originally published as Figure 3 in Functional Plant Biology 31(5): 556–558, doi:10.1071/FP03212 (I J Wright et al.) Copyright CSIRO 2004. http://www.publish.csiro.au/nid/102/paper/FP03212.htm. Reproduced with permission.
Wright et al. (Citation2005) have provided a valuable analysis of what they call ‘heterogeneity’ in their very large data set, but I am dealing specifically with the scatter about the trend lines revealed by Wright et al. (Citation2004a). Some of this scatter can be understood. Here, I deal only with the relationships shown in , i.e. LMA vs. Nmass, Amass vs. Nmass and LL vs. LMA. My concerns are with (1) the nature of the apparent adaptive value of deviations from the trend line, and (2) their magnitude. I confine myself to plants with C3 photosynthesis, and provide examples rather than an exhaustive review.
Variation about the LMA vs. Nmass trend line
It is helpful to consider first variation in LMA at constant Nmass, and then variation in Nmass at constant LMA. LMA can vary at a given Nmass as a result of the leaf being thicker or thinner while being composed of essentially the same kinds of tissues, and having the same chemistry of the cell walls and protoplasts, while the thickness of the cell walls in each of the various tissues is essentially constant. Such variation is commonly seen in intraspecific comparisons of leaves. For example, within the crown of the tree Fagus crenata, Iio et al. (Citation2005) found that the best-lit leaves had an LMA three times greater than that of the most shaded, while there was no significant difference in Nmass. Niinemets et al. (Citation2014) emphasise that that kind of uncoupling of LMA and Nmass is typical of plants with longer-lived leaves, and contrasts with the pattern found in tall, fast-growing herbaceous plants such as Solidago altissima studied by Werger and Hirose (Citation1988), where the LMA in the leaves receiving greatest irradiance during development is only about 20% higher than of the leaves receiving the least irradiance, but the Nmass is about twice as great. Whichever of these types of intraspecific uncoupling is involved, it is clearly important to keep it in mind when making interspecific comparisons.
A clear example of variation in LMA at a given Nmass in interspecific comparisons was worked out by Reich et al. (Citation1999) when studying plants in shrub-dominated semi-desert in southern North America, and by Wright et al. (Citation2001), and Wright et al. (Citation2002) in work in dry woodland in south-eastern Australia. The leaves of drier-climate species have higher LMA at a given Nmass than the leaves of wetter-climate species. The higher LMA results chiefly from the presence of more layers of photosynthetic cells. The Amass at a given Nmass is relatively low, but the leaves have higher rates of net assimilation per unit area than those of species of higher-rainfall areas because the LMA effect overwhelms the effect of lower Amass. The whole-epidermis conductance for water is notably low, but the leaf-to-air water deficit is so much greater at the dry-climate sites that the water use efficiency is, in practice, about the same for the drier-climate species in their natural habitat and the wetter-climate species in theirs.
The four major variables that can affect Nmass at a given LMA are listed in . Presence of non-photosynthetic tissues in addition to the epidermides and vascular tissues, thicker cell walls and silicification of cell walls will all lead to deviation from the trend line towards lower Nmass at a given LMA, while higher concentrations of N in the cell walls and/or protoplasts will lead to a higher Nmass at a given LMA.
Table 1. The variables which may affect Nmass at a given LMA.
The six types of extra non-photosynthetic cells which may ‘dilute’ the Nmass at a given LMA are listed in . The nature of the adaptive value of the first four types is generally agreed, but that of types 5 and 6 is uncertain (Appendix 1).
Possession of thicker walls is best considered separately for epidermal cells and mesophyll cells. The outer walls of the upper and lower epidermides are generally thicker in long-lived leaves, providing a generalised defence against physical and biological hazards (Grubb Citation1986). The walls of the mesophyll cells also vary greatly in thickness – from 0.07 to 0.5 µm in most of the species studied, and the resistance to diffusion of CO2 increases at a declining rate over that range (Terashima et al. Citation2011). Thicknesses up to 2.5 µm were found in some high-elevation shrubs in New Guinea (Körner et al. Citation1983), and it is notable that in Japan, the mesophyll walls of the perennial herb Polygonum cuspidatum grown at an elevation of 2500 m were found to be appreciably thicker than those of plants grown near sea level: 0.35–0.42 vs. 0.22–0.29 µm (Kogami et al. Citation2001). The wall thickness tends to be greater in spongy mesophyll cells than in palisade cells (Hanba et al. Citation2001). There is experimental evidence that mesophyll wall thickness is stable despite large differences in lamina thickness among individuals of a species grown at high and low irradiances (Hanba et al. Citation2002). Terashima et al. (Citation2006) felt able to generalise by reporting mesophyll wall thicknesses of (in rough figures) 0.1–0.2 µm for annuals, 0.2–0.3 µm for deciduous broad-leaved trees (also true for perennial herbs like Polygonum cuspidatum) and 0.3–0.5 µm for evergreen broad-leaved trees. Tosens et al. (Citation2012), working with northern hemisphere species, found thicknesses of 0.11–0.16 µm for five herb species, 0.17–0.23 µm for four deciduous trees and 0.40–0.54 µm for five evergreens. Working with species of south-eastern Australia, Tomás et al. (Citation2013) found thicknesses of 0.25–0.37 µm for five evergreen trees and shrubs of rainforest, and 0.26–0.42 µm for sclerophylls of pyrophytic vegetation on nutrient-poor soils.
There was no generalising rationalisation of wall thickness before the work of the group at Tohoku University summarised by Hikosaka (Citation2004). That work is considered in detail below when the allocation of foliar N to different fractions is reviewed. In essence, it is proposed that thicker mesophyll walls have a protective function parallel to that of the epidermal walls.
It is hard to estimate the magnitude of deviations from the worldwide trend line for LMA vs. Nmass arising from the ‘dilutions’ of Nmass discussed so far, but it seems likely to be substantial when a third to a half of the leaf thickness is taken up by non-mesophyll cells. Hoof et al. (Citation2008) found that in structure, the laminae of the leaves of hairy and glabrous varieties of Metrosideros polymorpha were very similar, but the LMA of the hairy variety was 1.63 of that of the glabrous variety.
In a few families, the N concentration in the cell walls is lowered by the deposition of silica, and in the few species with the highest concentrations (ca. 40% of the wall dry mass), the ‘dilution’ effect is likely to cause a sizeable deviation from the LMA vs. Nmass trend line (Appendix 1).
Using the data in an early review by Lamport (Citation1965), Cassab (Citation1998) gave a range of 4–22 mg g−1 dry mass for the N concentration in primary cell walls of various cell types. Studies on the concentration of N in cell walls of leaves have yielded values of 2.2 mg g−1 for the annual Arabidopsis thaliana (Zablackis et al. Citation1995, based on protein = 6.25 × N), and 5–6 mg g−1 for the perennial herb Polygonum cuspidatum (Onoda et al. Citation2004). If we accept the range given by Cassab, and cell walls account for 30–50% lamina dry mass as found by Merino et al. (Citation1984) for evergreen and deciduous leaves of Mediterranean-climate vegetation, the N in walls can account for 1.3–11 mg g−1 of the 10–30 mg g−1 Nmass values found for most leaves, i.e. about 4–37%. Reported values for the percentage of total leaf N in cell walls cover only the lower part of this range: 6–13% (Takashima et al. Citation2004), 1–11% (Feng et al. Citation2009) and 4–11% (Funk et al. Citation2013). There can be real problems in obtaining complete extractions of wall proteins, especially in leaves rich in phenolics (Funk et al. Citation2013). As emphasised by Takashima et al. (Citation2004), even the variation in allocation between (say) 6% and 13% has a big impact when the increase in allocation to walls is balanced mostly by a reduction in that to ribulose bisphosphate carboxylase (RuBPCase). We badly need to know how far the N concentration in the walls varies, and whether or not there are ecological correlates of higher and lower concentrations.
In the protoplasts, the N-containing compounds not involved in photosynthesis may be of value in deterring herbivores or in increasing resistance to drought and/or salt-rich soils by lowering the osmotic potential of the cytoplasm (making it numerically larger) and by protecting the membranes and soluble enzymes. Examples of the concentrations of the three major groups of deterrent N-containing compounds in leaves are given in Table S1. In most cases, values of 1–3 mg g−1 leaf dry mass are recorded for the N involved, i.e. about 10% of the total N concentration found in most leaves. The same is true for most of the recorded concentrations of N-containing compatible solutes in plants tolerant of drought and/or salinity, exemplified in Table S2, but the range in Triglochin is an order of magnitude higher. There is very little information on the proportion of leaf N in ‘dehydrin’ (DHN) proteins, but it may be of the order of 1% or less (see Appendix 1).
To sum up, there is a great array of ways in which variation about the LMA on Nmass trend line can arise, and much more research is needed on which are the ones responsible for the greatest variation. Tentatively, we can conclude that accumulation of N-containing protective compounds in the protoplasts, greater N concentrations in the cell walls and variation in mesophyll cell wall thickness seem likely to account for less variation in LMA at a given Nmass than variation in the thickness of the mesophyll and variation in the proportion of the lamina thickness occupied by non-mesophyll tissue.
Variation about the Amass vs.Nmass trend line
All of the variables considered above as affecting Nmass at a given LMA have the potential to affect the Amass a given Nmass: development of non-photosynthetic tissues, thickness and N concentration of cell walls, and presence of N-containing compounds in the cytoplasm or vacuole playing no direct part in photosynthesis. Variation in LMA at a given Nmass, arising from variation in lamina thickness at a given Nmass, is also relevant.
The four remaining variables accounting for deviation from the Amass vs. Nmass trend line are (1) the allocation of N in the mesophyll to RuBPCase, (2) the specific activity of the RuBPCase, (3) the resistances to diffusion of CO2 (or HCO3−) through mesophyll cell walls, plasmalemma, cytosol and chloroplast, and (4) the maximum conductance for CO2 through the stomata.
Evans (Citation1989) showed that (1) the very large differences between species in the rate of assimilation per unit area at a given N amount per unit area could be explained in part by differences in the allocation of N to RuBPCase, and (2) species that live habitually in deep shade allocate a higher proportion of N to thylakoids and, in particular, to chlorophyll. Evans (Citation1989) also brought together the then recent studies on the specific activity of RuBPCase extracted from pairs of species under standardised conditions; those experiments had shown how the specific activity could be 1.2–1.9 times greater in one species than another. These findings have been borne out in subsequent work, and provide a basis for expecting (1) appreciable variation in Amass at a given Nmass in species in one functional group, e.g. light-demanding perennial herb exemplified by spinach (Spinacia oleracea) and soya bean (Glycine max), and (2) generally lower Amass at a given Nmass in species that live their whole lives in moderate to deep shade.
More recent studies aimed at discovering the mechanistic basis for the differences between species in Amass at a given Nmass have concentrated on comparisons between species with leaves of different longevity. Work by the Terashima group has led to the emergence of a consistent pattern involving chiefly the allocation of N. Based on a comparison of two deciduous species and two evergreen species of Quercus, all native to Japan, Takashima et al. (Citation2004) put forward the idea that the difference in instantaneous photosynthetic N-use efficiency (PNUE) between the longer and shorter-lived leaves could be explained chiefly by the greater allocation of N to cell wall protein. This was seen to be a necessary concomitant of having greater protection in longer-lived leaves provided by thicker cell walls in the mesophyll as well as in the epidermides. The two evergreen species had twice as high an allocation of N to cell walls as the deciduous species, and the absolute amount of N in the cell walls of the evergreens was on a leaf area basis, similar to that in RuBPCase. This general idea was supported in a comparison of early-season germinators of the herb Polygonum cuspidatum with longer-lived leaves and later-season germinators with shorter-lived leaves (Onoda et al. Citation2004). The idea that instantaneous PNUE is lower in longer-lived leaves because a higher proportion of the N is allocated to defence goes back to the mid-1980s (Grubb Citation1984; Field and Mooney Citation1986), but I, for one, envisaged the increased protection against physical and biological hazards as involving proteins and other N-containing compounds in the protoplasts, not the cell walls.
The variation in thickness of mesophyll cell walls reviewed above must play a large part in explaining inter-specific differences in the mesophyll diffusion resistance simply because CO2 diffuses 10,000 times more slowly in water than air, but in the last decade, a substantial body of research has concentrated on other variables in the total resistance. Flexas et al. (Citation2012) provided a full review of the then available evidence on the impacts of differences between plants in carbonic anhydrase activity, aquaporins facilitating movement of CO2 through membranes, and the length of the diffusion path of CO2 or HCO3− within the cytosol and chloroplast, dependent on the positioning, size and shape of the chloroplasts. Much more work needs to be done before the importance of these variables can be placed in an ecological context.
Schulze et al. (Citation1994) showed that at a global scale, there is a strong correlation between the maximum stomatal conductance of a leaf and foliar Nmass, but there is a good deal of scatter about the trend line. In their plot for species in a very wide range of vegetation types, one standard error encompassed a range from ca. 4.5 to ca. 7.5 m s−1 for leaves with Nmass 20 mg g−1. This scatter will be reflected in appreciable scatter about the Amass/Nmass trend line.
There is a strong correlation between Amass and the conductance of the leaf tissues for liquid water up to the photosynthesising cells of the mesophyll (Brodribb et al. Citation2005; Sack and Holbrook Citation2006). The conductance is determined partly by the radius of the largest conducting elements in the xylem of the veins (Aasamaa et al. Citation2001), partly on the vein length per unit area (VLA; Sack et al. Citation2013) and partly by the length of the path between the end of a vein and the point where water evaporates – a function of VLA, leaf thickness and cell shape (Brodribb et al. Citation2007). There is scatter in all these relationships; it is especially marked in the plot of Amass on VLA (Sack et al. Citation2013).
Summing up, it remains to be seen how far species with a given Nmass and closely similar LMA and LL differ in Amass as a result of differences in the concentration of protein in the cell walls, and consequent differences in N allocation to that fraction. Likewise, the differences, perhaps adaptive, between species in the specific activity of RuBPCase have yet to be explored for any considerable number of wild species. In general, differences in allocation of N within the mesophyll protoplasts to RuBPCase, differences in allocation of N in the whole leaf to cell walls and differences in the thickness of the mesophyll cell walls (and perhaps differences in stomatal conductance at a given Nmass) seem likely to explain more of the variation about the Amass on Nmass trend line than allocation to N-compounds of value in deterring herbivores or resisting drought or salinity. It is too early to speculate on the magnitude of any variation about the trend line based on differences in carbonic anhydrase, aquaporins or the position and shape of chloroplasts.
Variation about the LL vs. LMA trend line
The best worked-up example of deviation from the overall trend line is that of the dry-climate plants studied in North America by Reich et al. (Citation1999) and in Australia by Wright et al. (Citation2002). The dry-site plants have lower LL at a given LMA. Wright and Westoby (Citation2002) showed that in Australia the plants of lower-rainfall woodland had a lower work to shear (J m−1) than the plants at a higher-rainfall woodland site, driven by a 50% lower toughness in the strict sense (J m−2). At a given lifespan, they are less protected physically, almost certainly because of a lesser degree of development of fibres. The greater risk of incurring herbivore damage can be seen as a by-product of the ‘tactic’ of piling the leaf high in N, and attaining a water use efficiency (after rain) as good as that found for plants in the higher-rainfall woodland.
A possible case of lower LL at a given LMA being directly adaptive is found in a little-known type of evergreen forest that was once widespread in south-western China: the subtropical montane semi-moist forest (SMSF) of Wu (Citation1987). It experiences winter drought, thus contrasting with the floristically related warm temperate rainforest of Japan (which has no dry season) and the sclerophyll forest of the Mediterranean Basin (which experiences summer drought). In the two latter forest types, leaf fall is concentrated in the spring so that the leaves of most tree species last for 2 or 3 years, but the leaves on a majority of common species in remnants of SMSF have been found to drop before they are 2 years old (Grubb et al. Citation2014). If that loss occurs in the previous autumn, which is the time when Rhododendron species from the SMSF area were found by the same authors to lose most of their leaves when in cultivation in Scotland, we have a possible rationale since the plants may be shedding their leaves before they cease to carry out appreciable net assimilation and before they become at risk of desiccation, which may inhibit resorption of the nutrients (cf. Minoletti and Boerner Citation1994). Observations on the timing of leaf fall in the SMSF in China are needed, together with determinations of LMA values. Grubb et al. (Citation2014) make the point that autumnal loss of the oldest leaves has been recorded for an appreciable number of evergreen species which endure reduced availability of water in winter because of low soil temperatures.
As yet, little is known about the pattern of correlates with variation in LL at a given LMA, but the two cases reviewed may turn out to be but two of many so far unappreciated.
Overall summary for example 1
We should be grateful to Wright et al. (Citation2004a) for establishing, beyond reasonable doubt, the generality of the various trends among Amass, Nmass, LMA, LL and related variables, for the determination of particular values for the anisometries and for the exposure of huge variation in the combinations of values within the clouds of points. There is no doubt about the strength of the negative trends shown in , but we need to know the incidence of true trade-offs as I have defined them, and which of the many variables considered above are the ones responsible for most of the massive scatter about the trend lines. Only then shall we truly understand the ‘leaf economics spectrum’.
Example 2. Tolerance of shade and ability to benefit from high light
There are at least three reasons for expecting a negative relationship between growth rate in high light and survival rate in deep shade (). I consider first the evidence for plants of northern temperate deciduous forest, and then the evidence for plants of tropical lowland rainforest.
Table 2. Reasons why a trade-off might be expected between the growth rate in high irradiance and survival rate in deep shade, based on the work of various authors, mostly summarised by Bloor and Grubb (Citation2003).
A test for a trade-off among common tree species in the forests of eastern North America was made by Kobe et al. (Citation1995). Their measure of growth rate in high light was rate of increase in height, and their measure of survival rate in deep shade was derived from a model of survival as a function of the rate of stem diameter increment of saplings in a wide range of irradiances; the latter relationship differed greatly among species. Even when the authors plotted the two variables on linear rather than logarithmic scales, the values fitted closely to the expectation of a trade-off (). For example, the species with a low-light survival function of ca. 0.2–0.3 differ by a factor of only 1.3 in their high-light height growth rates (ca. 26 vs. 20 cm year−1). This potentially ‘true trade-off’ was a key part of the SORTIE model of forests dynamics proposed by Pacala et al. (Citation1996), which explained the long-term persistence of nine species.
Figure 4. The negative relationship between rate of height growth in high light and rate of survival in shade for nine species of tree in a North American temperate deciduous forest; the x-axis is ‘calculated from the slope of the growth function at zero light and the decay parameter (B) of a simplified mortality predictor’ (from Kobe et al. Citation1995). Used by permission.
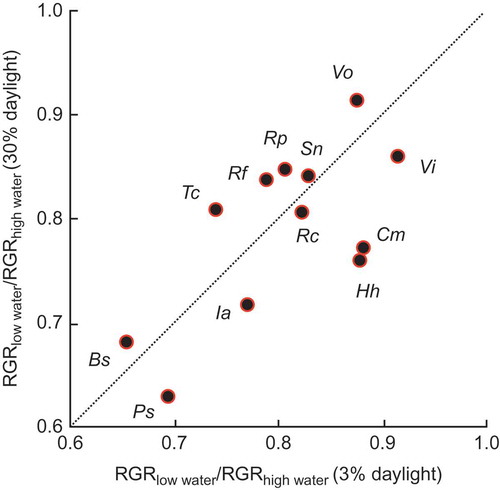
Such a potentially ‘true trade-off’ has not been found in all relevant studies on trees and shrubs of northern temperate deciduous forests. In an experimental study of the growth and survival rates of nine shrub species, all widespread in northern and central Europe, a significant negative relationship was found between the responsiveness of a species to higher irradiance and its survival rate in deep shade (Grubb et al. Citation1996). The measure of responsiveness used was the quotient of increase in dry mass in 4 months in 63% daylight over the increase in 1.6%, and the results were plotted on a log-normal basis (). Despite the statistical significance of the negative relationship, the absolute degree of responsiveness varied by a little over an order of magnitude to a little under an order of magnitude at a given survival rate in deep shade. Compare Rhamnus catharticus with Viburnum lantana, and Rosa canina with Crataegus monogyna in .
Figure 5. The negative relationship between the responsiveness to greater irradiance (the log of the quotient of increase in dry mass in 4 months in 63% daylight [ΔM63] over the increase in 1.6% daylight [Δ1.6]) and survival rate in shade (combined data for 0.3% and 1.6% daylight) (from Grubb et al. Citation1996). Reproduced with permission of Wiley. Cm, Crataegus monogyna; Cs, Cornus sanguinea; Ee, Euonymus europaeus; Jc, Juniperus communis; Lv, Ligustrum vulgare; Rhc, Rhamnus catharticus; Rc, Rosa canina; Vl, Viburnum lantana; Vo, Viburnum opulus.
![Figure 5. The negative relationship between the responsiveness to greater irradiance (the log of the quotient of increase in dry mass in 4 months in 63% daylight [ΔM63] over the increase in 1.6% daylight [Δ1.6]) and survival rate in shade (combined data for 0.3% and 1.6% daylight) (from Grubb et al. Citation1996). Reproduced with permission of Wiley. Cm, Crataegus monogyna; Cs, Cornus sanguinea; Ee, Euonymus europaeus; Jc, Juniperus communis; Lv, Ligustrum vulgare; Rhc, Rhamnus catharticus; Rc, Rosa canina; Vl, Viburnum lantana; Vo, Viburnum opulus.](/cms/asset/b34cc712-4228-44d3-a988-8154eda00751/tped_a_1048761_f0005_b.gif)
The uncoupling of the response to increased irradiance in a canopy gap and the rate of survival in a given degree of deep shade could contribute to the maintenance of species richness in a forest where different sequences of shade and opening-up occur at the scale of the individual seedling and sapling. For example, species 1 may be suffering the same rate of mortality as species 2 in deep shade, but benefit much more when a gap of a certain size is created; species 2 will have a greater chance of persistence if no gap is created and species 1 is unable to outgrow it. Conversely, species 3 that is suffering a somewhat greater rate of mortality than species 4 in deep shade may increase in growth rate to the same extent as species 4 when a gap of a given size is created; species 4 will have a greater chance of persistence if the gap is not created and species 3 gradually dies out locally. Only long-term experiments or field studies could show how far inter-specific differences of this type actually contribute to maintenance of species richness.
The mechanistic basis for the variation in survival rate in shade at a given level of responsiveness to greater irradiance has been little investigated, apart from the classic study by Walters and Field (Citation1987) on tropical plants showing how one species can reduce its respiration rate more than another and consequently persist in understorey shade while the other cannot. The mechanistic basis of variation in responsiveness to greater irradiance at a given survival rate in shade may well involve variation in the flexibility of the respiration rate, but variation in flexibility of (1) allocation to plant parts, and (2) plant form, especially LMA, seems likely to be important as well.
In the relatively species-poor temperate deciduous and mixed conifer-broad-leaved deciduous forests of Europe and North America, there is a paucity of extremely shade-tolerant species (grade 5 of Ellenberg Citation1988, p. 50) and a fairly even distribution of species in his shade tolerance classes 4 to 1 (decreasingly tolerant). The numbers in the classes from 5 to 1 are 2, 12, 10, 5 and 7. There is certainly room for argument about his assignments of species, and the shortcomings of a system which fails to reflect important changes in tolerance during the life of a tree (Grubb Citation1996), but most experienced ecologists would accept the overall picture painted by Ellenberg. Insofar as the approximate shade tolerance of a species can be guessed from the genus, the distribution of species among shade tolerance classes is likely to be fairly even in the most species-rich temperate deciduous forests, such as those found in China and described by Wang (Citation1961). Therefore, in the most species-rich temperate forests, the kind of trade-off found by Kobe et al. (Citation1995) seems likely to play a significant part in the persistence of the whole range of tree species.
To sum up, there are sound reasons to expect a trade-off between the degree of shade tolerance and the ability to benefit from increased irradiance. For temperate deciduous forests there is both observational and experimental evidence that the two variables are negatively correlated. However, there can be wide deviations from the trend line, and new work is needed to determine the relative importance of the flexibility in rates of physiological processes and that in allocation of resources and in form.
The situation in tropical lowland rainforests is different. There is a huge preponderance of species that can persist and grow upward for decades in deep shade, even if most benefit from some degree of canopy opening before they reach their mature height. The preponderance of species with very high rates of survival (90–100%) in deep shade is illustrated in .
Figure 6. The negative relationship between the rate of height growth in gaps and survival rate in deep shade for 112 species in tropical lowland moist forest on Barro Colorado Island, Panama; note lack of negative correlation for species with 90–95% or 95–100% survival in deep shade (from Hubbell and Foster Citation1992). Used by permission.
A negative relationship between growth rate in single-treefall gaps and survival rate in the understorey is bound to play some part in maintaining the coexistence of shade-tolerators and species that are gap-demanding at the establishment stage (Hubbell and Foster Citation1992; Kitajima Citation1994; Kobe Citation1999; Davies Citation2001), and will work alongside the negative relationship between growth rate in high light and growth rate in low light reviewed by Sack and Grubb (Citation2001, Citation2003) but questioned by Kitajima and Bolker (Citation2003). On the other hand, there is no evidence in of a negative relationship between high-light growth rate and low-light survival rate among the strongly shade-tolerant species. There is no question of a trade-off among those with 90–95% or 95–100% survival. Because there are many variables that affect rates of survival and growth in the field, it is important to measure the rates under controlled conditions in a garden experiment as well as in the field. Working with first-year seedlings of 15 Australian lowland rainforest species that are initially highly shade-tolerant, Bloor and Grubb (Citation2003) found no significant relationship between relative growth rate (RGR) in 10% daylight and survival rate in 0.2% daylight ().
Figure 7. The lack of a correlation between RGR of dry mass measured over a year in 10% daylight (empty circles) or in 0.8% daylight (filled circles) and survival in 0.2% daylight for 15 species of initially highly shade-tolerant tree species of tropical lowland rainforest in north-eastern Queensland (from Bloor and Grubb Citation2003). Reproduced with permission of Wiley.
Another kind of variation in response to increased irradiance was recognised by Kohyama (Citation1987). He argued that among species with a given survival rate in deep shade, some are better suited to a canopy gap formed in the near future and others to one formed in the distant future, and named these ‘optimists’ and ‘pessimists’, respectively. At a given above-ground mass, the former have relatively taller and narrower crowns, while the latter have relatively shorter and wider crowns. This dichotomy was illustrated first for warm temperate (Kohyama Citation1987) and then for tropical lowland rainforests (Kohyama and Hotta Citation1990). The idea has not yet been taken up in studies on temperate deciduous forests.
Overall summary for example 2
There is evidence that a tight negative correlation between growth rate in high light and survival rate in deep shade can be found for tree species in at least some temperate deciduous forests, and that a looser relationship of the same type can found among the very large numbers of species covering the whole spectrum of shade tolerances in tropical rainforests. However, for some woody plants of temperate deciduous forests, responsiveness to greater irradiance is only weakly negatively correlated with survival in very low irradiance. Moreover, among the most shade-tolerant trees in tropical rainforests, which make up the bulk of the species, there is no sign of a negative relationship. As to the variation about the trend line, there is still much to be learnt about the mechanisms behind it, especially those controlling the flexibility of the relevant physiological processes. The significance (if any) of the variation about the trend line for the maintenance of species richness needs to be investigated critically. The identification of ‘optimist’ and ‘pessimist’ species among the shade-tolerants has yet to be pursued in most forests.
Example 3. Tolerance of shade and tolerance of drought
Smith and Huston (Citation1989) proposed a fundamental constraint on the evolution of species tolerant of both shade and drought, but it was based on false premises. They argued that since shaded plants of a given species develop thinner leaves than those grown in the open, and invest less in roots, plants in general are inherently unable to tolerate both shade and drought. Their starting point should have involved comparisons of shade-tolerant and light-demanding species. In tropical lowland rainforests, the LMA and root mass fraction (RMF, proportion of total dry mass allocated to roots) are certainly not, as a rule, lower in shade-tolerant species. Care is needed in making interspecific comparisons of LMA and RMF, because these variables often change markedly in individuals of a given species as they grow from newly established seedlings to juveniles, say 1 m tall, and because it is often found within one functional group that LMA is higher in species with a greater mean lamina area (Grubb Citation1998a; Niklas et al. Citation2007).
In a single tropical rainforest, there can be great variation in LMA among shade-tolerant dicot species when growing in the undergrowth, e.g. Grubb et al. (Citation2008) reported values of 3.2–11.1 mg cm−2 for an Australian forest (n = 41), 2.9–8.9 mg cm−2 for a Ugandan forest (n = 18), and 2.4–6.3 mg cm−2 for a Costa Rican forest (n = 17). Despite this degree of variation, and some overlap in values between shade-tolerants and gap-demanders, studies at the seedling stage have shown the former to have higher LMA on average; Kitajima (Citation1994) used Panamanian species, and Osunkoya et al. (Citation1994) Australian species. The greater LMA is expected because the leaves of shade-tolerators are longer-lived, often much longer-lived (Coley Citation1983; Reich et al. Citation2004), have greater punch strength (Coley Citation1983) and greater fracture toughness (Dominy et al. Citation2008; Kitajima and Poorter Citation2010; Westbrook et al. Citation2011; Kitajima et al. Citation2012).
Few studies have been made on RMF of saplings (Becker and Castillo Citation1990; Becker et al. Citation1999), and therefore we are bound to compare shade-tolerant and light-demanding species at the seedling stage. Kitajima (Citation1994) and Osunkoya et al. (Citation1994) showed that despite some overlap in values, the shade-tolerants have higher RMF values on average. If the evolution of species able to tolerate water shortage in evergreen forests subject to annual drought periods has been limited by biomechanical or physiological constraints, then those constraints must be different from the ones proposed by Smith and Huston (Citation1989).
The position is different in northern temperate deciduous forests. Here, the starting point for the theory of Smith and Huston (Citation1989) is again falsified, but that is because there is much overlap in RMF and LMA between shade-tolerant and light-demanding species rather than because the shade-tolerant species have clearly higher values on average. For example, among three studies on seedlings of common tree species of eastern North America, one found RMF and LMA to be lower in the shade-tolerant species (Loach Citation1970), one found they were higher (Walters and Reich Citation1996) and one found no clear trend (Latham Citation1992). Again, any constraint(s) on the evolution of the double tolerance must be different from those posited by Smith and Huston (Citation1989).
Three possibilities are considered here. First, there is the issue of leaves being shed during drought or dying and being retained on the shoot. In northern temperate deciduous forests, many woody species display one or other of these behaviours. During strong droughts in England in 1973, 1975–76 (the strongest in about 250 years), 1989 and 1990, I made observations on shrubs and trees in woods on clay-dominated soils near Cambridge in south-east England (Appendix 2). Out of 21 species, only three (each in a different genus) underwent no visual effect of leaf drying, and only five (in four genera) underwent a degree of wilting (ranging from slight to marked) and recovered turgidity after rain fell. Four species (in four genera) dropped all or almost all their leaves, five species (in three genera) lost a smaller proportion, and on four species the leaves dried out and died on the stem. Thus, 13/21 species responded to drought by either dropping leaves or allowing them to desiccate on the shoot. It would seem improbable that responding in either of these ways to annual severe drought during the growing season, i.e. sacrificing a large amount of dry mass and nutrient capital, would be compatible with tolerance of deep shade.
There is supporting evidence for this view from the behaviours of trees and shrubs in the Type 5a forest of Tracey (Citation1982) in northern Queensland, which has a marginal rainfall for rainforest (ca. 1400 mm year−1) and 4 ‘dry months’ sensu Walter and Lieth (Citation1960–1967), i.e. 4 months when the mean rainfall, expressed in mm, is less than twice the mean temperature expressed in degrees Celsius. In ‘normal’ years, some shrub species in the understorey wilt markedly, but few or no tall trees lose their leaves. In the Wongabel State Forest (17° 19ʹ 50″ S, 145° 30ʹ 15″ E), the mean instantaneous diffuse site factor sensu Anderson (Citation1964) at ca. 1 m above the ground, just above or just within the crowns of the shrubs in question, soon after the end of an average dry season (1997) was 1.1% (range 0.7–2.3; n = 10; P.J. Grubb and J.M.G. Bloor, unpublished), i.e. much the same as in forest receiving a rainfall of 2500–4000 mm year−1. The diffuse site factor was defined by Anderson as “the percentage of diffuse light at a given site compared with diffuse light in the open over the same period”; it may be measured instantaneously or integrated over a period of stated length. In October 1992, during the driest year in a century, when a considerable number of the tall trees dropped all or many of their leaves, I recorded the responses of 33 shade-tolerant species of treelets, shrubs and juvenile trees in the understorey (Appendix 2). I found that eight showed no visible effect of water shortage, while 25 wilted to varying degrees and recovered when rain fell, and of these, only four dropped some of their leaves.
Similar observations have been made in a tropical moist forest on Barro Colorado Island in Panama with 4 ‘dry months’; the much higher average rainfall (ca. 2600 mm year−1) is to be set against the much higher temperatures near sea level at about 9°N than at ca. 800 m altitude at about 17°S in north-eastern Australia. In the Panamanian moist forest, many of the taller trees drop all or many of their leaves in ‘normal’ years and the per cent daylight reaching the undergrowth can increase from ca. 1% in the wet season (Smith et al. Citation1992; Wirth et al. Citation2001) to 3–4% at the peak of a dry season (Tanner and Barberis Citation2007).
R. Condit and S.J. Wright (pers. comm., Oct 2014) reported that (1) most of the tree species that drop their leaves routinely in the forest on Barro Colorado Island do so in association with flowering or fruiting and start to grow new leaves before the rains come, (2) a few species are obligately deciduous and lose their leaves for most of the dry season, (3) none of the species that are deciduous as adults is deciduous as a young seedling, and (4) species that are at least sometimes deciduous as adults mostly begin to show that trait when they are about 1 m or more tall, i.e. mostly decades old if growing in deep shade. A. Hernandez (pers. comm., Oct 2014) reported that only Alseis blackiana (Rubiaceae) begins to be deciduous from about 20 cm tall. This species has notably small seeds (ca. 8 mg dry mass; Dalling et al. Citation2001). The median height attained by 130 15-year-old individuals in 35 species (all the others larger-seeded) in deep shade was 28 cm (S.J. Wright, pers. comm.); the 20-cm-tall seedlings of the Alseis are likely to be older. Tobin et al. (Citation1999) and Engelbrecht et al. (Citation2002) recorded observations on a total of nine shade-tolerant species during an exceptionally strong El Niño drought (1991–92). All showed either no obvious symptoms of desiccation or reversible wilting with no leaf drop. Leaf drop by saplings rather than seedlings was recorded during a severe drought in a heath forest on sandy soil in Brunei by Becker and Wong (Citation1993).
The only other case that I have seen of shade-tolerant seedlings, rather than saplings, losing leaves during drought in rainforest is Monodora myristica (Annonacae), a species which is routinely deciduous as an adult in rainforest in east Africa (Dale and Greenway Citation1961) and has large seeds (mean dry mass, 690 mg; P.J. Grubb, unpublished). In August 1998, when rain followed a dry spell, large seedlings (ca. 50–60 cm tall) could be found in deep shade in Kibale Forest in western Uganda (30° 21ʹ E, 0° 34ʹ N) with completely new sets of 6–8 leaves (each c. 20 × 7 cm) rather than 4–7 old leaves and just 1–2 new ones, as could be expected of most heavily shaded juvenile trees of that size.
To sum up, the most shade-tolerant tree species (almost all found in tropical rainforests) retain their leaves when subject to strong drought at the seedling stage; very few exceptions have been recorded. There is thus evidence of a constraint on the evolution of resistance to both shade and drought arising from a necessity for most species not to respond to strong drought by losing their leaves when in deep shade.
A second potential source of incompatibility between shade tolerance and drought tolerance is the metabolic cost of maintaining positive net assimilation in partially dried leaves. The biochemical basis of protecting the photosynthetic capacity is still being established (Chaves et al. Citation2003; Cuevas-Velazquez et al. Citation2014), but there is certainly a cost in N and C insofar as one or more compatible solutes (glycinebetaine or proline or methyl proline or a derivative of it) and ‘late-embryogenesis-abundant’ (LEA) proteins are involved (as discussed in Appendix 1) and an extra cost in C through the accumulation of the protective sugar trehalose and/or sugar alcohols such as mannitol. Could the cost be so great as to threaten tolerance of deep shade? It may be that an even greater threat comes from the cost of preventing the immature tissues in buds from dying as a result of partial drying out. The potential importance of this issue is shown by an example. During the 1989 drought in England, Viburnum lantana and V. opulus, growing near each other in a wood on a boulder–clay soil near Cambridge, both wilted strongly and the mean relative water content of the leaves decreased to 52% and 59%, respectively (P.J.G., unpublished; n = 6). The following year, the shoots of V. lantana were all healthy, while many of those of V. opulus (a species well known to be favoured by moist soils) had died (Kollmann and Grubb Citation2003). Engelbrecht et al. (Citation2002) emphasised the fact that while many observations have been made on plants during drought, too little research has been done on the impacts of drought that become apparent in the following years.
In summary, very little is yet known about the costs in N of maintaining photosynthetic rates in partially dried chloroplasts or of maintaining the integrity of primordia through a drought period.
Third, in tropical rainforests from South-east Asia to northern Australia, species with minute seeds (<1 mg dry mass) but able to establish in deep shade (<2% daylight) are found in at least 17 families: Actinidiaceae, Araceae, Begoniaceae, Cunoniaceae, Gesneriaceae, Grossulariaceae, Maesaceae, Melastomataceae, Moraceae, Myrtaceae, Pandanaceae, Pentaphramataceae, Philydraceae, Piperaceae, Rhizophoraceae, Rubiaceae and Urticaceae (Kiew Citation1988; Grubb Citation1998b). The species involved include all major life-forms: trees, treelets, shrubs, herbs and climbers, and include trees and climbers that grow tall (20–33 m). Almost none are found in the Australian low-rainfall rainforest described above. Species with extremely small seedlings are not only able to grow in deep shade (Metcalfe and Grubb Citation1997), but are advantaged in being able to establish on steep micro-sites (Kohyama and Grubb Citation1994; Grubb Citation1996; Metcalfe et al. Citation1998). However, it seems that they have not been a feasible option in most of the relevant phyletic lines in forests with a substantial dry season each year.
It should not be thought that minute seedlings from minute seeds cannot possibly survive extreme drought. Members of the genus Ruschia (Aizoaceae-Mesembryanthemoideae), which dominate large areas in the karoo semi-desert of western South Africa, have seeds ca. 0.1–0.2 mg in dry mass, and the young seedlings of four species have been found to remain alive for 77–400 days without watering (Esler and Phillips Citation1994; Lechmere-Oertel and Cowling Citation2001; Carrick Citation2001). No comparable tolerance is known in any tiny-seeded shade-tolerator.
These three possible bases for an incompatibility of tolerances to shade and drought (leaf loss, failure to maintain photosynthetic rates and viability of apices, and seeds too small) have to be set against the various features of plants which can increase resistance to both shade and drought, and the features which can increase resistance to one shortage without reducing the tolerance of another.
There is no reason to anticipate a lack of light-demanding trees or shrubs on continuously moist soils, and therefore if we make a scattergram of shade tolerance values on drought tolerance values for all the woody species in a region, we may expect to produce a cloud of points, possibly with a boundary line at the outer edge, rather than a scatter about a regression line, i.e. we expect a plot like that in . I consider the evidence for temperate deciduous forests in detail before turning to the position in evergreen forests.
Niinemets and Valladares (Citation2006) provided an analysis of the available data on the tolerances of shade and drought for large numbers of tree and shrub species in North America, Europe and eastern Asia. They used the subjective ratings of ecologists and foresters with long experience of the species concerned. There were statistically significant negative relationships for all three regions (). The authors wrote of these relationships, and of similar results for combinations of shade tolerance and waterlogging tolerance “These trade-offs represent a constraint for niche differentiation, reducing the diversity of plant responses to the many combinations of irradiance and water supply that are found in natural ecosystems”.
Figure 8. Scattergrams for indices of shade tolerance and drought tolerance for tree and shrub species in three regions of the Northern Hemisphere; the lines indicate standardised major axis regresssions. In the panel for European species, the points encircled are for species with high waterlogging tolerance and low drought tolerance; the inset shows a truncated data set with indices of waterlogging tolerance <2.5 (from Niinemets and Valladares Citation2006). Used by permission.
I contend that an unbiased observer, viewing the graphs in , would be most impressed by the wide range of combinations of the two tolerances. If the estimates of experts are right, plants can combine any value for shade tolerance with slight to moderate drought tolerance, and any value of drought tolerance with slight to moderate shade tolerance. The only evidence of a qualitative constraint shown in the graphs is the absence of species tolerating deep shade and strong drought. There is no evidence of a true trade-off applying generally to the collection of species studied. The authors emphasise the clustering about the trend line, such as it is (r2 = 0.02–0.16), but I would emphasise the scatter in the lower left-hand half.
Niinemets and Valladares (Citation2006) also performed quantile regressions, and revealed 95% and 5% quantile lines. A majority of species were within a wedge-shaped area with the upper boundary falling downward markedly more steeply than the lower. Having concentrated initially on the collection of study species as a whole, Niinemets and Valladares (Citation2006) moved to considering particular clades. They had values for enough species of Pinus and of Quercus to make worthwhile tests. They found a significant negative relationship between tolerance of shade and tolerance of drought for 18 species of Pinus from across the entire Northern Hemisphere (P < 0.0003) but interestingly no significant relationship over an appreciable range of drought tolerance if only 14 of the 18 species were studied – an important warning about the sensitivity of the result to the particular species assessed. A negative correlation was also found for 12 species of Quercus from Europe and North America (P < 0.049); the strength of the regression was lower than that for Pinus (r2 = 0.39 rather than 0.59), but the spread of points across the range of drought tolerance was more even.
Of course it is important also to perform critically designed experiments to test whether there is really a great deal of freedom in drought tolerance at a given level of shade tolerance. It is easy to perform inadequately designed experiments on this question, but Sack (Citation2004) developed a demanding protocol which avoided the standard pitfalls, and confirmed the existence of a wide variety in the combinations of shade and drought tolerances among 13 woody species (nine deciduous and four evergreen) of European deciduous forests (). He concluded that there is no trade-off within the ranges of conditions he used.
Figure 9. The relationship for 13 species of European temperate tree and shrub species between the quotient of RGR with strong drought over that with moderate drought under 30% daylight and the corresponding quotient for RGR under 3% daylight; for no species was the departure significantly different from the 1:1 line (from Sack Citation2004). Used by permission.
Unfortunately, there is a lack of precise information on the degree of shade cast by the most drought-tolerant northern temperate deciduous forests. These are dominated by Quercus species, e.g. Q. mongolica in north-western China and in Mongolia (Wang Citation1961; Hou Citation1983) and by Q. cerris and Q. pubescens on the Anatolian Plateau of central Turkey (Asouti and Kabukcu Citation2014). The former abuts on naturally treeless grassland. It is likely that the latter – in the absence of human activity – would abut on a Pistacia-Rosaceae woodland, where the rainfall is <300 mm year−1 (Asouti and Kabukcu Citation2014), but these days the area is taken up by cultivation of wheat. Present-day stands of Q. cerris and Q. pubescens are mostly woodlands, i.e. with the trees separated (the ‘steppe-forest’ of Zohary Citation1973), but there are some forests, i.e. stands with continuous crowns, north of Eskişehir (e.g. that at ca. 20 km north of the city described by Zohary Citation1973, p. 280; seen by me to be still intact in 2007) and north and north-west of Ankara. These cities were recorded by Walter and Lieth (1960–1967) as having mean annual rainfalls (MARs) of 362 mm and 341 mm, respectively. Ellenberg (Citation1988, p. 50), considering the degree of shade cast by these Quercus spp. at the moister end of their range, rated them 2 on a scale of 1 to 5, where 5 represents the deepest shade. The fact that there is no deciduous species known to be able to tolerate, say, 1–2% daylight and the grade 5 drought of may result from a lack of opportunity for selection of species leading to that combination of tolerances.
Summing up for temperate forests dominated by deciduous trees, there is clear evidence for a wide scatter of combinations of shade- and drought tolerance beneath a boundary line, and there are many cases where no true trade-off is found in comparisons of pairs of species, but there is some evidence for trade-offs within clades for which the points in a graphical plot fall below the boundary line. The driest temperate deciduous forests do not provide deep shade so that there has been no selective force for the evolution of species tolerant of very deep shade and strong drought.
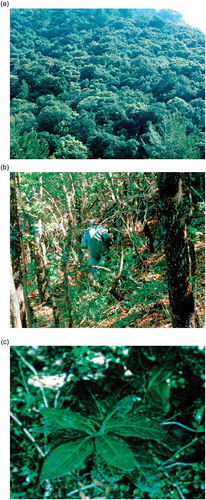
In the warm temperate zones, where evergreens dominate, deep shade (1–3% daylight) is combined with strong annual drought in the driest forests, i.e. those with a Mediterranean type of climate (Coomes and Grubb Citation2000). Gratani (Citation1997) and Coomes and Grubb (Citation2000) gave examples of species which tolerate severe shortages of both light and water in sclerophyll forests, such as that illustrated in . Six species were studied in detail in south-west Spain by Sack et al. (Citation2003). The canopy at each of their three study sites was dominated by a mixture of evergreen sclerophylls and semi-deciduous trees (one site is shown in ). In summer, after the semi-deciduous species were fully leafed out, the canopy allowed through only 2–3% daylight and the soil at 10 cm depth was dried to −2 to −4 MPa. Of the six study species, two were shrubs, one able to grow 2–3 m tall in deep shade, another apparently waiting for a gap before growing taller than ca. 0.3 m. There were two climbers, again one able to grow tall in deep shade, the other needing a gap before growing tall, a low scrambler and a subshrub. The shrub able to grow tall in dry shade, Viburnum tinus, long known to be an indicator of late-successional forest (Braun-Blanquet Citation1936; Walter Citation1968), is shown in . A garden experiment by Sack and Grubb (Citation2002) confirmed the ability of seedlings of V. tinus and of the climber found growing tall in deep shade (Hedera helix) to resist the combination of deep shade and strong drought.
Figure 10. (a) Mediterranean climate sclerophyll forest, one of the forest types inflicting the most severe combination of shade and soil-desiccation, here on Majorca dominated by Quercus ilex; (b) the edge of the study site of Sack et al. (Citation2003) in forest in SW Spain dominated by Quercus suber (evergreen sclerophyll) and Q. canariensis (semi-deciduous) photographed in early April before the Q. canariensis had leafed out; (c) a shoot of Viburnum tinus grown in deep shade under Quercus ilex in Italy.
In considering the ability of these two species to display the two-fold tolerance, Sack and Grubb (Citation2002) noted (1) the reduction in demand for both resources resulting from the leaves being long-lived, (2) the moderate differences in RMF and SLA when the plants were grown in deep shade as opposed to moderate shade, coupled with the lower vapour pressure deficit in deep shade compensating for the greater evaporative loading with higher leaf area per total plant mass, and (3) two features that increase resistance to water shortage without affecting shade tolerance: high cuticular resistance to water loss and conservative stomatal behaviour.
In reviewing their study of the functional morphology of juveniles of these two species and four others in their native habitat, Sack et al. (Citation2003) found that all six converged in features that confer tolerance of shade plus drought by reducing demand for resources. Demand for both irradiance and water is reduced through having a low to moderate foliar N concentration, and long-lived physically protected leaves (≥2 year). Demand for water is reduced by having a moderate to high below-ground mass-fraction, and moderate to high LMA. Other features confer tolerance of either drought or low irradiance through specialised capture of resources without precluding the other tolerance: deep roots relative to shoot size, moderately lower LMA in deep shade than in high light, and higher chlorophyll:N quotient when in shade. Despite these convergences, the species diverged appreciably in their root mass allocation and architecture, saturated leaf water content, density of stomata and guard cell size. For two species of Ruscus, Pivovaroff et al. (Citation2013) carried the analysis further, reporting on Amass, respiration rates, shoot hydraulic conductance and cuticular conductance. Sack et al. (Citation2003) emphasised that no single narrowly defined functional type is needed for tolerance of shade and drought. We see that it is not so hard to combine high tolerances of shade and drought in evergreens, and that is because the features which suit plants to the two hazards are not wholly incompatible.
Sancho-Knapik et al. (Citation2014) found an extreme adaptation to combined deep shade and dry conditions in Abies pinsapo, a tree conifer of montane to subalpine forests in the western Mediterranean region; well-illuminated leaves have numerous stomata on both sides, but those of juveniles in the understorey have almost none on the adaxial side. Positive carbon assimilation is coupled with much reduced water loss.
Summing up for northern temperate evergreen broad-leaved forests, there certainly are plants which tolerate deep shade and strong drought, and it has been shown that they do not conform to a single narrowly defined type in their morphology, anatomy or physiology. On the other hand, they all converge in having features that confer tolerance of shade plus drought by reducing demand for resources, and in having features that improve tolerance of shade or drought while having very little effect on tolerance of the other. There is a lack of comparable information for plants of deeply shading summer-dry warm temperate evergreen forests in the Southern Hemisphere, i.e. in Chile and South Africa.
In the tropics, any plot of shade tolerance vs. drought tolerance for the whole range of forests, comparable with those given in for the northern temperate zone, would be bound to have an empty top right-hand corner, because the driest forests (wholly or mostly deciduous) allow through a much higher proportion of daylight to the understorey than the wettest (wholly evergreen), even in the wet season (5–10% rather than 0.5–2%; Coomes and Grubb Citation2000). Therefore, there has been no selection pressure for the evolution of strong shade tolerance with the greatest degree of drought routinely experienced by a forest.
Interest then centres on the extent to which plants of the deeply shading tropical forests have evolved tolerance of drought. I consider first the research in Panama, where the transmission of daylight to the understorey for 8–9 months of the year is ca.1% but increases to 3–4% at the peak of the dry season. Wright et al. (Citation1992) made detailed studies on leaf properties in a ‘relatively mild dry season’ for five shrub species of Psychotria (Rubiaceae), all of which are shallow-rooted, and found that at the start of the dry season, the moduli of elasticity increased in all five species, and osmotic potential declined (became numerically larger) in four species. These five species are among those which wilt in drier years but are not irreversibly damaged. Tobin et al. (Citation1999) included one of the Psychotria species in a study made during a severe El Niño drought (1991–92). They compared two understorey species that have shorter-lived leaves and low LMA (3.2–4.3 mg cm−2; one being the Psychotria) with two species that have longer-lived leaves and higher LMA (6.4–7.9 mg cm−2). At an early stage in the drought, the species with shorter-lived leaves developed pre-dawn water potentials of −2.8 to −3.6 MPa, well below the turgor-loss point, but the species with longer-lived leaves maintained pre-dawn water potentials of −1.3 MPa until late in the dry season. The species with longer-lived leaves have deeper roots, which makes it difficult to assess the relative importance of any differences in cuticular permeability and/or stomatal closure that there might be between the two pairs of species.
During the severe El Niño drought of 1997–98, Engelbrecht et al. (Citation2002) studied the water relations of juveniles growing in the understorey for three species of shade-tolerant tall trees. They soon reached pre-dawn water potentials of −2 MPa and lower, but remained just above the turgor-loss point, and maintained very low but positive net assimilation rates by day throughout the drought. At least two of the three species (Tetragastris panamensis and Trichilia tuberculata) are relatively deep-rooted; saplings 2–3 m tall have roots reaching about 1 m depth while those of shrubs of the same height reach a depth of only 30–50 cm (Becker and Castillo Citation1990). The mortality rates for the saplings of the three tall-tree species studied were not greater during the drought, but the mortality rates of many species (for individuals of stem diameter <10 cm) were significantly greater in a 3-year period based on the 1983 El Niño drought than in the three following years (on average 3% rather than 2% per annum; Condit et al. Citation1995).
The impacts of occasional drought have also been studied in heath forest growing on very infertile and highly permeable sandy soil in Borneo, where the transmission of daylight to the undergrowth is somewhat higher than in most lowland rainforest (Ashton Citation2014); in the Neotropics in analogous forests on white sand, 1–3% daylight reaches the understorey as opposed to 0.4–1.0% in forests on more fertile soils (Coomes and Grubb Citation2000). During an 83-day drought in 1992, understorey tree species and juveniles of tall species (diameter 1–5 cm at 1.3 m height) at one site suffered 11% mortality, compared with 0.3–0.4% in nearby rainforest on finer-textured, more fertile soils (Becker and Wong Citation1993). Many of the individuals about to die in the heath forest lost all their leaves. In both the heath forest and the rainforest on finer-textured soils, there was no mortality in the trees >10 cm in diameter.
Cao (Citation2000) studied the water relations of saplings of nine shade-tolerant species in a Bornean heath forest during the El Niño drought of 1998. The only study species to suffer appreciable mortality was the one with shallow roots (to 0.2 m only, Tristaniopsis obovata). The others had taproots, some thick, some thin, to between 0.6 and 2.0 m depth, and all but one effectively shut their stomata; the exception was Dipterocarpus borneensis, which has a thick taproot to 2 m. Becker et al. (Citation1999) had earlier emphasised the importance of rooting depth in heath forest on the basis of their morphological studies. Cao (Citation2000) found that only one species showed osmotic adjustment (another dipterocarp, Cotylelobium burckii). Thus, although the shade-tolerant species in Panama or Borneo (which grow in 1–3% daylight during wet periods) would almost certainly be killed if subjected to the strength of drought routinely tolerated by the plants of the driest tropical forests, there is plenty of evidence that many of them have high survival rates during the worst droughts that they are likely to meet during a century.
The idea that plants cannot tolerate both deep shade and drought is particularly misleading for species of tropical rainforests, which experience on average a high rainfall (>100 mm) every month of the year – the ‘everwet’ forests of Whitmore (Citation1998, p. 11–13), widespread in the Indo-Malayan region, the upper Amazon and the Pacific coast of northern South America. In fact, at least some of these forests suffer dry spells (<1 mm rainfall every day) that cross the boundaries of months, and last for at least four weeks. In Singapore, such spells occur about once a decade (Burslem et al. Citation1996), and result in considerable soil water deficits (Nieuwolt Citation1965). In other areas, a less stringent definition of a very dry month (say <30 mm in total) might be more helpful, and the return time may be <10 years (Nagy and Proctor Citation2000; Potts Citation2003). These dry spells constitute a significant hazard for species that persist and grow as seedlings on the forest floor for several decades. Burslem et al. (Citation1996) made an experiment on three deeply shade-tolerant tree species using seedlings less than 1 year old, grown in forest soil in deep shade from the start, kept for >5 months under shade screens allowing through <1% daylight, and subjected to water shortage sufficient to generate xylem pressure potentials of −1.3 to −2.6 MPa at midday. The seedlings survived, and adjusted to the dry conditions by developing a reduced leaf area and greater allocation to roots, increased LMA and a greater allocation of root dry mass to slender absorptive laterals. Species of tree in this kind of forest would probably not be given even a moderate rating for drought tolerance in a study of the type reported by Niinemets and Valladares (Citation2006), but at least some – perhaps most – possess a significant degree of resistance to drought and that resistance is likely to be vital for their persistence in the community.
Granted that it is possible for a plant to tolerate deep shade and strong drought, it is also true that evolution of the double tolerance has not occurred as many times as the evolution of one tolerance or the other. For example, in south-western China, the subtropical montane semi-moist forest of Wu (Citation1987) and Song (Citation1988) routinely suffers winter drought, and there are fewer undergrowth species than in the warm temperate rainforests of Japan and eastern China, which are free of winter drought (documented by Grubb et al. Citation2013). There are still fewer in the sclerophyll forests of the Mediterranean Basin, which experience strong summer drought (Gratani Citation1997; Sack et al. Citation2003).
Summing up for tropical forests, there is no species tolerant of deep shade and the intensity of drought tolerated by the trees of the driest forests; that is arguably because there has been no selective pressure for such species to evolve – the forests suffering annual severe drought all cast light shade. Many species in evergreen forests suffering a degree of drought in almost all years are strongly shade-tolerant. Equally, the species of ‘everwet’ forests, subject to marked drought only once in a decade or century, have the ability to tolerate considerable soil desiccation.
Overall summary for example 3
The suggestion by Smith and Huston (Citation1989) that, on morphological grounds, we should expect shade tolerance and drought tolerance to be incompatible was flawed, but there are reasons why we might expect the evolution of the double tolerance to be constrained. There are constraints that concern three aspects of plant ‘design’: (1) plant behaviour (the need not to respond to drought by dropping leaves or by allowing them to die and stay on the plant), (2) biochemistry (the need for investment in compounds that protect the rate of photosynthesis from declining at low water potentials, and/or prevent the death of young tissues in buds), and (3) morphology (the need to make seeds big enough to produce seedlings sufficiently deep-rooted to survive a dry season). Even more important as a constraint is the absence of forest types in the cool temperate and tropical zones that experience the most severe annual drought and inflict the deepest level of shade found in moist forests. This has meant that there has been no selection for the most extreme combination of tolerances.
The driest evergreen warm temperate forests do cast deep shade (1–3% daylight) and there exists in such forests a variety of species which can tolerate that degree of shade plus severe annual drought. Such plants defy the theory of Smith and Huston (Citation1989) ‘head on’, as do the plants living in tropical semi-deciduous forests that cast deep shade for the majority of the year and suffer appreciable drought every year and severe drought at short intervals, such as those that have been studied in Panama. More subtle and in some ways more remarkable are the plants of ‘everwet’ rainforests that suffer very deep shade as juveniles every year but survive the strong droughts that come every decade or century, like those studied in Singapore. They show the need to avoid too simple a characterisation of ‘drought-prone’ or ‘drought-resistant’ forest.
Survival of the combination of deep shade and severe drought is made possible partly by features that reduce the need for resources in general, notably long-lived leaves with low to moderate N concentration. However, features that increase drought resistance while having little effect on shade resistance can also be important: deep rooting relative to plant size (irrespective of RMF), increased allocation to slender absorptive laterals, high cuticular resistance, conservative stomatal behaviour, osmotic adjustment and seasonal increase in the modulus of elasticity. Shade resistance can be increased with minimal effect on drought resistance by increasing the chlorophyll:N ratio.
Nevertheless, there is no doubt that the forests which are deeply shading and routinely experience strong drought have fewer species of shade-tolerant trees and shrubs than those not subject to strong drought. More research is needed to understand what the strongest constraints have been.
Example 4. Tolerance of waterlogging and tolerance of drought
The characteristic morphological, anatomical and physiological features of plants tolerating soil anoxia caused by waterlogging for extensive periods differ markedly from those of plants tolerating drought (). However, the two sets of characteristics are not incompatible. Thus, a plant tolerating waterlogged soils for a substantial part of the year may have relatively deep roots that facilitate survival of a dry season, provided it has an adequate system of air spaces through which oxygen can diffuse to the root tissues. The properties of root tissues needed to survive waterlogging of the soil are complementary to the properties of shoot tissues needed to survive dry periods, i.e. they are different in kind (). The situation is different from that posited by Smith and Huston (Citation1989) regarding tolerances of shade and drought: they assumed that plants in the first case have a low allocation to roots and thinner leaves and in the second, high allocation to roots and thicker leaves; the two classes are opposites rather than complementary. The internal structure of the shoot is the feature where we find what might seem at first sight an incompatibility between tolerance of waterlogging and tolerance of drought: well-developed air spaces in the first case, and dense tissues in the second, but in fact it is possible for plants to evolve with a matrix of dense tissues containing localised air spaces adequate to supply oxygen to the roots.
Table 3. The contrasting key features of plants able to resist waterlogging and those able to resist drought.
In many regions where seasonal waterlogging alternates with seasonal drought, a major natural hazard for plants is fire. As documented by Gill (Citation1981) and Sarmiento and Monasterio (Citation1983), the plants cope through having features which enable them to resist fire (e.g. thick bark) or to be resilient afterward (e.g. buds in various positions above and below ground from which new shoots grow out). These features, like those making the plants tolerant of drought, are compatible with those making them tolerant of seasonal waterlogging.
The evolution of plants that can tolerate both yearly waterlogging and severe drought (plus fire in many cases) is likely to be constrained by (1) the limited amounts of resources that must be shared between the different features that protect against waterlogging and drought (plus fire), respectively, and (2) the time taken for all the mutations controlling the development of so many different features to arise by chance.
If we were to make a study of all the plant species in a large area, including many different habitats, some waterlogged to varying degrees, some droughted to varying degrees and some rarely or never waterlogged or droughted, we could plot the optimal conditions for each species (in the presence of competitors) along two axes at right angles, one for tolerance of waterlogging, and one for tolerance of drought in the type of plot seen in . We would expect a cloud of points to occupy the lower left-hand part of the niche space. There would be a diagonal boundary line above which either very few species or no species would have evolved because of the improbability of having high values for both tolerances. True trade-offs would be most obvious among species spread along the boundary line, but they might also be found in particular clades among the species well below the boundary line.
I review here two approaches to looking for a trade-off between tolerances of waterlogging and drought, and point out the problems raised by each of them. First, I consider the approach where highly sophisticated fine-scale measurements of the environment, and of quantitative measures of plant abundance, are made for the many species present at a limited set of sites. Second, I consider the approach where authors use the subjective ratings of ecologists and foresters with long experience of the species concerned, and these ratings are assigned to species found in a large proportion of all the many habitats in a large region.
Silvertown et al. (Citation1999) examined the distributions of numerous herbaceous species in two areas of floodplain meadow in southern England; they showed that there was considerable variation across each study site in the degrees of waterlogging and soil desiccation experienced, on average, over 15 years. Here, I consider only the results from the site with the more variable topography. The authors calculated ‘sum exceedence values’ (SEVs) for (1) soil drying and (2) aeration (waterlogging) for the soils under 641 randomly chosen quadrats of 1 m2. The SEVs were time-depth integrated measures of the incidence of a tension >5kPa, and of air-filled porosity <10%. As expected, these SEVs were negatively correlated with a moderate spread about the trend line ().
Figure 11. (a) Hydrologically defined niche space in an extensive floodplain meadow is southern England based on sum exceedence values for soil aeration (SEVa, reflecting frequency of flooding) and soil dryness (SEVd, indicating frequency of drought); (b) the negative correlation between the mean SEVs weighted by abundance for the 51 plant species that occurred in 50 or more of the 641 quadrats; (c) the negative correlation between the mean SEVs for soil aeration and soil dryness for 99 floodplain meadow species in southern England (empty circles) and 96 fynbos species in South Africa (filled circles). (a) and (b) from Silvertown et al. (Citation1999), reprinted by permission from Macmillan Publishers Ltd [Nature] copyright 1999. (c) from Araya et al. (Citation2011), reproduced with permission of Wiley.
![Figure 11. (a) Hydrologically defined niche space in an extensive floodplain meadow is southern England based on sum exceedence values for soil aeration (SEVa, reflecting frequency of flooding) and soil dryness (SEVd, indicating frequency of drought); (b) the negative correlation between the mean SEVs weighted by abundance for the 51 plant species that occurred in 50 or more of the 641 quadrats; (c) the negative correlation between the mean SEVs for soil aeration and soil dryness for 99 floodplain meadow species in southern England (empty circles) and 96 fynbos species in South Africa (filled circles). (a) and (b) from Silvertown et al. (Citation1999), reprinted by permission from Macmillan Publishers Ltd [Nature] copyright 1999. (c) from Araya et al. (Citation2011), reproduced with permission of Wiley.](/cms/asset/d47f3fe0-12d3-48f9-98df-e4fe06c769fc/tped_a_1048761_f0011_oc.jpg)
Pair-wise values of Pianka’s index of niche overlap were then calculated for all combinations of the 51 species that occurred in 50 or more of the 641 quadrats, and mean pair-wise niche overlaps were significantly fewer than found in a randomisation test (P < 0.001). The authors then used the field data for the distributions of the 51 species along the trend line to ‘test for a trade-off’ between the mean SEV for dryness and that for aeration (). There was little scatter about the trend line. The authors predicted that the trade-off would prove to be a fundamental constraint.
Araya et al. (Citation2011) expanded the study to include 99 species from 18 lowland sites in England, and 96 species from fynbos communities in the Cape region of South Africa. They used somewhat different methods, but again plotted their results in terms of the mean SEVs for the various species (). The points for the species in meadows clearly fit within the cloud of points for species of fynbos, although the latter are much more strongly biased towards the dry end.
I contend that in this case it is not appropriate to make a statistical analysis that assumes constraints on both sides of the trend line; the upper right limit of the relatively narrow cloud of points about the trend line should have been seen as defining what might possibly turn out to be a fundamental constraint. Since so many species tolerate both waterlogging and drought to a considerable extent, there is no ground for not expecting in a wider survey of relevant landscapes, species with lower tolerances of waterlogging and/or drought than those shown in .
Niinemets and Valladares (Citation2006) used experts’ indices of drought tolerance and waterlogging tolerance for forest trees and shrubs in North America, Europe and eastern Asia. They found what I have suggested we should expect: species with all combinations of values for the two tolerances below and to the left of a limiting line (). The indices used by Niinemets and Valladares (Citation2006) are certainly crude relative to the SEVs employed by Silvertown et al. (Citation1999) and Araya et al. (Citation2011), but I suggest that it is unlikely to be the case that they are so wildly inaccurate that the results in are completely misleading.
Figure 12. Scattergrams for indices of drought tolerance and waterlogging tolerance for tree and shrub species in three regions of the Northern Hemisphere; the lines indicate standardised major axis regressions (from Niinemets and Valladares Citation2006). Used by permission.
Niinemets and Valladares (Citation2006) first tested the tightness of any negative relationship between the two kinds of tolerance by making a correlation analysis as had been done by Silvertown et al. (Citation1999). They found a huge scatter about the trend line with very low r2 values for the North American and eastern Asian species (0.16 and 0.10), but the large numbers of species in the tests resulted in statistically significant negative correlations. The indices for European species showed a much tighter negative relationship (r2 = 0.53). I contend that in this study, as in that of Silvertown et al. (Citation1999) and Araya et al. (Citation2011), it was not appropriate to seek a trend line with constraints equally strong on both sides.
Niinemets and Valladares (Citation2006) also used quantile regression, which revealed the 95% and 5% quantile lines. Most species fell in a band that had an upper boundary only modestly steeper than the lower. Among 11 species of Quercus, no significant negative correlation between drought tolerance and waterlogging tolerance was found, while among 18 species of Pinus, a negative relationship was found (P = 0.004). However, as in the case of shade tolerance vs. drought tolerance, no negative relationship would have been found if only the 14 species with the nearest-to-mean values had been studied.
Summing up, the wider ranging study of Niinemets and Valladares (Citation2006) showed the expected scatter of values for tolerance of drought vs. tolerance of waterlogging, with very limited incidence of true trade-offs, even within clades. The more narrowly defined studies of Silvertown et al. (Citation1999) and Araya et al. (Citation2011), which employed much more precise measures of the environment, agreed with the study by Niinemets and Valladares (Citation2006) in finding an apparent absence of species able to tolerate both strong drought and long periods of waterlogging.
I now take up this latter point. If a test is to be made of whether or not a constraint is fundamental, investigators should surely look for evidence that collections of species exist in which the constraint has been overcome. If none can be found, there is a strong case for accepting the constraint as fundamental.
There is a lack of species in the top right corner of each graph in , i.e. a lack of species able to tolerate severe drought and prolonged waterlogging, and thus support is provided for the view of Silvertown et al. (Citation1999) and Araya et al. (Citation2011). Evolution of species with this high degree of double tolerance might seem to be improbable to a plant ecologist based in a temperate climate, but there are widespread tropical and subtropical vegetation types with moderate to low MAR, dry periods lasting several to many months, and soils which are alternately waterlogged and dried out. The ‘hyperseasonal’ savanna grasslands of South America reviewed by Sarmiento (Citation1983) are a clear example. They are deemed ‘hyperseasonal’ if either the contrast between the amounts of rainfall in the wet and dry seasons is especially strong or the soil is particularly prone to waterlogging. Such is the case when the whole profile is dominated by clay, or where free drainage is prevented by a lateritic layer, an iron pan or a concretionary layer. Comparable vegetation types are known from Africa (Vesey-Fitzgerald Citation1963; Markham and Babbedge Citation1979; Tinley Citation1982) and Australia (Johnson and Tothill Citation1985). It could be revealing to apply to one of these areas the kind of sophisticated study developed by Silvertown, Araya and colleagues. Even in some of the ‘seasonal’ savannas, where the soil conditions are not as severe, they are still so severe that very few tree species are found, typically only 1–3 over areas up to 10s of km2. Widespread examples in Venezuelan savannas are Bowdichia virgilioides (Fabaceae), Byrsonima crassifolia (Malpighiaceae) and Curatella americana (Dilleniaceae) (Sarmiento Citation1983). These few species show that what I suggested above is true: plants can have shoots that cut down water loss in dry periods and have shoot tissues which tolerate drought (and fire), while having roots that receive an internal supply of oxygen and a tolerance of anaerobic conditions.
Another tropical example shows how the effective severity of water shortage can be inadequately represented by an index which places emphasis on the length of time that a soil is dry. Bana (shown on the cover of the journal) is a community found within areas of tropical rainforest in the very flat landscape of southern Venezuela (MAR ca. 3000 mm year−1) but composed of treelets and shrubs growing on wide domes of sand rising about 2 m in 200 m. The height and openness of the bana reflect the depth to the water table after copious rain: ca. 13 cm in the ‘low bana’, which is 3–5 m tall except for two emergent species growing to 10 m, and ca. 4 cm in the ‘open bana’ which is ca. 2 m tall with 90% open ground in which herbs grow between the treelets (Bongers et al. Citation1985). The treelets and shrubs have thick, tough semi-erect leaves that are smaller than those of the rainforest (Medina et al. Citation1978; Bongers et al. Citation1985); they are mostly notophylls rather than mesophylls sensu stricto in the scheme of Webb (Citation1959). Almost all the roots of most species are confined to the soil above the water table after heavy rain; only the emergent palm Mauritia carana is known to have roots that carry internal aeration channels and descend through the water table (Bongers et al. Citation1985) but the same is suspected of the other emergent, Aspidosperma album (Apocynaceae). In low bana, following a short spell of copious rain, the water table was found to drop to −52 cm during 7 days without rain, and to −90 cm during a spell with little rain in a few weeks; in open bana, it dropped to −38 cm during the 7 days without rain, and to −63 cm during the longer dry spell (Bongers et al. Citation1985). The sand has a low water-holding capacity and a low potential for capillary rise so that the plants are soon short of available water when the water table falls during a rainless spell. The steep inclination of the leaves is important, reducing the chance of overheating and/or photo-damage while the stomata are completely or partially shut in full daylight (Medina et al. Citation1978, Citation1990). All of the bana species, bar the Mauritia (and probably the Aspidosperma), have to cope with severe but generally short-lived water shortage as well as routine waterlogging of the soil, which restricts rooting to a very shallow layer and thus exacerbates the paucity of the supply of available nutrients. There is a parallel between the plants of bana and the strongly shade-tolerant species of ‘everwet’ rainforest; the two sets of plants tolerate one extreme problem either all the time (deep shade in the rainforest) or most of the time (waterlogging in the bana), but can also tolerate a second hazard (in both cases periodic dry spells), which are critical for long-term survival.
I return to the issue of the paucity of species able to overcome constraints so far as to tolerate extreme conditions, and the need to distinguish between the very difficult and the impossible. We may learn a valuable lesson from the ‘Mitchell grasslands’ of north-eastern Australia, just inland of the Great Dividing Range, found on gentle slopes on clay soils derived from alluvia and shales, and dominated by species of Astrebla, an endemic genus of grasses (Beadle Citation1981). The MAR varies from 300 to 550 mm year−1, and over large areas, including the one illustrated in , the MAR is 480–490 mm with eight dry months sensu Walter and Lieth (Citation1960–1967). The soils crack to depth (down to 1 m) during drought periods (), but are waterlogged after rain. The dominant grasses are well suited to the recharging of the profile by water running into the cracks; they have major roots that make a limited number of short laterals in the topsoil, and then grow down unbranched to a depth of ca. 0.8 m, and finally branch at 0.8–1.2 m (Everist Citation1964). At the time of European colonisation, vast areas of Mitchell grassland contained no tree or tall shrub; that was the case despite the presence of numerous tree and shrub species in nearby vegetation types on less testing soils. Some argued that no woody plant could tolerate the cracking of the Mitchell grassland soil, which would supposedly lead inevitably to snapping of roots. But Acacia nilotica, which is widespread in Africa and south-western Asia, and is considered to include nine subspecies (Brenan Citation1983), proved that argument wrong. Subspecies indica was introduced to provide shade and as an ornamental in the late 1890s or early 1900s, and started to spread into much of the grassland (Australian Government Department of Environment and Heritage Citation2003). By 2005, about half of the grassland area had become at least sparsely infested, and about 20% had a ‘medium’ infestation (Carter Citation2014). Different levels of infestation are shown in .
Figure 13. (a) ‘Mitchell grassland’ on deeply cracking clay soil, dominated by Astrebla spp., over-grazed but still free of Acacia nilotica, in north-eastern Queensland, 21 km north of Hughenden; (b) the cracking clay at the site in (a) at the end of a long rainless period; (c) an area moderately infested with Acacia nilotica, just west of Hughenden; (d) an old infestation of the Acacia 140 km west of Hughenden; all photographs taken in early August 1995.
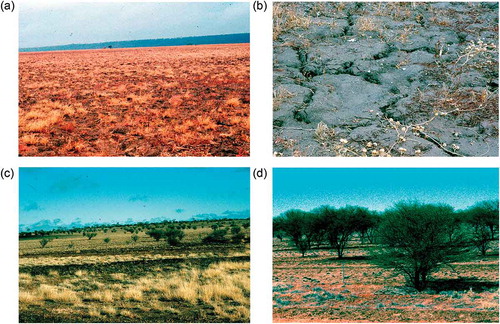
Any understanding in terms of morphology and physiology of how Acacia nilotica avoids the constraint or constraints that inhibited evolution of a ‘super species’ in any of the phyletic lines present in northern Australia must be seen against the background of what is known of its population dynamics. New plants establish from seed in great numbers in runs of wet years, and many trees die in runs of especially dry years (Carter Citation2014). Acacia nilotica ‘does the impossible’, but it is only an extreme case among the many species which evolved the double tolerance, having been exposed to that selection regime.
Overall summary for example 4
We should think of the constraints on evolution of resistance to the twin problems of waterlogging and drought as being represented by a boundary line on a graphical plot of tolerances rather than a trend line within a cloud of points. We should test whether the supposed impossibility of resistance to extreme values of both waterlogging and drought has been a ‘fundamental principle’ by examining vegetation types which experience the most testing conditions known. We should recognise that double resistance to extreme conditions may be so unlikely to evolve that it has been reached on one continent and not another, despite the existence of large areas where such a plant might grow. We should also recognise that there are different kinds of combinations of extreme waterlogging with drought that is significantly threatening to persistence, and a single measure of the severity of drought (e.g. mean length of time a certain soil water potential is experienced each year) will not be appropriate in all vegetation types.
Discussion
A major conclusion from this review is that where a significant negative correlation between properties A and B is found, or where a striking boundary line is found defining the limit of combinations of properties A and B existing in nature, many interspecific comparisons fail to show any sign of a trade-off, let alone a ‘true trade-off’ as I have defined that. There is some evidence that true trade-offs are more common within clades than among plants generally, just as we might expect if species within clades fail to differ in properties C, D, E, etc., as well as A and B.
My concern is that emphasis in teaching and research on the negative correlations and the boundary lines without equal emphasis on the deviations from the trend lines, and the exceptional species able to cross the boundary lines, leads to a biased and inadequate view of nature. At least some of the variation is of importance in explaining how vascular plants have come to occupy so many different habitats, and how several to many species coexist indefinitely in a given habitat.
What I have written in this review is an expansion of the point I made 30 years ago. Having emphasised the fact that species vary hugely in the breadth of not only their ‘realised habitat niche’ but also their physiological tolerance or ‘potential habitat niche’, and listed several examples of plants that tolerate not just one extreme condition but also the opposite, I wrote “The concept of trade-off, which implies that being suited to one condition necessarily involves not being suited to the opposite, is widely diffused in current literature but is not universally applicable.” (Grubb Citation1985, p. 600). The wide-ranging review by Kneitel and Chase (Citation2004) shows that species with broad tolerances were generally ignored by the many authors writing up to that time about trade-offs.
Another limitation of much writing on trade-offs, for which there has been no space in this review, is the fact that an investment of resources in one structure or chemical may bring more than one advantage. For example, the thickened cell walls of tough leaves may (1) prevent the collapse of the mesophyll and occlusion of the intercellular spaces in partially dehydrated leaves, (2) maintain leaf inclination, once turgidity is lost, at such an angle that that damage by overheating or further desiccation is minimised, (3) provide physical protection against damage by wind, hail or falling twigs and branches, and (4) reduce the nutritive value and palatability of the leaf to animals (Grubb Citation1989). The plant does not have to lessen its protection in one of these respects to gain greater protection in another.
In this review, I have put emphasis first on trying to understand the mechanistic basis for deviations from selected negative trend lines. We may recapitulate two examples. In the case of the variable relationship between LMA and Amass (), some of the variation may relate to the different sources of higher values of LMA, e.g. epidermal wall thickness, mesophyll wall thickness, abundance of fibres and incidence of various colourless tissues. In the case of the variable relationship between responsiveness to greater irradiance and survival rate in deep shade, it seems likely that it will be explained in terms of (1) variation in the flexibility of plant form and rates of key physiological processes, and (2) variation in ‘design’ – for example, having a shoot form that maximises height growth and ability to outcompete others in a canopy gap that arises relatively soon (the ‘optimist’) or one that maximises persistence and the chance of using a gap that rises at a later stage (‘the pessimist’).
The point of Garland (Citation2014) that “nature has more ‘degrees of freedom’ than assumed by simple conceptualizations that predict trade-offs” is very important in assessing two proposed ‘trade-offs’ that attracted a lot of attention in the 1980s and 1990s. First, the ‘allocate’ model of Tilman (Citation1988) offered an understanding of interspecific competition based on allocation to root as opposed to shoot, but what matters in root competition is the area of absorptive root and potential for uptake of water and nutrients per unit area of root surface, and what matters in shoot competition is the height attained and/or degree of shade cast (less often ability to push other plants aside and smother them). All these latter functions can be uncoupled from the dry mass invested per unit time in roots and shoots; Coomes and Grubb (Citation2000) spelt out the issues in more detail. In fact, it is possible for a tree such as Fagus sylvatica, with its horizontal arrays of close-set leaves and intense development of shallow roots, to be a very strong competitor both above and below ground (Slavíková Citation1958; Ellenberg Citation1988).
The spatially explicit colonisation-competition model of Tilman (Citation1994), based on the idea that smaller-seeded species are superior colonisers and larger-seeded species superior competitors, was put forward as a possible basis for understanding long-term coexistence of species in a given community. In this case, the most important problem is that if the competitive ability of the seedling does depend on its dry mass, that will be determined by the mass of embryo-cum-endosperm and not that of the whole seed, and the fact is that the proportion of seed mass in the embryo-cum-endosperm can vary between 0.3 and 0.8 in biennials and perennials of temperate mesic grasslands, and between 0.01 and almost 1.0 in tropical rainforest (Coomes and Grubb Citation2003). Another problem is that dispersibility may not be consistently greater in smaller-seeded species (Fenner and Thompson Citation2005; Muller-Landau et al. Citation2008; Thomson et al. Citation2011).
My chief concerns are different in the case where the tolerance of one hazard is set against the tolerance of another that is thought incompatible. First, there are procedural issues. In a graphical plot, we should not expect a scatter of points about a trend line, and we should concentrate on the boundary line at the outer edge of a cloud of points isolating an empty top right corner, as shown in . We should search across all known vegetation types to see whether there are species which have overcome the constraint. We should recognise that some combinations of tolerances have evolved only very few times, and they may be absent on any given continent. Care is needed in assessing the importance of a hazard, such as severe drought or flooding; the long-term persistence of a species in a certain vegetation type may depend on its ability to tolerate rare short periods when the hazard in question reaches a high intensity. When there really does seem to be an ‘empty right-hand corner’, we should check whether the combination of extreme conditions in question does occur in nature and provide an opportunity for selection.
It is also important to realise that while vascular plants, as a whole, may show no evidence of a trade-off within the ranges of tolerance below the boundary line, evidence of true trade-offs may appear within these ranges for particular clades, where the various taxa have a smaller chance of differing in properties C, D, E, etc., in addition to properties A and B, just as in the case of plots of the trend line type. Niinemets and Valladares (Citation2006) found examples for both shade tolerance vs. drought tolerance and drought tolerance vs. waterlogging tolerance, although it was found that the presence of a trade-off was sensitive to which species were put into the analysis.
My remaining concerns are about the mechanisms whereby at least a few plants, sometimes quite a number, overcome supposed fundamental constraints. In each instance we want to know how far is the clue an ability (1) to reduce the requirement for resources in general, (2) to make modest changes in form or physiology when needed that improve resistance to one hazard without having a great effect on resistance to a second hazard, and (3) to combine in their ‘design’ the structural and physiological features that are needed to resist each of two hazards. The first two abilities seem to have been most important in the evolution of tolerance to deep shade combined with severe drought, while the third ability seems to have been most important in the evolution of tolerance to both waterlogging and drought. Much remains to be found out, and excessive attention to simple negative correlations will inhibit that happening.
Finally, a few words about trade-offs in the context of the ultimate goals of ecology. Ecologists will have different opinions on the identity of the ultimate goals. My view is that the overriding goal is to understand ‘the nature of nature’, partly as a specific part of human beings’ general desire to understand the universe in which they live, partly to make possible responsible use of resources coupled with effective conservation of wildlife, and partly to develop the ability to make better predictions about what will happen to particular parts of the world under given scenarios. To achieve these goals, we need four kinds of tools: (1) clearly defined concepts, (2) the few principles (absolute truths) of the subject, (3) the many generalisations that are true sufficiently often to be worth using in our daily lives as ecologists, and (4) an understanding of the most common mechanistic explanations of exceptions to the generalisations. I have dealt with (2) and (3) earlier (Grubb Citation1989). Negative correlations, such as that between Amass and leaf longevity, and boundary lines, like that for drought tolerance coupled with waterlogging tolerance, are examples of generalisations. In this paper, I have concentrated on some particular examples of (4).
As to concepts, it seems strange now that when the British Ecological Society in 1987, in preparation for its Jubilee Volume on ‘Ecological Concepts’, invited 148 ecologists in 24 countries to submit an unguided list in rank order of the 10 most important concepts in ecology, neither ‘trade-off’ nor ‘constraint’ was among the top 50 named (Cherrett Citation1989). Surely they would both be in the top 50 now. The two concepts are central to current ways of thinking about relationships such as the four analysed in detail in this paper. Ecologists need to maintain a balance of interest between the generalisations and the explanations of the exceptions. This viewpoint is consistent with the admonition ‘Seek simplicity but distrust it’, which I discussed in another context (Grubb Citation1992). Part of the difficulty is that those with mathematical skills and an interest in modelling will be naturally more interested in the generalisations that can be found (such as particular negative correlations and a certain number of true trade-offs), while those interested in mechanisms will be equally or even more interested in the anatomical, physiological and biochemical explanations of the overcoming of constraints. The ‘mechanists’ will naturally be inclined to seek out species which have overcome even the most severe constraints. My suspicion is that current teaching, funding of research and ease of publication in prestige journals are all weighted in favour of generalisations including negative relationships and boundaries to combinations of tolerances, while ecology will never mature as a science until sufficient emphasis is placed on understanding the exceptions including the species overcoming supposed constraints.
Concentrations of nitrogen in various kinds of deterrent chemicals found in leaves near their peak of development
Download MS Word (12.8 KB)Concentrations of N-compounds acting as compatible solutes in leaves of plants resistant to drought and/or salinity
Download MS Word (11.7 KB)Acknowledgements
I am greatly indebted to the Editorial Board for inviting me to contribute this review, to Laszlo Nagy for making the Figures and for valuable comments on the text, to Victor Resco de Dios for a critique of a draft which led to major improvements, and to two anonymous referees for their constructive criticism. I thank Howard Griffiths and Lawren Sack for valuable suggestions on parts of an early draft, and David Ackerly, Richard Condit, David Coomes, Tom DeJong, Andres Hernandez, the late Tony Irvine, Will Simonson and Joe Wright for help on various points.
Disclosure statement
No potential conflict of interest was reported by the author.
Supplemental data
Supplemental data for this article can be accessed here.
Additional information
Notes on contributors
Peter J. Grubb
Peter Grubb did his earliest research in plant physiology, but was interested in natural history from an early age, and under the influence of expeditions he led or co-led to the Balkans and South America, and his first sabbatical in Australia, he switched to doing research in plant ecology. He has published on a wide variety of topics in the whole range of vegetation types, from rainforest to semi-desert and lowland to mountain communities.
Related Research Data
References
- Aasamaa K, Sõber A, Rahi M. 2001. Leaf anatomical characteristics associated with shoot hydraulic conductance, stomatal conductance and stomatal sensitivity to changes in leaf water status in temperate deciduous trees. Australian Journal of Plant Physiology 28:765–774.
- Anderson MC. 1964. Studies of the woodland light climate I. The photographic computation of light conditions. Journal of Ecology 52:27–41.
- Araya YN, Silvertown J, Gowing DJ, McConway KJ, Linder HP, Midgley G. 2011. A fundamental, eco-hydrological basis for niche segregation in plant communities. New Phytologist 189:253–258.
- Ashton PS. 2014. On the forests of tropical Asia. Lest the memory fade. Kew (UK): Royal Botanic Gardens.
- Asouti E, Kabukcu C. 2014. Holocene semi-arid oak woodlands in the Irano-Anatolian region of Southwest Asia: natural or anthropogenic?. Quaternary Science Reviews 90:158–182.
- Australian Government Department of Environment and Heritage. 2003. Weed management guide. Prickly Acacia (Acacia nilotica). Available online at http://www.weeds.org.au/WoNS/pricklyacacia/docs/Weed_Management_Guide_Prickly_Acacia.pdf (accessed 17 October 2014).
- Battaglia M, Olvera-Carrillo Y, Garciarrubio A, Campos F, Covarrubias AA. 2008. The enigmatic LEA proteins and other hydrophilins. Plant Physiology 148:6–24.
- Beadle NCW. 1981. The vegetation of Australia. Cambridge (UK): Cambridge University Press.
- Becker P, Castillo A. 1990. Root architecture of shrubs and saplings in the understorey of a tropical moist forest in lowland Panama. Biotropica 22:242–249.
- Becker P, Sharbini N, Yahya R. 1999. Root architecture and root: shoot allocation of shrubs and saplings in two lowland tropical forests: implications for life-form composition. Biotropica 31:93–101.
- Becker P, Wong M. 1993. Drought-induced mortality in tropical heath forest. Journal of Tropical Forest Science 5:416–419. The first author’s name was mis-spelt ‘Beeker’, and the journal was then titled Journal of Tropical Sciences.
- Bloor JMG, Grubb PJ. 2003. Growth and mortality in high and low light: trends among 15 shade-tolerant tropical rain forest tree species. Journal of Ecology 91:77–85.
- Bongers F, Engelen D, Klinge H. 1985. Phytomass structure of natural plant communities on spodosols in southern Venezuela: the bana woodland. Vegetatio 63:13–34.
- Bostock PD, Holland AE, editors. 2007. Census of the Queensland Flora 2007. Brisbane (Australia): Queensland Herbarium, Environmental Protection Agency.
- Braun-Blanquet J. 1936. La Chênaie d’Yeuse mediterranéenne (Quercion ilicis). Mémoires de la Société d’Étude des sciences naturelles de Nîmes. 5.
- Bray EA. 1993. Molecular responses to water deficit. Plant Physiology 103:1035–1040.
- Brenan JPM. 1983. Manual on taxonomy of Acacia species: present taxonomy of four species of Acacia (A. albida, A. senegal, A. nilotica, A. tortilis). Rome (Italy): FAO.
- Brodribb TJ, Feild TS, Jordan GJ. 2007. Leaf maximum photosynthetic rate and venation are linked by hydraulics. Plant Physiology 144:1890–1898.
- Brodribb TJ, Holbrook NM, Zwieniecki MA, Palma B. 2005. Leaf hydraulic capacity in ferns, conifers and angiosperms: impacts on photosynthetic maxima. New Phytologist 165:839–846.
- Burslem DFRP, Grubb PJ, Turner IM. 1996. Responses to simulated drought and elevated nutrient supply among shade-tolerant tree seedlings of lowland tropical forest in Singapore. Biotropica 28:636–648.
- Cao K-F. 2000. Water relations and gas exchange of tropical saplings during a prolonged drought in a Bornean heath forest, with reference to root architecture. Journal of Tropical Ecology 16:101–116.
- Carpita N, McCann M. 2000. The cell wall. In: Buchanan B, Gruissem W, Jones R, editors. Biochemistry and molecular biology of plants. Rockville (MD): American Society of Plant Physiologists. p. 52–108.
- Carrick PJ 2001. Shrub community dynamics in a South African semi-desert [ PhD dissertation]. Cambridge: University of Cambridge.
- Carter JO 2014. Available online at Acacia nilotica: a tree legume out of control www.fao.org/ag/agp/APGC/doc/Publicat/Gutt-shel/x556e0v.htm (accessed 17 October 2014).
- Cassab GI. 1998. Plant cell wall proteins. Annual Review of Plant Physiology and Plant Molecular Biology 49:281–309.
- Cellier F, Conejero G, Breitler J-C. 1998. Molecular and physiological responses to water deficit in drought-tolerant and drought-sensitive lines of sunflower. Accumulation of dehydrin transcripts correlates with tolerance. Plant Physiology 116:319–328.
- Cellier F, Conejero G, Casse F. 2000. Dehydrin transcript fluctuations during a day/night cycle in drought-stressed sunflower. Journal of Experimental Botany 51:299–304.
- Chaves MM, Maroco JP, Pereira JS. 2003. Understanding plant responses to drought – from genes to the whole plant. Functional Plant Biology 30:239–264.
- Cherrett JM. 1989. Key concepts: the results of a survey of our members’ opinions. In: Cherrett JM, editor. Ecological concepts. Oxford (UK): Blackwell Scientific Publications. p. 1–16.
- Coley PD. 1983. Herbivory and defensive characteristics of tree species in a lowland tropical forest. Ecological Monographs 53:209–233.
- Condit R, Hubbell SP, Foster RB. 1995. Mortality rates of 205 neotropical tree and shrub species and the impact of severe drought. Ecological Monographs 65:419–439.
- Coomes DA, Grubb PJ. 2000. Impacts of root competition in forests and woodlands: a theoretical framework and review of experiments. Ecological Monographs 70:171–207.
- Coomes DA, Grubb PJ. 2003. Colonization, tolerance, competition and seed-size variation within functional groups. Trends in Ecology & Evolution 18:283–291.
- Cuevas-Velazquez CL, Rendon-Luna DF, Covarrubias AA. 2014. Dissecting the cryoprotection mechanisms for dehydrins. Frontiers in Plant Science 5:1–5.
- Dale IR, Greenway PJ. 1961. Kenya trees and shrubs. Nairobi (Kenya): Buchanan’s Kenya Estates Limited.
- Dalling JW, Winter K, Nason JD, Hubbell SP, Murawski DA, Hamrick JL. 2001. The unusual case of Alseis blackiana, a shade-persistent pioneer tree? Ecology 82:933–945.
- Davies SJ. 2001. Tree mortality and growth in 11 sympatric Macaranga species in Borneo. Ecology 82:920–932.
- De Jong T, Klinkhamer P. 2005. Evolutionary ecology of plant reproductive strategies. Cambridge (UK): Cambridge University Press.
- Dominy NJ, Grubb PJ, Jackson RV, Lucas PW, Metcalfe DJ, Svenning J-C, Turner IM. 2008. In tropical lowland rain forests monocots have tougher leaves than dicots, and include a new kind of tough leaf. Annals of Botany 101:1363–1377.
- Ehleringer JR, Mooney HA. 1978. Leaf hairs: effects on physiological activity and adaptive value to a desert shrub. Oecologia 37:183–200.
- Ellenberg H. 1988. The vegetation ecology of Central Europe. 4th ed. Cambridge (UK): Cambridge University Press.
- Engelbrecht BMJ, Wright SJ, DeSteven D. 2002. Effects of El Nino drought on survival and water relations of seedlings of three neotropical rainforest species in Panama. Journal of Tropical Ecology. 18:569–579.
- Esau K. 1953. Plant anatomy. New York (NY): Wiley.
- Esler KJ, Phillips N. 1994. Experimental effects of water stress on semi-arid Karoo seedlings: implications for field seedling survivorship. Journal of Arid Environments 26:325–337.
- Evans JR. 1989. Photosynthesis and nitrogen relationships in leaves of C3 plants. Oecologia 78:9–19.
- Everist SL. 1964. The Mitchell grass country. Queensland Naturalist 17:45–50.
- Feng Y-L, Lei Y-B, Wang R-F, Callaway RM, Valinete-Banuet A, Inderjit, Li Y-P, Zheng YL. 2009. Evolutionary trade-offs in nitrogen allocation to photosynthesis versus cell walls in an invasive plant. Proceedings of the National Academy of Sciences 106:1853–1856.
- Fenner M, Thompson K. 2005. The ecology of seeds. Cambridge (UK): Cambridge University Press.
- Field C, Mooney H. 1986. The photosynthesis-nitrogen relationship in wild plants. In: Givnish TJ, ed. On the economy of form and function. Cambridge (UK): Cambridge University Press. p. 25–55.
- Flenley JR. 1992. Ultraviolet-B insolation and the altitudinal forest limit. In: Furley PA, Proctor J, Ratter JA, editors. Nature and dynamics of forest-savanna boundaries. London (UK): Chapman and Hall. p. 273–282.
- Flexas J, Barbour MM, Brendel O, Cabrera HM, Carriquí M, Díaz-Espejo A, Douthe C, Dreyer E, Ferrio JP, Gago J, et al. 2012. Mesophyll diffusion conductance to CO2: an unappreciated central player in photosynthesis. Plant Science 193–194:70–84.
- Funk JL, Glenwinkel LA, Sack L. 2013. Differential allocation to photosynthetic and non-photosynthetic nitrogen fractions among native and invasive species. PLOS One 8:1–10.
- Garland T. 2014. Quick guide. Trade-offs. Current Biology 24:R60–R61.
- Gill AM. 1981. Fire adaptive traits of vascular plants. In: Mooney HA, Bonnicksen JM, Christensen NL, Lotan JE, Weiner WA, editors. Fire regimes and ecosystem properties. Washington (DC): USDA Forest Service. General Technical Report 26. p. 208–230.
- Goldberg DE. 1987. Neighbourhood competition in an old-field plant community. Ecology 68:1211–1223.
- Gratani L. 1997. Canopy structure, vertical radiation profile and photosynthetic function of Quercus ilex evergreen forest. Photosynthetica 33:139–149.
- Griffiths H, Helliker BR. 2013. Mesophyll conductance: internal insights of leaf carbon exchange. Plant, Cell & Environment 36:733–773.
- Grubb PJ. 1977. Control of forest growth and distribution on wet tropical mountains: with special reference to mineral nutrition. Annual Review of Ecology and Systematics 8:83–107.
- Grubb PJ. 1984. Some growth points in investigative plant ecology. In: Cooley JH, Golley FB, editors. Trends in ecological research for the 1980s. New York (NY): Plenum Press. p. 51–74.
- Grubb PJ. 1985. Plant populations and vegetation in relation to habitat, disturbance and competition: problems of generalization. In: White J, editor. Handbook of vegetation science. Dordrecht (Netherlands): Junk. Vol. 3 The Population Structure of Vegetation. p. 595–621.
- Grubb PJ. 1986. Sclerophylls, pachyphylls and pycnophylls: the nature and significance of hard leaf surfaces. In: Juniper B, Southwood R, editors. Insects and plant surface. London (UK): Edward Arnold. p. 137–150.
- Grubb PJ. 1989. Toward a more exact ecology: a personal view of the issues. In: Grubb PJ, Whittaker JB, editors. Toward a more exact ecology. Oxford (UK): Blackwell Scientifc Publications. p. 1–29.
- Grubb PJ. 1992. A positive distrust in simplicity: lessons from plant defences and from competition among plants and among animals. Presidential address to the British Ecological Society. Journal of Ecology 80:585–610.
- Grubb PJ. 1996. Rainforest dynamics: the need for new paradigms. In: Edwards DS, Booth WE, Choy SC, editors. Tropical rainforest research: current issues. Dordrecht (Netherlands): Kluwer. p. 215–233.
- Grubb PJ. 1998a. A reassessment of the strategies of plants which cope with shortages of resources. Perspectives in Plant Ecology, Evolution and Systematics 1:3–31.
- Grubb PJ. 1998b. Seeds and fruits of tropical rainforest plants: interpretation of the range in seed size, degree of defence and flesh/seed quotients. In: Newbery DM, Prins HHT, Brown ND, editors. Dynamics of tropical communities. Oxford (UK): Blackwell Science. p. 1–24.
- Grubb PJ, Bellingham PJ, Kohyama TS, Piper FI, Valido A. 2013. Disturbance regimes, gap-demanding trees and seed mass related to tree height in warm temperate rain forests worldwide. Biological Reviews 88:701–744.
- Grubb PJ, Coomes DA, Metcalfe DJ. 2005. Comment on “A Brief History of Seed Size”. Science 310:783a.
- Grubb PJ, Jackson RV, Barberis IM, Bee JN, Coomes DA, Dominy NJ, De La Fuente MAS, Lucas PW, Metcalfe DJ, Svenning J-C, et al. 2008. Monocot leaves are eaten less than dicot leaves in tropical lowland rain forests: correlations with toughness and leaf presentation. Annals of Botany 101:1379–1389.
- Grubb PJ, Lee WG, Kollmann J, Bastow Wilson J. 1996. Interaction of irradiance and soil nutrient supply on growth of seedlings of ten European tall-shrub species and Fagus sylvatica. Journal of Ecology 84:827–840.
- Grubb PJ, Thompson CL, Harper GH. 2014. Why do some evergreen species keep their leaves for a second winter while others lose them? Forests. 5:2594–2612.
- Haberlandt G. 1914. Physiological plant anatomy. London (UK): Macmillan.
- Hanba YT, Kogami H, Terashima I. 2002. The effect of growth irradiance on leaf anatomy and photosynthesis in Acer species differing in light demand. Plant, Cell and Environment 25:1021–1030.
- Hanba YT, Miyazawa S-I, Kogami H, Terashima I. 2001. Effects of leaf age on internal CO2 transfer conductance and photosynthesis in tree species having different types of shoot morphology. Australian Journal of Plant Physiology 28:1075–1084.
- Hanin M, Brini F, Ebel C, Toda Y, Takeda S, Masmoudi K. 2011. Plant dehydrins and stress tolerance: versatile proteins for complex mechanisms. Plant Signaling & Behavior 6:1503–1509.
- Harborne JB. 1993. Introduction to ecological biochemistry. 4th ed. London (UK): Academic Press.
- Hikosaka K. 2004. Interspecific difference in the photosynthesis/ nitrogen relationship: patterns, physiological causes, and ecological importance. Journal of Plant Research 117:481–494.
- Hikosaka K, Hanba YT, Hirose T, Terashima I. 1998. Photosynthetic nitrogen-use efficiency in leaves of woody and herbaceous species. Functional Ecology 12:896–905.
- Hoof J, Sack L, Webb DT, Nilsen ET. 2008. Contrasting structure and function of glabrous and pubescent varieties of Hawaiian Metrosideros polymorpha (Myrtaceae) at high elevation. Biotropica 40:113–118.
- Hou H-Y. 1983. Vegetation of China with reference to its geographical distribution. Annals of the Missouri Botanical Garden 70:509–548.
- Hubbell SP, Foster RB. 1992. Short-term dynamics of a neotropical forest - why ecological research matters to tropical conservation and management. Oikos 63:48–61.
- Iio A, Fukasawa H, Nose Y, Kato S, Kakubari Y. 2005. Vertical, horizontal and azimuthal variations in leaf photosynthetic characteristics within a Fagus crenata crown in relation to light acclimation. Tree Physiology 25:533–544.
- Ingram J, Bartels D. 1996. The molecular basis of dehydration tolerance in plants. Annual Review of Plant Physiology and Plant Molecular Biology. 47:377–403.
- Johnson RW, Tothill JC. 1985. Definition and broad geographic outline of savanna lands. In: Tothill JC, Mott JJ, editors. Ecology and management of the world’s savannas. Canberra (Australia): Australian Academy of Sciences, in association with Commonwealth Agricultural Bureaux, Farnham Royal. p. 1–13.
- Jolivet Y, Larher F, Hamelin J. 1982. Osmoregulation in halophytic higher plants: the protective effect of glycine betaine against the heat destabilization of membranes. Plant Science Letters 25:193–201.
- Jones DA. 1972. Cyanogenic glycosides and their function. In: Harborne JB, editor. Phytochemical ecology. London (UK): Academic Press. p. 103–124.
- Kiew R. 1988. Herbaceous flowering plants. In: Earl of Cranbrook, editor. Malaysia. Oxford (UK): Pergamon Press. p. 56–76.
- Kitajima K. 1994. Relative importance of photosynthetic traits and allocation patterns as correlates of seedling shade tolerance of 13 tropical trees. Oecologia 98:419–428.
- Kitajima K, Bolker BM. 2003. Testing performance rank reversals among coexisting species: crossover point irradiance analysis by Sack & Grubb (2001) and alternatives. Functional Ecology 17:276–281.
- Kitajima K, Llorens A-M, Stefanescu C, Timchenko MV, Lucas PW, Wright SJ. 2012. How cellulose-based leaf toughness and lamina density contribute to long leaf lifespans of shade tolerant species. New Phytologist 195:640–652.
- Kitajima K, Poorter L. 2010. Tissue-level leaf toughness, but not lamina thickness, predicts sapling leaf lifespan and shade tolerance of tropical tree species. New Phytologist 186:708–721.
- Kneitel JM, Chase JM. 2004. Trade-offs in community ecology: linking spatial scales and species coexistence. Ecology Letters 7:69–80.
- Kobe RK. 1999. Light gradient partitioning among tropical tree species through differential seedling mortality and growth. Ecology 80:187–201.
- Kobe RK, Pacala SW, Silander JAJ, Canham CD. 1995. Juvenile tree survivorship as a component of shade tolerance. Ecological Applications 5:517–532.
- Kogami H, Hanba YT, Kibe T, Terashima I, Masuzawa T. 2001. CO2 transfer conductance, leaf structure and carbon isotope composition of Polygonum cuspidatum leaves from low and high altitudes. Plant, Cell and Environment 24:529–538.
- Kohyama T. 1987. Significance of architecture and allometry in saplings. Functional Ecology 1:399–404.
- Kohyama T, Grubb PJ. 1994. Below- and above-ground allometries of shade-tolerant seedlings in a Japanese warm-temperate rain forest. Functional Ecology 8:229–236.
- Kohyama T, Hotta M. 1990. Significance of allometry in tropical saplings. Functional Ecology 4:515–521.
- Kollmann J, Grubb PJ. 2003. Biological Flora of the British Isles. 226. Viburnum lantana L. and Viburnum opulus L. (V. lobatum Lam., Opulus vulgaris Borkh.). Journal of Ecology 90:1044–1070.
- Körner C, Allinson A, Hilscher H. 1983. Altitudinal variation in leaf diffusive conductance and leaf anatomy in heliophytes of montane New Guinea and their inter-relation with microclimate. Flora 174:91–135.
- Labhili M, Joudrier P, Gautier M-F. 1995. Characterization of cDNAs encoding Triticum durum dehydrins and their expression patterns in cultivars that differ in drought tolerance. Plant Science 112:219–230.
- Lamport DTA. 1965. The protein component of primary cell walls. Advances in Botanical Research 2:151–218.
- Latham RE. 1992. Co-occuring tree species change rank in seedling performance with resources varied experimentally. Ecology 73:2129–2144.
- Lechmere-Oertel RG, Cowling RM. 2001. Abiotic determinants of the fynbos/succulent karoo boundary, South Africa. Journal of Vegetation Science 12:75–80.
- Loach K. 1970. Shade tolerance in tree seedlings. 2. Growth analysis of plants raised under artificial shade. New Phytologist 69:273–286.
- Markham RH, Babbedge AH. 1979. Soil and vegetation catenas on the forest-savanna boundary in Ghana. Biotropica 11:224–234.
- Medina E, Garcia V, Cuevas E. 1990. Sclerophylly and oligotrophic environments: relationships between leaf structure, mineral nutrients content and drought resistance in tropical rain forests of upper Rio Negro region. Biotropica 22:51–64.
- Medina E, Sobrado M, Herrera R. 1978. Significance of leaf orientation for leaf temperature in an Amazonian sclerophyll vegetation. Radiation and Environmental Biophysics 15:131–140.
- Merino J, Field C, Mooney HA. 1984. Construction and maintenance costs of Mediterranean evergreen and deciduous leaves. Acta Oecologia 5:211–219.
- Metcalfe CR. 1960. Anatomy of the monocotyledons. I. Gramineae. Oxford (UK): Clarendon Press.
- Metcalfe CR. 1983. Silica and calcified deposits, calcified cell walls, cystoliths and similar structures. In: Metcalfe CR, Chalk L, editors. Anatomy of the dicotyledons. 2nd ed. Vol. 2. Oxford (UK): Clarendon Press. p. 91–97.
- Metcalfe CR, Chalk Y. 1950. Anatomy of the dicotyledons, Vols 1 and 2. Oxford (UK): Clarendon Press.
- Metcalfe DJ, Grubb PJ. 1997. The responses to shade of seedlings of very small-seeded tree and shrub species from tropical rain forest in Singapore. Functional Ecology 11:215–221.
- Metcalfe DJ, Grubb PJ, Turner IM. 1998. The ecology of very small-seeded shade-tolerant trees and shrubs in lowland rain forest in Singapore. Plant Ecology 134:131–149.
- Minoletti ML, Boerner REJ. 1994. Drought and site fertility effects on foliar nitrogen and phosphorus dynamics and nutrient resorption by the forest undershrub Viburnum acerifolium L. American Midland Naturalist 131:109–119.
- Muller-Landau HC, Wright SJ, Calderón O, Condit R, Hubbell SP. 2008. Interspecific variation in primary seed dispersal in a tropical forest. Journal of Ecology 96:653–667.
- Nagy L, Proctor J. 2000. Leaf δ13C signatures in heath and lowland evergreen rain forest species from Borneo. Journal of Tropical Ecology 16:757–761.
- Nieuwolt S. 1965. Evaporation and water balances in Malaya. Journal of Tropical Geography 20:34–53.
- Niinemets Ü, Keenan TF, Hallik L. 2014. A worldwide analysis of within-canopy variations in leaf structural, chemical and physiological traits across plant functional types. New Phytologist 205:973–993.
- Niinemets Ü, Valladares F. 2006. Tolerance to shade, drought, and waterlogging of temperate northern hemisphere trees and shrubs. Ecological Monographs 76:521–547.
- Niklas KJ, Cobb ED, Niinemets Ü, Reich PB, Sellin A, Shipley B, Wright IJ. 2007. “Diminishing returns” in the scaling of functional leaf traits across and within species groups. Proceedings of the National Academy of Sciences of the USA 104:8891–8896.
- Nobel PS. 1977. Internal leaf area and cellular CO2 resistance: photosynthetic implications of variations with growth conditions and plant species. Physiologia Plantarum 40:137–144.
- Onoda Y, Hikosaka K, Hirose T. 2004. Allocation of nitrogen to cell walls decreases photosynthetic nitrogen-use efficiency. Functional Ecology 18:419–425.
- Osunkoya OO, Ash JE, Hopkins MS, Graham AW. 1994. Influence of seed size and seedling ecological attributes on shade-tolerance of rain-forest tree species in northern Queensland. Journal of Ecology 82:149–163.
- Pacala SW, Canham CD, Saponara J, Silander JA, Kobe RK, Ribbens E. 1996. Forest models defined by field measurements, estimation, error analysis and dynamics. Ecological Monographs 66:1–43.
- Paleg LG, Douglas TJ, Van Daal A, Keech DB. 1981. Proline, betaine and other organic solutes protect enzymes against heat inactivation. Australian Journal of Plant Physiology 8:107–114.
- Papageorgiou GC, Murata N. 1995. The unusually strong stabilizing effects of glycine betaine on the structure and function of the oxygen-evolving photosystem II complex. Photosynthesis Research 44:243–252.
- Pelah D, Shoseyov O, Altman A, Bartels D. 1997. Water-stress response in aspen (Populus tremula): differential accumulation of dehydrin, sucrose synthase, GAPDH homologues, and soluble sugars. Journal of Plant Physiology 151:96–100.
- Pivovaroff A, Sharifi R, Scoffoni C, Sack L, Rundel P. 2013. Making the best of the worst times: traits underlying combined shade and drought tolerance of Ruscus aculeatus and Ruscus microglossum (Asparagaceae). Functional Plant Biology 41:11–24.
- Pollard A, Wyn Jones R. 1979. Enzyme activities in concentrated solutions of glycine betaine and other solutes. Planta 144:291–298.
- Potts MD. 2003. Drought in a Bornean everwet rain forest. Journal of Ecology 91:467–474.
- Rackham O. 1966. Radiation, transpiration, and growth in a woodland annual. In: Bainbridge R, Evans GC, Rackham O, editors. Light as an ecological factor. Oxford (UK): Blackwell Scientific Publications. p. 167–185.
- Reich PB. 1993. Reconciling apparent discrepancies among studies relating life span, structure and function of leaves in contrasting plant life forms and climates: ‘the blind men and the elephant retold’. Functional Ecology 7:721–725.
- Reich PB, Ellsworth DS, Walters MB, Vose JM, Gresham C, Volin JC, Bowman WD. 1999. Generality of leaf trait relationships: a test across six biomes. Ecology 80:1955–1969.
- Reich PB, Uhl C, Walters M, Prugh L, Ellsworth DS. 2004. Leaf demography and phenology in amazonian rain forest: a census of 40 000 leaves of 23 tree species. Ecological Monographs 74:3–23.
- Rodin LE, Bazilevich NI. 1967. Production and mineral cycling in terrestrial vegetation. Edinburgh (Scotland): Oliver and Boyd.
- Roth I. 1990. Leaf structure of a Venezuelan cloud forest in relation to the microclimate. Handbuch der Pflanzenanatomie 14:1–244.
- Sack L. 2004. Responses of temperate woody seedlings to shade and drought: do trade-offs limit potential niche differentiation? Oikos 107:110–127.
- Sack L, Grubb PJ. 2001. Why do species of woody seedlings change rank in relative growth rate between low and high irradiance? Functional Ecology 15:145–154.
- Sack L, Grubb PJ. 2002. The combined impacts of deep shade and drought on the growth and biomass allocation of shade-tolerant woody seedlings. Oecologia 131:175–185.
- Sack L, Grubb PJ. 2003. Cross-overs in seedling relative growth rates between low and high irradiance: analyses and ecological potential (reply to Kitajima & Bolker 2003). Functional Ecology 17:281–287.
- Sack L, Grubb PJ, Marañón T. 2003. The functional morphology of juvenile plants tolerant of strong summer drought in shaded forest understories in southern Spain. Plant Ecology 168:139–163.
- Sack L, Holbrook NM. 2006. Leaf hydraulics. Annual Review of Plant Biology 57:361–381.
- Sack L, Scoffoni C, John GP, Poorter H, Mason CM, Mendez-Alonzo R, Donovan LA. 2013. How do leaf veins influence the worldwide leaf economic spectrum? Review and synthesis. Journal of Experimental Botany 64:4053–4080.
- Sakamoto A, Murata N. 2002. The role of glycine betaine in the protection of plants from stress: clues from transgenic plants. Plant, Cell and Environment 25:163–171.
- Sancho-Knapik D, Peguero-Pina JJ, Flexas J, Herbette S, Cochard H, Niinemets Ü, Gil-Pelegrín E. 2014. Coping with low light under high atmospheric dryness: shade acclimation in a Mediterranean conifer (Abies pinsapo Boiss.). Tree Physiology 34:1321–1333.
- Sarmiento G. 1983. The savannas of tropical America. In: Bourlière P, editor. Ecosystems of the World, Vol. 13. Tropical Savannas. Amsterdam (Netherlands): Elsevier. p. 245–288.
- Sarmiento G, Monasterio M. 1983. Life forms and phenology. In: Bourlière P, editor. Ecosystems of the World, Vol. 13. Tropical Savannas. Amsterdam (Netherlands): Elsevier. p. 79–108.
- Schneider K, Wells B, Schmelzer E, Salamini F, Bartels D. 1993. Desiccation leads to the rapid accumulation of both cytosolic and chloroplastic proteins in the resurrection plant Craterostigma plantagineum Hochst. Planta 189:120–131.
- Schulze E-D, Kelliher FM, Körner C, Lloyd J, Leuning R. 1994. Relationships among maximum stomatal conductance, ecosystem surface conductance, carbon assimilation rate, and plant nitrogen nutrition: a global ecology scaling exercise. Annual Review of Ecology and Systematics 25:629–662.
- Shipley B, Lechowicz MJ, Wright I, Reich PB. 2006. Fundamental trade-offs generating the worldwide leaf economics spectrum. Ecology 87:535–541.
- Silvertown J, Dodd ME, Gowing D, Mountford O. 1999. Hydrologically defined niches reveal a basis for species-richness in plant communities. Nature 400:61–63.
- Simpson JA, Weiner ESC. 1989. The Oxford English dictionary, Vol. 18. Thro- Unelucidated. Oxford (UK): Clarendon Press.
- Singh BB, Hadley HH, Bernard RL. 1971. Morphology of pubescence in soybeans and its relation to plant vigour. Crop Science 11:13–16.
- Slavíková J. 1958. Einfluss der Buche (Fagus sylvatica L.) als Edifikator auf die Entwicklung der Krautschicht in Buchen Phytozönosen. Preslia 30:19–42.
- Smirnoff N, Cumbes QJ. 1989. Hydroxyl radical scavenging activity of compatible solutes. Phytochemistry 28:1057–1060.
- Smirnoff N, Stewart GR. 1985. Stress metabolites and their role in coastal plants. Vegetatio 62:273–278.
- Smith AP, Hogan KP, Idol JR. 1992. Spatial and temporal patterns of light and canopy structure in a lowland tropical moist forest. Biotropica 24:503–511.
- Smith T, Huston M. 1989. A theory of the spatial and temporal dynamics of plant communities. Vegetatio 83:49–69.
- Solereder H. 1908. Systematic Anatomy of the Dicotyledons, Vols 1 & 2. Oxford (UK): Clarendon.
- Song Y. 1988. The essential characteristics and main types of the broad-leaved evergreen forest in China. Phytocoenologia 16:105–123.
- Stearns SC. 1989. Trade-offs in life-history evolution. Functional Ecology 3:259–268.
- Takashima T, Hikosaka K, Hirose T. 2004. Photosynthesis or persistence: nitrogen allocation in leaves of evergreen and deciduous Quercus species. Plant, Cell and Environment 27:1047–1054.
- Tanner EVJ, Barberis IM. 2007. Trenching increased growth, and irrigation increased survival of tree seedlings in the understory of a semi-evergreen forest in Panama. Journal of Tropical Ecology 23:257–268.
- Terashima I, Hanba YT, Tazoi Y, Vyas P, Yano S. 2006. Irradiance and phenotype: comparative eco-development of sun and shade leaves in relation to photosynthetic CO2 diffusion. Journal of Experimental Botany 57:343–354.
- Terashima I, Hanba YT, Tholen D, Niinemets Ü. 2011. Leaf functional anatomy in relation to photosynthesis. Plant Physiology 155:108–116.
- Thomson FJ, Moles AT, Auld TD, Kingsford RT. 2011. Seed dispersal distance is more strongly correlated with plant height than with seed mass. Journal of Ecology 99:1299–1307.
- Tilman D. 1988. Plant strategies and the dynamics and structure of plant communities. Princeton (NJ): Princeton University Press.
- Tilman D. 1994. Competition and biodiversity in spatially structured habitats. Ecology 75:2–16.
- Tinley KL. 1982. The influence of soil moisture balance on ecosystem patterns in southern Africa. In: Huntley BJ, Walker BH, editors. Ecology of tropical savannas. Berlin (Germany): Springer. p. 175–192.
- Tobin MF, Lopez OR, Kursar TA. 1999. Responses of tropical understory plants to a severe drought: tolerance and avoidance of water stress. Biotropica 31:570–578.
- Tolleter D, Hincha DK, Macherel D. 2010. A mitochondrial late embryogenesis abundant protein stabilizes model membranes in the dry state. Biochimica et Biophysica Acta (BBA) - Biomembranes 1798:1926–1933.
- Tomás M, Flexas J, Copolovici L, Galmés J, Hallik L, Medrano H, Ribas-Carbó M, Tosens T, Vishap V, Niinemets Ü. 2013. Importance of leaf anatomy in determining mesophyll diffusion conductance to CO2 across species: quantitative limitations and scaling up by models. Journal of Experimental Botany 64:2269–2281.
- Tomlinson PB. 1969. Anatomy of the monocotyledons. III. Commelinales-Zingiberales. Oxford (UK): Clarendon Press.
- Tosens T, Niinemets Ü, Westoby M, Wright IJ. 2012. Anatomical basis of variation in mesophyll resistance in eastern Australian sclerophylls: news of a long and winding path. Journal of Experimental Botany 63:5105–5119.
- Tracey JG. 1982. The vegetation of the humid tropical region of North Queensland. Melbourne (Australia): CSIRO.
- Tutin TG, Heywood VH, Burges NA, Valentine DH, Walters SM, Webb DA, editors. 1964–1976. Flora Europaea, Vols 1–4. Cambridge (UK): Cambridge University Press.
- Vesey-Fitzgerald DF. 1963. Central African grasslands. Journal of Ecology 51:243–273.
- Walter H. 1968. Die Vegetation der Erde in ökophysiologischer Betrachtung. Band II. Die gemässigten und arktischen Zonen. Jena (Germany): Fischer.
- Walter H, Lieth H. 1960–1967. Klimadiagrammen-Weltatlas. Jena (Germany): Fischer.
- Walters MB, Field CB. 1987. Photosynthetic light acclimation in two rainforest Piper species with different ecological amplitudes. Oecologia 72:449–456.
- Walters MB, Reich PB. 1996. Are shade-tolerance, survival, and growth linked? Low light and nitrogen effects on hardwood seedlings. Ecology 77:841–853.
- Wang C-W. 1961. The forests of China. Cambridge (MA): Maria Moors Cabot Foundation.
- Webb LJ. 1959. A physiognomic classification of Australian rain forests. Journal of Ecology 47:551–570.
- Werger MJA, Hirose T. 1988. Effects of light climate and nitrogen partitioning on the canopy structure of stands of a dicotyledonous, herbaceous vegetation. In: Werger MJA, van der Aart PJM, During HJ, Verhoeven JTA, editors. Plant form and vegetation structure. Adaptation, plasticity and relation to herbivory. The Hague (Netherlands): SPB Publishing. p. 171–181.
- Westbrook JW, Kitajima K, Burleigh JG, Kress WJ, Erickson DL, Wright SJ. 2011. What makes a leaf tough? Patterns of correlated evolution between leaf toughness traits and demographic rates among 197 shade tolerant woody species in a neotropical forest. The American Naturalist 177:800–811.
- Whitmore TC. 1998. An introduction to tropical rain forests. 2nd ed. Oxford (UK): Oxford University Press.
- Wirth R, Weber B, Ryel RJ. 2001. Spatial and temporal variability of canopy structure in a tropical moist forest. Acta Oecologica 22:235–244.
- Wright IJ, Groom PK, Lamont BB, Prior LD, Reich PB, Schulze E-D, Veneklaas EJ, Westoby M. 2004b. Leaf trait relationships in Australian plant species. Functional Plant Biology 31:551–558.
- Wright IJ, Reich PB, Cornelissen JHC, Falster DS, Garnier E, Hikosaka K, Lamont BB, Lee W, Oleksyn J, Osada N, et al. 2005. Assessing the generality of global leaf trait relationships. New Phytologist 166:485–496.
- Wright IJ, Reich PB, Westoby M. 2001. Strategy shifts in leaf physiology, structure and nutrient content between species of high- and low-rainfall and high- and low-nutrient habitats. Functional Ecology 15:423–434.
- Wright IJ, Reich PB, Westoby M, Ackerly DD, Baruch Z, Bongers F, Cavender-Bares J, Chapin T, Cornelissen JHC, Diemer M, et al. 2004a. The worldwide leaf economics spectrum. Nature 428:821–827.
- Wright IJ, Westoby M. 2002. Leaves at low versus high rainfall: coordination of structure, lifespan and physiology. New Phytologist 155:403–416.
- Wright IJ, Westoby M, Reich PB. 2002. Convergence towards higher leaf mass per area in dry and nutrient-poor habitats has different consequences for leaf life span. Journal of Ecology 90:534–543.
- Wright SJ, Machado JL, Mulkey SS, Smith AP. 1992. Drought acclimation among tropical forest shrubs (Psychotria, Rubiaceae). Oecologia 89:457–463.
- Wu CY. 1987. Vegetation of Yunnan. In Chinese with English table headings. Beijing (China): Science Press.
- Zablackis E, Huang J, Müller B, Darvill AG, Albersheim P. 1995. Characterization of the cell-wall polysaccharides of Arabidopsis thaliana leaves. Plant Physiology 107:1129–1138.
- Zohary M. 1973. Geobotanical foundations of the Middle East. Stuttgart (Germany): Fischer, and Amsterdam: Swets and Zweitlinger.
Appendix 1
Supplementary observations of deviations from the trend lines of the worldwide leaf economic spectrum
Variation about the LMA vs. Nmass trend line
Allocation of lamina C to spines can bring an advantage to some species in climbing and thus reaching higher irradiance, but most often provides defence against larger herbivores. I have interpreted elsewhere the contradictory patterns of occurrence, e.g. on deciduous species in one kind of mixed evergreen–deciduous forest and on evergreen species in another kind of mixed evergreen–deciduous forest (Grubb Citation1992).
Allocation of lamina C to hairs on plants in dry climates has long been thought to be of value either in reducing the rate of transpiration or in keeping the lamina temperature near to what is optimal for net assimilation by reflecting light when the air temperature is very high, and the latter case was proven for Encelia farinosa in California by Ehleringer and Mooney (Citation1978). On plants in mesic climates, allocation of lamina C to hairs, even those which are not sticky or stinging, is probably of greatest value in deterring small herbivores, and that was proven neatly by Singh et al. (Citation1971) using single-gene mutants of the cultivar Harosoy of soya bean (Glycine max).
Allocation of C to fibres is of value to many species with relatively long narrow leaves, as in many grasses and sedges all over the world, by increasing stiffness and thus providing support. Fibres are equally important in this way for many monocots of tropical and warm temperate regions with huge leaves, notably palms. The fibres also give the leaves greater toughness (Dominy et al. Citation2008), and it is likely that this toughness has a significant effect in deterring herbivores (Grubb et al. Citation2008). Collenchyma along the vascular bundles is likely to be of value chiefly in support, especially leaves with otherwise thin walls (Grubb Citation1986).
Allocation of C to colourless tissues within leaves of such drought-tolerant plants as members of the Proteaceae in Mediterranean-climate vegetation in Australia (Metcalfe and Chalk Citation1950) or Ruscus aculeatus in the Mediterranean Basin (Sack et al. Citation2003) is persuasively of value in water storage, and likewise the colourless tissue of succulent epiphytes in the Bromeliacae, Orchidaceae and Peperomia, illustrated by P. trichocarpa shown long ago to give up its water to the photosynthetic mesophyll as the leaf dries (Haberlandt Citation1914).
In contrast, colourless water-storing tissue within or around the mesophyll in many terrestrial monocotyledons of tropical rainforests is not expected, but it is well developed. Bands of colourless cells are found within the mesophyll of most bamboos and several genera of non-bamboo grasses found on the forest floor, such as Leptaspis in the Old World and Olyra, Pharus, Streptochaeta and Streptogyna in the New World (Metcalfe Citation1960), and also in the Hanguanaceae (Tomlinson Citation1969). A colourless hypodermis, sometimes more than one cell thick, inside both upper epidermis and lower epidermis is widespread in herbs of the forest floor belonging to the Commelinaceae, and all eight families in the Zingiberales (Tomlinson Citation1969). These two kinds of water store were considered to be a puzzle by Roth (1990). Perhaps they are of value to plants on the forest floor chiefly when leaves are briefly illuminated by very bright sunflecks which could heat the leaf to a damaging degree if an appreciable rate of transpiration were not maintained. Among dicotyledonous trees and shrubs, the incidence of a hypodermis (almost always under only the upper epidermis) was found to increase greatly with altitude in trees and shrubs in Papua New Guinea (25% of species in lowland rainforest, 61% in subalpine rainforest; Grubb Citation1977). It has been suggested that the tissue functions in protection of the photosynthetic tissue against increased UV-radiation at higher altitude (Flenley Citation1992), but no critical physiological work has been done on this issue.
In a few families, the N concentration in the cell walls is lowered by the deposition of silica (Esau Citation1953; Metcalfe Citation1983); this is likely to reduce palatability to herbivores. Rodin and Bazilevich (Citation1967) reported foliar Si concentrations for numerous species in a wide range of vegetation types. For 25 warm and cool temperate deciduous tree species, the mean Si concentration was ca. 6 mg g−1 dry mass, and the highest concentrations were found in Ulmus (15–27), Celtis (25) and Morus (14) – all in the Urticalean clade of the Rosales. The highest value recorded for a tree dicot was for Lagerstroemia flos-reginae (Lythraceae, Myrtales; 57 mg g−1) collected in Myanmar. It is possible that the value is higher for climbers and shrubs in the genus Tetracera (Dilleniacae), which has such a deposit of silica on the surface that it can be used as a substitute for sandpaper (Metcalfe Citation1983).
The highest value recorded for a grass was in a bamboo (Arundinaria sp.) found in China (70 mg g−1), but grasses are particularly rich in silica bodies (phytoliths) within the protoplast (Metcalfe and Chalk Citation1950; Metcalfe Citation1983), and these may contribute appreciably to the total Si concentration. None of the Si values recorded by Rodin and Bazilevich (Citation1967) for the whole shoots (stem + leaf) of grasses in steppe is higher than 29 mg g−1. If 30–50% of the dry mass of the lamina is in the cell walls, as found by Merino et al. (Citation1984), then the highest accumulations of silica recorded in the whole lamina (say 2.5–5.5% of dry mass as Si, 5.4–11.8% as SiO2) amount to 11–39% of the cell wall fraction – enough to cause an appreciable deviation from the trend line for LMA on Nmass for a few species. There are likely to be even fewer cases of significant deviation from the trend line arising from calcification of cell walls or presence of cystoliths, which are much less widely distributed (Solereder Citation1908; Metcalfe Citation1983).
Examples of the concentrations of the three major deterrent N-containing compounds in leaves (alkaloids, cyanogenic glycosides and glucosinolates) are given in Table S1. I have pointed out elsewhere the inadequacy of early theories on plant defences in providing a rationale for which species contain such compounds, and I have given a revised analysis (Grubb Citation1992). Early work on cyanogens concentrated on legumes, Linum and Prunus (Jones Citation1972), but more recently, species of Eucalyptus and many tropical rainforest plants have been studied critically.
The earliest research on N-containing compounds providing protection against drought and/or salinity dealt with the imino acid proline and the quaternary N compound glycinebetaine (Harborne Citation1993), but later studies revealed the involvement of several related compounds (Table S2). Initially, these various compounds were seen simply as providing an osmoticum in the cytoplasm that was compatible with the cell’s metabolic systems while matching the accumulation in the vacuole of solutes that would inhibit metabolism. Later research yielded evidence that at least in some cases one or more of the N-containing compounds can provide in vitro stabilising effects on enzymes (Pollard and Wyn Jones Citation1979) and membranes (Papageorgiou and Murata Citation1995; Sakamoto and Murata Citation2002), increase resistance to heat inactivation of enzymes (Paleg et al. Citation1981; Smirnoff and Stewart Citation1985) and membranes (Jolivet et al. Citation1982), and protection against damage by free radicals (Smirnoff and Cumbes Citation1989). Examples of the concentrations of glycinebetaine, proline and proline analogues in plants tolerant of drought and/or salinity are given in Table S2.
The concentrations of N in these solutes are mostly in the same range as those found for compounds deterring herbivores, but the range in Triglochin is much higher.
Late embryogenesis abundant (LEA) proteins, first studied in seeds, have been known for more than 20 years to increase in abundance in the leaves of plants subjected to desiccation (Bray Citation1993; Ingram and Bartels Citation1996). LEA proteins fall into at least seven groups or families, based on amino-acid composition (Battaglia et al. Citation2008). Those in Group 2 (also known as D11) have been the most studied (Hanin et al. Citation2011); they are also known as dehydrins (DHNs).
LEA proteins occur within organelles as well as in the cytosol (Schneider et al. Citation1993). They are small, strongly hydrophilic proteins, mostly of molecular mass 10–60 kDa (Cuevas-Velazquez et al. Citation2014). The latter authors have reviewed the evidence that LEA proteins are of value in resisting desiccation, and the possible mechanisms that have been proposed.
Most studies comparing drought-sensitive and drought-tolerant biotypes within species report changes in the relevant RNAs rather than the protein product, but Schneider et al. (Citation1993) found that the LEA proteins they were studying in the ‘resurrection plant’ Craterostigma plantagineum amounted to 0.1–1% of the total protein in their leaf extracts. In various species, the mRNA transcripts for one or more DHNs accumulated to a great extent in drought-tolerant biotypes than in drought-sensitive biotypes: in Triticum durum (Labhili et al. Citation1995), Helianthus annuus (Cellier et al. Citation1998) and Populus tremula (Pelah et al. Citation1997). In Helianthus, there was evidence of marked diurnal fluctuation in the concentration of one DHN, with the maximum around 1200–1300 h in both mildly and strongly dehydrated plants (Cellier et al. Citation2000). In all reports the concentrations of the transcripts are very low in non-droughted plants. It is therefore possible that in the leaves of fully hydrated plants, such as are used in standardised measurements of Amass, the concentrations of LEA proteins are very low, and interspecific differences are unlikely to contribute appreciably to scatter about the Amass–Nmass trend line.
The N content of cell walls was generally overlooked in earlier physiological studies, but as reported by Cassab (Citation1998) and Carpita and McCann Citation2000), between 1960 and 2000, at least nine groups of N-containing compounds in plant cell walls were characterised ( in main text). The majority fall into the first three of the groups listed, and hundreds of distinct proteins are known in the first group. The first two groups are cross-linked into the wall and are believed to have structural functions, while the third group may play a major role in cell–cell interactions during development.
Variation about the Amass vs.Nmass trend line
Despite the early date of the pioneering papers analysing the resistance to diffusion of CO2 in the mesophyll cells (Rackham Citation1966; Nobel Citation1977), general appreciation that variation in the thickness of the mesophyll cell walls, the activity of carbonic anhydrase, the abundance of aquaporins and the position of chloroplasts might be important has come chiefly since 2000 (Flexas et al. Citation2012; Griffiths and Helliker Citation2013).
The initial study by the Terashima group on the contrast in PNUE between species with shorter- and longer-lived leaves (Hikosaka et al. Citation1998) involved the herb Chenopodium album and tree Quercus myrsinaefolia. They found small differences in the resistance to diffusion of CO2 through the stomata and through the mesophyll cell walls, and similarly modest differences in the allocation of N to RuBPCase and in the specific activity of the RuBPCase, all ‘favouring’ the Chenopodium, but later studies have revealed major differences in the allocation of N to walls as opposed to RuBPCase (see main text).
Appendix 2
Supplementary information on leaf-drop during droughts
In northern temperate deciduous forest
Observations on the responses of tree and shrub species in woods near Cambridge, UK, on soils derived from boulder clay were made during droughts in 1973, 1975–76, 1989 and 1990. The symptoms were much less marked, if present at all, on soils derived from chalk; they have a greater content of available water. The observations were made on juveniles and adults. The woody species could be assigned to four groups. Nomenclature follows Tutin et al. (Citation1964–1976).
No obvious response, i.e. no wilting or change in leaf colour: Acer campestre, Quercus robur and Rhamnus catharticus.
Leaves wilted markedly but did not die or change colour, and regained their turgor when rain broke the drought: Cornus sanguinea, Euonymus europaeus, Viburnum lantana and V. opulus; Ligustrum vulgare was similar but wilted only slightly.
Dropped many of their leaves, if not all: Carpinus betulus, Corylus avellana, Fraxinus excelsior and Ulmus carpinifolia.
Dropped a smaller proportion of leaves: Crataegus laevigata, C. monogyna, Prunus spinosa, Rosa arvensis and R. canina.
Leaves turned yellow or brown, curled up and died on the tree or shrub: Fagus sylvatica (sometimes leaves fell), Populus tremula, Salix caprea and Sambucus nigra.
In low-rainfall tropical lowland rainforest
Observations on the responses of trees and shrub species in remnant stands of seasonally droughted rainforest (Type 5a of Tracey Citation1982) were made during October 1992 towards the end of the strongest drought in northern Queensland in the twentieth century. The principal sites used were Lake Eacham National Park (17°16ʹ52″ S, 145°37ʹ45″ E, ca. 760 m altitude), Tolga Scrub (17°14ʹ15″ S, 145°28ʹ48″ E, ca. 770 m), Wongabel State Forest (17°19ʹ50″ S, 145°30ʹ15″ E, ca. 770 m),and a few observations were made in Curtain Fig National Park (17°16ʹ54″ S, 145°34ʹ10″ E, ca. 740 m). Observations were made on shoots up to ca. 3 m above the ground level. The responses are given separately for shade-tolerant and gap-demanding species. Nomenclature follows Bostock and Holland (Citation2007).
Shade-tolerant species
No sign of wilting or change in colour: (a) shrub Cordyline cannifolia, (b) trees Alphitonia whitei, Arytera divaricata, Brachychiton acerifolius, Castanopsermum australe, Cupaniopsis flagelliformis, Harpullia pendula and Mischocarpus grandissimus.
Wilted to varying degrees (*few or very few leaves or leaflets fallen): (a) shrubs or treelets not taller than 7 m, Codiaeum variegatum*, Dichapetalum papuanum, Hodgkinsonia frutescens*, Mackinlaya macrosciadia, Phaleria octandra, Pittosporum rubiginosum, and (b) trees, Aglaia sapindina*, Argyrodendron peralatum, Castanospora alphandii, Cinnamomum laubatii, Cryptocarya hypsopodia, C. mackinnoniana, C. pleurocarpa, Fontainea picrosperma, Franciscodendron laurifolium, Goniothalamus australis, Litsea leefeana, Mallotus philippensis, Myristica globosa ssp. muelleri, Neisosperma poweri, Neolitsea brassii, N. dealbata, Pilidiostigma tropicum and Tetrasynandra laxiflora.
Gap-demanding species
No sign of wilting or change in colour: shrub or treelet, Dendrocnide moroides; trees Acronychia vestita, Pipturus argenteus and Polyscias elegans (all four evergreen), Aleurites moluccana (tall trees lost leaves, but juveniles seen only rarely do so) and Melia azedirach (tall trees regularly deciduous, but not juveniles).
Wilted to varying degrees but leaves not yellowing or fallen: (a) shrubs or treelets, not taller than 7 m, Breynia cernua, Sambucus australasica, Solanum viridifolium, (b) trees, Dendrocnide photinophylla, Homalanthus novoguineensis, Mallotus mollissimus, Polyscias australiana (all evergreen) and Toona australis (tall trees regularly deciduous but not juveniles).