
Abstract
Background: In tundra ecosystems, the adjustment of phenological events, such as bud burst, to snowmelt timing is crucial to the climatic adaptation of plants. Natural small-scale variations in microclimate potentially enable plant populations to persist in a changing climate.
Aims: To assess how plant phenology responds to natural differences in snowmelt timing.
Methods: We observed the timing of eight vegetative and reproductive phenophases in seven dwarf-shrub species in relation to differences in snowmelt timing on a small spatial scale in an alpine environment in subarctic Finland.
Results: Some species and phenophases showed accelerated development with later snowmelt, thus providing full or partial compensation for the shorter snow-free period. Full compensation resulted in synchronous occurrence of phenophases across the snowmelt gradient. In other species, there was no acceleration of development. The timing of phenophases varied between two consecutive years and two opposing mountain slope aspects.
Conclusions: The results have shown three distinct patterns in the timing of phenophases in relation to snowmelt and suggest alternative strategies for adaptation to snowmelt timing. These strategies potentially apply to other species and tundra ecosystems and provide a framework, enabling one to compare and generalise phenological responses to snowmelt timing under different future climate scenarios.
Introduction
In high-latitude and high-elevation ecosystems, snow cover can last for several months, profoundly affecting seasonal dynamics and plant life (Jonas et al. Citation2008; Estilow et al. Citation2015). Snow cover protects plants from harsh winter conditions such as low temperatures, ice blast and winter desiccation which can lead to frost damage and photoinhibition (Körner Citation2003; Zhang Citation2005; Bennie et al. Citation2010; Saarinen and Lundell Citation2010). During the growing season, the progression of snowmelt and the amount of snowpack also determine local soil moisture and nutrient conditions near the melting snowbeds (Björk and Molau Citation2007; Clement et al. Citation2012). The timing of snowmelt, along with a changing photoperiod and temperature, largely determines the onset of plant growth. Snowmelt directly increases the light and water available to the plant and coincides with higher temperatures and longer days (Billings and Mooney Citation1968; Jonas et al. Citation2008). Recently, it has further been suggested that the timing of spring snowmelt affects the timing of autumn senescence (Abbandonato Citation2014; Keenan and Richardson Citation2015). Thus, year-round plant growth appears to be influenced by the duration of snow cover.
Climate change is predicted to affect the amount and duration of snow cover, especially at high latitudes (ACIA Citation2005; Callaghan et al. Citation2011; IPCC Citation2013). Higher temperatures, leading to earlier snowmelt in the spring, have already been recorded in the western North American and the Northern European Arctic (e.g. Serreze et al. Citation2000; Stone et al. Citation2002). This can potentially alter the growing season length and can lead to shifts in the timing of seasonal events in plants (phenophases), flowering asynchrony with the presence of pollinators, exposure to spring frost and eventually affect plant fitness (Inouye Citation2008; Wipf et al. Citation2009; Kudo and Ida Citation2013; Gillespie et al. Citation2016).
Snow manipulation experiments (addition or removal of snow) have been used in arctic and subarctic tundra and in alpine vegetation to study the short- and mid-term effects of simulated changes in winter climate on the timing of phenophases in plants (Henry and Molau Citation1997; Walker et al. Citation1999; Wipf and Rixen Citation2010; Cooper Citation2014; Wipf et al. Citation2015). In most studies, phenophases were affected by differences in snowmelt timing; for example, they occurred on an earlier day of the year (DOY) when the snow melted earlier (Wipf et al. Citation2009; Wipf and Rixen Citation2010; Cooper et al. Citation2011; Livensperger et al. Citation2016), but in others, the DOY remained the same regardless of snowmelt timing (Dunne et al. Citation2003; Aerts et al. Citation2004). The photoperiod at a given location is always the same for a given DOY, so those phenophases found always to occur on the same DOY might be responding to photoperiod, i.e. they may be photoperiodic. Photoperiodism enables plants to delay phenophases until later in the season when temperature conditions are more stable if a longer day length is a signal for a later onset of development (Keller and Körner Citation2003). On the other hand, plants with less photoperiodism have the capacity to commence growth as a function of snowmelt, and this, in case of earlier melt-out, has the advantage of a longer growing season (Wipf et al. Citation2009). Phenological timing can also be assessed as the number of days required after snowmelt (days after snowmelt; DAS) until the beginning of growth or a new phenophase. The DAS may either remain the same (Borner et al. Citation2008) or vary (Petraglia et al. Citation2014; Bienau et al. Citation2015) for plants growing along snowmelt gradients. DAS can be used to characterise the rate of plant development after snowmelt, i.e. how fast a phenophase is attained (assuming that developmental processes begin on snowmelt). The rate of development is determined by genetic requirements and current environmental conditions, such as temperature, and can therefore give additional insights into the mechanisms that control the timing of phenology (Bliss Citation1962). How the timing of phenophases is affected by snowmelt timing depends on whether they are controlled by photoperiod alone or by other factors, such as temperature and soil moisture.
Limited conclusions can be drawn from experimental simulations of snowmelt timing alone since they can only capture immediate and short-term acclimation responses of plants, but not their long-term adaptation to existing variations in local conditions (Wolkovich et al. Citation2012; Blume-Werry et al. Citation2016). In arctic and alpine ecosystems with uneven terrain, large variations in snowmelt timing can occur naturally on a scale of a few metres so that early, mid- and late-melting areas are adjacent to each other (Körner Citation2003). A plant population occurring along such a gradient has adapted to the microclimatic variation, either genetically or through strong phenotypic plasticity, as seen in its successful establishment. This capacity to exist along gradients in snowmelt timing means that plant populations may be pre-adapted to the potential variations created by climate change in the future, i.e. plants with the capacity to adjust to future climatic changes may exist within a distance of just a few metres (Crawford and Abbott Citation1994). As short-term experiments may over-predict adverse effects of environmental changes due to the lack information about long-term adaptive responses, understanding natural variations of populations to snowpack duration is important (Blume-Werry et al. Citation2016). Reports from in situ observations of phenological events along natural snow duration gradients are relatively few (but see e.g. Kudo Citation1991; Kudo and Suzuki Citation1999; Dunne et al. Citation2003; Kudo and Hirao Citation2006; Sedlacek et al. Citation2015; Wheeler et al. Citation2015, Citation2016; Carbognani et al. Citation2016) compared to experimental studies. However, they are important for indicating the natural limitations of a species and whether a plant population is pre-adapted to diverse microclimates and therefore may be buffered against future climate change (Crawford Citation2008). Studying over the long term of natural small-scale environmental variations is therefore needed alongside experimental studies to assess the long-term success of a population.
This study aimed to evaluate how natural differences in the timing of spring snowmelt on a small spatial scale affected plant phenology. We studied how many DAS and on which DOY four vegetative and four reproductive phenophases began in three evergreen and four deciduous subarctic-alpine dwarf shrubs and examined how DAS and DOY were related to the timing of snowmelt. We also tested whether the relationship between the timing of phenophases and the timing of snowmelt varied between 2 years. Differences in snowmelt timing between the 2 years may be reflected in changes in DAS if this factor affects the rate of development. The study was conducted at two mountain slopes with different aspects (northeast vs. southwest facing) to investigate whether the phenological responses are consistent across two sampling locations. Different years and slope aspects involve differences in local surface temperature, one of the possible drivers of phenology, so including these variables in a study can give an insight into whether the effect of snowmelt timing is dependent on changes in temperature.
Specifically, we aimed to answer the following research questions addressing the phenological timing of phenophases (DOY) and their timing in relation to snowmelt (DAS):
How do the DOY and DAS of different phenophases of seven subarctic-alpine dwarf shrubs respond to snowmelt timing?
Is the response of DOY and DAS the same across 2 years and two slope aspects with different snowmelt timing?
Materials and methods
Study site
The study was conducted on Saana mountain (69°02′37″N, 20°51′22″E), Scandes Range, north-western Finland. At the Kilpisjärvi Biological Station (1.5 km away from the study site), the annual mean temperature is −1.9 °C and January and July mean temperatures are −12.9 °C and 11.2 °C, respectively (means from 1981 to 2010; Pirinen et al. Citation2012). The average annual precipitation is 487 mm and the average peak snow depth reaches 99 cm in March (Pirinen et al. Citation2012). The first snow-free patches appear in April–May, but light snowfall can remain on the ground for up to 2 days especially at higher altitudes until late June. The mountain birch (Betula pubescens ssp. czerepanovii) treeline on Saana is formed at 600 m a.s.l. Above the treeline, the vegetation is a subarctic-alpine vegetation dominated by ericaceous dwarf shrubs such as Empetrum nigrum and Vaccinium spp., and Betula nana and Salix spp. The humus layer is shallow (ca. 7–15 cm deep) and the soil moisture is usually low (Eskelinen et al. Citation2009; Le Roux et al. Citation2013a). The bedrock consists of siliceous and dolomitic rock resulting in nutrient-poor, acidic soils in some areas and calcium-rich, non-acidic soils in other areas. The study was restricted to acidic areas as these dominated the landscape.
We selected two areas (hereafter called ‘Site’) located at 700–770 m a.s.l. on the north-eastern (hereafter called ‘North’) and the south-western (hereafter called ‘South’) slopes of Saana (Supplementary Figure S1). The small differences in elevation did not appear to cause temperature differences (data not shown). These areas have previously been characterised by Le Roux et al. (Citation2013b) and they are known to consist of representative heath vegetation. The progression of snowmelt was observed from early May 2014 and three groups of sequential timing of spring snowmelt (hereafter called ‘Snowmelt’) termed ‘Early’, ‘Mid’ and ‘Late’ were identified. In each group, three plots (two plots in South Mid) of 2 m × 2 m2 area each were marked in 2014. An additional plot (two additional plots in South Mid) was added at each Site-Snowmelt combination in spring 2015 (Figure S1). Plots within the same Site were between ca. 3 and 200 m apart.
Reindeer were sometimes observed in the area, but they did not appear to disturb the study plots.
Temperature and snowmelt measurements
Air temperature at ca. 20 cm above the ground and soil surface temperature were logged at hourly intervals in duplicates at each plot with iButtons® (DS1922L-F5 thermochrons; Homechip Ltd., UK). The loggers measuring air temperature were protected from direct sunlight with a cylindrical radiation shield (height = 15 cm, diameter = 6 cm) made of white polyvinyl chloride. To calculate the air temperature for May 2014, before the loggers were placed, we correlated air temperatures from the Saana weather station (International identification number WMO 02701) with our temperature data from the summer 2014 and extrapolated temperatures backwards until snowmelt. The sum of average daily temperatures above 0 °C (accumulated thawing degree days, TDDs) was calculated for each Site and Snowmelt level from the date of snowmelt until 2 September in 2014 and 2015. Accumulated TDDs measure the magnitude and duration of above-zero temperatures and are therefore an indication of the warmth and length of the growing season.
In 2014, the day of snowmelt of early melting plots was estimated from two visits to the site. On the first visit on 8 May, the area was covered completely with snow and on the second visit on 26 May, it was snow free, so snowmelt was estimated to have occurred in the middle of this period, i.e. 17 May or DOY 137. For the other plots, the day of snowmelt in 2014 was noted as the day when a plot was completely snow free. This method was not possible in 2015 because some early melting plots were already snow free when the observations started on 20 May. Instead, the day at which the logged topsoil temperatures started fluctuating by about 5 °C was used as the day of snowmelt for those plots in 2015 (see Wipf Citation2010). Soil temperature fluctuations are a good indicator of snowmelt as the snow cover keeps the soil surface temperature at approximately 0 °C regardless of the air temperature (Havas Citation1966; Körner Citation2003). In 2014–2015, Early plots melted out between the beginning and middle of May, Mid plots between the end of May and the beginning of June and Late plots between mid-June and the beginning of July (). The plots therefore represented three phases in a natural gradient of snowmelt timing of 5–7 weeks on the two opposing slopes.
Table 1. Average date and day of year (DOY; with standard errors) of snowmelt timing and average accumulated thawing degree days (TDD) after snowmelt at two sites (North and South) and three levels of snowmelt timing (Early, Mid and Late) in 2014 and 2015.
Phenological observations
Phenological observations were made on the most commonly occurring species in the area. Four deciduous species B. nana L., Salix herbacea L., Vaccinium myrtillus L., Vaccinium uliginosum L. and three evergreen species E. nigrum ssp. hermaphroditum (Hagerup) Böcher, Phyllodoce caerulea (L.) Bab. and Vaccinium vitis-idaea L. were observed in each plot. A plastic tie (width = 2.4 mm) was loosely attached to the base of 24 individual shoots of each of the examined species present in a plot. Due to species-specific affinities to snow, some species were not sufficiently abundant or were not present at all in some plots. V. vitis-idaea was present in all plots. S. herbacea and V. myrtillus only grew in late-melting plots, whereas B. nana did not grow in late-melting plots and E. nigrum only grew in late-melting plots in the North. P. caerulea was not present in any early melting plots and V. uliginosum was only present across the whole snowmelt gradient in the South Site.
Each marked shoot was observed every 3–7 days and the DOY at which the first bud on the shoot reached a new phenophase was noted. Observations were made from 31 May to 2 September in 2014 and from 20 May to 4 September in 2015. Five vegetative and six reproductive phenophases were defined individually for each species (Figure S2):
For practical reasons, not every phenophase was recorded in all species; for example, leaf senescence was not observed in evergreen species and bud greening was not observed in P. caerulea as its buds look green as soon as they become visible. In a small number of cases, some phenophases had already been reached before the beginning of the study period or had not been reached by the end of it so they were excluded from the dataset as the exact timing of the phenophase was unknown in those cases. The final sample size for each species also varied due to the loss of tags and lack of flowers or leaf development on individual shoots.
Statistical analyses
The DOY at the onset of each phenophase was recorded individually for each shoot. The DAS was then calculated as the number of days from the day of snowmelt to the measured DOY. The effect of the factors Snowmelt (levels ‘Early’, ‘Mid’ and ‘Late’), Site (levels ‘North’ and ‘South’) and Year (levels ‘2014’ and ‘2015’) on DOY and DAS was evaluated separately for each species and phenophase with a linear mixed-effects model with Plot as a random effect. All factors and all possible interactions were included. In cases where there were no data for a species in all combinations of factor levels, separate models were fitted for subsets of the data which included the remaining possible interactions (see supplementary Tables S1 and S2 for a list of all fitted models). The optimal model was determined using the maximum likelihood ratio test. Main effects and interactions of variables were tested for significance (P < 0.05) with an analysis of variance (ANOVA). Normality, homogeneity and independence assumptions of ANOVA were evaluated by visual inspection of residual plots. In some cases, a constant variance function was applied to one or several variables to achieve homogeneity. Variation in the timing of phenophases with the timing of snowmelt, between the 2 years and slope aspects, was evaluated based on the significance of Snowmelt, Year or Site as main effects. When a significant interaction was present, pairwise comparisons of least square means were carried out with t-tests within each year and site and the P-values were adjusted using the Holm’s method (Holm Citation1979) and a general trend was assumed to be present when most pair-wise interactions were significant. Where the ANOVA assumptions were not fulfilled (see model results in Tables S1 and S2 marked as ‘Could not be tested’), the trend was estimated visually from the figures. All analyses were carried out in R (R Core Team 2016, version 3.3.1) using the packages nlme (Pinheiro et al. Citation2016), lsmeans (Lenth Citation2015) and stats (R Core Team 2016).
Results
Temperature conditions
The accumulated TDDs indicated that the growing season was generally warmer in 2014 than in 2015 and on south-facing than on north-facing slopes in both years (). Accumulated TDD at the end of the season was always highest in early melting plots and lowest in late melting plots ().
Timing of phenophases across species
The number of DAS until bud greening was lowest for S. herbacea and V. myrtillus which only grew in late-melting snowbeds, followed by the deciduous species B. nana and V. uliginosum and was greatest in the two evergreen species, E. nigrum and V. vitis-idaea ( and ). This ranking of species according to number of DAS was largely conserved across all vegetative phenophases. The ranking of species from earliest to latest was different for the DOY at which vegetative phenophases occurred: V. uliginosum < B. nana < E. nigrum < S. herbacea < V. myrtillus < V. vitis-idaea < P. caerulea ( and ).
Figure 1. Number of days after snowmelt and day of year on which four vegetative phenophases (bud green, leaf unfolded, leaf expanded, leaf senescence) in five subarctic dwarf shrubs (a–e) occurred for the first time along a natural gradient of snowmelt timing (Early, Mid and Late). The phenophases were observed at two mountain slope aspects (North and South). Closed symbols denote observations from 2014 and open symbols observations from 2015. The solid schematic lines (in red) indicate the generalised trend in the phenophase shifts along the snowmelt gradient. A flat line corresponds to no shift along the snowmelt gradient in all or most pairwise comparisons. No red line indicates that no clear pattern was identified. For full species’ names and description of the snowmelt gradient see Materials and methods section. Note that overlapping points have been jittered.
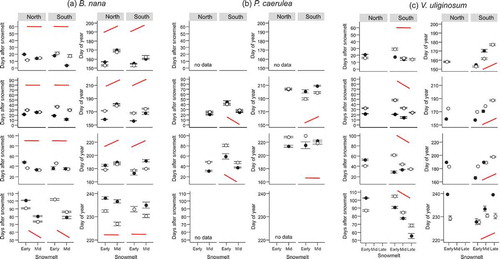
Figure 1. Number of days after snowmelt and day of year on which four vegetative phenophases (bud green, leaf unfolded, leaf expanded, leaf senescence) in five subarctic dwarf shrubs (a–e) occurred for the first time along a natural gradient of snowmelt timing (Early, Mid and Late). The phenophases were observed at two mountain slope aspects (North and South). Closed symbols denote observations from 2014 and open symbols observations from 2015. The solid schematic lines (in red) indicate the generalised trend in the phenophase shifts along the snowmelt gradient. A flat line corresponds to no shift along the snowmelt gradient in all or most pairwise comparisons. No red line indicates that no clear pattern was identified. For full species’ names and description of the snowmelt gradient see Materials and methods section. Note that overlapping points have been jittered.
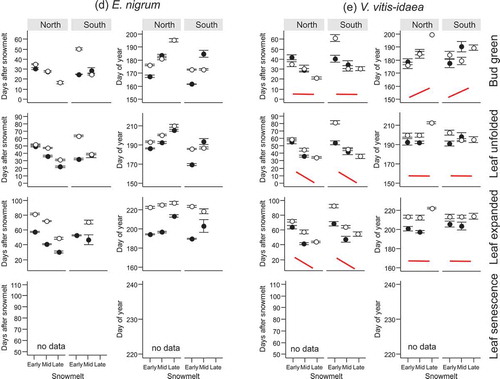
Figure 2. Number of days after snowmelt and day of year on which four vegetative phenophases (bud green, leaf unfolded, leaf expanded, leaf senescence) in two subarctic dwarf shrubs (a–b) occurred for the first time. The phenophases were observed at two mountain slope aspects (North and South) in a late-melting snowbed. Closed symbols denote observations from 2014 and open symbols observations from 2015. For full species’ names and description of the snowmelt gradient see Materials and methods section. Note that overlapping points have been jittered.
E. nigrum required the smallest number of DAS for almost all reproductive phenophases among the studied species, followed by V. myrtillus, P. caerulea, V. uliginosum and V. vitis-idaea ( and ). The order of species according to the phenological timing in DAS remained almost the same throughout later reproductive phenophases except for fruit ripening in V. myrtillus, which occurred within the smallest number of DAS among all species (). When arranging the species according to the DOY on which reproductive phenophases occurred, the order was similar except that V. myrtillus and V. uliginosum were in reverse order.
Figure 3. Number of days after snowmelt and day of year on which four reproductive phenophases (flower open, flower senescence, fruit set visible, fruit ripe) in four subarctic dwarf shrubs (a–d) occurred for the first time along a natural gradient of snowmelt timing (Early, Mid and Late). The phenophases were observed at two mountain slope aspects (North and South). Closed symbols denote observations from 2014 and open symbols observations from 2015. The solid schematic lines (in red) indicate the generalised trend in the phenophase shifts along the snowmelt gradient. A flat line corresponds to no shift along the snowmelt gradient in all or most pairwise comparisons. No red line indicates that no clear pattern was identified. For full species’ names and description of the snowmelt gradient see Materials and methods section. Note that overlapping points have been jittered.
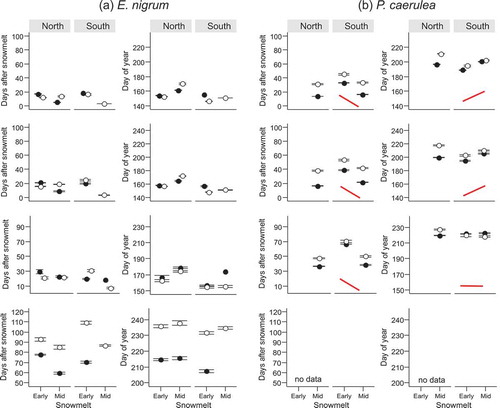
Figure 3. Number of days after snowmelt and day of year on which four reproductive phenophases (flower open, flower senescence, fruit set visible, fruit ripe) in four subarctic dwarf shrubs (a–d) occurred for the first time along a natural gradient of snowmelt timing (Early, Mid and Late). The phenophases were observed at two mountain slope aspects (North and South). Closed symbols denote observations from 2014 and open symbols observations from 2015. The solid schematic lines (in red) indicate the generalised trend in the phenophase shifts along the snowmelt gradient. A flat line corresponds to no shift along the snowmelt gradient in all or most pairwise comparisons. No red line indicates that no clear pattern was identified. For full species’ names and description of the snowmelt gradient see Materials and methods section. Note that overlapping points have been jittered.
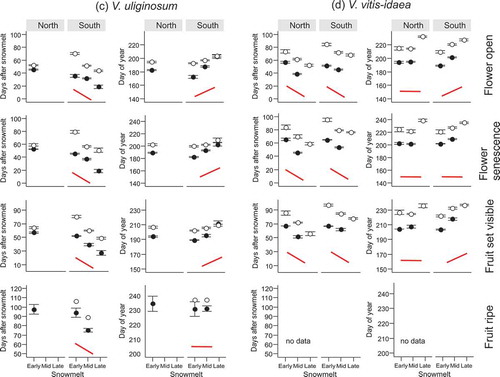
Figure 4. Number of days after snowmelt and day of year on which four reproductive phenophases (flower open, flower senescence, fruit set visible, fruit ripe) in V. myrtillus occurred for the first time. The phenophases were observed at two mountain slope aspects (North and South) in a late-melting snowbed. Closed symbols denote observations from 2014 and open symbols observations from 2015. For full species’ names and description of the snowmelt gradient see Materials and methods section. Note that overlapping points have been jittered.
Ripe fruits were rarely observed, partially because some fruits did not reach this phase before the end of the fieldwork period, so data are only presented from a few cases.
The effect of snowmelt on phenological timing
The shifts in phenophases due to snowmelt timing could, in several cases, be described by generalised patterns indicated schematically by solid red lines in Figures 1 and . The conditions on which the schematic lines are based are described in the section Statistical analyses of the Materials and methods section. Most phenophases in the late-developing evergreen species V. vitis-idaea (except bud greening) and late phenophases in P. caerulea, such as fruit set and leaf expansion, responded similarly to snowmelt timing. They usually required more DAS to occur in early vs. late snowmelt ( and , Tables S1 and S2). These phenophases occurred synchronously on the same DOY. The reproductive phenophases and most vegetative phenophases of the deciduous species V. uliginosum (Figures 1c and ), which was among the early flowering species, and the early phenophases of P. caerulea (flower opening and leaf unfolding; and ), also required more DAS to begin in early vs. late snowmelt (Tables S1 and S2). However, these phenophases occurred on a later DOY in late vs. early snowmelt (Tables S1 and S2). Conversely, most vegetative phenophases of B. nana and some in 2014 also of V. uliginosum and bud greening in V. vitis-idaea required a fixed number of DAS to occur, regardless of snowmelt timing (). These phenophases usually occurred on an earlier DOY in early vs. late snowmelt (Tables S1). These results fall into three patterns of (1) more DAS and the same DOY, (2) more DAS and later DOY and (3) the same DAS and later DOY in late vs. early snowmelt.
In E. nigrum, snowmelt timing did not cause any clear response in the timing of phenophases (Figures 1d and , Tables S1 and S2). Most vegetative phenophases occurred after more DAS in early vs. late snowmelt, but there were some exceptions (e.g. leaf unfolding and leaf expansion in the South in 2014). Some phenophases occurred on the same DOY whilst others occurred later in late vs. early snowmelt (Figure 1d). The effect of snowmelt was also inconsistent in reproductive phenophases of E. nigrum (). Depending on year and site, some of its phenophases required more DAS in early vs. late snowmelt and occurred on the same DOY, while others took a fixed number of DAS but occurred on an earlier DOY in early vs. late snowmelt. Only fruit set in the North in 2014 occurred within more DAS in early vs. late snowmelt, causing an earlier DOY of fruit set in those plots ().
Variation in phenological timing between slope aspects
In V. vitis-idaea, vegetative and reproductive phenophases began within fewer DAS at the North vs. the South site (Figures 1e and , Table S1). Other species and phenophases usually required the same number of DAS to attain vegetative phenophases, regardless of the Site ( and , Table S1) with the exceptions of leaf expansion in E. nigrum, which took significantly fewer DAS in the South vs. the North and senescence in B. nana, which required more DAS in the South vs. the North in 2015 (). V. myrtillus and E. nigrum began bud greening and leaf unfolding on an earlier DOY in the South vs. the North and the same effect was seen in leaf unfolding and leaf expansion in B. nana ( and ).
The effect of Site on the number of DAS required by reproductive phenophases was only consistent in the species which took a relatively high number of DAS until flowering ( and , Table S2). In V. uliginosum, flowers from early melting plots in 2015 took more DAS to open and to senesce in the South vs. the North site and the effect was the same in all phenophases of V. vitis-idaea (). A significant effect of Site remained in the DOY of flower opening in V. vitis-idaea but the site at which the phenophases occurred later varied with snowmelt timing (Table S2). Reproductive phenophases of V. uliginosum and V. myrtillus did not differ strongly between sites, but flower phenophases of E. nigrum and P. caerulea (in 2015) and fruit ripening in E. nigrum (in 2014) usually occurred on an earlier DOY in the South vs. the North ( and ).
Variation in phenological timing between years
Reproductive phenology responded more strongly to variation between the years compared to vegetative phenology. Reproductive phenophases always required more numbers of DAS in 2015 vs. 2014, approximately the same value, regardless of snowmelt timing ( and ). This was significant in almost all possible pair-wise comparisons of the 2 years and apparent in all species and phenophases, apart from E. nigrum (Table S2). This difference between the years persisted in the DOY at which flowering phases occurred.
Inter-annual differences in the DAS needed to reach vegetative phenophases increased in the late phenophases compared to earlier phenophases of evergreen species ( and ). Leaf expansion always took significantly more DAS for these species and occurred on a later DOY in 2015 vs. 2014 (Table S1). The vegetative phenology of deciduous species was affected less by inter-annual variations than that of evergreen species. The only significant delay in 2015 vs. 2014 was in the leaf senescence of V. myrtillus and V. uliginosum (Table S1, Figures 1c and ). Some inter-annual differences could be seen in the DOY at which vegetative phenophases were reached, but the year during which phenophases occurred later varied by phenophase and site. Differences between the years in the DOY of attaining vegetative phenophases were irregular and often varied by phenophases and site, except in the case of a significantly later occurrence of senescence in V. uliginosum in 2014 (Figure 1c).
Discussion
Patterns in the phenological response to snowmelt
Our results for plant phenology along a natural snowmelt gradient are consistent with results from experimental systems in comparable arctic and alpine environments (delayed DOY: Wipf et al. Citation2009; Wipf Citation2010; Cooper Citation2014; or unaltered DOY: Bienau et al. Citation2015). We additionally examined the number of DAS required to begin a phenophase and found similar responses to those reported by, for example, Petraglia et al. (Citation2014) (increased DAS) and Cooper et al. (Citation2011) (unaltered DAS) for various arctic and alpine dwarf shrubs in similar ecosystems.
Some studies found that responses of phenological timing to earlier snowmelt cluster according to life form with graminoid phenology advancing the most, followed by deciduous and then evergreen dwarf shrubs (Khorsand Rosa et al. Citation2015; Livensperger et al. Citation2016). In other cases, the relative timing of phenology among species (e.g. early flowering vs. late-flowering species) determined how a species responded to differences in snowmelt timing (Wipf Citation2010; Petraglia et al. Citation2014). However, the detailed results we present from four deciduous and three evergreen dwarf-shrub species and eight phenophases cannot confirm that growth form or temporal niche correspond to a particular response to snowmelt timing ().
Figure 5. Schematic representation of patterns in plant phenology with regards to snowmelt timing. Phenological timing is represented as days after snowmelt (DAS) until the onset of a phenophase (continuous line) and as the day of year (DOY) of the onset of a phenophase (dashed line). The occurrence of phenophases in response to snowmelt timing clustered in the present study into three patterns: (a) Compensation: The number of DAS required to reach a certain phenophase decreases with later snowmelt timing. This reduction translates into acceleration of growth and compensates for the delay caused by the late snowmelt, leading to synchronous occurrence of the observed phenophases in plots with different snowmelt timing. (b) Under-compensation: The number of DAS required to reach a certain phenophase decreases with later snowmelt timing but this acceleration is not sufficient to compensate for the delayed start of the growing season caused by late snowmelt. Therefore, phenophases are reached at a later DOY in late-melting plots compared to early melting plots, but this difference is smaller than the corresponding difference in the snowmelt timing. (c) Conservativeness (no compensation): The number of DAS required to reach a certain phenophase is the same along the snowmelt gradient. Late snowmelt poses a natural delay to development so that phenophases occur at a later DOY in late- compared to early melting plots and this difference is equal to the corresponding difference in the snowmelt timing.
Note the different slopes in the solid lines in figure parts (a) and (b) and the dashed lines in figure parts (b) and (c).
The discrepancy between our findings and results from earlier research may be due to the fact that previous studies either included only a few species or few phenophases, or focused only on one response variable for phenological timing, limiting the possibility to identify more general response patterns. In contrast, we compared how the timing of several phenophases of several species corresponded to snowmelt timing in terms of both DAS and DOY. This indicated a novel clustering of phenophases into three distinct patterns according to their responses to snowmelt timing:
Compensation: The number of DAS required to reach a certain phenophase decreases with later snowmelt timing. This reduction translates into acceleration of growth and compensates for the delay caused by the late snowmelt, leading to synchronous occurrence of phenophases in plots with different snowmelt timing (). This response was mostly seen in V. vitis-idaea and in the late phenophases of P. caerulea.
Under-compensation: The number of DAS required to reach a certain phenophase decreases with later snowmelt timing, but this acceleration is not sufficient to compensate for the delayed start of the growing season caused by late snowmelt. Therefore, phenophases are reached at a later DOY in late-melting plots compared to early melting plots, but this difference is smaller than the corresponding difference in the snowmelt timing (). This response was seen in most phenophases of V. uliginosum and the early phenophases of P. caerulea.
Conservativeness (no compensation): The number of DAS required to reach a certain phenophase is the same along the snowmelt gradient. Late snowmelt poses a natural delay to development so that phenophases occur at a later DOY in late- compared to early melting plots and this difference is equal to the corresponding difference in the snowmelt timing (). This response was mostly seen in the vegetative phenophases of B. nana and in 2015 in some phenophases of V. uliginosum.
The only species which did not tend to follow any of these patterns was E. nigrum. Its patterns of phenological timing along the snowmelt gradient varied greatly with site and year within the same phenophase. E. nigrum grows ubiquitously in the study area and it can be found on wind-blown ridges and in places with thick snow cover (authors’ pers. observation; Bell and Tallis Citation1973). This suggests that it can cope with a large range of variation in snow depth and snowmelt timing. E. nigrum always developed earliest after snowmelt among the studied species and its flower bud break had often already begun prior to snowmelt (authors’ pers. observation), showing a strong adjustment to snowmelt timing. Large trait variation along natural snow depth gradients has also been found in Empetrum by Bienau et al. (Citation2014) as well as in a snow removal experiment in alpine Empetrum, which showed plasticity in developmental timing of bud greening and flowering after 1 or 2 years (Wipf et al. Citation2009; Wipf Citation2010). This suggests at least partial plasticity in the response of E. nigrum to snowmelt which we observed. It is likely that its divergent responses to snowmelt timing seen in different years, sites or phenophases are modulated by, for example, prevailing temperatures.
While these patterns show that the timing of snowmelt affects the timing of phenophases, the variation in the responses within and between species indicates a more complex control on phenology than snowmelt alone can explain. This is likely, at least partially, due to the confounding effects of snowmelt with other environmental variables which affect phenology, such as soil moisture variation during snowmelt and higher temperatures in late-melting plots at the time of snowmelt. Snowmelt as a predictor of phenology is also partially limited by the preferences of species for certain snow depth niches so that some of our species studied did not grow along the whole gradient and hence were not exposed to all snowmelt timings. A finer snowmelt gradient and additional species with a broad habitat range could be used in future studies to avoid the limitations we encountered. Mating systems can also influence the timing of phenophases beyond the influence of snowmelt timing, as strictly outcrossing species must flower synchronously for successful reproduction. In our study, only E. nigrum can commonly self-fertilise due to its bisexual flowers in northern populations (Bell and Tallis Citation1973) which may explain the great variability in the timing of its phenophases but does not explain why there is great variation among the other species with obligatory or preferentially outcrossing mating systems.
Modulation of phenological timing by environmental variations between years and slope aspects
In those cases where the phenological timing varied between the years, phenophases usually developed on a later DOY or required more DAS in the relatively colder year of 2015, suggesting that low temperatures limit phenological development in these subarctic-alpine plant species. This accelerating effect of warm years has also been found in the dwarf shrub Cassiope tetragona in a similar subarctic-alpine ecosystem (Molau Citation1997) and in several other arctic plant species, which had a shorter prefloration period in years with higher spring temperatures (Bjorkman et al. Citation2015). Semenchuk et al. (Citation2016) also report that the timing of phenophases varied between years, but this could not be explained by temperature sums because the cumulative TDDs until the occurrence of each phenophase were not constant between the years. This indicates that other factors, for example variation in soil moisture, modulate the responses in different years, as has been suggested by Oberbauer et al. (Citation2013). In our comparison between years, we found the strongest responses in the reproductive phenology and stronger effects on late- vs. early developing species, suggesting a higher flexibility in responding to short-term environmental fluctuations, in particular phenophases of certain species. Hence, reproductive phenophases and late-developing species have a greater advantage as they can respond to favourable conditions; for example, they can extend the available time for reproductive processes by developing earlier in a warmer year. This could also hold future advantages when acclimatising to changing conditions.
The response of phenology to the aspect of the mountain slope was inconsistent within almost all species and phenophases, apart from V. vitis-idaea. Overall, Site mainly appeared to modulate developmental timing in the colder year of 2015. The slope aspect has rarely been included in previous studies of phenological timing and Iversen et al. (Citation2009) found only a small effect of slope aspect on the timing of phenology when comparing north-, south- and east-facing slopes. In their study, phenological development was slower in the South compared to the North but slope aspect was overall a poor predictor of phenology. In addition to our own results, the findings of Iversen et al. (Citation2009) suggest that environmental or genetic differences between the two sites not accounted for in our study are likely to have caused the variation that we observed.
Limitations and adaptations of phenology
Plants which follow the compensatory pattern () respond flexibly to snowmelt timing. This indicates an adjustment to the environmental differences at the time of snowmelt, such as higher temperatures later in the season when late-melting plots become snow free, compared to the lower temperatures in spring when early melting plots melt out. Indeed, Livensperger et al. (Citation2016) found that the timing of leaf appearance in V. vitis-idaea and other shrubs was advanced both by warming and by early snowmelt, but warming usually had no additional effect on the timing of leaf expansion later in the season. In the same study, early snowmelt slowed down rates of leaf development in many species, suggesting that early season development may be slowed down by the colder temperatures and a slower accumulation of temperature sums. Later phenophases, on the other hand, may be regulated by other physiological requirements, as temperatures are already high when they occur and are unlikely to be restricting. Specific temperature accumulation requirements to phenophases are not uncommon in subarctic and alpine species, as evident in the studies by Wheeler et al. (Citation2016) and Huelber et al. (Citation2006) in which the growing degree days above 5 °C until the onset of reproductive phenophases in several alpine plant species were identical along an elevational and snowmelt gradient. However, variations in the degree-day sensitivity are also common with respect to habitat, growth form or latitude (Kudo and Suzuki Citation1999; Molau et al. Citation2005; Prevéy et al. Citation2017). The photoperiod reaches 24 h on DOY 142 at our study site, so the occurrence of phenophases on the same DOY as seen in this pattern is unlikely to be caused by day length.
The under-compensating pattern () follows a similar concept of flexibility as the compensatory pattern. However, in this case, there is more limitation on how strongly phenology responds to snowmelt, as the number of DAS does not vary as strongly along the snowmelt gradient compared to the first pattern.
In the conservative group (), the number of DAS required to reach a phenophases is the same along the snowmelt gradient. This implies that despite the environmental differences, such as temperature differences upon snowmelt, these phenophases do not respond flexibly to snowmelt timing, likely due to an internal physiological requirement or a genetic regulation which is independent of the environmental differences between plots with different snowmelt timing. This was also suggested by Borner et al. (Citation2008), who likewise found no differences in the rates of phenological development in B. nana or in other arctic plant species along an experimental snowmelt gradient.
The role of small-scale spatial differentiation and developmental strategy in a changing climate
Climate simulations for northern Finland predict a decrease in the amount of snowfall and the duration of snow cover for the period 2070–2099 (Jylhä et al. Citation2009; Räisänen and Eklund Citation2012). However, small-scale variability in snow cover may retain diverse environments in the future, likely including suitable habitats for plants under changed conditions (Friedel Citation1961). The potential of microhabitat variability to prevent habitat loss in the future and provide buffers against climate change has been recognised previously especially with respect to thermal differentiation by Scherrer and Körner (Citation2010, Citation2011) and Scherrer et al. (Citation2011). In our study, the microclimatic conditions at our current mid-melting plots would correspond to those of the current early melting plots if climate change causes an overall advance in snowmelt. Similarly, current late-melting plots will correspond to mid-melting plots. Although we cannot say whether the strategies we have identified are genotypic or phenotypic in nature, the plants overall show differential responses to snowmelt timing within the same population.
In some of our studied species, the timing of phenology varied significantly between the 2 years. In addition, tundra and alpine species in general are known to mainly reproduce vegetatively. These characteristics make it likely that the responses of these species are at least partially due to phenotypic plasticity. Sedlacek et al. (Citation2015) confirmed that phenotypic acclimation rather than genotypic adaptation to snowmelt timing was present in the leaf phenology of S. herbacea in an alpine ecosystem. Patterns which can describe the phenotypic plasticity of phenology in response to snowmelt timing, such as those we present here, can indicate the capacity of plants to respond to these differences in general and therefore give us an idea of how climate change-induced advances in snowmelt might affect them specifically. We cannot conclude how plants in the early melting plots might respond to even earlier snowmelt, as these plots constituted the earliest area of our snowmelt gradient and were also one of the earliest areas to melt out in the region. However, plants in currently late- or mid-melting habitats will experience a forward shift in snowmelt timing and therefore can be expected to respond similarly to those in currently mid- or early melting habitats, respectively, if phenotypic plasticity is present. Phenophases following the first pattern () will likely still occur on the same DOY, whilst phenophases following the second or third pattern () will probably occur on an earlier DOY. In reproductive phenophases, this possible shift in phenology may cause a mismatch of peak flowering time with the peak abundance of pollinators if the pollinators do not shift to the same extent with consequences for reproductive success (Kudo and Ida Citation2013; Gillespie et al. Citation2016). A study from the Arctic showed that late flowering individuals advance faster than early flowering individuals in the case of an advance in snowmelt timing, causing a contraction in the flowering period and an associated decline in resource availability for pollinators (Høye et al. Citation2007, Citation2013). However, Cortés et al. (Citation2014) found that gene flow in S. herbacea continues between microhabitats with different snowmelt due to seed dispersal so that subpopulations are not genetically separated.
Conclusions
Our results suggest that the extent to which a plant population shows variable phenological timing in response to the timing of snowmelt can be inferred from the length of the period after snowmelt individual subpopulations require to attain phenophases under current natural conditions. Comparing this requirement of DAS to the response of phenology measured as the DOY allowed us to define three patterns of species’ responses which correspond to distinct developmental strategies reflecting species’ means of adaptation to variations in the timing of snowmelt. Contrary to previous classifications of phenological responses, the patterns we found are not dependent on any particular functional classification (such as growth form), number of species studied or a particular type of ecosystem. This framework facilitates the comparison of phenological responses among various studies and would even potentially allow previous results to be classified according to these patterns. Achieving a greater uniformity in reporting research results would improve our understanding of how plant phenology responds to the environment. Furthermore, these strategies raise ideas about the underlying physiological processes and environmental factors which control plant phenology and are not fully understood yet.
Supplemental Material
Download Zip (1.3 MB)Acknowledgements
We would like to thank three anonymous reviewers for helping to improve previous versions of this manuscript. We thank Prof. Elisabeth J. Cooper (Department of Arctic and Marine Biology, University of Tromsø), Dr. T. Matthew Robson and Dr. Helena Åström (Department of Biosciences, University of Helsinki) for helpful comments on the manuscript. Dr. Pedro J. Aphalo (Department of Biosciences, University of Helsinki) and Dr. T. Matthew Robson gave advice on statistical testing and R programming. Prof. Miska Luoto (Department of Geosciences and Geography) facilitated the selection of the study sites and provided insightful advice on the project. The staff at Kilpisjärvi Biological Station provided practical support for the fieldwork and knowledge about the local flora. Johanna Levlin and Pasi Pouta assisted with the field observations.
Disclosure statement
No potential conflict of interest was reported by the authors.
Supplemental data
Supplemental data for this article can be accessed here.
Additional information
Funding
Notes on contributors
Friederike Gehrmann
Friederike Gehrmann is a plant ecologist with a main interest in high latitude and altitude ecosystems.
Heikki Hänninen
Heikki Hänninen is a plant ecologist with research interest in the seasonality and climatic adaptation of plants.
Che Liu
Che Liu is a plant ecophysiologist focussing on growth models, whose background and interests also include biodiversity and global change.
Timo Saarinen
Timo Saarinen is a plant ecologist with research interests in the snow ecology and ecophysiology of northern plants and the effects of warming winters on invasive plant species.
Related Research Data
References
- Abbandonato H 2014. Autumn senescence response to a changing climate: effects of snow-depth on High Arctic plants. Master’s Thesis, University in Tromsø. Retrieved from http://munin.uit.no/handle/10037/6547
- ACIA. 2005. Impacts of a warming Arctic: arctic climate impact assessment. Cambridge (United Kingdom and New York, NY, USA): Cambridge University Press.
- Aerts R, Cornelissen JHC, Dorrepaal E, Rsp VL, Callaghan TV. 2004. Effects of experimentally imposed climate scenarios on flowering phenology and flower production of subarctic bog species. Global Change Biology. 10:1599–1609.
- Bell JNB, Tallis JH. 1973. Empetrum nigrum L. Journal of Ecology. 61:289–305.
- Bennie J, Kubin E, Wiltshire A, Huntley B, Baxter R. 2010. Predicting spatial and temporal patterns of bud-burst and spring frost risk in north-west Europe: the implications of local adaptation to climate. Global Change Biology. 16:1503–1514.
- Bienau MJ, Hattermann D, Kröncke M, Kretz L, Otte A, Eiserhardt WL, Milbau A, Graae BJ, Durka W, Eckstein RL. 2014. Snow cover consistently affects growth and reproduction of Empetrum hermaphroditum across latitudinal and local climatic gradients. Alpine Botany. 124:115–129.
- Bienau MJ, Kröncke M, Eiserhardt WL, Otte A, Graae BJ, Hagen D, Milbau A, Durka W, Eckstein RL. 2015. Synchronous flowering despite differences in snowmelt timing among habitats of Empetrum hermaphroditum. Acta Oecologica. 69:129–136.
- Billings WD, Mooney HA. 1968. The ecology of arctic and alpine plants. Biological Reviews. 43:481–529.
- Björk RG, Molau U. 2007. Ecology of alpine snowbeds and the impact of global change. Arctic, Antarctic, and Alpine Research. 39:34–43.
- Bjorkman AD, Elmendorf SC, Beamish AL, Vellend M, Henry GHR. 2015. Contrasting effects of warming and increased snowfall on Arctic tundra plant phenology over the past two decades. Global Change Biology. 21:4651–4661.
- Bliss LC. 1962. Adaptations of Arctic and Alpine plants to environmental conditions. Arctic. 15:117–144.
- Blume-Werry G, Kreyling J, Laudon H, Milbau A, Gilliam F. 2016. Short-term climate change manipulation effects do not scale up to long-term legacies: effects of an absent snow cover on boreal forest plants. Journal of Ecology. 104:1638–1648.
- Borner AP, Kielland K, Walker MD. 2008. Effects of simulated climate change on plant phenology and nitrogen mineralization in Alaskan arctic tundra. Arctic, Antarctic, and Alpine Research. 40:27–38.
- Callaghan TV, Johansson M, Brown RD, Groisman PY, Labba N, Radionov V, Barry RG, Bulygina ON, Essery RLH, Frolov DM, et al. 2011. The changing face of Arctic snow cover: a synthesis of observed and projected changes. Ambio. 40:17–31.
- Carbognani M, Bernareggi G, Perucco F, Tomaselli M, Petraglia A. 2016. Micro‑climatic controls and warming effects on flowering time in alpine snowbeds. Oecologia. 182:573–585.
- Clement JC, Robson TM, Guillemin R, Saccone P, Lochet J, Aubert S, Lavorel S. 2012. The effects of snow-N deposition and snowmelt dynamics on soil-N cycling in marginal terraced grasslands in the French Alps. Biogeochemistry. 108:297–315.
- Cooper EJ. 2014. Warmer shorter winters disrupt Arctic terrestrial ecosystems. Annual Review of Ecology, Evolution, and Systematics. 45:271–295.
- Cooper EJ, Dullinger S, Semenchuk P. 2011. Late snowmelt delays plant development and results in lower reproductive success in the High Arctic. Plant Science. 180:157–167.
- Cortés AJ, Waeber S, Lexer C, Sedlacek J, Wheeler JA, van Kleunen M, Bossdorf O, Hoch G, Rixen C, Wipf S, et al. 2014. Small-scale patterns in snowmelt timing affect gene flow and the distribution of genetic diversity in the alpine dwarf shrub Salix herbacea. Heredity. 113:233–239.
- Crawford RMM. 2008. Cold climate plants in a warmer world. Plant Ecology & Diversity. 1:285–297.
- Crawford RMM, Abbott RJ. 1994. Pre-adaptation of arctic plants to climate change. Botanica Acta. 107:271–278.
- Dunne JA, Harte J, Taylor KJ. 2003. Subalpine meadow flowering phenology responses to climate change: integrating experimental and gradient methods. Ecological Monographs. 73:69–86.
- Eskelinen A, Stark S, Männistö M. 2009. Links between plant community composition, soil organic matter quality and microbial communities in contrasting tundra habitats. Oecologia. 161:113–123.
- Estilow TW, Young AH, Robinson DA. 2015. A long-term Northern Hemisphere snow cover extent data record for climate studies and monitoring. Earth System Science Data. 7:137–142.
- Friedel H. 1961. Schneedeckendauer und Vegetationsverteilung im Gelände. Mariabrunn: Forstl. Bundes-Versuchsanst.
- Gillespie MAK, Baggesen N, Cooper EJ. 2016. High Arctic flowering phenology and plant – pollinator interactions in response to delayed snow melt and simulated warming. Environmental Research Letters. 11:115006.
- Havas P. 1966. Pflanzenökologische Untersuchungen im Winter. I. Zur Bedeutung Der Schneedecke Für Das Überwintern Von Heidel- Und Preisselbeere. (Plant Ecological Studies in Winter. I. On the Significance of Snow Cover for the Overwintering of Blueberry and Lingonberry.) Aquilo Seria Botanica. 4:1–36.
- Henry GHR, Molau U. 1997. Tundra plants and climate change : the International Tundra Experiment (ITEX). Global Change Biology. 3:1–9.
- Holm S. 1979. A simple sequentially rejective multiple test procedure. Scandinavian Journal of Statistics. 6:65–70.
- Høye TT, Post E, Meltofte H, Schmidt NM, Forchhammer MC. 2007. Rapid advancement of spring in the High Arctic. Current Biology. 17:449–451.
- Høye TT, Post E, Schmidt NM, Trøjelsgaard K, Forchhammer MC. 2013. Shorter flowering seasons and declining abundance of flower visitors in a warmer Arctic. Nature Climate Change. 3:759–763.
- Huelber K, Gottfried M, Pauli H, Reiter K, Winkler M, Huelber K, Gottfried M, Pauli H, Reiter K, Grabherr G. 2006. Phenological responses of snowbed species to snow removal dates in the Central Alps : implications for climate warming. Arctic, Antarctic and Alpine Research. 38:99–103.
- Inouye DW. 2008. Effects of climate change on phenology, frost damage and floral abundance of montane wildflowers. Ecology. 89:353–362.
- IPCC. 2013. Climate change 2013: the physical science basis. In: Stocker TF, Qin D, Plattner G-K, Tignor M, Allen SK, Boschung J, Nauels A, Xia Y, Bex V, Midgley PM, editors. Contribution of Working Group I to the fifth assessment report of the intergovernmental panel on climate change. Cambridge (UK and New York, NY, USA): Cambridge University Press.
- Iversen M, Bråthen KA, Yoccoz NG, Ims RA. 2009. Predictors of plant phenology in a diverse high-latitude alpine landscape: growth forms and topography. Journal of Vegetation Science. 20:903–915.
- Jonas T, Rixen C, Sturm M, Stoeckli V. 2008. How alpine plant growth is linked to snow cover and climate variability. Journal of Geophysical Research: Biogeosciences. 113:G03013.
- Jylhä K, Ruosteenoja K, Räisänen J, Venäläinen A, Tuomenvirta H, Ruokolainen L, Saku S, Seitola T. 2009. Arvioita Suomen muuttuvasta ilmastosta sopeutumistutkimuksia varten - ACCLIM-hankkeen raportti 2009. (The changing climate in Finland: estimates for adaptation studies, ACCLIM project report 2009.). Helsinki (Finland): Finnish Meterological Institute.
- Keenan TF, Richardson AD. 2015. The timing of autumn senescence is affected by the timing of spring phenology: implications for predictive models. Global Change Biology. 21:2634–2641.
- Keller F, Körner C. 2003. The role of photoperiodism in alpine plant development. Arctic, Antarctic and Alpine Research. 35:361–368.
- Khorsand Rosa R, Oberbauer SF, Starr G, Parker La Puma I, Pop E, Ahlquist L, Baldwin T. 2015. Plant phenological responses to a long-term experimental extension of growing season and soil warming in the tussock tundra of Alaska. Global Change Biology. 21:4520–4532.
- Körner C. 2003. Alpine plant life: functional plant ecology of high mountain ecosystems. 2nd ed. Berlin (Germany): Springer.
- Kudo G. 1991. Effects of snow-free period on the phenology of alpine plants inhabiting snow patches. Arctic & Alpine Research. 23:436–443.
- Kudo G, Hirao AS. 2006. Habitat-specific responses in the flowering phenology and seed set of alpine plants to climate variation: iimplications for global-change impacts. Population Ecology. 48:49–58.
- Kudo G, Ida TY. 2013. Early onset of spring increases the phenological mismatch between plants and pollinators. Ecology. 94:2311–2320.
- Kudo G, Suzuki S. 1999. Flowering phenology of alpine plant communities along a gradient of snowment timing. Polar Bioscience. 12:100–113.
- Le Roux PC, Aalto J, Luoto M. 2013a. Soil moisture’s underestimated role in climate change impact modelling in low-energy systems. Global Change Biology. 19:2965–2975.
- Le Roux PC, Lenoir J, Pellissier L, Wisz MS, Luoto M. 2013b. Horizontal, but not vertical, biotic interactions affect fine-scale plant distribution patterns in a low energy system. Ecology. 94:671–682.
- Lenth RV. 2015. Least-squares means: the R package lsmeans. Journal of Statistical Software. 69:1–33.
- Livensperger C, Steltzer H, Darrouzet-Nardi A, Sullivan PF, Wallenstein MD, Weintraub MN. 2016. Earlier snowmelt and warming lead to earlier but not necessarily more plant growth. AoB Plants. 8:plw021.
- Molau U. 1997. Responses to natural climatic variation and experimental warming in two tundra plant species with contrasting life forms: cassiope tetragona and Ranunculus nivalis. Global Change Biology. 3:97–107.
- Molau U, Nordenhäll U, Eriksen B. 2005. Onst of flowering and climate variability in an alpine landscape: a 10-year study from Swedish Lapland. American Journal of Botany. 92:422–431.
- Oberbauer SF, Elmendorf SC, Troxler TG, Hollister RD, Rocha AV, Bret-Harte MS, Dawes MA, Fosaa AM, Henry GHR, Høye TT, et al. 2013. Phenological response of tundra plants to background climate variation tested using the International Tundra Experiment. Philosophical transactions of the Royal Society of London. Series B, Biological Sciences. 368:20120481.
- Petraglia A, Tomaselli M, Petit Bon M, Delnevo N, Chiari G, Carbognani M. 2014. Responses of flowering phenology of snowbed plants to an experimentally imposed extreme advanced snowmelt. Plant Ecology. 215:759–768.
- Pinheiro J, Bates D, DebRoy S, Sarkar D, R Core Team. 2016. nlme: linear and nonlinear mixed effects models. R package version 3.1-125. https://CRAN.R-project.org/package=nlme.
- Pirinen P, Simola H, Aalto J, Kaukoranta JP, Karlsson P, Ruuhela R. 2012. Climatological statistics of Finland. 1981–2010. Finnish Meteorological Institute Reports 1.
- Prevéy J, Vellend M, Rüger N, Hollister RD, Bjorkman AD, Myers-Smith IH, Elmendorf SC, Clark K, Cooper EJ, Elberling B, et al. 2017. Greater temperature sensitivity of plant phenology at colder sites: implications for convergence across northern latitudes. Global Change Biology. 23:2660–2671.
- Räisänen J, Eklund J. 2012. 21st Century changes in snow climate in Northern Europe: a high-resolution view from ENSEMBLES regional climate models. Climate Dynamics. 38:2575–2591.
- Saarinen T, Lundell R. 2010. Overwintering of Vaccinium vitis-idaea in two sub-Arctic microhabitats: a reciprocal transplantation experiment. Polar Research. 29:38–45.
- Scherrer D, Körner C. 2010. Infra-red thermometry of alpine landscapes challenges climatic warming projections. Global Change Biology. 16:2602–2613.
- Scherrer D, Körner C. 2011. Topographically controlled thermal-habitat differentiation buffers alpine plant diversity against climate warming. Journal of Biogeography. 38:406–416.
- Scherrer D, Schmid S, Körner C. 2011. Elevational species shifts in a warmer climate are overestimated when based on weather station data. International Journal of Biometeorology. 55:645–654.
- Sedlacek J, Wheeler JA, Cortés AJ, Bossdorf O. 2015. The response of the alpine dwarf shrub Salix herbacea to altered snowmelt timing: lessons from a multi-site transplant experiment. PLoS ONE. 10:e0122395.
- Semenchuk PR, Gillespie MAK, Rumpf SB, Baggesen N, Elberling B, Cooper EJ. 2016. High Arctic plant phenology is determined by snowmelt patterns but duration of phenological periods is fixed: an example of periodicity. Environmental Research Letters. 11:125006.
- Serreze MC, Walsh JE, Chapin FSI, Osterkamp T, Dyurgerov M, Romanovsky V, Oechel WC, Morison J, Zhang T, Barry RG. 2000. Observational evidence of recent change in the northern high- latitude environment. Climatic Change. 46:159–207.
- Stone RS, Dutton EG, Harris JM, Longenecker D. 2002. Earlier spring snowmelt in northern Alaska as an indicator of climate change. Journal of Geophysical Research: Atmospheres 107: ACL10-1–ACL 10-13.
- Walker MD, Walker DA, Welker JM, Arft AM, Bardsley T, Brooks PD, Fahnestock JT, Jones MH, Losleben M, Parsons AN, et al. 1999. Long-term experimental manipulation of winter snow regime and summer temperature in arctic and alpine tundra. Hydrological Processes. 12:2315–2330.
- Wheeler HC, Høye TT, Schmidt NM, Svenning J-C, Forchhammer MC. 2015. Phenological mismatch with abiotic conditions — implications for flowering in Arctic plants. Ecology. 96:775–787.
- Wheeler JA, Cortés AJ, Sedlacek J, Karrenberg S, van Kleunen M, Wipf S, Hoch G, Bossdorf O, Rixen C, Cornelissen H. 2016. The snow and the willows: earlier spring snowmelt reduces performance in the low-lying alpine shrub Salix herbacea. Journal of Ecology. 104:1041–1050.
- Wipf S. 2010. Phenology, growth, and fecundity of eight subarctic tundra species in response to snowmelt manipulations. Plant Ecology. 207:53–66.
- Wipf S, Rixen C. 2010. A review of snow manipulation experiments in Arctic and alpine tundra ecosystems. Polar Research. 29:95–109.
- Wipf S, Sommerkorn M, Stutter MI, Jasper Wubs ER, van Der Wal R. 2015. Snow cover, freeze-thaw, and the retention of nutrients in an oceanic mountain ecosystem. Ecosphere. 6:1–16.
- Wipf S, Stoeckli V, Bebi P. 2009. Winter climate change in alpine tundra: plant responses to changes in snow depth and snowmelt timing. Climatic Change. 94:105–121.
- Wolkovich EM, Cook BI, Allen JM, Crimmins TM, Betancourt JL, Travers SE, Pau S, Regetz J, Davies TJ, Kraft NJB, et al. 2012. Warming experiments underpredict plant phenological responses to climate change. Nature. 485:494–497.
- Zhang T. 2005. Influence of the seasonal snow cover on the ground thermal regime: an overview. Reviews in Geophysics. 43:RG4002.