
ABSTRACT
Background
Parapatric (or ‘budding’) speciation is increasingly recognised as an important phenomenon in plant evolution but its role in extreme (e.g. desert) environments is poorly documented.
Aims
To test this speciation model in a hypothesised sister pair, the Southwest – North African disjunct Senecio flavus and its putative progenitor, the Namibian Desert endemic S. englerianus.
Methods
Phylogenetic inferences were combined with niche divergence tests, morphometrics, and experimental-genetic approaches. We also evaluated the potential role of an African Dry Corridor (ADC) in promoting the hypothesised northward expansion of S. flavus (from Namibia), using palaeodistribution models.
Results
Belonging to an isolated (potential ‘relict’) clade, the two morphologically distinct species showed pronounced niche divergence in Namibia and signs of digenic-epistatic hybrid incompatibility (based on F2 pollen fertility). The presence of ‘connate-fluked’ pappus hairs in S. flavus, likely increasing dispersal ability, is controlled by a single-gene locus.
Conclusions
Our results provide evidence for a possible (and rare) example of ‘budding’ speciation in which a wider-ranged derivative (S. flavus) originated at the periphery of a smaller-ranged progenitor (S. englerianus) in the Namib Desert region. The Southwest – North African disjunction of S. flavus could have been established by dispersal across intermediate ADC areas during periods of (Late) Pleistocene aridification.
Introduction
A long-held view in plant evolution research is that genetic divergence within species is promoted in arid and semi-arid regions due to high levels of population subdivision and isolation (Stebbins Citation1952, Citation1972, Citation1974; Axelrod Citation1967, Citation1972). Moreover, cycles of aridity interspersed by periods of more mesic conditions during climatic oscillations might be expected to trigger cycles of geographical isolation and renewed contact of species populations, creating conditions which further promote speciation (He et al. Citation2019). It is not surprising, therefore, that plant speciation and radiations have been shown to be characteristic of arid regions that have been climatically unstable during the Quaternary, when cycles of aridity interspersed by pluvial stages likely occurred (Kadereit and Abbott Citation2021). Despite this, few studies of plant speciation in arid areas have been undertaken and none as far as we know in sub-Saharan Africa.
Over the last decades, considerable empirical evidence has accumulated to suggest that ‘peripheral isolate’ speciation (sensu Mayr Citation1963) might be common in plants (Anacker and Strauss Citation2014, and references therein). According to this model, hereafter termed ‘budding’ speciation, a derivative species forms near the edge of a progenitor’s range, leaving the latter almost unchanged (Stebbins Citation1974; Grant Citation1981; Gottlieb Citation2004; Levin Citation2004; Crawford Citation2010; López et al. Citation2012; Otero et al. Citation2022, and references therein). Following Anacker and Strauss (Citation2014) a number of predictions arise from this model: (1) young sister species are expected to have parapatric ranges with very different sizes, that is, a larger-ranged progenitor and a smaller-ranged derivative (but see below); (2) the progenitor would be expected to be initially poly- or paraphyletic with respect to the derivative (e.g. due to incomplete lineage sorting and/or gene flow), while reciprocal monophyly might be attained only with time (e.g. due to lineage sorting, the build-up of reproductive isolation (RI) barriers or extinction); (3) especially for sister species occurring in environments of substantial edaphic and/or climatic heterogeneity, RI mechanisms can encompass ecological isolation due to strong divergent selection across habitats (see also Schluter Citation2001; Givnish Citation2010); (4) those ecological differences, in turn, might further promote prezygotic isolation (e.g. shifts in phenology, pollinators, mating system) and/or postzygotic isolation of either an extrinsic type (e.g. due to low adaptation of hybrids to parental habitats; Richards and Ortiz-Barrientos Citation2016) or an intrinsic kind (e.g. due to reduced hybrid fertility/viability caused by ‘genic’ incompatibilities, Orr and Turelli Citation2001; Johnson Citation2008; Satokangas et al. Citation2020); and (5) ‘budding’ speciation in plants might frequently be accompanied by trait changes that can generate RI more or less instantaneously, such as polyploidization and/or shifts from outcrossing to selfing (Abbott Citation2017; Slopa et al. Citation2020).
Studies that have explicitly tested hypotheses of budding speciation in plants remain few in number, with most focused on species in temperate or subtropical ecosystems, while examples from ‘extreme’ environments (e.g. hyper-arid deserts) are rare (e.g. Wang et al. Citation2013; Luebert et al. Citation2014; Ma et al. Citation2018; Singhal et al. Citation2021). Furthermore, little attention has been paid to smaller-ranged progenitor and wider-ranged derivative species (e.g. Kadereit Citation1984a; Kadereit et al. Citation1995), possibly, because of the view that asymmetrical gene flow from central to peripheral populations often retards (or ‘swamps’) local adaptation and expansion of range limits (Mayr Citation1963; Grant Citation1981; Kirkpatrick and Barton Citation1997; Levin Citation2000; Sexton et al. Citation2009). Nonetheless, some authors have suggested that, even if limited, such gene flow could provide “the crucial influx of new mutations on which local selection must operate” (c.f. Givnish Citation2001). Moreover, peripheral populations are often pollen-limited due to reduced mate availability and/or pollinator abundance (Busch Citation2005), which in turn might favour the evolution of selfing and/or dispersal ability (e.g. Baker Citation1955; Randle et al. Citation2009; Barrett Citation2014; Iritani and Cheptou Citation2017).
In the present study, we examined the possibility of budding speciation in a hypothesised sister pair of Senecio L. (Asteraceae, Senecioneae; ca. 1,200 spp., Walter et al. Citation2020) involving the Namibian Desert endemic S. englerianus O.Hoffm. and its putative derivative species, S. flavus (Decne.) Sch.Bip., a (semi-)desert species with disjunct distribution between Southwest and North Africa (Alexander Citation1979; Kadereit Citation1984b; Coleman et al. Citation2003) (). In Namibia, four biomes (or ecoregions) can be distinguished (Irish Citation1994): Desert, Nama-Karoo, Succulent Karoo, and Savanna (see . Based on available locality records, S. englerianus is largely restricted to the hyper-arid, fog-nourished coastal plains of the Northern (sandy) and (mostly gravelly) Central Namib Desert (ca. 0–870 m a.s.l.), affected by relatively cool temperatures and highly unpredictable rainfall (Giess Citation1981; Craven and Vorster Citation2006; Jürgens et al. Citation2013) (). By contrast, S. flavus is mainly distributed at higher elevations (ca. 190–1700 m a.s.l.) in the (semi-)arid Nama-Karoo biome of low-shrub vegetation, which occupies most of the interior plateau region of southern Namibia (extending into north-western South Africa) but also stretches north-westward in a narrow band along the foot of the ‘Namib Escarpment’ (). In addition, S. flavus is reported from the Succulent Karoo coastal belt of Southwest Namibia and, very rarely, from the tree and shrub Savanna biome of northern and eastern Namibia (see also Foden et al. Citation2011). Notably, S. englerianus and S. flavus occur in para-/sympatry in the interior Central Namib Desert and its hinterland (see black rectangle in .
Figure 1. (A) Map of the geographical distributions of the Namibian Desert endemic Senecio englerianus (blue dots) and S. flavus (red dots) based on geo-referenced locality records (N = 30 and 150, respectively; see text for details). (B) Map showing the species’ distributions across the four major biomes (ecoregions) of Namibia (according to Irish Citation1994) and adjacent areas (north-western South Africa: only S. flavus). The black rectangle indicates the area of species range overlap in the Central Namib Desert and its hinterland (approx. south of Mt. Brandberg to Khan River). Biome abbreviations: ND, Namib Desert; NK, Nama-Karoo; SK, Succulent Karoo; SA, Savanna.
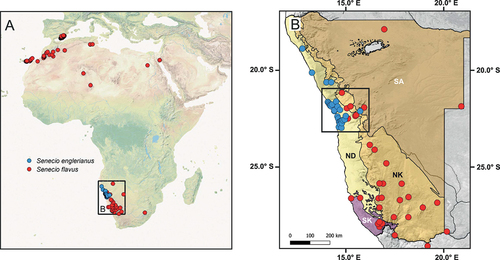
Figure 2. Habitat, phenotypes and pappus hairs of Senecio englerianus and S. flavus. (A) Gravelly coastal habitat of S. englerianus in the hyper-arid Central Namib Desert (near Swakopmund, population 3; see Table 1), associated with fruticose lichens (e.g. Teloschistes capensis) and Pencil Bush (Arthraerua leubnitziae, Amaranthaceae; see also Jürgens et al. Citation2013). (B) Rocky outcrop habitat of S. flavus in the (semi-)arid Nama-Karoo (near Keetmanshoop, ca. 500 km south of Windhoek); here, the species is known to occur (B. Nordenstam, pers. comm.; see also ), but was not found there during field work in April 2005. (C) Individual of S. englerianus near Swakopmund (population 3); the insert shows a large, cushion-forming individual from the same area (population 4) with more than a single year’s growth. (D) Individual of S. flavus from south-western Morocco/Anti-Atlas. (E) Non-fluked (‘typical’) pappus hairs of S. englerianus, with forward-pointing teeth. (F) Connate-fluked pappus hairs of S. flavus, with grappling-hook-like appendages (reproduced from Coleman et al. Citation2003, with permission from Wiley & Sons, UK, 2 December 2021). Photographs by Joseph J. Milton (A – C), Jean-Paul Peltier (D; CC BY-NC 4.0), and Max Coleman (E,F).
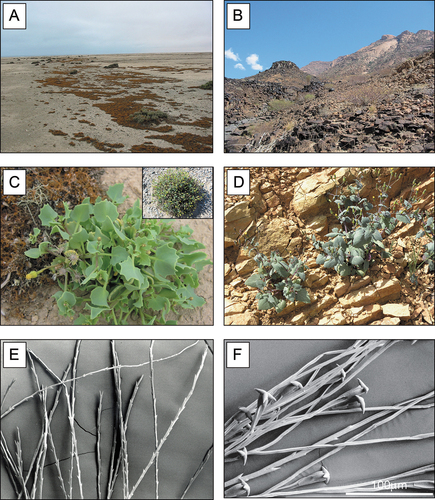
These diploid herbs (each 2n = 2x = 20; Coleman et al. Citation2001) are morphologically similar, and share characteristic petiolate leaves. However, S. englerianus is a short-lived perennial (Merxmüller Citation1967; Jürgens et al. Citation2021; J.J. Milton, pers. obs.), has smaller, more succulent leaves and larger capitula, and is dimorphic for capitulum-type (mostly non-radiate, occasionally radiate; Jürgens et al. Citation2021), whereas S. flavus is an annual herb with non-radiate capitula throughout its range (Alexander Citation1979; Coleman et al. Citation2001; e-Flora of South Africa Citation2018) (). Furthermore, in S. englerianus, the pappus hairs have forward-pointing teeth, as typical for the genus (Drury and Watson Citation1966), and detach easily from the achene (); by contrast, S. flavus has additional, so-called ‘connate-fluked’ pappus hairs with grappling-hook-like appendages (accounting for about 1/3 of the entire pappus; , and which might enhance the species’ dispersal capacity (Coleman et al. Citation2003). Finally, S. flavus is fully self-compatible (Liston et al. Citation1989; Coleman et al. Citation2003), with an estimated selfed seed set (mean ± S.E.) of 74.2 ± 4.2% (N = 40), while S. englerianus fails to set seed when left to self (J.J. Milton, unpublished data).
Based on isozyme data and biogeographical considerations, Liston et al. (Citation1989) have hypothesised that S. flavus originated in Southwest Africa and expanded its range to North Africa, possibly via an African Dry Corridor (ADC) during periods of Pleistocene aridification (e.g. van Zinderen Bakker Citation1975; reviewed in Neumann and Scott Citation2018). Subsequent phylogenies of Senecioneae, inferred from internal transcribed spacer (ITS) regions of nuclear ribosomal (nr) DNA, indeed suggested that the closest relative of S. flavus is S. englerianus (Coleman et al. Citation2003; Pelser et al. Citation2007). In both studies, this highly supported and long-branched ‘petiolate’ clade (sensu Coleman et al. Citation2003) appeared only distantly related to sect. Senecio or South African species. Furthermore, Coleman et al. (Citation2003) have found no nucleotide differences between S. englerianus and Namibian S. flavus, and (roughly) dated the split between the latter and North African S. flavus (one nucleotide difference) to the Late Pleistocene, ca. 0.15 million years ago (Mya).
Overall, S. englerianus and S. flavus provide an excellent system for evaluating the hypothesis of budding speciation in a putative pair of sister species that occur in parapatry in an isolated arid ecosystem, including the identification and characterisation of RI barriers. In addition, by using palaeodistribution modelling (Phillips et al. Citation2017), the disjunct distribution of S. flavus allows testing the ADC hypothesis of an ‘arid track’ promoting plant migration from Southwest to North Africa during the Pleistocene. Accordingly, the specific aims of the present study were as follows. First, to re-examine the putative sister relationship of S. englerianus and S. flavus (Coleman et al. Citation2003; Pelser et al. Citation2007) and, in particular, to estimate their divergence time, based on an extended taxon sampling (especially of Southwest and South African species), the inclusion of multiple intraspecific accessions of S. englerianus/S. flavus, and modern techniques in molecular dating. Second, to determine the extent of environmental niche overlap and differentiation between the two species in Namibia, and their morphological divergence. Third, to evaluate differences in mating system based on pollen counts (pollen/ovule ratios; Cruden Citation1977) and the genetic basis of ‘intrinsic’ postzygotic isolation (based on F2 pollen fertility) and differences in pappus type between S. englerianus and S. flavus. Fourth, to test for a potential role of the ADC in promoting the hypothesised northward expansion of S. flavus, using palaeodistribution modelling.
Materials and methods
Field work in Namibia and experimental plant material
In April 2005, field work was conducted by one of us (J.J.M.) for two weeks in western and southern Namibia. This seasonal timing (at the end of the summer-rain period) was considered suitable based on phenological dates derived from herbarium specimens (personal collection Bertil Nordenstam/Swedish Museum of Natural History). Seed and silica-dried leaf material were collected from three coastal populations of S. englerianus in the Central Namib Desert (), but despite intensive searching, no populations of S. flavus were found. Notably, in Namibia, this (semi-)desert annual is reported to flower in response to rainfall, being “very common in years of good rain and apparently very rare in drier years” (c.f. Foden et al. Citation2011). Hence, due to the lack of living material of Namibian S. flavus, individuals of this species were grown from seed material, collected previously from Canary Island and Moroccan populations, to conduct comparative cultivation and crossing experiments (see and further below).
Table 1. Locality information of populations and accessions of Senecio englerianus and S. flavus used for phylogenetic (phyl), morphometric (morph) and experimental-crossing analyses (marked with an asterisk). GenBank accession numbers are provided for all previously published and newly generated ITS sequences (the latter in italics).
Assembly of geo-referenced locality records for S. englerianus and S. flavus
To illustrate the distributions of the species at the contintental-wide scale and in Southwest Africa (), we retrieved geo-referenced locality records for S. englerianus vs. S. flavus from various sources, including (1) the Global Biodiversity Information Facility [GBIF.org; S. englerianus: GBIF.org (5 November 2020) GBIF Occurrence Download https://doi.org/10.15468/dl.4be9tr; S. flavus: GBIF.org (9 November 2020) GBIF Occurrence Download https://doi.org/10.15468/dl.4be9tr]; (2) the Plants of Namibia Datbase/BRAHMS online (Craven and Kolberg Citation2021; https://doi.org/10.15468/dl.4be9tr); (3) iNaturalist (inaturalist.org); (4) published sources (Coleman et al. Citation2003); (5) the personal collection of B. Nordenstam (see above); and (6) own field work in Namibia (only S. englerianus; full data available on request). Duplicate occurrence records per species and GBIF records outside known taxon ranges were filtered out. Maps were generated in QGIS v3.8 (QGIS Development Team Citation2019) after retaining 30 locality records of S. englerianus and 150 of S. flavus [Southwest Africa (i.e. Namibia/north-western South Africa): 33; eastern South Africa (KwaZulu-Natal): 1; Canary Islands (Fuerteventura), North Africa (Morocco to Middle East) and south-eastern Spain: 116]. We also used these records for niche analyses and species distribution modelling (see below).
Phylogenetic analyses of Senecioneae and the ‘petiolate’ clade
To estimate the stem and crown group ages of the ‘petiolate’ clade of S. englerianus/S. flavus, and its phylogenetic position within Senecioneae (ca. 150 genera, > 3,000 spp.; Pelser et al. Citation2007), we first retrieved 371 ITS sequences (ca. 340 spp.) from GenBank (e.g. Panero et al. Citation1999; Pelser et al. Citation2007, Citation2010; Kandziora et al. Citation2017), representing (1) one acession of S. englerianus (population 1) and three of S. flavus [Namibia, Morocco (AS), Fuerteventura]; (2) all major clades of Senecio s. str. (e.g. ‘vulgaris’, ‘windhoekensis’, ‘suaveolens’; sensu Kandziora et al. Citation2017); (3) 27 genera of subtribe Senecioninae (e.g. Arrhenechthites, Crassocephalum, Curio, Erechtites, Jacobaea, Kleinia); (4) two genera of subtribe Othonnineae (Euryops, Othonna); and (5) one species of tribe Athroismeae (Anisopappus pinnatifidus). We further complemented this ‘Senecioneae’ ITS dataset with 33 newly generated sequences of sub-Saharan (mostly Namibian and/or South African) species of Senecio (31 spp./32 accessions) and Kleinia crassulaefolia (South Africa). Respective leaf samples were obtained from field work by one of us (J.J.M.) in South Africa (September 2004 and 2005; 28 spp.), the living collection of the Royal Botanic Garden Edinburgh (RBGE; 3 spp.), and a personal herbarium (Michael Möller, RBGE). Details of DNA extraction, ITS amplification, sequencing and cloning (4 spp.) can be found in the Supplementary Material. Detailed information on all taxa included in the phylogenetic analysis of Senecioneae (403 accessions, ca. 363 spp.), together with GenBank accession numbers, information on species distributions and locality sources of newly sequenced ITS samples, are provided in Supplementary Tables S1–S3.
Sequences of this Senecioneae dataset were assembled and aligned in GENEIOUS v8.1.9 (https://doi.org/10.15468/dl.4be9tr; data matrix available on request). Bayesian searches for tree topologies and node ages were conducted in BEAST v1.7.5 (Drummond et al. Citation2012) with the GTR+G substitution model and an uncorrelated log-normal relaxed clock (Drummond et al. Citation2006). The tree speciation prior followed a Yule process. For calibration, we assumed a normal distribution of the ITS substitution rate of Asteraceae with a mean (± S.D.) of 4.59 ± 2.42 × 10⁻⁹ substitutions per site per year (Kay et al. Citation2006). Due to computational limitations and no additional analytical benefits of a high sampling frequency, we aimed for no more than 104 trees/samples in our analysis (Drummond et al. Citation2012; see also A.J. Drummond, pers. comm., at https://doi.org/10.15468/dl.4be9tr). Accordingly, three independent Markov chain Monte Carlo (MCMC) simulations were run for 108 generations, sampling every 104 generations. The three runs were combined after removing 67% of the trees; the remainder was used to construct a maximum clade credibility (MCC) chronogram with clade posterior probabilities (PP), mean node ages and 95% highest posterior density (HPD) intervals. The full MCC topology was also visualised as a ‘circle tree’ using PHYTOOLS v0.7–90 (Revell Citation2012).
To further clarify relationships within the ‘petiolate’ clade, we assembled all GenBank ITS sequences of S. englerianus (N = 1) and S. flavus (N = 4) with six newly generated ones [one each per populations 2–4 vs. two from Morocco (TA); see ], plus all GenBank accessions of the Arrhenechthites–Dendrocacalia clade (4 spp.), as putative sister group based on the Senecioneae phylogeny (see Results). We then used RAxML (Stamatakis Citation2014) from the raxmlGUI v2.0 platform (Edler et al. Citation2021) to construct a maximum likelihood (ML) tree under the default GTR+G model. The best-fit tree was rooted with Arrhenechthites novoguineensis and annotated with bootstrap support (BS) values based on 1000 replicates.
Niche overlap and divergence analyses
We used the environmental-(E)-space-based framework of the R package HUMBOLDT (Brown and Carnaval Citation2019) to study niche overlap and divergence between S. englerianus and S. flavus in Southwest Africa, based on our 63 presence records for this region (N = 30 vs. 33; ; i.e. excluding one S. flavus outlier record from eastern South Africa; . We first retrieved 19 bioclimatic variables (bio1–19) at 2.5 arc-minutes resolution for current conditions (1950–2000) from WORLDCLIM v1.4 (Hijmans et al. Citation2005; https://doi.org/10.15468/dl.4be9tr) and downloaded elevation data from WORLDCLIM v2.1 (Fick and Hijmans Citation2017; https://doi.org/10.15468/dl.4be9tr). We subsequently removed highly correlated climatic variables (Pearson’s r > |0.9|) in R using ENMTOOLS v1.4.4 (Warren et al. Citation2010) to minimise model overfitting. Based on elevation and 12 climatic variables retained (i.e. bio1, 3, 6, 7, 9–11, 15–19; see Table S4 for code identification), we conducted a principal component analysis (PCA), along with kernel density functions, to visualise the species’ environmental niche overlap in two dimensions.
In addition, we performed two niche similarity tests implemented in HUMBOLDT, i.e. ‘niche overlap test’ (NOT) and ‘niche divergence test’ (NDT), each of them including the calculation of equivalency (E) and background (B) statistics using 500 replicates. In brief, NOT determines how equivalent (or dissimilar) the occupied niches of the two species are, given their total E-space, while NDT determines significant differences in the species’ shared E-space (Brown and Carnaval Citation2019; see also Habibzadeh et al. Citation2021). In either instance, the E statistic compares the observed value of Schoener’s (Citation1968) D metric between the two species, ranging from 0 (no niche overlap) to 1 (complete overlap), with a null distribution obtained from the resampled and spatially shifted locality records of the species. In contrast, the B statistic compares the interspecific D value observed to differences between S. englerianus and the resampled and reshuffled occurrences of Southwest African S. flavus, and vice versa (denoted Bflav–>engl and Bengl–>flav, respectively). The B statistic evaluates if two species are more different than would be expected given the underlying environmental differences between the regions in which they occur. However, regardless of the B statistic, a significant E statistic in both NOT and NDT provides strong evidence that the species’ niches are not only different but have also diverged. The same applies if very low D values are observed in both tests and NOT is significant (see Brown and Carnaval Citation2019, for tabulation of interpreting other results).
Plant cultivation and controlled crossing experiments
Plants were raised from fruits (achenes) collected from different mother plants in each of three populations of S. englerianus (populations 2–4) and S. flavus [Morocco (AS, TA), Fuerteventura (FU); ]. After germinating achenes on damp filter paper, seedlings were transplanted to pots (7.6 cm diameter) containing a 3 : 1 mixture of Levington’s M2 compost to gravel. Plants were arranged in a randomised block design and raised at ambient temperature in a greenhouse with natural light, supplemented by 400 W mercury vapour lamps with photoperiod set to 16 h. In addition, experimental crosses were made between one individual each of S. englerianus populations 2 and 3 (specimens 2.2 and 3.29) and one individual each of Moroccan S. flavus from AS and TA (AS.1 and TA.5). In all crosses, individuals of S. flavus were used as maternal parent and subjected to the emasculation technique by Alexander (Citation1979), resulting in two self-fertile F1 generations (AS.1 × 3.29 and TA.5 × 2.2). One F1 individual (‘no. 1’) of the AS.1 × 3.29 cross was further used for the production of an F2 generation through self-pollination (bagging). All F1 and F2 plants were raised in the greenhouse as described above.
Quantitative trait analyses
At full anthesis of the apical capitulum, 14 quantitative characters (C1–C14) were scored for 13 individuals of S. englerianus (six from population 2 and seven from population 3), six individuals of S. flavus (five from TA and one from FU), and four F1 hybrids created by crossing the two species (i.e. two individuals each of crosses AS.1 × 3.29 and TA.5 × 2.2; see above). Following Lowe and Abbott (Citation2000), the morphological traits measured (C1–C13) included: plant height, inflorescence and peduncle length, capitulum length and width, and various descriptors of leaf size and shape (for details, see Table S5). In addition, we measured leaf water content (C14), a physiological proxy for tissue succulence (Fradera-Soler et al. Citation2021), by weighing midleaves, drying them overnight in an oven and then reweighing.
For statistical analyses, non-normally distributed measures of size (C1–C8) were natural log-transformed; leaf perimeter (C12) and square root of leaf area (C13) were divided by midleaf length to standardise; and percentages of leaf water content (C14) were arcsine transformed. The full matrix of 23 individuals × 14 characters (Table S6) was subjected to one-way analysis of variance (ANOVA) and Tukey’s HSD (honestly significant difference) post-hoc test using the R package DPLYR v1.0.6 (Wickham et al. Citation2021) to test for significant inequality of character means among groups (both species and the F1 plants) and to detect which means differed significantly from each other. Finally, the data matrix was subjected to a PCA in R v3.6.2 (R Development Core Team Citation2017) and visualised in two dimensions using GGBIPLOT v0.55 (Vu Citation2011). To complement traditional PCA loadings, we also calculated the percentage contribution of each variable to each ordination axis (PC1, PC2), using the R package FACTOEXTRA v1.0.5 (Kassambara and Mundt Citation2017).
Estimates of pollen number and pollen fertility in parental, F1 and F2 plants
Pollen number and fertility were estimated for one individual each of S. englerianus (specimen 3.29), Moroccan S. flavus (AS.1), their F1 [AS.1 × 3.29 (1)], as well as 32 individuals of the F2 generation, produced by self-pollination of this F1 hybrid. Total pollen counts were made by means of light microscopy, using 2–5 florets per capitulum and one or two capitula per individual. Concomitantly, pollen fertilities were estimated by staining viable pollen with aceto-carmine. Mean pollen numbers and mean percentages of pollen fertility were calculated for parental species, the F1 hybrid and the F2 generation (for the full data matrix, see Table S7). Resulting frequency distributions of F2 pollen counts and fertility were compiled in histograms and examined for normality using Shapiro-Wilks (W) test in R, with P > 0.05 indicating a normal distribution. As the F2 histogram for pollen fertility indicated a bimodal pattern (see Results), we applied the Expectation Maximization (EM) algorithm (Dempster et al. Citation1977) to fit two Gaussian (normal) distributions to this dataset, using the R package MIXTOOLS v1.2.0 (Young et al. Citation2020). Frequency estimates of each class and distribution were subjected to Mendelian ratio/Chi-square analyses to evaluate the genetic basis of reduced F2 hybrid fertility (viz. hybrid incompatibility; e.g. Johnson Citation2008). Note, with two peaks in an F2 phenotype distribution, four possible Mendelian ratios are expected (Griffiths et al. Citation2000), namely 3 : 1 (one full dominant gene); 9 : 7 (two duplicate recessive epistatic genes); 13 : 3 (two recessive-dominant epistatic genes); and 15 : 1 (two duplicate dominant epistatic genes).
Genetic analysis of pappus type
To examine the genetic basis of present vs. absent connate-fluked (CF) pappus hairs in S. englerianus vs. S. flavus (Coleman et al. Citation2003) (), we examined the segregation of this trait in the same F2 family as described above for the analysis of pollen number and fertility. Accordingly, one individual each of the two species, their self-fertile F1 hybrid [AS.1 × 3.29 (1)], and 87 individuals of the F2 generation were examined for pappus type by light microscopy. Observed morph frequencies were evaluated by Chi-square analysis to evaluate their adequacy with a single gene model, as often reported for presence/absence dimorphisms (e.g. Gottlieb Citation1984; Lankinen Citation2009).
Present and past distribution modelling of S. englerianus and S. flavus
Based on our locality records of S. englerianus (N = 30) and Southwest African S. flavus (N = 33), ecological niche models (ENMs) were generated for each dataset in MAXENT v3.4.1 (Phillips et al. Citation2017) for the present, and two past periods: the humid mid-Holocene Climate Optimum (HCO; ca. 6 kyr ago) and the arid Last Glacial Maximum (LGM; ca. 22 kyr ago). This allowed us to determine whether the ranges of the two species in Southwest Africa may also have been continuous (para- or sympatric) in the past (rather than allopatric), and whether S. flavus could have reached North Africa via the ADC during periods of aridification as hypothsised by Liston et al. (Citation1989). For each dataset, the current distribution (1950–2000) was modelled using 11 bioclimatic layers at 2.5 arc-minutes resolution (bio2, 7–11, 15–19; Table S4) after removing highly correlated variables (r > |0.9|). Each model was then projected on to palaeoclimatic datasets simulated by the Model for Interdisciplinary Research on Climate (MIROC) for, respectively, the HCO (MIROC-ESM; https://doi.org/10.15468/dl.4be9tr) and the LGM (MIROC-ESM; https://doi.org/10.15468/dl.4be9tr). Present-day distributions were modelled 10 times, using different subsets of 75% of the localities to train the model. Model accuracy was evaluated for each run, and for both training and testing data, using the Area Under the Curve (AUC) of the Receiver Operating Characteristic (ROC) plot. For comparison, we also generated present and past ENMs for all 150 records of S. flavus from across the range of the species.
Results
Phylogeny reconstruction, molecular dating and intra-clade relationships
Our BEAST-derived MCC chronogram of Senecioneae () recovered representative accessions of S. englerianus (population 1) and S. flavus [Namibia, Morocco (AS), Fuerteventura] as a highly supported clade (PP = 1.0; see Supplementary Figure S1 for the full tree topology). However, this apparently highly isolated ‘petiolate clade’ (sensu Coleman et al. Citation2003) essentially formed a polytomy with three other clades (each PP = 1.0), namely Senecio s. str., Crassocephalum–Erechtitis and Arrhenechthites–Dendrocacalia (including Senecio thapsoides). We estimated the stem age of the S. englerianus/S. flavus clade to the early Late Miocene, ca. 10.91 Mya, albeit with large 95% HPDs (23.14–3.26 Mya), and its crown age to the Early Pleistocene, ca. 1.47 (2.72–0.11) Mya (see Table S8 for divergence dates of other major clades and lineages).
Figure 3. BEAST-derived maximum clade credibility (MCC) chronogram of Senecioneae, plus one member of Athroismeae (Anisopappus pinnatifidus), based on ITS sequences, with collapsed major clades. Numbers above branches indicate Bayesian posterior probability (PP) values. Branches in dashed lines indicate PP ≤ 0.95. Designation of clades within Senecio s. str. largely follows Kandziora et al. (Citation2017). Mean estimates of stem (A) and crown (B) ages for the ‘petiolate’ clade (in million years ago, Mya) are indicated, together with 95% highest posterior density (HPD) intervals (in parentheses). Respective time estimates and 95% HPDs for all other major clades and single species lineages are summarised in Table S8. Pleis, Pleistocene. See Figure S1 for the full MCC chronogram of all 403 accessions (ca. 363 spp.).
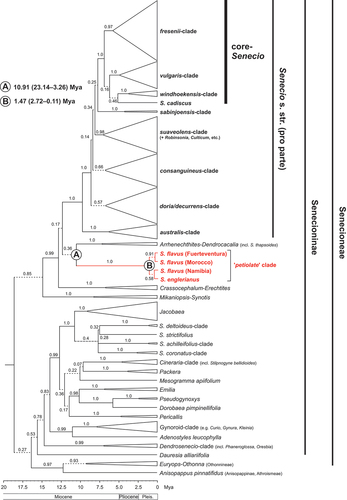
However, relationships within this ‘petiolate’ clade largely remained unresolved (), even after subjecting all available ITS sequences of each species (10 in total) to ML analysis, with species of the Arrhenechthites–Dendrocacalia clade serving as outgroup (see Figure S2). Nonetheless, while all accessions of Senecio englerianus (N = 4) and the single one of Namibian S. flavus essentially collapsed into a polytomy, all northern material of S. flavus [Morocco (AS, TA), Fuerteventura, Egypt; N = 5] formed a weakly supported cluster (BS = 57%) due to a single, shared derived nucleotide substitution (T to C transition).
Niche differentiation between S. englerianus and S. flavus in Southwest Africa
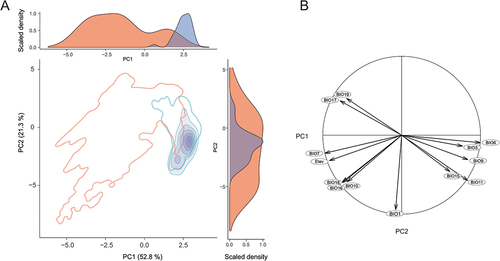
The HUMBOLDT-derived PCA biplot and associated density plots () revealed limited environmental niche overlap (purple) between S. englerianus (blue, higher scores) and S. flavus (red, lower scores) in Southwest Africa, largely due to differences along the first component (PC1), explaining 52.8% of the total variance (PC2: 21.3%). Considering the corresponding correlation circle of 13 environmental variables (), PC1 was more or less positively correlated with isothermality (bio3), minimum temperature of coldest month (bio6), measures of quarterly temperature (bio9, bio11), and precipitation seasonality (bio15), and negatively loaded for temperature annual range (bio7), indices of quarterly precipitation (bio16–19), and elevation. Hence, relative to S. englerianus, S. flavus tends to occur at higher elevation sites, mostly in the Nama-Karoo (), which experience stronger fluctuations in annual temperature (bio3, bio7) as well as higher and more predictable seasonal or annual rainfall (bio15–19). For the niche overlap test (NOT), Schoener’s D value in the E statistic was significant and near-zero (D = 0.003, P = 0.002), while the two B statistics were non-significant (Bflav–>engl: P = 0.375; Bengl–>flav: P = 0.582). The E statistic of the niche divergence test (NDT) yielded a D value of zero, albeit without significance (P = 0.21), while the two B statistics were significant (Bflav–>engl: P = 0.003; Bengl–>flav: P = 0.012). We suspect that the non-significant D value in the NDT reflects limited statistical power due to insufficient occurrence records in the species’ limited area of range overlap (i.e. Central Namib Desert and hinterland; see black rectangle in ); alternatively, this outcome might indicate a true lack of shared available E-space. Regardless, a significant NOT combined with (near-) zero D values in both NOT and NDT provides strong evidence that the environmental spaces occupied by the two species in Southwest Africa are not only significantly different (i.e. non-equivalent) but truly reflect divergent niche evolution (Brown and Carnaval Citation2019).
Figure 4. (A) HUMBOLDT-derived principal component analysis (PCA) biplot, along with density plots for each component (PC1, PC2), depicting the extent of environmental niche overlap (purple) between Senecio englerianus (blue) and S. flavus (red) in Southwest Africa. Percentages of total variance explained by each component are shown in parentheses. Filled kernel isopleths represent kernel densities from 1–100%. Empty kernel isopleths represent the 1% density isopleths of the environments (not species) outside boundaries of environmental (E) space. (B) Corresponding correlation circle of 12 bioclimatic variables (see Table S4 for code identification) and elevation (Elev). The length and directionality of arrows (vectors) illustrate, respectively, the strength of contribution (loading) and sign of correlation (positive, negative) of each variable on the two components (PC1: x-axis; PC2: y-axis). Variables closer to each other are thus more correlated on a given component. Analyses were conducted based on 63 locality records (S. englerianus: N = 30; S. flavus: N = 33; see also ).
Quantitative trait analyses
One-way ANOVA revealed significant (P ≤ 0.05) differences in means between S. englerianus (N = 13), S. flavus (N = 6; Morocco, Fuerteventura) and their F1 hybrids (N = 4) for 10 of the 14 characters recorded (). Tukey’s HSD tests showed significant differences between the means of S. englerianus and S. flavus for all of these characters except for midleaf apical vein angle (C10). Thus, relative to S. flavus, S. englerianus was shorter in height (C1), had longer inflorescences (C2) and wider capitula (C5), and produced smaller, more succulent leaves with fewer midleaf lobes (C7–C9, C12–C14). For half of these characters (i.e. C2, C7–C9, C14), the F1 individuals showed an intermediate phenotype between both parental species. For two characters (height, capitulum width), the means of F1 plants were significantly greater than those of either parent species ().
Table 2. Means (± S.E.) of 14 trait variables (C1–C14) measured on 13 individuals of Senecio englerianus (six from population 2, seven from population 3), six individuals of S. flavus [five from Morocco (TA), one from Fuerteventura (FU)] and four F1 hybrids created by crossing the two species (i.e. two individuals each of crosses AS.1 × 3.29 and TA.5 × 2.2; see text). Shared superscript letters indicate no significant difference at the 5% level using Tukey’s multiple comparisons HSD (honestly significant difference) test. One-way analysis of variance (ANOVA) F-value significance: * P <0.05; ** P ≤0.01; *** P ≤0.001; NS, not significant. Note, non-normally distributed measurements of size (C1–C8) were natural log-transformed, and C14 was arcsine transformed.
In the corresponding PCA (), the first component (PC1), explaining 41.5% of the total variance, clearly separated S. englerianus and S. flavus into low- and high-score clusters, respectively, which largely reflected their differences in leaf size and shape (C7–C9, C12, C13) and leaf succulence (C14; see Table S5 for loadings and variable contributions). The F1 plants occupied an intermediate position between the parental clusters along PC1, yet closer to S. englerianus; however, they were largely separated from either parent along PC2 (17.9%), mainly because of their greater stature and higher values in other variables that were strongly negatively correlated with this second component [e.g. peduncle length (C3), calyculus bract length (C6), midleaf vein angles (C10, C11); see Table S5].
Figure 5. Principal component analysis (PCA) biplot of 14 quantitative trait variables (C1–C14) measured for Senecio englerianus (N = 13), S. flavus (N = 6; Morocco, Fuerteventura), and F1 hybrids (N = 4). Percentages of total variance explained by each component (PC1, PC2) are noted in parentheses. Ellipses were fitted to the PCA plane (rather than to the full multivariate data set) so as to include 95% of the points in each of the three groups. See Table 2 for identification of trait codes (C1–C14), and Table S5 for details of trait measurements as well as factor loadings and variable contributions (in %) for each component.
Pollen number and fertilities of parental, F1 and F2 individuals
As summarised in , the S. englerianus parent plant (3.29) produced, on average, more than six times the amount of pollen grains per floret (mean ± S.E.: 3394.40 ± 153.15) than the S. flavus parent (AS.1) from Morocco (495.20 ± 46.95). However, in both individuals, pollen fertility was very high, particularly in S. englerianus (99.0% vs. 89.68%). The mean pollen count of their self-fertile F1 individual [AS.1 × 3.29 (1)] was about the same as in the S. flavus parent (409 ± 31.52 grains per floret, indicating a strong maternal effect), while pollen fertility was significantly reduced (59.3%). The mean pollen count of the F2 generation (N = 32) was intermediate to that of the parents (1825.35 ± 48.14 grains per floret), and mean pollen fertility (85.24%) was greater than that recorded for the F1 hybrid ().
Table 3. Mean estimates of pollen number (grains per floret) and percentage pollen fertility in Senecio englerianus (specimen 3.29), Moroccan S. flavus (AS.1), one of their F1 hybrids [AS.1 × 3.29 (1)], and 32 individuals of the F2 generation, produced after self-pollination of this F1 hybrid. Standard errors are shown in parentheses.
The pollen count data for the F2 generation () fitted a normal distribution (Shapiro-Wilks’ W = 0.980, P = 0.781), likely reflecting recombination and segregation of alleles at several or many loci. Of the 32 F2 plants examined, 11 had mean pollen counts between 1750 and 2000 grains per floret, hence intermediate with respect to the values of the two parents (see above). Notably, none of the F2 individuals had mean pollen counts as low as either the S. flavus parent or the F1 hybrid, with the lowest values falling into the class of 1000–1250 grains per floret. By contrast, the distribution of pollen fertilities for the F2 () departed from normality (W = 0.897, P = 0.005) and appeared bimodal. Seventeen and 15 individuals had a mean fertility from 55% to <90% and from ≥90% to 100%, respectively. Hence, the observed ratio of ‘low’ to ‘high’ fertility F2 plants (8.5 : 7.5) was not significantly different from a digenic epistatic ratio of 9 : 7 (χ2 = 0.127, d.f. = 1, P = 0.722). If the two fitted distributions were taken into account (see long-dashed vs. solid lines in , one individual from the ‘high’ class (marked by an asterisk) appeared to fall into the ‘low’ class, resulting in an exact ratio of 9 : 7 (N = 18 : 14; χ2 = 0.0, d.f. = 1, P = 1.0). Yet regardless of such ambiguity, these results are consistent with the hypothesis that reduced F2 pollen fertility (viz. ‘hybrid incompatibility’) between S. englerianus and S. flavus results from the interaction of two independently assorting genes. According to this ‘duplicate recessive-epistatic gene model’, one dominant allele at each gene would be sufficient to reduce fertility, while homozygosity for a recessive allele at either gene, or at both genes, causes high pollen fertility (Griffiths et al. Citation2000).
Figure 6. (A) Histogram of mean pollen counts for Senecio englerianus × S. flavus F2 hybrids (N = 32) with fitted normal distribution (solid line), using R. (B) Histogram of mean percentage pollen fertility in the same F2 generation. Smooth long-dashed and solid lines indicate expected F2 frequencies according to two normal distributions for the ‘low’ and ‘high’ F2 series, respectively, as fitted by the R package MIXTOOLS. Note, after curve fitting, one individual from the ‘high’ class (marked by an asterisk) appeared to fall into the ‘low’ class, resulting in an exact ratio of 9 : 7 (see text).
Genetic basis of pappus type
The S. flavus individual (AS.1) used as a parent of the F1 and F2 generations produced achenes with connate-fluked (CF) pappus hairs (in addition to ‘typical’, non-fluked ones), while the S. englerianus parent (3.29) did not. Their F1 hybrid also produced achenes with a CF pappus. Of 87 F2 individuals, 68 exhibited this pappus type as well, while the remaining 19 produced only a non-fluked (NF) pappus. Hence, the CF : NF ratio observed (3.58 : 1) was not significantly different from a Mendelian 3 : 1 ratio (χ2 = 0.437, d.f. = 1, P = 0.509). These results are consistent with a single (‘major’) gene model, involving a completely dominant allele for expression of the CF pappus present in S. flavus and a recessive allele for the NF pappus at the locus in S. englerianus.
Present and past climatic distribution predictions
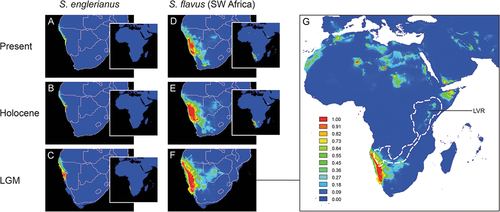
The mean AUC training/testing values for the current distribution models of S. englerianus (0.999/0.999) and Southwest African S. flavus (0.994/0.994) were very high, indicating excellent predictive model performance (see Pflugbeil et al. Citation2021, and references therein). For S. englerianus, the ENMs for the present, the HCO (ca. 6 kyr ago) and the LGM (ca. 22 kyr ago; see ) indicated relatively stable environments over time, with generally higher suitability (threshold ca. ≥0.7) in the Central than Northern Namib Desert, especially during the LGM. Considering S. flavus, present and HCO models () indicated most favourable conditions along the Namib Escarpment of western/southern Namibia (the species’ actual core-range) but also predicted areas of lower suitability (ca. 0.3–0.7) where the species is either extremely rare (central/eastern Namibia, interior of South Africa) or absent (Northern Namib Desert). During the LGM, suitable habitat for S. flavus may have existed in the Central Kalahari Desert (Botswana), the Lake Victoria Region (LVR), the Horn of Africa, the Sahara Mts., and Northwest Africa (). This LGM model, however, failed to recover a continuous African Dry Corridor (ADC) from Southwest Africa to Northeast Africa (see white-dashed lines in . The same was true when all 150 records of S. flavus from across the range of the species were taken into account (see Figure S3).
Figure 7. Ecological niche models (ENMs) for Senecio englerianus (A–C) and Southwest African S. flavus (D–G) in Namibia and adjacent regions at the present (1950–2000), the mid-Holocene Climate Optimum (HCO, ca. 6 kyr ago), and the Last Glacial Maximum (LGM, ca. 22 kyr ago). For each time period, potential distributions are also shown at the continental scale (see inserts A–E, and enlarged figure G for S. flavus at the LGM). ENMs were generated in MAXENT on the basis of 11 current bioclimatic variables and a total of 66 specimen records (S. englerianus: N = 30; S. flavus: N = 33; see text for details). Predicted distribution probabilities (ranging from zero to one) are shown in each 2.5 arc-minute pixel. In G, the white-dashed lines delimit the African Dry Corridor (ADC) during arid periods of the Pleistocene according to Neumann and Scott (Citation2018). LVR, Lake Victoria Region. See Figure S3 for corresponding ENMs of S. flavus based on all 150 locality records from across the range of the species.
Discussion
Evolutionary history of the ‘petiolate’ clade of S. englerianus and S. flavus
Our phylogenetic analyses of Senecioneae based on ITS data ( and S1) clearly support the monophyly of the ‘petiolate’ clade of Senecio englerianus and S. flavus. They also confirm earlier phylogenetic estimates (Pelser et al. Citation2007) that the two target species are not only distantly related to sect. Senecio viz. the ‘core clade’ of Senecio (sensu Kandziora et al. Citation2017) but are neither part of Senecio s. str. Furthermore, age estimates indicate that the stem age of the ‘petiolate’ clade possibly dates back to the early Late Miocene, ca. 10.91 Mya (95% HPD: 23.14–3.26 Mya), whereas its crown age falls into the Early Pleistocene, ca. 1.47 (2.72–0.11) Mya (, Table S8). Clearly, these time estimates (especially for the stem age) have broad HPD intervals, and must be viewed cautiously. Also, despite the fact that our taxon sampling covers ca. 71% of all species of Senecio s. str. (15/21) reported for the Namibian Flora (Klaassen and Kwembeya Citation2013; Craven and Kolberg Citation2021), and ca. 149 sub-Saharan (incl. 119 South African) species of Senecioneae (see Table S1), possibly more than 120 nominal species of Senecio are still missing from the ‘Afrotropic’ ecozone (Kandziroa Citation2015; Kandziora et al. Citation2017). Hence, it remains unclear whether the long branch subtending the ‘petiolate’ clade reflects (1) an artefact of incomplete taxon sampling; (2) an extra-Namibian origin of this clade; or (3) long-term stasis and/or extinction of putative earlier lineages of S. englerianus/S. flavus in situ.
Nevertheless, our estimated stem age for this ‘petiolate’ clade remarkably coincides with the onset of cold north-bound currents along the south-western coast of Africa (Benguela-Namib Upwelling, BNU) during the early Late Miocene (ca. 12–10 Mya; due to an increase in strength of the Antarctic Circumpolar Current, ACC; ca. 14 Mya), and which triggered (or intensified) arid or semi-arid conditions in today’s Namib Desert region (e.g. Heinrich et al. Citation2011; Rommerskirchen et al. Citation2011; Nylinder et al. Citation2016; Wan et al. Citation2021). By contrast, the clade’s much younger crown age slighty post-dates the strengthening and further (abrupt) cooling of the BNU system during the Early Pleistocene (ca. 2.1 to 1.9 Mya; Marlow et al. Citation2000; see also Berger et al. Citation2002; Rommerskirchen et al. Citation2011). Molecular phylogenetic studies of other Namibian clades, though few in number, likewise report long ‘waiting times’ between origin and diversification, in both plants (e.g. Indigofera: Schrire et al. Citation2009; Monsonia: García-Aloy et al. Citation2017; but see Petaldium: Tripp et al. Citation2017) and animals (e.g. insects, reptiles: Lamb and Bond Citation2013; Collins et al. Citation2019; Childers et al. Citation2021). In general, this decoupling of species richness from stem age is difficult to explain, but could reflect ecological limits to species richness (Stadler et al. Citation2014), combined with low (or heterogenous) rates of net diversification rather than high rates of extinction (Donoghue and Sanderson Citation2015).
Any intensification of BNU upwelling (i.e. increasingly cooler surface waters) during the Pleistocene would have increased xeric conditions in Southwest Africa, which in turn, likely forced local speciation events, for instance through the formation of aeolian sand dune systems, erosion along drainage lines, or climate-induced vegetation change (e.g. Marlow et al. Citation2000; Hoetzel et al. Citation2015). It is feasible, therefore, that the ‘petiolate’ clade of S. englerianus/S. flavus represents another example of ancient Namibian ‘relict’ clades that underwent relatively recent speciation in response to palaeoclimatic events over Pleistocene time scales. However, processes linked to diversification (speciation and extinction) in the Namibian Flora remain poorly understood and deserve further investigation (Linder Citation2014; García-Aloy et al. Citation2017).
Unresolved species relationships between S. englerianus and S. flavus
Progenitor-derivative (P–D) species pairs are recognised as appropriate systems for studying plant speciation, as they represent instances of recent divergence, making it more feasible to identify presumably few inter-specific differences (e.g. in geography, ecology, morphology) and to infer possible early-evolving RI mechanisms (Crawford Citation2010). Such P–D pairs are often expected to display paraphyletic relationships, with accessions of the derivative species occupying a nested position within those of the ancestral taxon (e.g. López et al. Citation2012; Otero et al. Citation2022). However, our phylogenetic (ML) analysis of multiple intraspecific ITS sequences of S. englerianus and S. flavus (Figure S2) resulted in an unresolved (polytomous) crown topolgy, including a weakly supported, potentially derived cluster of northern S. flavus. In general, for recently diverged species, such failure to recover paraphyletic (P–D) relationships is not entirely unexpected for a number of biological reasons, including insufficient time for lineage sorting and hybridisation/introgression (e.g. Mutanen et al. Citation2016; but see below).
Our experimental crossings demonstrated that S. englerianus and northern S. flavus are interfertile, with one F1 hybrid producing vigorous F2 offspring after self-pollination (albeit with variable pollen numbers and fertilities; ). This suggests that intrinsic postzygotic barriers to hybridisation are relatively weak. However, there are no reports of naturally occurring hybrids between the two species in Namibia, suggesting that interbreeding between them in this region is largely prevented by prezygotic and extrinsic postzygotic barriers (see below). Hence, the unresolved relationship of the two species (in terms of ITS) is more likely to reflect lack of sequence variation and/or insufficient time to lineage sorting rather than hybridisation/introgression. Clearly, however, further sampling of genes and individuals (especially of Namibian S. flavus) is required to test this hypothesis.
Evidence for species status of S. englerianus and S. flavus
The lack of phylogenetic separation between S. englerianus and S. flavus, as well as the absence of Namibian material of the latter species from our morphometric/crossing analyses, clearly limits our ability to fully evaluate their species status. Nonetheless, based on the data available, it seems that S. englerianus and S. flavus are fully fledged species that markedly differ in life history (short-lived perennial vs. annual), quantitative traits (), breeding system (outcrossing vs. selfing), and pappus type (non-fluked vs. connate-fluked; ). Furthermore, the two species occupy distinct ecoregions in Namibia (S. englerianus: Central/Northern Namib Desert; S. flavus: Nama-Karoo, Succulent Karoo and, rarely, Savanna), with only slight range overlap in the Central Namib Desert and its hinterland (approximately south of Mt. Brandberg to Khan River; see black rectangle in . According to our HUMBOLDT-derived PCA (), S. flavus occupies higher-elevation sites with stronger fluctuations in annual temperature as well as higher (and more predictable) rainfall than S. englerianus. In fact, the corresponding niche overlap and divergence tests (NOT, NDT) revealed near-zero D values, suggesting that ecogeographical isolation (sensu Sobel et al. Citation2010) as well as adaptive niche divergence (Brown and Carnaval Citation2019) had an important role in speciation. The annual life form and less succulent leaves of S. flavus () could thus reflect an adaptation to slightly more mesic conditions, as encountered in the Nama-Karoo relative to the hyper-arid Namib Desert.
In addition, there are three lines of evidence concerning mating type differences between the two species: (1) during cultivation, S. englerianus failed to set seed when left to self (J.J. Milton, unpublished data), whereas S. flavus produces seed readily on selfing (see also Coleman et al. Citation2003); (2) in line with ‘selfing-syndrome’ theory (Ornduff Citation1969; Sicard and Lenhard Citation2011), the non-radiate capitula of S. flavus are significantly smaller than those of S. englerianus (), whereby the latter may occasionally produce ray florets (Jürgens et al. Citation2021) that could further help attracting pollinators; and (3) the S. englerianus individual examined for number of pollen grains per floret produced more than six times the amount of pollen seen in S. flavus (); this concurs with the notion that outcrossing species normally produce much more pollen per ovule than do selfers (Cruden Citation1977). Together, these results strongly suggest that S. englerianus is a self-incompatible, obligate outcrosser, whereas S. flavus is a self-compatible, predominantly autogamous species.
Evidence for S. flavus as a putative derivative of S. englerianus and the build-up of RI barriers
A break-down of self-incompatibility, and/or shifts from outcrossing to selfing, have long been considered hallmarks of directional phenotypic evolution, facilitating the identification of putative derivative species and cases of ‘budding’ speciation (Crawford Citation2010; Anacker and Strauss Citation2014). In fact, unidirectional transitions from outcrossing to selfing are commonly reported in angiosperms (Takebayashi and Morrell Citation2001; Igic and Busch Citation2013; Barrett Citation2014; Gamisch et al. Citation2015; although see Ferrer and Good-Avila Citation2006; Kim et al. Citation2008). Accordingly, it seems plausible that S. flavus was derived from S. englerianus. If so, the former could represent a rare example of a wider-ranged derivative that likely originated via parapatric (or ‘budding’) speciation at the periphery of a smaller-ranged progenitor (see also Kadereit Citation1984a; Kadereit et al. Citation1995). In support of this non-allopatric scenario, our palaeodistribution models suggest that the two species also occupied adjacent ranges in Namibia during the HCO (ca. 6 kyr ago) and the LGM (ca. 22 kyr ago), at which times (or earlier pluvial/arid periods) they might have even been broadly sympatric, especially in the Northern Namib Desert (see ). However, as emphasised elsewhere (e.g. Breiner et al. Citation2015; Wielstra Citation2019; Pflugbeil et al. Citation2021), these models should be treated with caution in terms of underlying assumptions (e.g. niche conservatism of taxa involved, adequate representation of habitat requirements by the climate variables used) and other issues affecting their performance (e.g. incomplete occurrence records, residual spatial/temporal autocorrelation). Nonetheless, they seem to indicate that the presently abutting ranges of S. englerianus/S. flavus in Namibia do not result from allopatric speciation followed by range expansion and secondary contact.
The ability of selfing variants to reproduce when pollinators or mates are rare or absent (Baker Citation1955) is generally favoured in small isolated or peripheral populations (Busch Citation2005; Iritani and Cheptou Citation2017). It is feasible, therefore, that the transition to selfing was among the early-acting reproductive isolation (RI) barriers involved in the origin of S. flavus. This prezygotic RI might have also accelerated the development of intrinsic postzygotic isolation (Fishman and Stratton Citation2004; see below). In addition, selfing would have increased the colonisation ability of S. flavus (Baker Citation1955; Busch Citation2005; Randle et al. Citation2009), and possibly allowed this species to adapt more readily to its ‘novel’ (more mesic) environments (Coyne and Orr Citation2004), i.e. by blocking gene flow from S. englerianus at the time of speciation (see also Sobel et al. Citation2010). Morevover, in concert with the spread of selfing, other prezygotic (e.g. phenological) barriers could have played a role in the initial speciation process. However, there is no evidence from the herbarium material examined that the two species are isolated through differences in flowering time (both approximately January to July).
Local adaptation leading to ecogeographic isolation and niche divergence (see above) would be expected to impose a strong extrinsic postzygotic isolating barrier (Richards and Ortiz-Barrientos Citation2016). Also, evidence from a crossing experiment might indicate some form of intrinsic postzygotic isolation between the species (Coyne and Orr Citation2004; Sobel et al. Citation2010). Although our synthetic F1 and F2 material showed no signs of reduced vitality, the F2 exhibited a bimodal distribution of pollen fertilities () compatible with a digenic-epistatic gene model, as expected for Dobzhansky-Muller (DM) incompatibilities (Fishman and Stratton Citation2004; Johnson Citation2008; Satokangas et al. Citation2020). In the context of parapatric speciation, such intrinsically lowered hybrid fitness is generally thought to arise as a ‘by-product’, i.e. after ecogeographical forms of isolation have evolved ‘to an appreciable level’ (c.f. Sobel et al. Citation2010). In our system, therefore, this type of ‘hybrid incompatibility’ is unlikely to have contributed to speciation, and might (at present) contribute to RI only in the immediate contact zone of the two species in the Central Namib Desert region (see black rectangle in . Nonetheless, our inference of DM incompatibilities could point at marked adaptive-genomic divergence between S. englerianus and S. flavus, related to their pronounced niche divergence in Namibia. That said, it remains to be demonstrated whether the above results and conclusions also apply to experimental crosses between S. englerianus and Namibian S. flavus.
Joint evolution of key traits in S. flavus affecting adaptation capacity and dispersal
While selfing would have allowed S. flavus to successfully colonise unpredictable and ‘novel’ habitats, its heritable ability or propensity to disperse (sensu Billiard and Lenormand Citation2005) was likely facilitated by the evolution of connate-fluked (CF) pappus hairs (). It has been long suggested that the grapple-like tips (or ‘prongs’) of these hairs, which remain firmly attached to the achene (R.J. Abbott, pers. obs.), facililate adhesive animal dispersal (Drury and Watson Citation1966; Jeffrey Citation1979; Lawrence Citation1981; Coleman et al. Citation2003), hence in addition to dispersal by wind afforded by the non-fluked (‘typical’) hairs that are exclusively present in S. englerianus () (Coleman et al. Citation2003). Notably, of the 245 species of Senecio examined by Drury and Watson (Citation1966), about 40 possessed ‘fluked’ pappus hairs, i.e. with inverted or retrorse teeth. However, fluked pappus hairs with conspicuous ‘prongs’, as observed in S. flavus, seem to be rare in the genus (e.g. S. californicus DC.; Drury and Watson Citation1966). Our experimental crosses demonstrated that this complex hair structure is controlled by a single major gene with completely dominant allele expression, adding weight to the view of Coleman et al. (Citation2003) that it arose as a new mutation in S. flavus. Mutations of such large-effect loci are generally expected to be favoured during adaptive species divergence with gene flow (e.g. Tigano and Friesen Citation2016). Accordingly, it is tempting to speculate that S. flavus represents an example of ‘budding’ speciation where selection favoured a combination (or even tight linkage) of major genes controlling not only dispersal propensity (CF pappus) but also reproductive ability (selfing) and a fast life cycle (annuality), i.e. three key traits jointly affecting adaptation capacity and invasiveness (e.g. Kandziora et al. Citation2017; Beckman et al. Citation2018).
Northward range expansion of S. flavus
Coleman et al. (Citation2003) proposed that the CF pappus had a pivotal role in the long-distance dispersal of S. flavus from Southwest to North Africa by facilitating the attachment of achenes to ground-feeding birds migrating annually between these regions (e.g. Motacilla spp., Lanius spp.). Based on ITS data, these authors inferred a Late Pleistocene origin for the Southwest – North African split of S. flavus (ca. 0.15 Mya; i.e. based on the single informative sequence position also inferred herein). In contrast, using isozyme data, Liston et al. (Citation1989) dated this split to earlier in the Pleistocene (ca. 0.77 Mya) and attributed this disjunction to vicariance, i.e. range contraction following the species’ northward expansion along the African Dry Corridor (ADC). Consistent with either time estimate above, this potential migration route is generally believed to have reached its greatest development during arid (i.e. high-latitude glacial) periods of the Pleistocene. At these times, this arid track likely extended in a north-easterly direction south of the Congolian Rainforest Basin into the Lake Victoria Region (LVR) of East Africa (see white-dashed lines in , repeatedly joining the xeric grassland and savanna vegetation of the Namib–Karoo–Kalahari region with the Saharan via the Horn of Africa (van Zinderen Bakker Citation1975; Neumann and Scott Citation2018).
In fact, the ADC is frequently invoked in the floristic and biogeographic literature (e.g. de Winter Citation1966, Citation1971; Winterbottom Citation1967; Verdcourt Citation1969; White Citation1983; Jürgens Citation1997; Banfield et al. Citation2011; Linder Citation2014; Perkins Citation2020), despite controversy over its dates of establishment and closure (e.g. Balinsky Citation1962; Thiv et al. Citation2011; Bellstedt et al. Citation2012; Pokorny et al. Citation2015; Kissling et al. Citation2016; Kandziora et al. Citation2017). However, to our knowledge, no previous study has explicitly examined (e.g. modelled) the temporal and spatial dynamics of this corridor for a particular plant (or animal) species. Our distribution model of Southwest African S. flavus for the LGM () reconstructed part of the predicted ADC at its northeastern end (in the LVR) with ca. 0.3 distribution probability, and more suitable habitats (ca. 0.5–1.0) throughout the Horn of Africa, across isolated Saharan mountain ranges (e.g. Ennedi Plateau, Tibesti/Hoggar Mts.), and in Northwest Africa (West Sahara, Rif Mts.). Our results further show that the climate conditions of the LGM (and likely earlier arid periods) could have favoured the north-eastward expansion of S. flavus from Namibia into the Central Kalahari Desert (Botswana); however, this does not seem to have resulted in a contiguous corridor (), likely because conditions were still too humid for this (semi-)desert annual in areas south of the Congolian Basin (Collins et al. Citation2011, Citation2014; Neumann and Scott Citation2018). Our ENM results, therefore, do not exactly match the expected ADC pattern, but nonetheless raise the possibility that the Southwest – North African disjunction of S. flavus was established by dispersal across intermediate areas rather than intra-continental long-distance dispersal.
Evolutionary ramifications associated with the northward spread of S. flavus
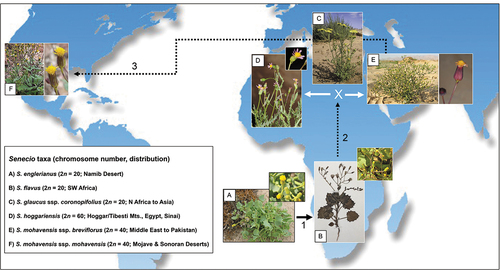
Senecio flavus is known to have given rise to two polyploid taxa in North Africa through hybridisation with an annual diploid member of the ‘vulgaris-clade’ of Senecio s. str., namely S. glaucus L. ssp. coronopifolius (Maire) Alexander (Kadereit et al. Citation2006, and references therein). These are the hexaploid S. hoggariensis Batt. & Trab. (2n = 6x = 60) and the tetraploid S. mohavensis A.Gray ssp. brevifolius (Kadereit) M.Coleman (2n = 4x = 40), originally described as a subspecies of S. flavus (Kadereit Citation1984b) and now known to be distributed from the Sinai Peninsula eastwards to Pakistan (Coleman et al. Citation2001). In turn, S. mohavensis ssp. breviflorus has been implicated as progenitor of ssp. mohavensis (2n = 4x = 40), which is endemic to the Mojave and Sonoran Deserts of North America (Liston et al. Citation1989; Coleman et al. Citation2001, Citation2003).
Hence, there is now mounting evidence to support a step-like biogeographic scenario () where (1) S. flavus originated in the Namib Desert region; (2) then spread to North Africa, where allopolyploidy (involving S. glaucus) not only increased species diversity (S. hoggariensis), but could also have triggered or facilitated eastward range expansion (S. mohavensis ssp. brevifolius; Comes and Abbott Citation2001; Kadereit et al. Citation2006); and (3) cross-continental long-distance dispersal and intraspecific differentiation in south-western North America (ssp. mohavensis; Coleman et al. Citation2003). When combined with our estimated crown age of the ‘petiolate’ clade (ca. 1.47 Mya), this scenario testifies to the long-held notion (e.g. Stebbins Citation1952; Axelrod Citation1972) that plant speciation may proceed rapidly in extreme (i.e. hyper-arid to semi-arid) environments over Pleistocene time scales (see also Kadereit and Abbott Citation2021).
Figure 8. Hypothesised, step-like biogeographic scenario involving (1) the origin of Senecio flavus from S. englerianus in the Namib Desert region, followed by (2) its spread to North Africa (Liston et al. Citation1989; Coleman et al. Citation2003; this study), where hybridisation with S. glaucus ssp. coronopifolius gave rise to S. hoggariensis and S. mohavensis ssp. breviflorus, respectively (Kadereit et al. Citation2006). Note the cross-continental dispersal (3) of the latter taxon to south-western North America (Coleman et al. Citation2003), followed by the origin of ssp. mohavensis. Photographs by Joseph J. Milton (A: habitus), David Forbes (A: close-up); Richard J. Abbott (B: habitus, collection Bertil Nordenstam), Fouad Msanda (B: close-up; CC BY-NC 4.0), Philippe Geniez (C; BY-NC 4.0), Ori Fragman-Sapir (D; and E: close-up; www.Flora.org.il); Mori Chen (E: habitus; www.Flora.org.il), and Stan Shebs (F; CC BY-SA 4.0). Worldmap (Wagner II projection) by Tobias Jung (CC BY-NC 4.0).
Perhaps even more remarkably, the reticulate evolution of S. flavus with S. glaucus in North Africa involved the exchange of (both plastid and nuclear) genomes between species that, according to our ITS chronogram (), last shared a common ancestor ca. 12.7 Mya. This inference is intriguing since hybridisation in plants (and animals) is generally thought to predominantly occur between recently diverged species (e.g. Mallet Citation2005; Paun et al. Citation2009; Abbott et al. Citation2013; Abbott Citation2017). On the other hand, there are occasional examples of long-diverged yet still hybridising species, and likely more so in plants than in animals (e.g. Rieseberg Citation2000; Edmands Citation2002; Coyne and Orr Citation2004; Rothfels et al. Citation2015; Ebersbach et al. Citation2020). However, why genetic (or hybrid) incompatibilities evolve at different rates, and not always accumulate linearly (or even faster) with time as parental lineages diverge, remains poorly understood (e.g. Orr and Turelli Citation2001; Paun et al. Citation2009; Wang et al. Citation2013, Citation2015; Kulmuni et al. Citation2020).
Conclusions and future directions
The results of our phylogenetic and experimental analyses must be interpreted with some caution because of the use of only a single phylogenetic marker (ITS), with potentially low sequence information among closely related species, the availability of only a single ITS sequence of Namibian S. flavus, and the absence of Namibian S. flavus from our morphometric and crossing analyses. Despite these limitations, our results provide evidence for a possible (and rare) example of parapatric (‘budding’) speciation in which a wider-ranged derivative (S. flavus) originated at the periphery of a smaller-ranged progenitor (S. englerianus) in the Namib Desert region of Southwest Africa. Together with ecogeographical isolation and adaptive niche divergence, shifts to selfing and an annual life form as well as higher dispersal propensity may all have contributed to this speciation event, and ultimately the ability of S. flavus to expand to the (semi-)desert areas of North Africa, perhaps by using parts of the African Dry Corridor as ‘stepping stones’ to reach East Africa during arid periods of the (Late) Pleistocene. That said, further phylogenetic sampling (including multiple accessions of Namibian S. flavus) is now required to evaluate the hypothesised ‘relict status’ of this ‘petiolate’ clade, and whether it represents a relictual and likely separate genus. In addition, population-level genomic analysis remains to be done to precisely date the split between S. englerianus and S. flavus (and between southern and northern populations of the latter species), ideally in combination with high-resolution palaeodistribution modelling over extended (i.e. full Plio-/Pleistocene) time scales (Gamisch Citation2019).
We hope that this paper will encourage further work with this study system using a broader sampling of genes and individuals, while contributing to current debates over the importance of ‘budding speciation’ in plants (Anacker and Strauss Citation2014), and to speciation in general in underrepresented (e.g. non-temperate, hyper-arid) world regions. More detailed information (e.g. genomic, ecological, morphometric, experimental-reproductive) is desirable for this species pair in Southwest Africa. In particular, whole-genome sequence comparisons as well as chromosomal and gene regulatory analyses (e.g. Durvasula et al. Citation2017; Gould et al. Citation2018) should shed light on the genetic basis of adaptive divergence between the two species and how this might associate with the emergence of intrinsic postzygotic reproductive isolation between them (e.g. Hu et al. Citation2021; Wan et al. Citation2021; Wilkinson et al. Citation2021). We further hope that our study will help motivate the development of research programmes on processes of speciation in other closely related (ideally sister) species of the Namibian desert vs. inland flora (e.g. Maggs et al. Citation1998; Craven and Craven Citation2000). A final answer to the biogeographic importance of the African Dry Corridor will likely emerge only after analyses of many genera in Southwest Africa with close relatives in North and/or East Africa (e.g. Camptoloma, Fagonia, Heliotropium, Kissenia, Zygophyllum; Craven and Vorster Citation2006; Craven Citation2009; Bellstedt et al. Citation2012; Pokorny et al. Citation2015).
Supplemental_Data_File_R2.docx
Download MS Word (160.9 KB)Figure_S3_ENMs_S_flavus_total.pdf
Download PDF (4.5 MB)Figure_S2_ML-phylogram_petiolate_clade.pdf
Download PDF (122.1 KB)Figure_S1_Phytools_Circular_BEAST.pdf
Download PDF (714.9 KB)Acknowledgement
We are grateful to Chris Cupido (Fort Hare University) for help with field work in Southwest Africa, Bertil Nordenstam (Swedish Museum of Natural History) and Michael Möller (Royal Botanic Garden Edinburgh, RBGE) for advice and providing herbarium specimens, David Forbes and Ailan Wang (St Andrews University) as well as Frieda Christie (RBGE) for laboratory assistance, Pieter Pelser (University of Canterbury) for correspondence and preliminary trees of Senecioneae, Sarah Sophie Brandauer (Salzburg University) for help with mapping occurrence records, Max Coleman (RBGE) for providing SEM-pappus photographs (), Hans-Joachim Esser (Munich Herbarium) for having forwarded an important publication on the Namibian Flora, and Joachim Kadereit (Mainz University) for advice and very helpful comments on an earlier version of this manuscript. Valuable comments of two anonymous reviewers, the Guest Editor, a Subject Editor, and the Editor-in-Chief, further helped to improve this paper.
Disclosure statement
No potential conflict of interest was reported by the author(s).
Data availability statement
Data on locality records, voucher specimens (Nordenstam collection) and ITS sequence alignments are available upon request to [email protected]
Supplementary material
Supplemental data for this article can be accessed online at https://doi.org/10.1080/17550874.2022.2130018.
Additional information
Funding
Related Research Data
References
- Abbott RJ. 2017. Plant speciation across environmental gradients and the occurrence and nature of hybrid zones. J Syst Evol. 55(4):238–258. doi:10.1111/jse.12267.
- Abbott RJ, Albach D, Ansell S, Arntzen JW, Baird SJE, Bierne N, Boughman J, Brelsford A, Buerkle CA, Buggs CA, et al. 2013. Hybridization and speciation. J Evol Biol. 26(2):229–246. doi:10.1111/j.1420-9101.2012.02599.x.
- Alexander JCM. 1979. Mediterranean species of Senecio sections Senecio and Delphinifolius. Notes Roy Bot Gard Edinb. 37(3):387–428.
- Anacker BL, Strauss SY. 2014. The geography and ecology of plant speciation: range overlap and niche divergence in sister species. Proc R Soc Ser B. 281(1778):20132980. doi:10.1098/rspb.2013.2980.
- Axelrod DI. 1967. Drought diatrophism, and quantum evolution. Evolution. 21(2):201–209. doi:10.1111/j.1558-5646.1967.tb00149.x.
- Axelrod DI. 1972. Edaphic aridity as a factor in angiosperm evolution. Am Nat. 106(949):311–320. doi:10.1086/282773.
- Baker HG. 1955. Self-compatibility and establishment after ‘long-distance’ dispersal. Evolution. 9(3):347–349. doi:10.1111/j.1558-5646.1955.tb01544.x.
- Balinsky BI. 1962. Patterns of animal distribution of the African continent. Ann Cape Prov Mus. 2:299–310.
- Banfield LM, van Damme K, Miller AG. 2011. Evolution and biogeography of the flora of the Socotra Archipelago (Yemen). In: Bramwell D Caujapé-Castells J, editors. The biology of island floras. Cambridge (UK): Cambridge University Press; p. 197–225.
- Barrett SCH. 2014. Evolution of mating systems: outcrossing versus selfing. In: Losos J, editor. The Princeton guide to evolution. Princeton (NJ): Princeton University Press; p. 356–362.
- Beckman NG, Bullock JM, Salguero-Gómez R, Violle C. 2018. High dispersal ability is related to fast life-history stragegies. J Ecol. 106(4):1349–1362. doi:10.1111/1365-2745.12989.
- Bellstedt DU, Galley C, Pirie MD, Linder HP. 2012. The migration of the palaeotropical arid flora: Zygophylloideae as an example. Syst Bot. 37(4):951–959. doi:10.1600/036364412X656608.
- Berger WH, Lange CB, Wefer G. 2002. Upwelling history of the Benguela-Namib system: a synthesis of Leg 175 results. Proc ODP, Sci Results. 175:1–103.
- Billiard S, Lenormand T. 2005. Evolution of migration under kin selection and local adaptation. Evolution. 59(1):13–23. doi:10.1111/j.0014-3820.2005.tb00890.x.
- Breiner FT, Guisan A, Bergamini A, Nobis MP. 2015. Overcoming limitations of modelling rare species by using ensembles of small models. Methods Ecol Evol. 6(10):1210–1218. doi:10.1111/2041-210X.12403.
- Brown JL, Carnaval AC. 2019. A tale of two niches: methods, concepts and evolution. Front Biogeogr. 11(4):e44158. doi:10.21425/F5FBG44158.
- Busch JW. 2005. The evolution of self-compatibility in geographically peripheral populations of Leavenworthia alabamica (Brassicaceae). Am J Bot. 92(9):1503–1512. doi:10.3732/ajb.92.9.1503.
- Childers JL, Kirchhof S, Bauer AM. 2021. Lizards of a different stripe: phylogenetics of the Pedioplanis undata species complex (Squamata, Lacertidae), with the description of two new species. Zoosyst Evol. 97(1):249–272. doi:10.3897/zse.97.61351.
- Coleman M, Forbes DG, Abbott RJ. 2001. A new subspecies of Senecio mohavensis (Compositae) reveals Old–New world species disjunction. Edinb J Bot. 58(3):389–403. doi:10.1017/S0960428601000713.
- Coleman M, Liston A, Kadereit JW, Abbott RJ. 2003. Repeat intercontinental dispersal and Pleistocene speciation in disjunct Mediterranean and desert Senecio (Asteraceae). Am J Bot. 90(10):1446–1454. doi:10.3732/ajb.90.10.1446.
- Collins GE, Hogg ID, Baxter JR, Maggs-Kölling G, Cowan DA. 2019. Ancient landscapes of the Namib Desert harbor high levels of genetic variability and deeply divergent lineages for Collembola. Ecol Evol. 9(8):4969–4979. doi:10.1002/ece3.5103.
- Collins JA, Schefuß E, Govin A, Mulitza S, Tiedemann R. 2014. Insolation and glacial–interglacial control on southwestern African hydroclimate over the past 140,000 years. Earth Planet Sci Lett. 398:1–10. doi:10.1016/j.epsl.2014.04.034.
- Collins JA, Schefuß E, Heslop D, Mulitza S, Prange M, Zabel M, Tjallingii R, Dokken TM, Huang E, Mackensen A, et al. 2011. Interhemispheric symmetry of the tropical African rainbelt over the past 23,000 years. Nat Geosci. 4(1):42–45. doi:10.1038/ngeo1039.
- Comes HP, Abbott RJ. 2001. Molecular phylogeography, reticulation, and lineage sorting in Mediterranean Senecio sect. Senecio (Asteraceae). Evolution. 55(10):1943–1962. doi:10.1111/j.0014-3820.2001.tb01312.x.
- Coyne JA, Orr HA. 2004. Speciation. Sunderland (MA): Sinauer Associates.
- Craven P. 2009. Phytogeographic study of the Kaokoveld centre of endemism [ PhD thesis]. University of Stellenbosch.
- Craven P, Craven D. 2000. The flora of the Brandberg, Namibia. In: Kirk-Sprigs ME, editor. Biodiversity of the Brandberg Massif. Vol. 9. Namibia: Cimbebasia Memoir; p. 49–67.
- Craven P, Kolberg H. 2021. Plants of Namibia, BRAHMS online. [accessed 2021 December 10]. https://herbaria.plants.ox.ac.uk/bol/namibia.
- Craven P, Vorster P. 2006. Patterns of plant diversity and endemism in Namibia. Bothalia. 36(2):175–189. doi:10.4102/abc.v36i2.360.
- Crawford DJ. 2010. Progenitor–derivative species pairs and plant speciation. Taxon. 59(5):1413–1423. doi:10.1002/tax.595008.
- Cruden RW. 1977. Pollen-ovule ratios: a conservative indicator of breeding systems in flowering plants. Evolution. 31(1):32–46. doi:10.1111/j.1558-5646.1977.tb00979.x.
- Dempster AP, Laird NM, Rubin DB. 1977. Maximum Likelihood from incomplete data via the EM algorithm. J R Stat Soc Ser B (Stat Methodol). 39(1):1–38. doi:10.1111/j.2517-6161.1977.tb01600.x.
- de Winter B. 1966. Remarks on the distribution of some desert plants in Africa. Palaeoecology of Africa. 1:188–189.
- de Winter B. 1971. Floristic relationships between the northern and southern arid areas in Africa. Mitt Bot Staatssamml München. 10:424–437.
- Donoghue MJ, Sanderson MJ. 2015. Confluence, synnovation, and depauperons in plant diversification. New Phytol. 207(2):260–274. doi:10.1111/nph.13367.
- Drummond AJ, Ho SY, Phillips MJ, Rambaut A. 2006. Relaxed phylogenetics and dating with confidence. PLoS Biol. 4(5):e88. doi:10.1371/journal.pbio.0040088.
- Drummond AJ, Suchard MA, Xie D, Rambaut A. 2012. Bayesian phylogenetics with BEAUti and the BEAST 1.7. Mol Biol Evol. 29(8):1969–1973. doi:10.1093/molbev/mss075.
- Drury DG, Watson L. 1966. A bizarre pappus form in Senecio. Taxon. 15(8):309–311. doi:10.2307/1216115.
- Durvasula A, Fulgione A, Gutaker RM, Alacakaptan SI, Flood PJ, Neto C, Tsuchimatsu T, Burbano HA, Picó FX, Alonso-Blanco C, et al. 2017. African genomes illuminate the early history and transition to selfing in Arabidopsis thaliana. Proc Natl Acad Sci U S A. 114:5213–5218.
- Ebersbach J, Tkach N, Röser M, Favre A. 2020. The role of hybridisation in the making of the species-rich arctic-alpine genus Saxifraga (Saxifragaceae). Diversity. 12:440. doi:10.3390/d12110440.
- Edler D, Klein J, Antonelli A, Silvestro D. 2021. raxmlGUI 2.0: a graphical interface and toolkit for phylogenetic analyses using RAxML. Methods Ecol Evol. 12(2):373–377. doi:10.1111/2041-210X.13512.
- Edmands S. 2002. Does parental divergence predict reproductive compatibility? Trends Ecol Evol. 17(11):520–527. doi:10.1016/S0169-5347(02)02585-5.
- e-Flora of South Africa. 2018. South African National Biodiversity Institute. [accessed 2021 December 11]. http://ipt.sanbi.org.za/iptsanbi/resource?r=flora_descriptions&v=1.21.
- Ferrer MM, Good-Avila SV. 2006. Macrophylogenetic analyses of the gain and loss of self-incompatibility in the Asteraceae. New Phytol. 173(2):401–414. doi:10.1111/j.1469-8137.2006.01905.x.
- Fick SE, Hijmans RJ. 2017. WorldClim 2: new 1-km spatial resolution climate surfaces for global land areas. Int J Climatol. 37(12):4302–4315. doi:10.1002/joc.5086.
- Fishman L, Stratton DA. 2004. The genetics of floral divergence and postzygotic barriers between outcrossing and selfing populations of Arenaria uniflora (Caryophyllaceae). Evolution. 58(2):296–307. doi:10.1111/j.0014-3820.2004.tb01646.x.
- Foden W, Matlamela PF, Potter L, Kamundi DA. 2011. Senecio flavus (Decne.) Sch.Bip. National Assessment: Red List of South African Plants version 2020.1. [accessed 2021 December 9]. http://redlist.sanbi.org/species.php?species=3152-158.
- Fradera-Soler M, Rudall PJ, Prychid CJ, Grace OM. 2021. Evolutionary success in arid habitats: morpho-anatomy of succulent leaves of Crassula species from southern Africa. J Arid Environ. 185:104319. doi:10.1016/j.jaridenv.2020.104319.
- Gamisch A. 2019. Oscillayers: a dataset for the study of climatic oscillations over Plio-Pleistocene time-scales at high spatial-temporal resolution. Glob Ecol Biogeogr. 28(11):1552–1560. doi:10.1111/geb.12979.
- Gamisch A, Fischer G, Comes HP. 2015. Multiple independent origins of auto-pollination in tropical orchids (Bulbophyllum) in light of the hypothesis of selfing as an evolutionary dead end. BMC Evol Biol. 15(1):192. doi:10.1186/s12862-015-0471-5.
- García-Aloy S, Sanmartín I, Kadereit G, Vitales D, Millanes AM, Roquet C, Vargas P, Alarcón M, Aldasoro JJ. 2017. Opposite trends in the genus Monsonia (Geraniaceae): specialization in the African deserts and range expansions throughout eastern Africa. Sci Rep. 7(1):9872. doi:10.1038/s41598-017-09834-6.
- Giess W. 1981. Die in der Zentralen Namib von Südwestafrika/Namibia festgestellten Pflanzenarten und ihre Biotope. Dinteria (Windhoek). 15:13–71.
- Givnish TJ. 2001. The rise and fall of plant species: a population biologist’s perspective. Am J Bot. 88(10):1928–1934. doi:10.2307/3558369.
- Givnish TJ. 2010. Ecology of plant speciation. Taxon. 59(5):1326–1366. doi:10.1002/tax.595003.
- Gottlieb LD. 1984. Genetics and morphological evolution in plants. Am Nat. 123(5):681–709. doi:10.1086/284231.
- Gottlieb LD. 2004. Rethinking classic examples of recent speciation in plants. New Phytol. 161(1):71–82. doi:10.1046/j.1469-8137.2003.00922.x.
- Gould BA, Chen Y, Lowry DB. 2018. Gene regulatory divergence between locally adapted ecotypes in their native habitats. Mol Ecol. 27(21):4174–4188. doi:10.1111/mec.14852.
- Grant V. 1981. Plant speciation. 2nd ed. New York (NY): Columbia University Press.
- Griffiths AJF, Miller JH, Suzuki DT, Lewontin RC, Gelbart WM. 2000. An introduction to genetic analysis. 7th ed. New York (NY): WH Freeman.
- Habibzadeh N, Ghoddousi A, Bleyhl B, Kuemmerle T. 2021. Rear-edge populations are important for understanding climate change risk and adaptation potential of threatened species. Conserv Sci Pract. 3(5):e375. doi:10.1111/csp2.375.
- Heinrich S, Zonnenveld KAF, Bickert T, Willems H. 2011. The Benguela upwelling related to the Miocene cooling events and the development of the Antarctic Circumpolar Current: evidence from calcareous dinoflagellate cysts. Paleoceanography. 26(3):A3209. doi:10.1029/2010PA002065.
- He Z-W, Li X-N, Yang M, Wang X-F, Zhong C-R, Duke NC, Wu C-I, Shi S-H. 2019. Speciation with gene flow via cycles of isolation and migration: insights from multiple mangrove taxa. Natl Sci Rev. 6(2):275–288. doi:10.1093/nsr/nwy078.
- Hijmans RJ, Cameron SE, Parra JL, Jones PG, Jarvis A. 2005. Very high resolution interpolated climate surfaces for global land areas. Int J Climatol. 25(15):1965–1978. doi:10.1002/joc.1276.
- Hoetzel S, Dupont LM, Wefer G. 2015. Miocene-Pliocene vegetation change in south-western Africa (ODP Site 1081, offshore Namibia). Palaeogeogr Palaeoclimatol Palaeoecol. 423:102–108. doi:10.1016/j.palaeo.2015.02.002.
- Hu Q, Ma Y, Mandáková T, Shi S, Chen C, Sun P, Zhang L, Feng L, Zheng Y, Feng X, et al. 2021. Genome evolution of the psammophyte Pugionium for desert adaptation and further speciation. Proc Natl Acad Sci U S A. 118(42):e2025711118. doi:10.1073/pnas.2025711118.
- Igic B, Busch JW. 2013. Is self-fertilization an evolutionary dead end? New Phytol. 198(2):386–397. doi:10.1111/nph.12182.
- Irish J. 1994. The biomes of Namibia, as determined by objective categorisation. Res Nat Mus, Bloemfontein. 10:549–592.
- Iritani R, Cheptou PO. 2017. Joint evolution of differential seed dispersal and self-fertilization. J Evol Biol. 30(8):1526–1543. doi:10.1111/jeb.13120.
- Jeffrey C. 1979. Generic and sectional limits in Senecio (Compositae): II. Evaluation of some recent studies. Kew Bull. 34(1):49–58. doi:10.2307/4117970.
- Johnson N. 2008. Hybrid incompatibility and speciation. Nature Education. 1:20.
- Jürgens N. 1997. Floristic biodiversity and history of African arid regions. Biodivers Conserv. 6(3):495–514. doi:10.1023/A:1018325026863.
- Jürgens N, Oldeland J, Hachfeld B, Erb E, Schultz C. 2013. Ecology and spatial patterns of large-scale vegetation units within the central Namib Desert. J Arid Environ. 93:59–79. doi:10.1016/j.jaridenv.2012.09.009.
- Jürgens N, Strohbach B, Schmiedel U, Rügheimer S, Erb E, Wesuls D, Schrenk J, Dreber N, Schmidt M, Mayer C, et al. 2021. Photo guide to plants of Southern Africa. Hamburg, Germany: Research Unit Biodiversity, Evolution & Ecology (BEE) of Plants, Institute for Plant Science and Microbiology. [accessed 2021 December 10]. www.southernafricanplants.net.
- Kadereit JW. 1984a. The origin of Senecio vulgaris (Asteraceae). Pl Syst Evol. 145(1–2):135–153. doi:10.1007/BF00984036.
- Kadereit JW. 1984b. Some notes on annual species of Senecio L. (Asteraceae) from northern Africa and the Canary Islands. Bot J Syst. 104:509–517.
- Kadereit JW, Abbott RJ. 2021. Plant speciation in the Quaternary. Plant Ecol Divers. 14(3–4):105–142. doi:10.1080/17550874.2021.2012849.
- Kadereit JW, Comes HP, Curnow JC, Irwin JA, Abbott RJ. 1995. Chloroplast DNA and isozyme analysis of the progenitor-derivative species relationship between Senecio nebrodensis and S. viscosus (Asteraceae). Am J Bot. 82(9):1179–1185. doi:10.1002/j.1537-2197.1995.tb11590.x.
- Kadereit JW, Uribe-Convers S, Westberg E, Comes HP. 2006. Reciprocal hybridization at different times between Senecio flavus and Senecio glaucus gave rise to two polyploid species in North Africa and South-West Asia. New Phytol. 169(2):431–441. doi:10.1111/j.1469-8137.2005.01604.x.
- Kandziora M, Kadereit JW, Gehrke B. 2017. Dual colonization of the Palaearctic from different regions in the Afrotropics by Senecio. J Biogeogr. 44(1):147–157. doi:10.1111/jbi.12837.
- Kandziroa M. 2015. Evolution und historische Biogeographie von Senecio L. mit Fokus auf die Alte Welt [ PhD thesis]. Germany: University of Mainz.
- Kassambara A, Mundt F. 2017. R package factoextra. Extract and visualize the results of multivariate data analyses. Vienna, Austria: R Foundation for Statistical Computing. [accessed 2021 December 10]. https://cran.r-project.org/web/packages/factoextra/index.html.
- Kay KM, Whittall JB, Hodges SA. 2006. A survey of nuclear ribosomal internal transcribed spacer substitution rates across angiosperms: an approximate molecular clock with life history effects. BMC Evol Biol. 6(1):36. doi:10.1186/1471-2148-6-36.
- Kim M, Cui M-L, Cubas P, Gillies A, Lee K, Chapman MA, Abbott RJ, Coen E. 2008. Regulatory genes control a key morphological and ecological trait transferred between species. Science. 322(5904):1116–1119. doi:10.1126/science.1164371.
- Kirkpatrick M, Barton NH. 1997. Evolution of a species’ range. Am Nat. 150(1):1–23. doi:10.1086/286054.
- Kissling WD, Blach-Overgaard A, Zwaan RE, Wagner P. 2016. Historical colonization and dispersal limitation supplement climate and topography in shaping species richness of African lizards (Reptilia: Agaminae). Sci Rep. 6(1):34014. doi:10.1038/srep34014.
- Klaassen ES, Kwembeya EG. 2013. A checklist of Namibian indigenous and naturalised plants. Windhoek (Namibia): Occasional Contributions No. 5 National Botanical Research Institute.
- Kulmuni J, Butlin RK, Lucek K, Savolainen V, Westram AM. 2020. Towards the completion of speciation: the evolution of reproductive isolation beyond the first barriers. Phil Trans R Soc B. 375(1806):20190528. doi:10.1098/rstb.2019.0528.
- Lamb T, Bond JE. 2013. A multilocus perspective on phylogenetic relationships in the Namib darkling beetle genus Onymacris (Tenebrionidae). Mol Phylogenet Evol. 66(3):757–765. doi:10.1016/j.ympev.2012.10.026.
- Lankinen A. 2009. Upper petal lip colour polymorphism in Collinsia heterophylla (Plantaginaceae): genetic basis within a population and its use as a genetic marker. J Genet. 88(2):205–215. doi:10.1007/s12041-009-0029-7.
- Lawrence ME. 1981. Relationships of south-east Australian species of Senecio (Compositae) deduced from studies of morphology, reproductive biology and cytogenetics [ PhD thesis]. University of Adelaide.
- Levin DA. 2000. The origin, expansion, and demise of plant species. Oxford (UK): Oxford University Press.
- Levin DA. 2004. The ecological transition in speciation. New Phytol. 161(1):91–96. doi:10.1046/j.1469-8137.2003.00921.x.
- Linder HP. 2014. The evolution of African plant diversity. Front Ecol Evol. 2:38. doi:10.3389/fevo.2014.00038.
- Liston A, Rieseberg LH, Elias TS. 1989. Genetic similarity is high between intercontinental disjunct species of Senecio (Asteraceae). Am J Bot. 76(3):383–388. doi:10.1002/j.1537-2197.1989.tb11325.x.
- López P, Tremetsberger K, Kohl G, Stuessy T. 2012. Progenitor–derivative speciation in Pozoa (Apiaceae, Azorelloideae) of the southern Andes. Ann Bot. 109(2):351–363. doi:10.1093/aob/mcr291.
- Lowe AJ, Abbott RJ. 2000. Routes of origin of two recently evolved hybrid taxa: Senecio vulgaris var. hibernicus and York radiate groundsel (Asteraceae). Am J Bot. 87(8):1159–1167. doi:10.2307/2656652.
- Luebert F, Jacobs P, Hilger HH, Muller LAH. 2014. Evidence for nonallopatric speciation among closely related sympatric Heliotropium species in the Atacama Desert. Ecol Evol. 4(3):266–275. doi:10.1002/ece3.929.
- Maggs GL, Craven P, Kolberg HH. 1998. Plant species richness, endemism, and genetic resources in Namibia. Biodivers Conserv. 7(4):435–446. doi:10.1023/A:1008819426848.
- Mallet J. 2005. Hybridization as an invasion of the genome. Trends Ecol Evol. 20(5):229–237. doi:10.1016/j.tree.2005.02.010.
- Marlow JR, Lange CB, Wefer G, Rosell‐Melé A. 2000. Upwelling intensification as part of the Pliocene‐Pleistocene climate transition. Science. 290(5500):2288–2291. doi:10.1126/science.290.5500.2288.
- Ma T, Wang K, Hu Q, Xia Z, Wan D, Wang Q, Feng J, Jiang D, Ahani H, Abbott RJ, et al. 2018. Ancient polymorphisms and divergence hitchhiking contribute to genomic islands of divergence within a poplar species complex. Proc Natl Acad Sci U S A. 115(2):E236–243. doi:10.1073/pnas.1713288114.
- Mayr E. 1963. Animal species and evolution. Cambridge (MA): Harvard University Press.
- Merxmüller H. 1967. Senecio L. In: Merxmüller H, editor. Prodromus einer Flora von Südwestafrika, Asteraceae. Vol. 139. Stuttgart, Germany: Verlag J Cramer, Lehre; p. 162–173.
- Milton JJ. 2009. Phylogenetic analyses and taxonomic studies of Senecioninae: Southern African Senecio sect. Senecio [ PhD thesis]. University of St Andrews.
- Mutanen M, Kivelä SM, Vos RA, Doorenweerd C, Ratnasingham S, Hausmann A, Huemer P, Dinca V, van Nieukerken EJ, Lopez-Vaamonde C, et al. 2016. Para- and polyphyly in DNA barcode trees: strong operational bias in European Lepidoptera. Syst Biol. 65(6):1024–1040. doi:10.1093/sysbio/syw044.
- Neumann F, Scott L. 2018. E.M. van Zinderen Bakker (1907–2002) and the study of African Quaternary palaeoenvironments. Quat Int. 495:153–168. doi:10.1016/j.quaint.2018.04.017.
- Nylinder S, Razafimandimbison SG, Anderberg AA. 2016. From the Namib around the world: biogeography of the Inuleae-Plucheinae (Asteraceae). J Bioegogr. 43(9):1705–1716. doi:10.1111/jbi.12764.
- Ornduff R. 1969. Reproductive biology in relation to systematics. Taxon. 18(2):121–133. doi:10.2307/1218671.
- Orr HA, Turelli M. 2001. The evolution of postzygotic isolation: accumulating Dobzhansky-Muller incompatibilities. Evolution. 55(6):1085–1094. doi:10.1111/j.0014-3820.2001.tb00628.x.
- Otero A, Vargas P, Valcárcel V, Fernández-Mazuecos M, Jiménez-Mejías P, Hipp AL. 2022. A snapshot of progenitor-derivative speciation in action in Iberodes (Boraginaceae). Mol Ecol. 31(11):3192–3209. doi:10.1111/mec.16459.
- Panero JL, Francisco-Ortega J, Jansen RK, Santos-Guerra A. 1999. Molecular evidence for multiple origins of woodiness and a New World biogeographic connection of the Macaronesian island endemic Pericallis (Asteraceae; Senecioneae). Proc Natl Acad Sci U S A. 96(24):13886–13891. doi:10.1073/pnas.96.24.13886.
- Paun O, Forest F, Fay MF, Chase MW. 2009. Hybrid speciation in angiosperms: parental divergence drives ploidy. New Phytol. 182(2):507–518. doi:10.1111/j.1469-8137.2009.02767.x.
- Pelser PB, Kennedy AH, Tepe EJ, Shidler JB, Nordenstam B, Kadereit JW, Watson LE. 2010. Patterns and causes of incongruence between plastid and nuclear Senecioneae (Asteraceae) phylogenies. Am J Bot. 97(5):856–873. doi:10.3732/ajb.0900287.
- Pelser PB, Nordenstam B, Kadereit JW, Watson LE. 2007. An ITS phylogeny of tribe Senecioneae (Asteraceae) and a new delimitation of Senecio L. Taxon. 56(4):1077–1104. doi:10.2307/25065905.
- Perkins JS. 2020. Take me to the river along the African drought corridor: adapting to climate change. Botsw J Agric Appl Sci. 14(1):60–71. doi:10.37106/bojaas.2020.77.
- Pflugbeil G, Affenzeller M, Tribsch A, Comes HP. 2021. Primary hybrid zone formation in Tephroseris helenitis (Asteraceae), following postglacial range expansion along the central Northern Alps. Mol Ecol. 30(7):1704–1720. doi:10.1111/mec.15832.
- Phillips SJ, Anderson RP, Dudík M, Schapire RE, Blair ME. 2017. Opening the black box: an open-source release of Maxent. Ecography. 40(7):887–893. doi:10.1111/ecog.03049.
- Pokorny L, Riina R, Mairal M, Meseguer AS, Culshaw V, Cendoya J, Serrao Pérez LM, Carbajal Vilaverde R, Ortiz Núnes S, Heuertz M, et al. 2015. Living on the edge: timing of Rand Flora disjunctions congruent with ongoing aridification in Africa. Front Genet. 6:154. doi:10.3389/fgene.2015.00154.
- QGIS Development Team. 2019. QGIS Geographic Information System. Open Source Geospatial Foundation Project. [accessed 2021 December 10]. http://qgis.osgeo.org.
- Randle AM, Slyder JB, Kalisz S. 2009. Can differences in autonomous selfing ability explain differences in range size among sister-taxa pairs of Collinsia (Plantaginaceae)? An extension of Baker’s Law. New Phytol. 183(3):618–629. doi:10.1111/j.1469-8137.2009.02946.x.
- R Development Core Team. 2017. R: a language and environment for statistical computing. Vienna, Austria: R Foundation for Statistical Computing. [accessed 2021 December 10]. https://www.r-project.org.
- Revell LJ. 2012. Phytools, an R package for phylogenetic comparative biology (and other things). Methods Ecol Evol. 3(2):217–223. doi:10.1111/j.2041-210X.2011.00169.x.
- Richards TJ, Ortiz-Barrientos D. 2016. Immigrant inviability produces a strong barrier to gene flow between parapatric ecotypes of Senecio lautus. Evolution. 70(6):1239–1248. doi:10.1111/evo.12936.
- Rieseberg LH. 2000. Crossing relationships among ancient and experimental sunflower hybrid lineages. Evolution. 54(3):859–865. doi:10.1111/j.0014-3820.2000.tb00086.x.
- Rommerskirchen F, Condon T, Mollenhauer G, Dupont L, Schefuß E. 2011. Miocene to Pliocene development of surface and subsurface temperatures in the Benguela Current system. Paleoceanography. 26(3):A3216. doi:10.1029/2010PA002074.
- Rothfels CJ, Johnson AK, Hoevenkamp PH, Swofford DL, Roskam HC, Fraser-Jenkins CR, Windham MD, Pryer KM. 2015. Natural hybridization between genera that diverged from each other approximately 60 million years ago. Am Nat. 185(3):433–442. doi:10.1086/679662.
- Satokangas I, Martin SH, Helanterä H, Saramäki J, Kulmuni J. 2020. Multi-locus interactions and the build-up of reproductive isolation. Phil Trans R Soc B. 375(1806):20190543. doi:10.1098/rstb.2019.0543.
- Schluter D. 2001. Ecology and the origin of species. Trends Ecol Evol. 16(7):372–380. doi:10.1016/S0169-5347(01)02198-X.
- Schoener TW. 1968. The Anolis lizards of Bimini: resource partitioning in a complex fauna. Ecology. 49(4):704–726.
- Schrire BD, Lavin M, Barker NP, Forest F. 2009. Phylogeny of the tribe Indigofereae (Leguminosae – Papilionoideae): geographically structured more in succulent-rich and temperate settings than in grass-rich environments. Am J Bot. 96(4):816–852. doi:10.3732/ajb.0800185.
- Sexton JP, McIntyre PJ, Angert AL, Rice K. 2009. Evolution and ecology of species range limits. Ann Rev Ecol Evol Syst. 40(1):415–436. doi:10.1146/annurev.ecolsys.110308.120317.
- Sicard A, Lenhard M. 2011. The selfing syndrome: a model for studying the genetic and evolutionary basis of morphological adaptation in plants. Ann Bot. 107(9):1433–1443. doi:10.1093/aob/mcr023.
- Singhal S, Roddy AB, DiVittorio C, Sanchez-Amaya A, Henriquez CL, Brodersen CR, Fehlberg S, Zapata F. 2021. Diversification, disparification and hybridization in the desert shrubs Encelia. New Phytol. 230(3):1228–1241. doi:10.1111/nph.17212.
- Slopa C, Dias MC, Castro M, Loureiro J, Castro S. 2020. Is selfing a reproductive assurance promoting polyploid establishment? Reduced fitness, leaky self-incompatibility and lower inbreeding depression in neotetraploids. Am J Bot. 107(3):526–538. doi:10.1002/ajb2.1441.
- Sobel JM, Chen GF, Watt LR, Schemske DW. 2010. The biology of speciation. Evolution. 64(2):295–315. doi:10.1111/j.1558-5646.2009.00877.x.
- Stadler T, Rabosky DL, Ricklefs R, Bokma F. 2014. On age and species richness of higher taxa. Am Nat. 184(4):447–455. doi:10.1086/677676.
- Stamatakis A. 2014. RAxML version 8: a tool for phylogenetic analysis and post-analysis of large phylogenies. Bioinformatics. 30(9):1312–1313. doi:10.1093/bioinformatics/btu033.
- Stebbins GL. 1952. Aridity as a stimulus to plant evolution. Am Nat. 86(826):33–44. doi:10.1086/281699.
- Stebbins GL. 1972. Ecological distribution of centers of major adaptive radiation in angiosperms. In: Valentine D, editor. Taxonomy, phytogeography, and evolution. New York (NY): Academic Press; p. 7–34.
- Stebbins GL. 1974. Flowering plants: evolution above the species level. Cambridge (MA): Harvard University Press.
- Takebayashi N, Morrell PL. 2001. Is self-fertilization an evolutionary dead end? Revisiting an old hypothesis with genetic theories and a macroevolutionary approach. Am J Bot. 88(7):1143–1150. doi:10.2307/3558325.
- Thiv M, van der Niet T, Rutschmann F, Thulin M, Brune T, Linder HP. 2011. Old–New World and trans-African disjunctions of Thamnosma (Rutaceae): intercontinental long-distance dispersal and local differentiation in the succulent biome. Am J Bot. 98(1):76–87. doi:10.3732/ajb.1000339.
- Tigano A, Friesen V. 2016. Genomics of local adaptation with gene flow. Mol Ecol. 25(10):2144–2164. doi:10.1111/mec.13606.
- Tripp EA, Tsai YHE, Zhuang Y, Dexter KG. 2017. RAD seq dataset with 90% missing data fully resolves recent radiation of Petalidium (Acanthaceae) in the ultra-arid deserts of Namibia. Ecol Evol. 7(19):7920–7936. doi:10.1002/ece3.3274.
- van Zinderen Bakker EM. 1975. The origin and palaeoenvironment of the Namib Desert biome. J Biogeogr. 2(2):65–73. doi:10.2307/3038074.
- Verdcourt B. 1969. The arid corridor between the northeast and southwest areas of Africa. Palaeoecol Afr. 4:140–144.
- Vu VQ. 2011. Ggbiplot: a ggplot2 based biplot. R package Version 0.55. [accessed 2021 December 11]. https://github.com/vqv/ggbiplot.
- Walter GM, Abbott RJ, Brennan AC, Bridle JR, Chapman M, Clark J, Filatov D, Nevado B, Ortiz-Barrientos D, Hiscock S. 2020. Senecio as a model system for integrating studies of genotype, phenotype and fitness. New Phytol. 226(2):326–344. doi:10.1111/nph.16434.
- Wang Q, Abbott RJ, Yu Q-S, Lin K, Liu J-Q. 2013. Pleistocene climate change and the origin of two desert plant species, Pugionium cornutum and Pugionium dolabratum (Brassicaceae), in northwest China. New Phytol. 199(1):277–287. doi:10.1111/nph.12241.
- Wang RJ, Ané C, Payseur BA. 2013. The evolution of hybrid incompatibilities along a phylogeny. Evolution. 67:2905–2922. doi:10.1111/evo.12173.
- Wang RJ, White M, Payseur BA. 2015. The pace of hybrid incompatibility evolution in house mice. Genetics. 201(1):229–242. doi:10.1534/genetics.115.179499.
- Wan T, Liu Z, Leitch IJ, Xin H, Maggs-Kölling G, Gong Y, Li Z, Marais E, Liao Y, Dai C, et al. 2021. The Welwitschia genome reveals a unique biology underpinning extreme longevity in deserts. Nature Comm. 12(1):4247. doi:10.1038/s41467-021-24528-4.
- Warren DL, Glor RE, Turelli M. 2010. ENMTools: a toolbox for comparative studies of environmental niche models. Ecography. 33(3):607–611. doi:10.1111/j.1600-0587.2009.06142.x.
- White F. 1983. Vegetation map of Africa. UNESCO. Nat Resour Res. 20:1–356. https://paperpile.com/n/natural-resources-research-abbreviation/
- Wickham H, François R, Henry L, Müller K. 2021. Dplyr: a grammar of data manipulation. R package version 1.0.6. [accessed 2021 December 11]. https://cran.r-project.org/web/packages/dplyr/index.html.
- Wielstra B. 2019. Historical hybrid zone movement: more pervasive than appreciated. J Biogeogr. 46(7):1300–1305. doi:10.1111/jbi.13600.
- Wilkinson MC, Roda F, Walter GM, James ME, Nipper R, Walsh J, Allen SL, North HL, Beveridge CB, Ortiz-Barrientos D. 2021. Adaptive divergence in shoot gravitropism creates hybrid sterility in an Australian wildflower. Proc Natl Acad Sci U S A. 118(47):e2004901118. doi:10.1073/pnas.2004901118.
- Winterbottom JM. 1967. Climatological implications of avifaunal resemblances between South Western Africa and Somaliland. Palaeoecol Afr. 2:77–79.
- Young D, Benaglia T, Chauveau D, Hunter D, Elmore R, Hettmansperger T, Thomas H, Xuan F 2020. Mixtools: tools for analyzing finite mixture models. R package version 1.2.0. [accessed 2021 December 11]. https://cran.r-project.org/web/packages/mixtools/index.html.