
ABSTRACT
Background
Páramos are tropical alpine ecosystems where climate change is expected to cause yet unknown consequences for plant growth, ecosystem structure, ecosystem function and the provision of ecosystem services.
Aim
To quantify the relationship between environmental factors (abiotic and biotic) and the spatial distribution of three common Hypericum species in the páramo and their physiological vulnerability to drought.
Methods
We recorded soil water content, soil temperature, and vegetation cover in 10 plots along a moisture gradient. Additionally, we measured a series of physiological traits associated with the risk of drought-induced mortality.
Results
We found that H. goyanesii and H. juniperinum mainly grew in areas with high soil water content, and similar high vegetation cover. These two species had wider xylem vessels, showed anisohydric behaviour and were equally vulnerable to cavitation with low safety margins against hydraulic failure. H. mexicanum grew in places with less vegetation cover, lower soil water content, and higher soil temperatures. H. mexicanum showed a different strategy that probably allows it to thrive in these conditions; it maintains high values of water potential at noon and has narrower xylem vessels, making it less vulnerable to cavitation.
Conclusion
The distribution of the three Hypericum species in the páramo responds essentially to soil water content, in line with the physiological mechanisms of the species to cope with water deficit. Hypericum species from moist habitats could decline if longer drought episodes become more common in the future.
Introduction
Páramos are tropical alpine ecosystems with a discontinuous distribution along the northern Andes, at elevations between 2800 and 4500 m a.s.l. across Venezuela, Colombia, Ecuador and Peru. Outside the Andes, páramos also occur on few mountain summits in Costa Rica and Panamá. Páramo plants are exposed to high solar and intense ultraviolet radiation, high wind speeds, large diurnal temperature fluctuations exceeding 20°C and with temperatures at night regularly dropping below zero (Buytaert et al. Citation2006; Llambí and Rada Citation2019; Leon-Garcia and Lasso Citation2019; Rada et al. Citation2019). Daily temperature changes influence plant soil water availability, as when water freezes it becomes unavailable. When daytime temperature increases on sunny days, evaporative demand also rises. Hence, even in relatively humid páramo, water deficit can occasionally occur, especially in the dry season (Ramírez et al. Citation2015).
Páramos are well known for their high-water retention capacity. This high retention capacity is primarily due to the large amounts of organic matter found in the soils and to properties related to vegetation, such as pubescent leaves, high capacitance, and low rate of transpiration. All these traits favour the accumulation of water and slow down water release (Buytaert et al. Citation2006; Hofstede et al. Citation2014). As a result, Páramos function as a sponge that collects the rain and releases it slowly. This property makes the páramo one of the most important sources of water provision for more than 30 million people in Andean cities, such as Quito in Ecuador and Bogotá in Colombia (Buytaert et al. Citation2006; Hofstede et al. Citation2014). In addition to water, páramos store considerable amounts of carbon (Hofstede Citation1999; Hribljan et al. Citation2017). Despite the ecosystem services they provide, páramos are one of the most threatened ecosystems due to land-use change and soil degradation associated with mining and agriculture, factors that exacerbate climate change impacts (Buytaert et al. Citation2006; Bradley et al. Citation2006; Hofstede et al. Citation2014).
Páramos, like other high mountain regions, are probably warming faster than lowlands (Liu and Chen Citation2000; Diaz et al. Citation2014). For the north-western South America region, climate change projections suggest between 1 and 5 oC rise in mean temperature (Gutiérrez et al. Citation2021), and for the tropical high Andes, projections suggest a 3 ± 1.5 oC rise over the twenty first century (Buytaert et al. Citation2011). Precipitation is also likely to change but in a less consistent manner. A decrease in precipitation and an increase in consecutive dry days are expected for the Venezuelan and the Colombian Northern Andes, whereas an increase in precipitation is expected for the Southern tropical Andes of Colombia and Ecuador (Urrutia and Vuille Citation2009; Buytaert et al. Citation2011; Gutiérrez et al. Citation2021). At present, water availability in humid páramos is not a limiting factor most of the year, except during the dry season. However, water availability varies by topography at the local scale. In particular, temperature and soil water availability change spatially in relation to the small-scale topographic complexity and microclimatic heterogeneity, typical of the mountains (Körner and Hiltbrunner Citation2018). Plants growing in shallow soils overlying solid bedrock, and/or growing in open areas in the absence of nurse plants, may be subject to more extreme temperatures and consequent water deficits than plants on deep soil or sheltered by nurse plants (Opedal et al. Citation2015; Ramírez et al. Citation2015). Thus, local micro-refugia might allow plant species to persist despite the effects of climate change in the near future (Dobrowski Citation2011; Scherrer and Körner Citation2011; Lenoir et al. Citation2013; Opedal et al. Citation2015; Körner and Hiltbrunner Citation2021). Nevertheless, some climate change scenarios indicate that some páramos would become warmer and drier, experiencing increased air evaporative demands and reduced soil water content, overall affecting the plant-water relations. Thus, there is a need to quantify the physiological vulnerability of páramo plants to drought to assess the potential impacts of climate change on the physical environment and on species distribution and vegetation structure.
Although drought-induced large-scale tree mortality has been well documented across different biomes (Fensham et al. Citation2009; Allen et al. Citation2010; Williams et al. Citation2013; McDowell et al. Citation2018), which is expected to increase under climate change scenarios, less is known about the drought response of other plant growth forms in treeless ecosystems, such as páramos. Drought-induced large-scale tree mortality has often been associated with a systematic failure of the plant vascular hydraulic transport system that occurs through embolism caused by air bubbles. These air bubbles form due to the high xylem tension induced by low soil moisture availability and high atmospheric evaporative demand during drought (Hoffmann et al. Citation2011; Nardini et al. Citation2013; Anderegg et al. Citation2015; Adams et al. Citation2017). Air bubbles block xylem conduits and reduce the ability of plants to transport water from the soil to the photosynthetic tissue (Tyree and Sperry Citation1989).
The ability of plants to survive is strongly related to the resistance of a species to embolism (Brodribb and Cochard Citation2009; Kursar et al. Citation2009), which is related to xylem structure (Sperry et al. Citation2006; Choat et al. Citation2012). A growing number of studies have tried to identify the traits that best predict drought-induced mortality (Greenwood et al. Citation2017). Some of the traits hypothesised as critical to predicting it are wood density, specific leaf area, the water potentials at which 50% and 88% of hydraulic conductivity are lost due to embolism (Ψ50 and Ψ88, respectively), and the hydraulic safety margin (HSM). The HSM is the difference between the minimum xylem water potential registered in the driest periods (Ψmin) and the water potential that causes xylem dysfunction and a reduction of 50% and 88% of hydraulic conductivity (Kraft et al. Citation2010; Choat et al. Citation2012; Anderegg et al. Citation2015; Greenwood et al. Citation2017). When water potential falls below Ψ50, the water transport function of the xylem is severely compromised. As a result, the risk of augmented embolism increases, leading to reduced productivity, further tissue damage and ultimately death (Brodribb and Cochard Citation2009). Finally, the safety margin quantifies the degree of conservatism of the hydraulic strategy of plants. Plants with low safety margins experience large amounts of embolism and are at high risk of hydraulic failure (McDowell Citation2011).
To understand the future of páramos in a potentially drier world, there is a need to evaluate the risk of hydraulic failure and the amplitude of the safety margin in their plants species. Hypericum is a common genus in the páramo (Crockett et al. Citation2010; Quesada-Román et al. Citation2020), known in some local communities as ‘guarda rocío’ in Spanish, which translates to dew keeper. Many Hypericum species growing in the páramo have thousands of tiny leaves able to harvest water from the fog, contributing to the páramo function as a water collector and reservoir. Hypericum species grow in various environmental conditions (Fariñas et al. Citation2008; Crockett et al. Citation2010; Cáceres et al. Citation2015), with some species associated with humid slopes and cushion bogs, whilst others prefer drier soils (Olivera and Cleef Citation2009; Crockett et al. Citation2010). This diversity suggests that different physiological tolerances or adaptations exist among Hypericum species which could explain their differential habitat preferences and make them a model system to evaluate the association between physiological tolerance or adaptation and habitat preferences in the páramo.
In this study, we quantified the risk of hydraulic failure of three Hypericum species. We tested whether their physiological hydraulic strategy and vulnerability to cavitation could be related to their habitat preference in the páramo. We first evaluated variables related to the distribution of species, such as vegetation structure (dominant life forms, such as grasses, shrubs, rosettes among others), soil temperature and soil water content. Additionally, we quantified various hydraulic traits known to be correlated with physiological vulnerability to drought (Anderegg et al. Citation2016), such as xylem density and xylem vessel diameter, the water potential at which 50% and 88% loss of conductivity occurs (Ψ50 and Ψ88), the minimum water potential under natural conditions (Ψmin), and two hydraulic safety margins (HSM50 and HSM88 estimated as the difference between Ψmin and Ψ50 and Ψ88, respectively). Finally, we measured the predawn and midday water potentials during the driest months of the year to classify the water regulation strategy (isohydric vs. anisohydric strategy) of Hypericum species. We hypothesised that if water availability was not a limiting factor in the páramo, it would be expected to find that all Hypericum species would have similar strategies and would be vulnerable to cavitation due to the hydraulic efficiency-safety trade-off (Meinzer et al. Citation2010). Alternatively, if Hypericum species showed different habitat preferences, with some species associated with drier sites, one would expect to find differences among species in their hydraulic strategies and vulnerability to cavitation.
Materials and methods
Study site
The study was conducted at the Páramo El Verjón-Matarredonda, north-eastern Colombian Andes, at 3250 m a.s.l. The vegetation was dominated by tussock grasses, intermixed with forbs, rosettes, sclerophyllous shrubs, bryophytes and lichens. The soil type at the site is Bh3-3b, hapludands (IGAC Citation2000; FAO Citation2009). The mean annual temperature was of 8.8°C, the absolute values ranging between −2 and 26°C (Leon-Garcia and Lasso Citation2019). The mean annual rainfall was of 1178 mm, ranging between 713 and 1795 mm (Figure S1). We obtained weather records from ‘La Bolsa’ weather station of the Colombian Institute of Hydrology, Meteorology and Environmental Studies, located 2 km from the study site and at 3195 m a.s.l. (IDEAM Citation2021).
Selection of sites along a moisture gradient
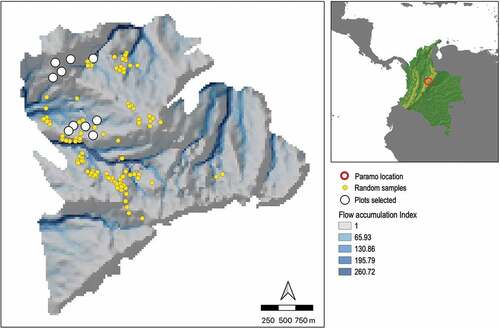
To quantify the habitat preferences of the three Hypericum species and their relationships with water availability, we established 10 plots of 10 m × 10 m each along a moisture gradient. To identify sites with varying moisture levels, we used the iSDM package (Hattab et al. Citation2017) in the R software (R Core Team Citation2020). First, we used GRASS GIS (GRASS Development Team Citation2017) and the elevation of Matarredonda (SRTM DEM – Shuttle Radar Topography Mission Digital Elevation Model) at 30 m spatial resolution, to extract variables related to soil water availability, such as slope orientation, slope angle and the number of pixels in the DEM from which the target pixel receives input from water flow path. The iSDM package identifies sampling points in the environmental space, comprising all possible combinations of slope, aspect, and flow accumulation, which were the proxies of water availability. We identified 100 sampling points (pixels at 30 m resolution) with varying moisture levels in the environmental space (). From the 100 generated sites, we selected 10 sites that were accessible and had the focal Hypericum species to establish our plots ().
Figure 1. Location of the Páramo El Verjón-Matarredonda, north-eastern Colombian Andes, at 3250 m a.s.l. and the location of the plots along a moisture gradient. The 10 study plots (white dots) were selected from 100 points (yellow dots) generated by the iSDM package to assess soil moisture availability. Colours in the map show the flow accumulation index obtained from the aspect map (direction of the slope in degrees) and the slope map (angle of inclination of the terrain).
Vegetation and soil variables
We recorded and mapped the vegetation cover in each plot, based on aerial photographs, using QGIS (QGIS Development Team Citation2018). Aerial photographs were taken with a DJI Inspire 2 T650 drone (DJI, Shenzhen, China) coupled with a DJI Zenmuse X5S camera with a 15-mm lens (DJI, Shenzhen, China). For vegetation mapping, we measured the area covered by the most representative growth forms (mosses, graminoids, shrubs, ferns, rosettes and the woody bamboo Chusquea) in a 1-m2 area surrounding each Hypericum plant within the plots (Figure S2).
Additionally, we recorded soil water content, soil temperature and soil electrical conductivity at 49 points inside each plot and around each Hypericum plant with a GS3 ruggedised soil moisture probe and temperature sensor coupled to a ProCheck handheld reader (METER Group, Pullman, WA, USA). The 49 measuring points were established at the four corners of each 1 m × 1 m quadrat inside a central 6 m × 6 m subplot within each 10 m × 10 m plot (Figure S2). In addition to these 49 points, we also took identical measurements under each Hypericum individual in each plot. We collected these data during the 2017–2018 dry season (December 2017 – January 2018) between 11:00 and 15:00 local time.
Physiological traits
Water potential
We measured the predawn (03:00-05:00) and midday (11:00-13:00) leaf water potentials on three branches from 10 randomly selected individuals of each Hypericum species during the dry season (mid-December 2017-mid-January 2018) using a Scholander pressure chamber (Model 1505D-EXP/PMS; PMS Instrument Co., Albany, OR, USA) following the protocol by Turner (Citation1988). To reduce any water loss between sampling and measurement, we enclosed the branch in aluminium foil in a Ziplock plastic bag before collection. Once the branch was cut, the bag was sealed and stored in a cool box for a maximum of 15 min until measurements were taken. The minimum value obtained for each species at noon during the dry season corresponds to the minimum water potential (ψmin) used to calculate the safety margin.
Vulnerability curves
Vulnerability curves are used to evaluate how sensitive a species is to cavitation produced by water stress. They are constructed by plotting the percentage loss of hydraulic conductivity (PLC) at different xylem water potentials (Tyree and Sperry Citation1989; Meinzer and McCulloh Citation2013). Several important parameters can be obtained from this curve, such as the water potential of the xylem when 50% of the conductivity is lost (ψ50), the water potential of the xylem when 88% of the conductivity is lost (ψ88), and the safety margins at both values (Meinzer and McCulloh Citation2013).
To construct the vulnerability curves, we collected 10 to 20 branches of each Hypericum species in the morning (6:00-7:00). Branches were cut underwater to avoid cavitation of the xylem. After cutting, they were transported in a polystyrene container to the laboratory. Branches were then kept in the dark for 12 h to fully hydrate them and obtain the highest water potential corresponding to a well-hydrated plant and as close to 0 as possible. To obtain the maximum conductivity Kmax from which the loss of hydraulic conductivity (PLC) was calculated, we subjected the stems to vacuum for 1 h in a solution of 20 mM KCl to eliminate any air bubble in the stem and obtain the maximum conductivity Kmax (Torres-Ruiz et al. Citation2012). Then, to obtain the values of xylem conductivity at different xylem water potential (Ψxylem), we used the air injection method (Tyree and Sperry Citation1989) in which stem fragments were subjected to a specific pressure for 15 min in the cavitation chamber to bring the stem to the desired water potential value. Afterward, we measured the hydraulic conductivity of that segment. This procedure was repeated by gradually increasing the pressure to which the sample was subjected to subsequently graph the loss of conductivity as a function of the water potential of a sample (Cochard et al. Citation2013).
To measure xylem conductivity, we used the tubing system (Torres-Ruiz et al. Citation2012). The proximal end of the stem to be measured was connected to an IV bag with a 20 mM KCL solution prepared in filtered distilled water, and the distal end to a plastic tube that landed on an electronic balance (Sartorius MSE 125P −100DU; Sartorius, Göttingen, Germany) that recorded the amount of 20 mM KCl solution that flowed through the xylem (i.e. xylem conductivity). For each water potential, we measured three hydraulic conductivity values: one initial flow measurement without pressure followed by two measurements at two different pressures which were generated by changing the height of the IV bag at 20 cm (2 KPa) and 30 cm (3 KPa). At each pressure point, we took five measurements after the value was stable and used the mean of these values to estimate the net flow rate from the slope of the fitted line (Kref). Subsequently, the net flow was divided by the pressure gradient applied to obtain the hydraulic conductivity K‘and divided by the length of the branch to obtain the conductance (Torres-Ruiz et al. Citation2012). The value (K’) obtained for each water potential (Ψxylem) point was used to calculate the percentage loss of hydraulic conductivity (% PLC) at that point as % PLC = 100 × (1– K’/Kmax). The vulnerability curves were plotted using the fitplc R package (Duursma and Choat Citation2017), adjusting the curve to the Weibull function with a 95% confidence interval. Subsequently, the ψ50 and ψ88 values were extracted from the curve, representing the water potential at which 50% and 88% of the conductivity of the xylem was lost. The HSM50 and HSM88 safety margins for each Hypericum species were calculated as HSM50 = ψmin - ψ50 and HSM88 = ψmin - ψ88, respectively.
Vulnerability index
We calculated the vulnerability index (VI), which provides information about the resistance to drought or frost-induced cavitation, using the xylem vessel diameter (VDiam) and the vessel density (VDen) as VI = VDiam/VDen (Scholz et al. Citation2013). Values of VI less than 1 indicate greater resistance to cavitation, whereas values greater than 3 are characteristic of plants adapted to environments with high water availability and less resistance to cavitation (Scholz et al. Citation2013).
To calculate VI, we randomly collected five individuals of each Hypericum species in the field, which were labelled and enclosed in plastic bags for transportation. Once in the laboratory, 15 µm thick cross-sections were prepared with a Leica RM2125 microtome (Leica Biosystems, Deer Park, IL, USA) and stained with toluidine blue. We measured five cross-sections per individual. In each cut, three photographs were taken at 40X with a NIKON Eclipse E400 phase-contrast microscope (Nikon Instruments Inc., Melville, NY, USA) coupled to a Canon EOS Rebel T31i camera (Canon U.S.A., Inc. Melville, New York, USA). The diameter and density of the vessels were determined using ImageJ software with a graduated micrometric slide. The VDiam was measured at the widest part (Scholz et al. Citation2013) in at least 50 random vessels. The vessel density was estimated from the same photos by counting the number of vessels present per 1-mm2 area.
Data analyses
We generated a water content map for each plot using a grid interpolation analysis in QGIS and the 49 water content data points inside each plot. To evaluate whether vegetation cover or the microenvironment (soil water content, soil temperature and soil electrical conductivity) were significantly related to the distribution of the three Hypericum species, we used linear mixed models and ran a principal component analysis (PCA) using the soil environmental variables and the vegetation cover values from the 1-m2 quadrat around each Hypericum species. We used the Kaiser-Guttman criterion by which the principal components with variance greater than 1 are considered to have the most information (Jolliffe Citation2002). Based on this criterion, we retained the first three components. Principal component analyses were performed using the prcmp R package. Plots were constructed using ggbiplot R package (Vincent Citation2011).
The linear mixed model was run using the lmertest R package (Kuznetsova et al. Citation2017) with soil microenvironmental variables as response variables whilst species and plots were explanatory factors. We observed a normal distribution of residuals and detected no outliers in our data set.
We compared Hypericum species for water potential at noon, a trait with normal distribution and homogeneous variance, with an ANOVA, followed by a Tukey’s test. Traits deviating from a normal distribution or with heterogeneous variance (vessel density and diameter, VI index, and water potential at predawn) were analysed with a Kruskal-Wallis test followed by Dunn’s tests. Analyses were made using the stats R package for the ANOVA, Kruskal-Wallis and Tukey´s tests, and the FSA R package (Ogle et al. Citation2022) for the Dunn test.
Results
Moisture gradient and vegetation
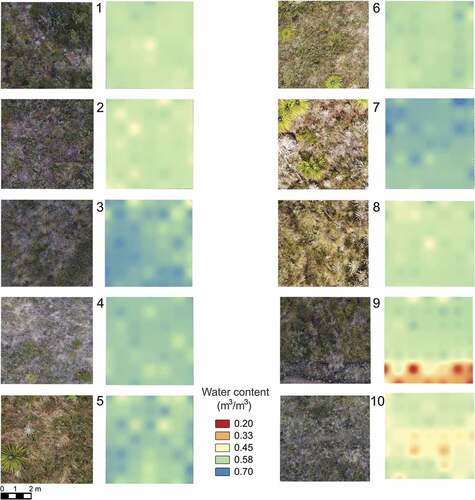
Soil water content in our 10 plots ranged between 0.25 and 0.67 m3/m3 and soil temperature between 11.9 and 21.3°C. Soil water content varied among plots and within plots, with plots 9 and 10 being the driest. The driest parts of these two plots had scarce vegetation cover. From the aerial photographs, we identified that vegetation around Hypericum individuals consisted of a mosaic of grasses, such as Calamagrostis effusa, various shrubs, and rosettes, mostly of the genera Puya and Espeletia, and mosses ().
Figure 2. Aerial photographs (left) and water content maps (right) for the 10 plots of study, Páramo El Verjón-Matarredonda, north-eastern Colombian Andes, at 3250 m a.s.l. The soil water content is expressed as volume of water (m3) per volume of soil (m3).
Factors related to species distribution
We excluded Chusquea from the PCA analyses because it had low cover in all plots (<10% cover) and was highly correlated with shrubs cover. The resulting PCA using the nine remaining variables showed that the first three components explained 61.2% of the total variation and was related to seven variables (). The first PCA axis (PC1), with 29.0% of variance explained, was related to soil variables, such as humidity, temperature, and electric conductivity and cover of bare soil. In contrast, PC2 and PC3, explaining up to 18.8 and 13.4% of the variance, respectively, were related to vegetation structure. Shrub and grass cover were related to PC2, whereas moss cover to PC3 ().
Figure 3. PCA created using soil environmental variables and plant cover of the main growth forms found in the 1 m2 plot around each plant of the analysed species in all 10 plots established along a moisture gradient, Páramo El Verjón-Matarredonda, north-eastern Colombian Andes, at 3250 m a.s.l. The upper panel shows the distribution of species along the first axis of variation (PC1) related to microtopographic variables and the second axis related to vegetation structure (PC2) highly correlated with shrub and grass cover. The bottom panel shows the distribution of species along the first axis of variation (PC1) related to microtopographic climatic variables and the third axis of variation (PC3) mainly correlated with moss cover.
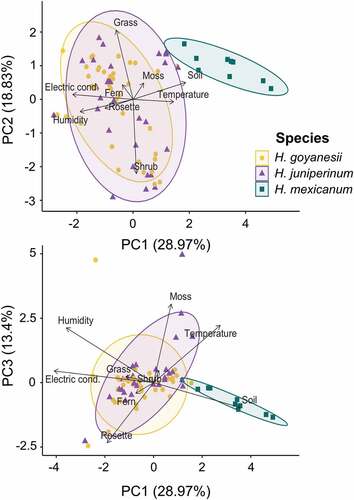
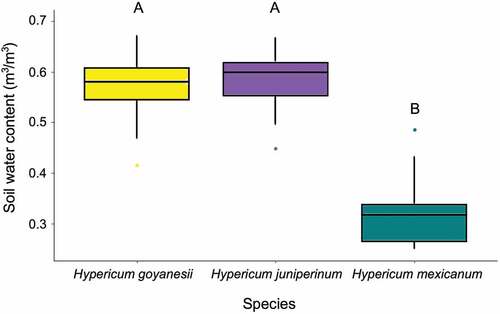
We found that only H. mexicanum had a spatial distribution different from that of the other two species. It grew in drier and warmer soils (with little or no vegetation cover) than the other species (). Comparing the soil water content, both H. goyanesii and H. juniperinum were found in similar and more humid soil than H. mexicanum (; F = 77.1, df = 2, P < 0.0001). Hypericum goyanesii and H. juniperinum were not correlated with vegetation structure, whereas H. mexicanum clustered at the positive part of the second PCA axis and the negative part of the third PCA axis (). These results indicated that H. mexicanum either avoids areas covered by shrubs and mosses or that shrubs and mosses create unfavourable conditions for its occurrence ().
Figure 4. Soil water content measured under each plant of each of the analysed species in all 10 plots established along the moisture gradient, Páramo El Verjón-Matarredonda, north-eastern Colombian Andes, at 3250 m a.s.l. Box plots show means and standard errors. Different letters indicate statistically significant differences among Hypericum species.
Physiological traits
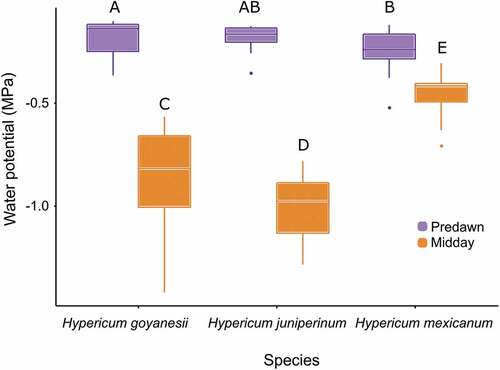
Water potential values at predawn and midday supported our findings in relation to the distribution of the three Hypericum species. Hypericum mexicanum, the species found mostly in dry and warm soils, also showed a water regulation strategy clearly different from that of the other two species. Hypericum mexicanum had higher leaf water potentials in comparison to the other two species at midday (F = 46.0, df = 2; P < 0.0001) and lower at predawn (X2 = 6.9, df = 2; P = 0.03; ).
Figure 5. Values of predawn and midday leaf water potential measured during the dry season of 2017 on three branches from 10 individuals of each Hypericum species, Páramo El Verjón-Matarredonda, north-eastern Colombian Andes, at 3250 m a.s.l. Different letters indicate statistically significant differences among Hypericum species.
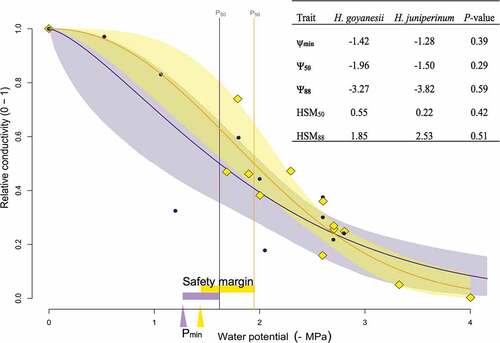
We could construct vulnerability curves for two species, H. juniperinum and H. goyanesii, as the stems of H. mexicanum are filled with resins, making it difficult to obtain reliable conductivity measurements. Based on these vulnerability curves, H. juniperinum and H. goyanesii appeared equally vulnerable to cavitation (). Both species lost 50% of the conductivity of the xylem (ψ50) when the branches reached a water potential between −1.5 and −1.9 MPa, and 88% of the conductivity of the xylem (ψ88) when the plant reached a water potential close to −3.3 and −3.8 MPa (). The minimum leaf water potential values found for these species in the dry season were of −1.4 and −1.3 MPa respectively. The safety margin to reach a loss of 50% of the hydraulic conductivity (HSM50) was of 0.22 MPa and 0.55 MPa. In the case of the safety margin to reach a loss of 88% of the hydraulic conductivity (HSM88), values were of 1.85 and 2.53 MPa.
Figure 6. Vulnerability curves for Hypericum goyanesii (yellow line and diamonds) and H. juniperinum (purple line and dots) and their 95% confidence intervals. Vertical lines show the water potential when 50% of the xylem conductivity is lost (Ψ50). the triangle on the x-axis shows the minimum water potential during the dry season (Ψmin) and the bars next to it show the safety margin (HSM50 = Ψmin - Ψ50). the inner table show all these hydraulic parameters and the ones calculated when 88% of the xylem conductivity is lost. P-values in the last column correspond to the comparison among the two species.
The vulnerability to drought based on the xylem anatomy showed all three Hypericum species resistant to cavitation, with VI values <1 typically indicating greater resistance to cavitation (). Species differed in their vessel diameter (X2 = 32.4.; df = 2; P < 0.0001) and vessel density (X2 = 11.9; df = 2; P = 0.003). Hypericum mexicanum was the species with the narrowest xylem vessels and the lowest VI, significantly different from those of H. goyanesii and H. juniperinum (X2 = 25.6; df = 2; P < 0.0001; ), making it the least vulnerable to cavitation of the studied species. Hypericum goyanesii had the greatest VI because of its wider xylem vessels and lowest vessel density, with VI = 0.99, indicating that even this species should be resistant to cavitation.
Table 1. Mean ± standard errors of anatomical traits associated with vulnerability to drought in three Hypericum species, Páramo El Verjón-Matarredonda, north-eastern Colombian Andes, at 3250 m a.s.l. VDiam, vessel diameter; VDen, vessel density; VI, vulnerability index. Different letters in a row indicate that traits are significantly different among species.
Discussion
We evaluated habitat preference, water regulation strategy and vulnerability to cavitation of three species of Hypericum in a Colombian páramo. We found that Hypericum species distribution is mainly related to microtopographic conditions, including soil temperature, soil water content, vegetation cover, and, to a lesser extent, plant life form. Hypericum mexicanum was predominantly found in areas of reduced shrub and moss cover. Based on anatomical data, the three Hypericum species should not be vulnerable to cavitation because their xylem vessels are narrow and their VI values below 1, which indicates greater resistance to cavitation (Scholz et al. Citation2013). However, the values obtained from the vulnerability curves for H. goyanesii and H. juniperinum suggest that these species cavitate and lose hydraulic conductivity at relatively high values of water potential. In addition, their safety margins suggest that they would be vulnerable to drought via hydraulic failure if conditions became drier. In contrast, H. mexicanum, found in drier and warmer sites showed an isohydric water regulation strategy, keeping higher midday leaf water potentials, had narrower xylem vessels and the lowest VI values, indicating its greatest resistance to cavitation.
Although predawn leaf water potential is expected to be in equilibrium with soil water potential and, therefore, with plant available soil water content, we did not find large differences among Hypericum species in their predawn leaf water potential, despite measuring differences in soil moisture content within and among plots during the day on similar clear days. Such differences between predawn water potential and soil water potential around their roots are possible (Donovan et al. Citation2001; Bucci et al. Citation2005). It would be necessary to study in more detail the mechanisms allowing H. mexicanum to maintain high predawn water potentials despite occurring in drier localities than the other two species. This could be related to the production of resin, which represents an additional barrier to water vapour diffusion from the epidermis and stomatal pores (Zavala and Ravetta Citation2001). It is also possible that these sites where H. mexicanum grows are not dry in the early morning but dry out faster than the other sites because they are further exposed.
Spatial variation in soil condition and its relationship with the distribution of Hypericum species
Soil water content during the day ranged between 0.25 and 0.67 m3/m3 and temperature between 11.9°C and 21.3°C, resulting in a great diversity of microhabitats, as reported for other páramos (Sarmiento et al. Citation2003; Ramírez et al. Citation2015). These parameters were expected due to the small-scale topographic complexity typical of alpine habitats (Körner and Hiltbrunner Citation2018). In our study, the distribution of Hypericum species appears to be related to water availability and soil temperature and less to the vegetation surrounding Hypericum individuals. Hypericum juniperinum and H. goyanesii were consistently found on cooler and wetter soils regardless of the type of vegetation (i.e. grasses, shrubs, rosettes), in contrast to previous findings in other páramos where these species mainly grow with grasses and sedges (Fariñas et al. Citation2008; Crockett et al. Citation2010). Conversely, H. mexicanum was consistently found on warmer, drier soils with sparse shrub and moss cover, supporting the pioneer character of this species (Crockett and Robson Citation2011).
Physiological strategies
Monitoring the daily variation of leaf water potential and the vulnerability to cavitation helped differentiate the strategies used by the three Hypericum species. Hypericum mexicanum, the species found at the driest sites, was the only species with an isohydric behaviour, maintaining a relatively constant leaf water potential both predawn and at midday. This ability to maintain a stable water potential throughout the day, while avoiding drought, comes at some cost. In particular, by keeping stomata closed, the gas exchange capacity of plants decreases and daily CO₂ assimilation could therefore be lower during drier periods (Flexas and Medrano Citation2002; Haworth et al. Citation2015). The other two species, H. goyanesii and H. juniperinum were found in wetter localities and showed anisohydric behaviour, with a drop in leaf water potential at midday. The reduction in leaf water potential might occur if plants keep their stomata open longer to maintain carbon assimilation, even if soil water content decreases or evaporative demand from the air increases during the day. Although this strategy is risky, it is beneficial when water availability is secure and under moderate drought conditions because anisohydric plants can maintain higher carbon assimilation than isohydric plants (Kumagai and Porporato Citation2012). It is also considered a stress-resistance strategy (Sade et al. Citation2012). However, if the occurrence and frequency of intense drought increased in the páramo, as predicted for the northern Andes (Urrutia and Vuille Citation2009; Buytaert et al. Citation2011), this anisohydric behaviour could result in cavitation and failure of the water transport system, as suggested by the vulnerability curves.
Vulnerability curve, safety margins, and implications climate change scenarios
In the páramos of the eastern cordillera of Colombia, plants are expected to have abundant water most of the year (Buytaert et al. Citation2006) and a greater probability of cavitation in cases of drought (Choat et al. Citation2012). The vulnerability curves of H. juniperinum and H. goyanesii corroborate that they are vulnerable to drought, reaching a 50% loss of hydraulic conductivity at a water potential between −1.5 and −1.9 MPa, and almost complete xylem failure (loss of 88% of hydraulic conductivity) at −3.27 and − 3.82 MPa. Given that, in an average dry season, these species had values of minimum leaf water potential (Ψmin) between −1.42 and −1.28 MPa, a drought event causing an additional reduction in the water potential of only 0.22 to 0.55 MPa could provoke significant cavitation of the system with a 50% loss in hydraulic conductivity (i.e. HSM50 of <0.5 MPa). As for the safety margin to reach a loss of 88% of the hydraulic conductivity (HSM88), we found a safety margin between 1.85 and 2.53 MPa. All these metrics obtained from the vulnerability curves are at the lower end of values reported for 223 species across other biomes (boreal tundra, temperate rain forest, tropical rainforest, woodland/shrubland; Choat et al. Citation2012), indicating that these Hypericum species from the páramo are among the most vulnerable. Most species across the world operate at narrow safety margins (HSM50 of < 1 MPa), but some have larger margins up to 8.87 MPa (Choat et al. Citation2012). Likewise, the average safety margin to reach an 88% loss of hydraulic conductivity (HSM88) reported for the 223 species was of 2.72 MPa, with the largest value of 13.8 MPa (Choat et al. Citation2012), whilst our highest value was of 2.52 MPa. Our safety margins data of the Hypericum species of the páramos indicated that they could be vulnerable to drought-induced decline if extreme drought events became more frequent, as predicted for this part of the Andes (Urrutia and Vuille Citation2009; Buytaert et al. Citation2011; Gutiérrez et al. Citation2021).
These are the first vulnerability curves created for páramo species. For this reason, we cannot conclude if vulnerability to cavitation is widespread in this ecosystem. Studies conducted with other approaches and measuring other traits related to the ability to tolerate water deficit (Markesteijn et al. Citation2011; Martínez-Garza et al. Citation2013; Powers et al. Citation2020; Pivovaroff et al. Citation2021) have indicated that the most species tolerant to water deficit are usually grasses and shrubs (Rada et al. Citation2019; Cruz and Lasso Citation2021). However, these data from vulnerability curves suggest that some shrubs could be more vulnerable than initially thought. For example, Rada et al. (Citation2019) have revised physiological traits of 45 herbaceous and 42 woody species from the Venezuelan high Andes, showing midday leaf water potential values during the dry season between −1.4 to −2.7 MPa. They also reported for Hypericum laricifolium minimum water potentials of −1.8 MPa (Llambí et al. Citation2003; Rada et al. Citation2019), suggesting that Hypericum species in the drier Venezuelan páramos may withstand lower water potentials than the Hypericum species in our study in Colombia, where the lowest Ψmin was of −1.4 MPa. Hypericum irazuense, a shrub dominating the páramos in Central America, was also reported as sensitive to water deficit and showed a reduction in growth during dry periods (Quesada-Román et al. Citation2020). From these different páramos exposed to different climatic conditions, it seems that plant tolerance to water deficit could vary in response to the different precipitation regimes. Evaluating the vulnerability of the water transport system across páramos with different water availability could shed some light into the variation in hydraulic traits among páramo species and their importance for predicting the risk of dieback in drought events (Anderegg Citation2015; Choat et al. Citation2018; Powers et al. Citation2020).
All the studied Hypericum species showed narrow xylem vessels at high density. Narrow vessels at high elevations are considered an adaptation to prevent the reduction of hydraulic function during freezing events (Soukup et al. Citation2021), as happens in cloudless summer nights (Sklenář et al. Citation2015, Citation2016). When water freezes, air bubbles form and the xylem cavitates (Robson et al. Citation1987; Mayr et al. Citation2003), preventing water transport until temperature rises when thawing allows the dissolution of the bubbles (Feild and Brodribb Citation2001). Narrow vessels are more common at higher elevations, as seen in Senecio species from the Ecuadorian páramo, which have vessels with diameters between 5.4 and 6.5 μm at elevations above 4200 m and between 8.1 and 9.8 μm up to 4200 m (Soukup et al. Citation2021). It has also been reported that species of Ericaceae from the driest páramos of Venezuela, collected at 3400 m, showed VI values <0.1, which is typical of xeromorphic plants with very narrow vessels and high vessel density. The vessel width of these Ericaceae species ranged from 21 to 23 μm (Barrios and Rondón Citation2014). Similarly, species of Pentacalia (Asteraceae) collected in páramos of Venezuela had vessels between 16 and 44 μm in diameter (León-H and Gámez-A Citation2018). In contrast, the vessel diameters found for Hypericum species in this study were wider and ranged between 24 and 71 μm. Only H. mexicanum, the species from drier environments, had vessels comparable to the values reported for the driest páramos of Venezuela. The other two Hypericum species had wider vessels (71.7 ± 1.9 μm for H. goyanesii and 52.4 ± 1.2 μm for H. juniperinum), which aligns with the higher water availability usable by these species. In theory, such wider vessels are expected to take longer to refill to reverse the embolism (Pittermann and Sperry Citation2003), making them more susceptible to drought. Unfortunately, there are no data on the ability of páramo plants to reverse embolism by refilling the conduits with water (Klein et al. Citation2018), which represents a promising venue for future research.
Conclusions
Climate envelope models suggest that the páramo could shrink by up to 52% in warmer and drier conditions (Cresso et al. Citation2020; Peyre et al. Citation2020; Valencia et al. Citation2020), although expectations could improve if páramo species exhibited intra-specific variation in their vulnerability to drought. Moreover, the high microclimatic spatial variability typically found in alpine landscapes might also buffer the effects of warming and increasing drought by providing refugia to many species (Dobrowski Citation2011; Scherrer and Körner Citation2011; Lenoir et al. Citation2013; Opedal et al. Citation2015; Körner and Hiltbrunner Citation2021). However, our data showed that two species of Hypericum reached the point of hydraulic failure at relatively high values of water potentials and could be at high risk under periods of extended water deficit (Anderegg et al. Citation2015; Sperry and Love Citation2015). Thus, it is necessary to study the vulnerability to drought, specifically to cavitation, of further páramo species and assess their ability to reverse embolism to understand the effects of climate change on the composition of the páramo vegetation under a scenario of longer and more intense dry seasons.
Supplemental_material
Download MS Word (2.9 MB)Acknowledgments
This work was supported by Colciencias (Minciencias) under Grant 120471451294; the Faculty of Sciences at the Universidad de Los Andes under Grant INV-2019-84-1805. We further thank Héctor Ayarza for his assistance during fieldwork and Gigio Arango for taking the drone images. We thank Lina Aragón and Viviana Londoño for their comments on the initial versions of the document.
Supplementary material
Supplemental data for this article can be accessed online at https://doi.org/10.1080/17550874.2022.2143731
Disclosure statement
No potential conflict of interest was reported by the author(s).
Data availability statement
The data that support the findings of this study are available from the corresponding author upon reasonable request.
Additional information
Funding
References
- Adams HD, Zeppel MJB, Anderegg WRL, Hartmann H, Landhäusser SM, Tissue DT, Huxman TE, Hudson PJ, Franz TE, Allen CD, et al. 2017. A multi-species synthesis of physiological mechanisms in drought-induced tree mortality. Nat Ecol Evol. 1(9):1285–1291. doi:10.1038/s41559-017-0248-x.
- Allen CD, Macalady AK, Chenchouni H, Bachelet D, McDowell NG, Vennetier M, Kitzberger T, Rigling A, Breshears DD, Hogg EH, et al. 2010. A global overview of drought and heat‐induced tree mortality reveals emerging climate change risks for forests. For Ecol Manag. 259(4):660–684. doi:10.1016/j.foreco.2009.09.001.
- Anderegg WRL. 2015. Spatial and temporal variation in plant hydraulic traits and their relevance for climate change impacts on vegetation. New Phytol. 205(3):1008–1014. doi:10.1111/nph.12907.
- Anderegg WRL, Flint A, Huanf CY, Flint L, Berr JA, Davis FW, Sperry JS, Field CB. 2015. Tree mortality predicted from drought-induced vascular damage. Nat Geosci. 8(5):367–371. doi:10.1038/ngeo2400.
- Anderegg WRL, Klein T, Bartlett M, Sack L, Pellegrini AFA, Choat B, Jansen S. 2016. Meta-analysis reveals that hydraulic traits explain cross-species patterns of drought-induced tree mortality across the globe. Proc Natl Acad Sci. 113(18):5024–5029. doi:10.1073/pnas.1525678113.
- Barrios N, Rondón D. 2014. Anatomía de la madera de tres especies de Ericaceae en el Páramo de la Culata, Mérida, Venezuela. Pittieria. 38:135–146.
- Bradley RS, Vuille M, Diaz HF, Vergara W. 2006. Threats to water supplies in the tropical Andes. Science. 312:1755–1756. doi:10.1126/science.1128087.
- Brodribb TJ, Cochard H. 2009. Hydraulic failure defines the recovery and point of death in water-stressed conifers. Plant Physiol. 149(1):575–584. doi:10.1104/pp.108.129783.
- Bucci SJ, Goldstein G, Meinzer FC, Franco AC, Campanello P, Scholz FG. 2005. Mechanisms contributing to seasonal homeostasis of minimum leaf water potential and predawn disequilibrium between soil and plant water potential in Neotropical savanna trees. Trees. 19:296–304. doi:10.1007/s00468-004-0391-2.
- Buytaert W, Célleri R, Bièvre B D, Cisneros F, Wyseure G, Deckers J, Hofstede R. 2006. Human impact on the hydrology of the Andean páramos. Earth Sci Rev. 79(1–2):53–72. doi:10.1016/j.earscirev.2006.06.002.
- Buytaert W, Cuesta-Camacho F, Tobón C. 2011. Potential impacts of climate change on the environmental services of humid tropical alpine regions. Glob Ecol Biogeogr. 20(1):19–33. doi:10.1111/j.1466-8238.2010.00585.x.
- Cáceres Y, Llambí LD, Rada F. 2015. Shrubs as foundation species in a high tropical alpine ecosystem: a multi-scale analysis of plant spatial interactions. Plant Ecol Divers. 8(2):147–161. doi:10.1080/17550874.2014.960173.
- Choat B, Brodribb TJ, Brodersen CR, Duursma RA, López R, Medlyn BE. 2018. Triggers of tree mortality under drought. Nature. 558:531–539. doi:10.1038/s41586-018-0240-x.
- Choat B, Jansen S, Brodribb TJ, Cochard H, Delzon S, Bhaskar R, Bucci SJ, Field TS, Gleason SM, Hacke UG, et al. 2012. Global convergence in the vulnerability of forests to drought. Nature. 491(7426):752–755. doi:10.1038/nature11688.
- Cochard H, Badel E, Herbette S, Delzon S, Choat B, Jansen S. 2013. Methods for measuring plant vulnerability to cavitation: a critical review. J Exp Bot. 64(15):4779–4791. doi:10.1093/jxb/ert193.
- Cresso M, Clerici N, Sanchez A, Jaramillo F. 2020. Future climate change renders unsuitable conditions for paramo ecosystems in Colombia. Sustainability. 12(20):8373. doi:10.3390/su12208373.
- Crockett S, Eberhardt M, Kunert O, Schühly W. 2010. Hypericum species in the Páramos of Central and South America: a special focus upon H. irazuense Kuntze ex N. Robson. Phytochem Rev. 9(2):255–269. doi:10.1007/s11101-009-9148-2.
- Crockett S, Robson N. 2011. Taxonomy and chemotaxonomy of the genus Hypericum. Med Aromat Plant Sci Biotechnol. 5(Special Issue 1):1–13.
- Cruz M, Lasso E. 2021. Insights into the functional ecology of páramo plants in Colombia. Biotropica. 53:1415–1431. doi:10.1111/btp.12992.
- Diaz HF, Bradley RS, Ning L. 2014. Climatic changes in mountain regions of the American cordillera and the tropics: historical changes and future outlook. Arct Antarct Alp Res. 46(4):735–743. doi:10.1657/1938-4246-46.4.735.
- Dobrowski SZ. 2011. A climatic basis for microrefugia: the influence of terrain on climate. Glob Change Biol. 17(2):1022–1035. doi:10.1111/j.1365-2486.2010.02263.x.
- Donovan L, Linton M, Richards J. 2001. Predawn plant water potential does not necessarily equilibrate with soil water potential under well-watered conditions. Oecologia. 129:328–335. doi:10.1007/s004420100738.
- Duursma R, Choat B. 2017. Fitplc - an R package to fit hydraulic vulnerability curves. J Plant Hydraul. 4:e002. doi:10.20870/jph.2017.e002.
- FAO. 2009. Harmonized world soil database (version 1.1). Italy: FAO.
- Fariñas M, Lazaro N, Monasterio M. 2008. Ecologia comparada de Hypericum laricifolium Juss. y de H. juniperium Kunth en el valle fluvioglacial del páramo de Mucubají. Mérida, Venezuela Ecotropicos. 21:75–88.
- Feild TS, Brodribb T. 2001. Stem water transport and freeze–thaw xylem embolism in conifers and angiosperms in a Tasmanian treeline heath. Oecologia. 127(3):314–320. doi:10.1007/s004420000603.
- Fensham RJ, Fairfax RJ, Ward DP. 2009. Drought-induced tree death in savanna. Glob Change Biol. 15(2):380–387. doi:10.1111/j.1365-2486.2008.01718.x.
- Flexas J, Medrano H. 2002. Drought-inhibition of photosynthesis in C3 plants: stomatal and non–stomatal limitations revisited. Ann Bot. 89(2):183–189. doi:10.1093/aob/mcf027.
- GRASS Development Team. 2017. Geographic Resources Analysis Support System (GRASS) software. Open Source Geospatial Foundation Project. [Accessed. 2017 May 18]. https://grass.osgeo.org/
- Greenwood S, Ruiz-Benito P, Martínez-Vilalta J, Lloret F, Kitzberger T, Allen CD, Fensham R, Laughlin DC, Kattge J, Bönisch G, et al. 2017. Tree mortality across biomes is promoted by drought intensity, lower wood density and higher specific leaf area. Ecol Lett. 20(4):539–553. doi:10.1111/ele.12748.
- Gutiérrez JM, Jones RG, Narisma GT, Alves LM, Amjad M, Gorodetskaya G IV, M KN, Krakovska S, Li J, Martínez-Castro D, et al. 2021. Atlas. In: Climate change 2021: the physical science basis. contribution of working group I to the sixth assessment report of the intergovernmental panel on climate change. Masson-Delmotte V, Zhai P, Pirani A, SL C, Péan C, Berger S, Caud N, Chen Y, Goldfarb L, MI G, Huang M, Leitzell K, Lonnoy E, JBR M, TK M, Waterfield T, Yelekçi O, Yu R Zhou B, editors. Cambridge University Press: Interactive Atlas available from http://interactive-atlas.ipcc.ch/
- Hattab T, Garzón-López CX, Ewald M, Skowronek S, Aerts R, Horen H, Lenoir J, Gallet-Moron E, Spicher F, Decocq G, et al. 2017. A unified framework to model the potential and realized distributions of invasive species within the invaded range. null. 23(7):806–819. doi:10.1111/ddi.12566.
- Haworth M, Killi D, Materassi A, Raschi A. 2015. Co-ordination of stomatal physiological behavior and morphology with carbon dioxide determines stomatal control. Am J Bot. 102(5):677–688. doi:10.3732/ajb.1400508.
- Hoffmann WA, Marchin RM, Abit P, Lau OL. 2011. Hydraulic failure and tree dieback are associated with high wood density in a temperate forest under extreme drought. Glob Change Biol. 17(8):2731–2742. doi:10.1111/j.1365-2486.2011.02401.x.
- Hofstede R. 1999. El páramo como espacio para la fijacion de carbono atmosferico. In: Medina G Mena P, editors. El Paramo Como Espacio De Mitigacion De Carbono Atmosferico. Quito: Ediciones Abya-Yala; pp. 3–6.
- Hofstede R, Calles J, López V, Polanco R, Torres F, Ulloa J, Cerra M. 2014. Los Páramos Andinos ¿Qué Sabemos? Estado de conocimiento sobre el impacto del cambio climático en el ecosistema Páramo. Quito. [Accessed 2017 May 18]. https://portals.iucn.org/library/sites/library/files/documents/2014-025.pdf
- Hribljan JA, Suarez E, Bourgeau-Chavez L, Endres S, Lilleskov EA, Chimbolema S, Wayson C, Serocki E, Chimner RA. 2017. Multidate, multisensor remote sensing reveals high density of carbon-rich mountain peatlands in the páramo of Ecuador. Glob Change Biol. 23(12):5412–5425. doi:10.1111/gcb.13807.
- IDEAM. 2021. Consulta y descarga de datos meteorológicos de Colombia. [Accessed. 2021 June 2]. http://dhime.ideam.gov.co/atencionciudadano/
- IGAC. 2000. Estudio General De Suelos Del Departamento De Cundinamarca. Bogotá, Colombia: Instituto Geográfico Agustín Codazzi.
- Jolliffe IT. 2002. Mathematical and statistical properties of sample principal components. In: Principal component analysis. springer series in statistics. New York, NY: Springer. doi:10.1007/0-387-22440-8_3
- Klein T, Zeppel MJB, Anderegg WRL, Bloemen J, De Kauwe MG, Hudson P, Ruehr NK, Powell TL, von Arx G, Nardini A. 2018. Xylem embolism refilling and resilience against drought-induced mortality in woody plants: processes and trade-offs. Ecol Res. 33:839–855. doi:10.1007/s11284-018-1588-y.
- Körner C, Hiltbrunner E. 2018. The 90 ways to describe plant temperature. Perspect Plant Ecol Evol Syst. 30:16–21. doi:10.1016/j.ppees.2017.04.004.
- Körner C, Hiltbrunner E. 2021. Why is the Alpine flora comparatively robust against climatic warming? Diversity. 13:383. doi:10.3390/d13080383.
- Kraft NJB, Metz MR, Condit RS, Chave J. 2010. The relationship between wood density and mortality in a global tropical forest data set. New Phytol. 188(4):1124–1136. doi:10.1111/j.1469-8137.2010.03444.x.
- Kumagai T, Porporato A. 2012. Strategies of a Bornean tropical rainforest water use as a function of rainfall regime: isohydric or anisohydric? Plant Cell Environ. 35(1):61–71. doi:10.1111/j.1365-3040.2011.02428.x.
- Kursar TA, Engelbrecht BMJ, Burke A, Turee MT, Omari BE, Giraldo JP. 2009. Tolerance to low leaf water status of tropical tree seedlings is related to drought performance and distribution. Funct Ecol. 23(1):93–102. doi:10.1111/j.1365-2435.2008.01483.x.
- Kuznetsova A, Brockhoff PB, Christensen RHB. 2017. lmerTest package: tests in linear mixed effects models. J Stat Softw. 82(13):1–26. doi:10.18637/jss.v082.i13.
- Lenoir J, Graae BJ, Aarrestad PA, Alsos IG, Armbruster WS, Austrheim G, Bergendorff C, Birks HJ, Brathen KA, Brunet J, et al. 2013. Local temperatures inferred from plant communities suggest strong spatial buffering of climate warming across Northern Europe. Glob Change Biol. 19(5):1470–1481. doi:10.1111/gcb.12129.
- Leon-Garcia IV, Lasso E . 2019. High heat tolerance in plants from the Andean highlands: implications for páramos in a warmer world. PLoS ONE. 14(11):e0224218. doi:10.1371/journal.pone.0224218.
- León-H WJ, Gámez-A LE. 2018. Anatomía de la madera de ocho especies de Pentacalia (Asteraceae) en Venezuela. Caldasia. 40(1):41–53. doi:10.15446/caldasia.v40n1.65722.
- Liu X, Chen B. 2000. Climatic warming in the Tibetan Plateau during recent decades. Int J Climatol. 20(14):1729–1742. doi:10.1002/1097-0088(20001130)20:14<1729:AID-JOC556>3.0.CO;2-Y.
- Llambí LD, Fonataine M, Rada F, Saugier B, Sarmiento L. 2003. Ecophysiology of dominant plant species during secondary succession in a high Andean páramo ecosystem. Arct Antarct Alp Res. 35(4):447–453. doi:10.1657/1523-0430(2003)035[0447:EODPSD]2.0.CO;2.
- Llambí LD, Rada F. 2019. Ecological research in the tropical alpine ecosystems of the Venezuelan páramo: past, present and future. Plant Ecol Divers. 12(6):519–538. doi:10.1080/17550874.2019.1680762.
- Markesteijn L, Poorter L, Bongers F, Paz H, Sack L. 2011. Hydraulics and life history of tropical dry forest tree species: coordination of species’ drought and shade tolerance. New Phytol. 191(2):480–495. doi:10.1111/j.1469-8137.2011.03708.x.
- Martínez-Garza C, Bongers F, Poorter L. 2013. Are functional traits good predictors of species performance in restoration plantings in tropical abandoned pastures? For Ecol Manag. 303:35–45. doi:10.1016/j.foreco.2013.03.046.
- Mayr S, Gruber A, Bauer H. 2003. Repeated freeze–thaw cycles induce embolism in drought stressed conifers (Norway spruce, stone pine). Planta. 217(3):436–441. doi:10.1007/s00425-003-0997-4.
- McDowell N. 2011. Mechanisms linking drought, hydraulics, carbon metabolism, and vegetation mortality. Plant Physiol. 155(3):1051–1059. doi:10.1104/pp.110.170704.
- McDowell N, Allen CD, Anderson-Teixeira K, Brando P, Brienen R, Chambers J, Christoffersen B, Davies S, Doughty C, Duque A, et al. 2018. Drivers and mechanisms of tree mortality in moist tropical forests. New Phytol. 219(3):851–869. doi:10.1111/nph.15027.
- Meinzer FC, McCulloh KA. 2013. Xylem recovery from drought-induced embolism: where is the hydraulic point of no return? Tree Physiol. 33(4):331–334. doi:10.1093/treephys/tpt022.
- Meinzer FC, McCulloh KA, Lachenbruch B, Woodruff DR, Johnson DM. 2010. The blind men and the elephant: the impact of context and scale in evaluating conflicts between plant hydraulic safety and efficiency. Oecologia. 164:287–296. doi:10.1007/s00442-010-1734-x.
- Nardini A, Battistuzzo M, Savi T. 2013. Shoot desiccation and hydraulic failure in temperate woody angiosperms during an extreme summer drought. New Phytol. 200(2):322–329. doi:10.1111/nph.12288.
- Ogle DH, Doll JC, Wheeler P, Dinno A. 2022. FSA: fisheries stock analysis. R package version 0.9.3. https://github.com/fishR-Core-Team/FSA.
- Olivera MCM, Cleef AM. 2009. A phytosociological study of the páramo along two altitudinal transects in El Carchi Province, northern Ecuador. Phytocoenologia. 39:79–107. doi:10.1127/0340-269X/2009/0039-0079.
- Opedal ØH, Armbruster SW, Graae SW. 2015. Linking small-scale topography with microclimate, plant species diversity and intra-specific trait variation in an alpine landscape. Plant Ecol Divers. 8(3):305–315. doi:10.1080/17550874.2014.987330.
- Peyre G, Lenoir J, Karger DN, Gomez M, Gonzalez A, Broennimann O, Guisan A, Jiménez‐alfaro B. 2020. The fate of Páramo plant assemblages in the sky islands of the northern Andes. J Veg Sci. 31(6):967–980. doi:10.1111/jvs.12898.
- Pittermann J, Sperry JS. 2003. Tracheid diameter is the key trait determining the extent of freezing‐induced embolism in conifers. Tree Physiol. 23(13):907–914. doi:10.1093/treephys/23.13.907.
- Pivovaroff AL, Wolfe BT, McDowell N, Christoffersen B, Davies S, Dickman LT, Grossiord C, Leff RT, Rogers A, Serbin SP, et al. 2021. Hydraulic architecture explains species moisture dependency but not mortality rates across a tropical rainfall gradient. Biotropica. 53(4):1213–1225. doi:10.1111/btp.12964.
- Powers JS, Vargas GG, Brodribb TJ, Schwartz NB, Pérez-Aviles D, Smith-Martin CM, Becknell JM, Aureli F, Blanco R, Calderón-Morales E, et al. 2020. A catastrophic tropical drought kills hydraulically vulnerable tree species. Glob Change Biol. 26(5):3122–3133. doi:10.1111/gcb.15037.
- QGIS Development Team. 2018. QGIS Geographic information system. Open Source Geospatial Foundation Project. [Accessed. 2017 May 18]. http://qgis.osgeo.org.
- Quesada-Román A, Ballesteros-Cánovas JA, Guillet S, Madrigal-González J, Stoffel M. 2020. Neotropical Hypericum irazuense shrubs reveal recent ENSO variability in Costa Rican páramo. Dendrochronologia. 61:125704. doi:10.1016/j.dendro.2020.125704.
- Rada F, Azócar A, García-Núñez C. 2019. Plant functional diversity in tropical Andean páramos. Plant Ecol Div. 12(6):539–553. doi:10.1080/17550874.2019.1674396.
- Ramírez LA, Rada F, Llambí LD. 2015. Linking patterns and processes through ecosystem engineering: effects of shrubs on microhabitat and water status of associated plants in the high tropical Andes. Plant Ecol. 216(2):213–225. doi:10.1007/s11258-014-0429-5.
- R Core Team. 2020. R: a language and environment for statistical computing. Vienna, Austria: R Foundation for Statistical Computing. https://www.R-project.org/.
- Robson DJ, Petty JA, PETTY JA. 1987. Freezing in conifer xylem. I. Pressure changes and growth velocity of ice. J Exp Bot. 39(11):1617–1621. doi:10.1093/jxb/38.11.1901.
- Sade N, Gebremedhin A, Moshelion M. 2012. Risk-taking plants: anisohydric behavior as a stress-resistance trait. Plant Signal Behav. 7(7):767–770. doi:10.4161/psb.20505.
- Sarmiento L, Llambí LD, Escalona A, Marquez N. 2003. Vegetation patterns, regeneration rates and divergence in an old-field succession of the high tropical Andes. Plant Ecol. 166(1):145–156. doi:10.1023/A:1023262724696.
- Scherrer D, Körner C. 2011. Topographically controlled thermal-habitat differentiation buffers alpine plant diversity against climate warming. J Biogeogr. 38(2):406–416. doi:10.1111/j.1365-2699.2010.02407.x.
- Scholz A, Klepsch M, Karimi Z, Jansen S. 2013. How to quantify conduits in wood? Front Plant Sci. 4:1–11. doi:10.3389/fpls.2013.00056.
- Sklenář P, Kucerová A, Macková J, Macek P. 2015. Temporal variation of climate in the high elevation páramo of Antisana, Ecuador. Geogr Fis Dinam Quat. 38:67–78. doi:10.4461/GFDQ.2015.38.07.
- Sklenář P, Kucerová A, Macková J, Romoleroux K. 2016. Temperature microclimates of plants in a tropical alpine environment: how much does growth form matter? Arct Antarct Alp Res. 48(1):61–78. doi:10.1657/AAAR0014-084.
- Soukup A, Pecková E, Ježková B, Sklenář P. 2021. Structural adaptations in plants from the humid equatorial Andes indicate a trade-off between hydraulic transport efficiency and safety. Am J Bot. 108(11):2127–2142. doi:10.1002/ajb2.1799.
- Sperry JS, Hacke UG, Pittermann J. 2006. Size and function in conifer tracheids and angiosperm vessels. Am J Bot. 93(10):1490–1500. doi:10.3732/ajb.93.10.1490.
- Sperry JS, Love DM. 2015. What plant hydraulics can tell us about responses to climate-change droughts. New Phytol. 207(1):14–27. doi:10.1111/nph.13354.
- Torres-Ruiz JM, Sperry JS, Fernández JE. 2012. Improving xylem hydraulic conductivity measurements by correcting the error caused by passive water uptake. Physiol Plant. 146(2):129–135. doi:10.1111/j.1399-3054.2012.01619.x.
- Turner NC. 1988. Measurement of plant water status by the pressure chamber technique. Irrig Sci. 9(4):289–308. doi:10.1007/BF00296704.
- Tyree MT, Sperry JS. 1989. Vulnerability of xylem to cavitation and embolism. Annu Rev Plant Phys Mol Bio. 40(1):19–38. doi:10.1146/annurev.pp.40.060189.000315.
- Urrutia R, Vuille M. 2009. Climate change projections for the tropical Andes using a regional climate change model: temperature and precipitation simulations for the 21st century. J Geophys Res. 114(D2):1–15. doi:10.1029/2008JD011021.
- Valencia JB, Mesa J, León JG, Madriñán S, Cortés AJ. 2020. Climate vulnerability assessment of the Espeletia complex on Páramo sky islands in the northern Andes. Front Ecol Evol. 8:309. doi:10.3389/fevo.2020.565708.
- Vincent QV. 2011. Ggbiplot: a ggplot2 based biplot. R package version 0.55. http://github.com/vqv/ggbiplot.
- Williams AP, Allen CD, Macalady AK, Griffin D, Woodhouse CA, Meko DM, Swetnam TW, Rauscher SA, Seager R, Grissino‐mayer HD, et al. 2013. Temperature as a potent driver of regional forest drought stress and tree mortality. Nat Clim Chang. 3(3):292–297. doi:10.1038/nclimate1693.
- Zavala JA, Ravetta DA. 2001. The effect of irrigation regime on biomass and resin production in Grindelia chiloensis. Field Crops Res. 69(3):227–236. doi:10.1016/S0378-4290(00)00146-5.