
Abstract
The paper gives an overview of the development of satellite oceanography over the past five years focusing on the most relevant issues for operational oceanography. Satellites provide key essential variables to constrain ocean models and/or serve downstream applications. New and improved satellite data sets have been developed and have directly improved the quality of operational products. The status of the satellite constellation for the last five years was, however, not optimal. Review of future missions shows clear progress and new research and development missions with a potentially large impact for operational oceanography should be demonstrated. Improvement of data assimilation techniques and developing synergetic use of high resolution satellite observations are important future priorities.
Introduction
Satellite oceanography is a major component of operational oceanography.Footnote1 Satellites provide real time, global, high space and time resolution observation of key ocean variables that are essential to constrain ocean models through data assimilation and/or to serve downstream applications. GODAE and GODAE OceanView (GOV) have maintained strong links with satellite oceanography communities and major progress has been made over the past 10 years to develop and optimise the use of satellite observations for operational oceanography.
An overview of satellite oceanography and recent achievements is given here focusing on the most relevant issues for operational oceanography. This paper provides an overview of satellite oceanography, its role and use for operational oceanography. Main operational oceanography requirements are summarised. Progresses and achievements of satellite oceanography over the past 5 years are described. Main challenges for the next decade are also summarised and a brief review of future missions provided. A summary of achievements and long-term prospects are given in the conclusion.
The role of satellites for operational oceanography and main requirements
Operational oceanography critically depends on the near real time availability of high quality satellite and in-situ data with a sufficiently dense space and time sampling. Observations are required to constrain ocean models through data assimilation and also to validate them. The quantity, quality and availability of data sets directly impact the quality of ocean analyses and forecasts and associated services. Products derived from the data themselves can also be directly used for applications. This requires an adequate and sustained global ocean observing system. Climate and operational oceanography applications share the same backbone system. Operational oceanography has, however, specific requirements for near real time data availability and for higher resolution measurements. Operational oceanography requirements have been detailed in several papers (CitationClark et al. 2009; CitationDrinkwater et al. 2010; CitationLe Traon 2011). Sea level and surface geostrophic currents, sea surface temperature (SST), ocean colour, sea surface salinity (SSS), waves, sea ice and winds form the core operational satellite observations required for global, regional and coastal ocean monitoring and forecasting systems. Long term and continuity of observations are of paramount importance. Specific requirements for operational oceanography are as follows (CitationLe Traon 2011):
In addition to meteorological satellites, a high precision [Advanced Along Track Scanning Radiometer (AATSR) - class] SST satellite mission is needed to give the highest absolute SST accuracy. A microwave mission is also needed to provide an all weather global coverage.
At least three or four altimeters are required to observe the mesoscale circulation. This is also useful for significant wave height measurements. A long-term series of a high accuracy altimeter system (Jason satellites) is needed to serve as a reference for the other missions and for the monitoring of climate signals.
Ocean colour is increasingly important, in particular, in coastal areas. At least two low earth orbit satellites are required for global coverage.
More than one scatterometer is required to globally monitor the near surface wind field at high spatial resolution. Scatterometers are also highly important for sea ice monitoring in combination with passive radiometry.
Multiple SAR satellite observations are required for waves, coastal winds, frontal surface currents, sea-ice characteristics and oil slick monitoring.
To deliver sustained, high resolution observations while meeting operational constraints such as near-real-time data distribution and redundancy in the event of satellite or instrument failure requires international cooperation and the development of virtual constellations as promoted by the Committee on Earth Observation Satellites (CEOS) (CitationBonekamp et al. 2010).
Satellite observations also need to be complemented by in-situ observations. In-situ data are needed to calibrate and validate, to monitor the long term stability of satellite observations and are mandatory to complement satellite observations and to provide measurements of the ocean interior.
Where are we now? Progress over the last five years
Satellite altimetry
Satellite altimetry is one of the most important techniques for operational oceanography. All global operational oceanography systems are now relying on multiple altimeter data sets and are very sensitive to the status of the altimeter constellation. shows an overview of the radar altimetry timeline. The last five years have been an eventful period for satellite altimetry. There were fewer missions in flight (nominally three, and only two during outages), and there has been a transition between two generations of altimeters: Jason-1, ENVISAT and GFO were replaced by Jason-2, CryoSat-2, HY-2A, and SARAL/AltiKa. Furthermore, 2008–2013 was a period of intense cooperation between the space agencies involved in the first altimetry missions (NASA, NOAA, ESA, CNES), Eumetsat, and the space agencies from China (CNSA) and India (ISRO).
Figure 1. Overview of the timeline of altimetry missions.
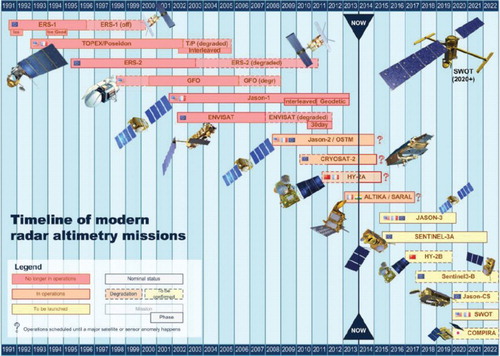
This transition started in 2008 with the loss of GFO, and the launch of Jason-2, which provided a continuity of the climate record for the historical orbit of TOPEX/Poseidon and Jason-1. Jason-2’s commissioning was exceptionally fast and smooth: only one month after launch Jason-2 was operationally used as a temporary backup for Jason-1 which suffered from an onboard anomaly (CitationDibarboure et al. 2011a). After the calibration/validation phase of Jason-2, Jason-1 was moved to an interleaved ground track, providing optimal sampling for operational oceanography. During this phase, Jason-1 continued to provide high-quality data until spring 2013. Similarly, ENVISAT, which had suffered from altimeter degradation, was moved to a new orbit where it continued to serve the operational community for two more years until its loss in spring 2012, after 10 years of operations.
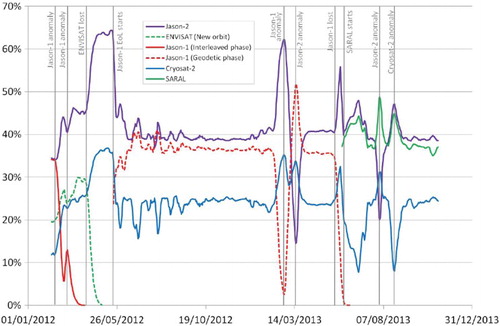
The loss of Jason-1 and ENVISAT, and the delay of SARAL/AltiKa’s launch highlighted how fragile the altimeter constellation remained. This is captured by which shows the relative contribution (in %) of each mission in the multi-altimeter maps from AVISO (this contribution is derived from degrees of freedom of signal analysis) (CitationDibarboure et al. 2011a). With good coverage from three missions, the contribution of each sensor should be 25–40%. Instead, shows a series of peaks associated with each mission’s interruption, loss, or launch. These events forced altimetry and GOV researchers to work hard to ensure that operational models still received the high-quality sea surface topography inputs needed for their assimilation and validation in a timely way. Thanks to the combined efforts of ESA, CNES and NOAA, a new set of CryoSat-2 products was thus released in 2011. CryoSat-2 was then able to mitigate the loss of ENVISAT for operational oceanography (CitationLabroue et al. 2012; CitationDibarboure et al. 2011b) albeit not as a full-fledged oceanography mission. Similarly, the cooperation between CNES and ISRO on SARAL/AltiKa delivered an operational and high-quality product only four months after launch despite the challenging nature of AltiKa’s new Ka-band technology. GOV models were able to assimilate this new altimeter flow extremely quickly as a replacement for Jason-1, lost a few months earlier. Lastly, the combined efforts of NSOAS and CNES have tackled the challenges involved in generating high-accuracy products for China’s first altimetry mission HY-2A. Both agencies are working on an operational production starting in 2014 (CitationPicot et al. 2013).
Figure 2. Relative contribution of each altimeter in the multi-mission AVISO/DUACS maps for 2012-2013 and link with altimeter events. The contribution is derived from the degrees of freedom of signal analysis described by CitationDibarboure et al. (2011a). Unit: %.
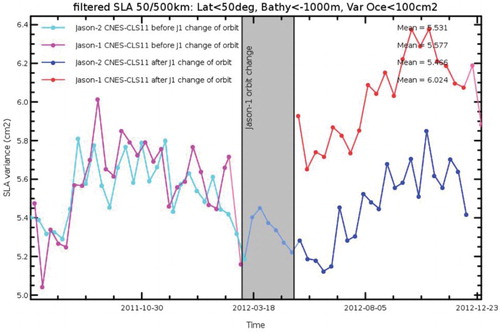
Beyond these changes in the altimeter constellation, several improvements with benefits for operational oceanography and GOV were achieved over the last five years. Firstly, the accuracy of the orbit determination from Jason-2 reached new levels (3 cm RMS for the real time on-board orbit and 1 cm for the near real time ground-based orbit). Secondly, Delay-Doppler (or SARM) altimetry is now being routinely and globally processed by CNES using raw data (Level 1) from ESA’s CryoSat-2. The benefits of SARM technology range from higher along-track resolution and higher precision (CitationBoy et al. 2013) to higher resilience to artefacts which had limited the use of altimetry for scales smaller than 100 km (CitationDibarboure et al. 2014). ESA has also used CryoSat-2 to generate coastal SARM samples using Sentinel-3’s algorithms. Still flagged as research-grade, all these demonstration SARM products provide a smooth way for GOV models to ramp-up towards the global SARM coverage of the upcoming Sentinel-3 and Jason-CS. Thirdly, specific algorithms for coastal altimetry (CitationVignudelli et al. 2011) were also developed. Last but not least, the operational use of altimeters on uncharted ground tracks (HY-2A) and geodetic orbits (Cryosat-2, Jason-1 ‘Extension of Life’ phase) was made possible by the accuracy breakthrough achieved on recent mean sea surfaces (MSS) (CitationAndersen, 2010; CitationSchaeffer et al. 2012). Despite this outstanding improvement, geodetic missions are not yet on par with repeat orbits: shows that when Jason-1 was put on a geodetic orbit the SLA variance increased by approximately 2.5 cm RMS.
Figure 3. Variance of the pass-band filtered (50-500 km) sea level anomaly from Jason1 and Jason-2 before and after the orbit change of Jason-1 (also known as Extension of Life or geodetic phase). There is a variance increase of the order of 2.5 cm RMS when a gridded mean sea surface is used for the geodetic phase (as opposed to mean tracks for exact repeat orbits).
Gravimetry
The accurate knowledge of the marine geoid is a fundamental element for the full exploitation of altimetry for oceanographic applications, and in particular for its assimilation into operational ocean forecasting systems. Sea Surface Height (SSH) measured by an altimeter is the sea level above the ellipsoid, which differs from the Absolute Dynamic Topography (ADT) by the value of the geoid height. The ADT is usually obtained by estimating a Mean Dynamic Topography (MDT) and adding it to the altimetric sea level anomalies. The MDT is obtained, at spatial scales where the geoid is known with sufficient accuracy, as the difference between an altimeter Mean Sea Surface Height (MSSH) and a geoid model.
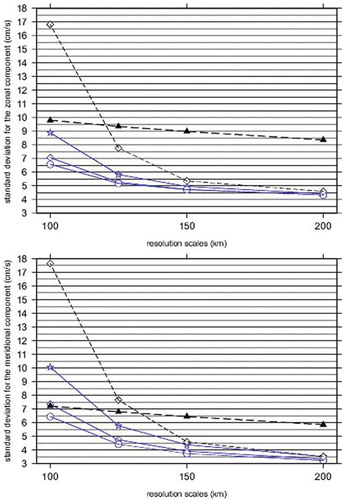
The last five years have been definitively marked by a major step forward in our knowledge of the geoid thanks to the exploitation of data from GRACE and GOCE space gravity missions. GRACE was launched on March 17, 2002. New gravity fields have been made available every 30 days from the beginning of the mission, providing new insights on climatically important processes such as mass exchange between ice sheets and the oceans, mass redistribution within the oceans, and large scale variability in precipitation and water availability. In 2010, recognizing the importance of a long term dataset and in order to bridge the gap for a planned follow-on mission (due for launch in August 2017), the extension of the GRACE mission through the end of its own orbit life was decided. The most recent GRACE only geoid model (CitationTapley et al. 2013) was estimated using almost 10 years of GRACE data, spanning from March 2003 to May 2013. This provides highly valuable information for the estimation of the MDT and the associated mean geostrophic currents at spatial scales down to 200 km (). To resolve the shortest scales of the geoid, and to complement the GRACE mission for the calculation of the static component of the geoid, the GOCE satellite was launched on March 17, 2009 on a much lower orbit. In 2010, the first geoid models based on only two months of GOCE data were capable of providing estimates of the geoid at scales of around 150 km with an unprecedented accuracy. Since then, this accuracy has been continuously improved (CitationMulet et al. 2012) (). The last release, issued in April 2013, was based on three years of reprocessed GOCE data (CitationBruinsma et al. 2013). The next release, to come mid-2014, will benefit from the data acquired during the last months of the GOCE mission.
Figure 4. (from CitationMulet et al. 2012): Standard deviation (cm/s) over the global ocean of the differences between zonal and meridonal mean currents from in-situ data and from three MDTs derived from successive releases of GOCE geoids: EGM_TIM_R1 (blue stars), EGM_TIM_R2 (blue diamonds) and EGM_TIM_R3 (blue circles). Black diamonds show the results from the ITG-GRACE-2010s geoid. Black triangles show the standard deviation of the in-situ currents.
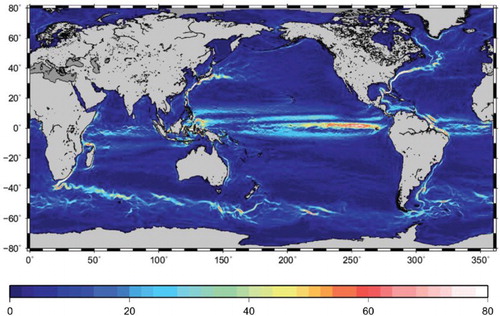
MDTs based on this new generation of GRACE/GOCE geoid models are expected to strongly improve the performances of the GOV systems assimilating altimetry (CitationHaines et al. 2011; CitationBecker et al. 2014). In the past five years, the resolution of the ocean numerical models assimilating altimetry have also increased calling for estimates of the MDTs at scales even shorter than 100 km. This may be done through the synergetic use of space gravity data, altimetry and in-situ measurements such as Argo hydrographic profiles and drifting buoys (CitationMaximenko et al. 2009; CitationRio et al. 2011). shows thus the intensity of the mean geostrophic currents derived from the combination of GRACE, GOCE, altimetry and in-situ measurements (CitationRio et al. 2013).
Figure 5. Mean speed (units cm/s) of the geostrophic surface currents for the period 1993-2012 obtained from the combination of altimetry, gravity, hydrographic measurements and drifter data.
Sea surface temperature
The provision of sea surface temperature (SST) data for operational oceanography by the Group for High Resolution Temperature (GHRSST) (CitationDonlon et al. 2007) has grown to a mature sustainable essential service. The GHRSST partners offer a suite of tailored global high-resolution SST products, in near-real-time, on a daily basis, to support operational forecast systems and the broader scientific community. Since 2009 the key developments of GHRSST in support of GOV include a significant growth of services and data streams within the international Regional/Global Task Sharing (R/GTS) framework, maintenance of a community consensus GHRSST Data Processing Specification (GDS) V2.0 that provides all SST data in a common format with uncertainty estimates and auxiliary data, new, world leading efforts creating long-term Climate Data Records to support reanalysis and hind-casts, a new SST Climate Data Assessment Framework (CDAF), managing loss of key data streams and seamless integration of new satellite sensors.
Passive microwave SST sensors
TRMM Microwave Imager (TMI) (10 GHz channel) remains in an operational mode providing SSTs between 40°N/S. The new Global Precipitation Mission (GPM) Microwave Imager (GMI) was launched as a successor to TMI in February 2014 and is now being commissioned. GMI (CitationBidwell et al. 2005) uses a larger 1.2 m antenna compared to TMI resulting in better spatial resolution. GMI operates in a ~65° inclination non-sun-synchronous orbit providing better coverage up to 65° N/S compared to TMI. The AMSR-E instrument carried aboard the Aqua satellite has provided near daily passive microwave global SST coverage since May 2001 using channels at 6.9 GHz. The instrument ceased normal operations in October 2011 but has been in a slow-rotation mode since December 2012 providing meaningful but very coarse sampling. This allows cross comparison between AMSR-E and GCOM-W AMSR/2 that was successfully launched in May 2012 as a successor. AMSR/2 has a larger antenna than AMSR-E providing improved spatial resolution and an additional channel at 7.3 GHz to mitigate the impact of Radio Frequency Interference (RFI). AMSR/2 is now providing operational passive microwave SSTs with global coverage. WindSat is a multi-channel polarimetric passive microwave radiometer launched on January 6, 2003 aboard the US Coriolis satellite. Windsat measures SST in both forward and aft scans using primary channels at 6.8 and 10.7 GHz. Due to the polarimetric capability provided by Windsat, ocean surface vector winds can be retrieved which helps in the retrieval of SST.
Thermal Infrared sensors: geostationary and polar orbiting
The current constellation of SST geostationary imagers provides global coverage measurements every 3 hours (and in many cases at higher temporal resolution) with future capability in place for the coming 5 years. The challenge is to improve instrument, inter- and cross-calibration of imagers across different missions in support of diurnal SST variability sampling. The next generation of geostationary imagers will provide data at 10-minute intervals (e.g. MTSAT-3 by summer in 2014) which will be useful for diurnal sampling in cloud free conditions. NOAA/NESDIS has implemented a fully physical SST algorithm for GOES-E/W, MTSAT-2 and MSG-3 operational geostationary SST products. Reprocessing of these geostationary SSTs and an associated 5 km blended SST analysis (using polar and geo products from numerous agencies) from 2004 to the present has been completed. MODIS instruments on both Terra and Aqua satellites continue to perform well after 14 and 12 years in orbit respectively. These instruments provide global coverage SSTs at 1 km every two days. The last two NOAA AVHRR/3 instruments on board the NOAA satellite series are now in orbit and are fully contributing to the operational and research community requirements. The EUMETSAT MetOp-A AVHRR/3 was declared fully operational in mid-May 2007. MetOp-B AVHRR/3 replaced MetOp-A in April 2013. The AVHRR Pathfinder SST time series provides the longest consistent time series of global SSTs starting from 1981–2012. Further work is required to recover and process early AVHRR satellite data from late 1978. The first VIIRS instrument was launched on Suomi-NPP on 28 October 2011 (designed to replace the operational AVHRR instruments) and the infrared data stream began in early 2012. VIIRS IR bands are very clean and initial assessments indicate SSTs of very good quality and accuracy.
On 8th April 2012, the ENVISAT AATSR ceased operation. AATSR was the only dual-view sensor available to the SST constellation providing significantly improved atmospheric correction of SST data allowing data to be used in a reference sensor capacity. The loss of AATSR after 10 years of operations prior to the launch of Sentinel-3 leaves a significant gap of ~3 years without a dual-view reference sensor. Mitigating activities include the use of MetOp-A AVHRR and infra-red atmospheric sounding interferometer (IASI) to ‘bridge and fill the gap’ that were flying at the same time as AATSR and are expected to be flying at the time of Sentinel-3 launch. High-quality SST from the IASI instrument (CitationO’Carroll et al. 2012) have been available within the GHRSST framework since March 2011 at a spatial resolution of ~12 km every 50 km over a ~2200 km swath. Considerable work has taken place to understand and develop inter-sensor bias adjustment methods at global and regional scales (CitationLe Borgne et al. 2012; CitationHøyer et al. 2014)
Ocean colour radiometry
Ocean Colour Radiometry (OCR) sensors deliver data that can be used to routinely generate a variety of relatively mature biological, biogeochemical and ecological parameters (e.g. chlorophyll-a concentration, diffuse attenuation coefficient, primary productivity and total suspended matter). OCR data are now widely used by operational centers to validate marine ecosystem models. Assimilation of OCR data in models (CitationGregg, 2008) is still an area of active research but several GOV centers already included preoperational OCR colour data assimilation (this issue). NRT chlorophyll data have thus been assimilated in the MyOcean Mediterranean biogeochemical (CitationLazzari et al. 2010) and Black Sea models. There is also an expanding operational focus on ecological forecasting, which will significantly rely on OCR data. For example, NOAA’s National Ocean Service (NOS) utilizes OCR data from the NOAA CoastWatch Program as part of its Harmful Algal Bloom Operational Forecast System (HAB-OFS).
Although challenging, use of OCR data for coastal monitoring is becoming increasingly important. Over the past five years, algorithm performances have continued to improve and available in situ data have been used to develop and validate robust and regionally-tuned coastal OCR data products, including chlorophyll-a, total suspended matter, primary productivity and dissolved and particulate organic carbon concentrations (CitationGohin 2011; CitationFalcini et al. 2012; CitationOndrusek et al. 2012). Proxy algorithms for coastal ocean salinity (CitationGeiger et al. 2013) based on ocean colour signatures associated with terrestrial runoff have been developed. New products are likewise being developed and explored, including discrimination of phytoplankton functional types (PFTs).
All these operational applications strongly depend on the sustained availability of satellite OCR observations. The last five years have been somewhat of a challenging period for users of OCR data. The highly successful SeaWiFS mission ceased operations in 2010, and the ENVISAT platform, with the groundbreaking MERIS sensor that provided 300 m full resolution data and 15 spectral bands, ceased operations in 2012. At that point the only widely available global OCR data were from the MODIS sensor on Terra, which has significant calibration issues, and the one on Aqua, which is well beyond design life and showing signs of degradation but whose data is still of high quality given ongoing efforts by NASA. As a result, new data sources are crucial for sustained provision of OCR data. The Suomi NPP mission launched in 2011 carries the VIIRS sensor, providing ocean colour as well as SST data on an operational basis from NOAA. VIIRS can provide high-quality global ocean colour products although some calibration issues were observed starting in 2013; these appear to have been addressed, however. Aside from these polar OCR data sets, the Korean GOCI sensor has demonstrated the tremendous utility of geostationary ocean colour imagers to observe re-suspension of sediments and other coastal phenomena on timescales of the order a few hours (CitationChoi et al. 2012) associated with tidal and other high-frequency dynamics, and likewise helps address the significant challenge of near-shore cloud cover.
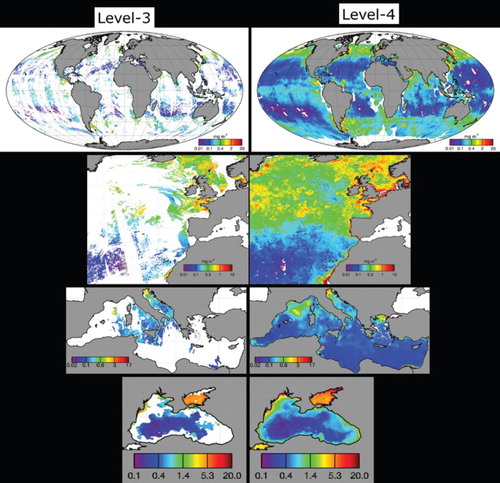
Operational oceanography also requires developing dedicated OCR data assembly infrastructures. As an illustration, an Ocean Colour Thematic Assembling Centre has been developed in Europe over the past five years, as a component of the MyOcean system. Since 2010 this centre has been producing and delivering OCR products for the global ocean and European Regional Seas (). Global daily products are generated every day by merging available ocean colour L2 products (CitationMaritorena et al. 2010). Regional datasets are produced using L1 to L3 tailored processing chains (CitationVolpe et al. 2012). This has led to improved accuracy OCR products in regions such as the Mediterranean and Black Sea, where large biases affect global products (CitationVolpe et al. 2007). The regional processing also enabled improved chlorophyll estimates over the shelf area of the European regional seas.
Figure 6. NRT Global, North West Atlantic, Mediterranean, Black Sea regional data distributed by MyOcean Ocean Colour Thematic Assembly Center (OC TAC). L3 daily products (left panels) and corresponding L4 products (right panels). Units are mg/m3.
It is also important to emphasize that an operational service, in addition to delivering the best possible quality near real time data, also needs to provide delayed delivery of a consistent time series of the highest possible quality. To respond to the need for climate-quality satellite time series data, NASA provides regular reprocessing of data from numerous ocean colour sensors, and a new programme (Climate Change Initiative) has been set up by ESA. NOAA and Eumetsat also plan to routinely reprocess the operational VIIRS and OLCI ocean colour data to support users who require consistent, high quality time series data for fisheries, climate and other research and applications.
Sea ice
Low resolution passive microwave sensors have been providing essential sea ice extent and concentration data from 1979 to present. Given the importance of these datasets (e.g. input to seasonal forecasting, reference for climate modelling, constraining coupled ocean and ice models) efforts have been spent on quantifying the accuracy of the data, in particular during summer, and to consolidate sea ice retrieval algorithms. Nevertheless, ice extent gives only a part of the full picture which should include ice thickness to enable estimations of the total sea ice volume. Great expectations were given to the CryoSat-2 launched in April 2010 with an altimeter designed for sea ice freeboard measurements. One limitation of this technique is the uncertainty due to the total sea ice thickness estimation from the freeboard measurements. Recent studies taking into account data from CryoSat-2 confirm a negative trend in the Arctic sea ice volume (CitationLaxon et al. 2013). Thickness of thin sea ice for the Arctic freeze-up period can also be derived from SMOS (CitationKaleschke et al. 2012), which makes these data complementary to Cryosat thick ice estimates. Opportunities and challenges still lie in ice thickness analysis combining new satellite data (like SMOS and CryoSat) with other information (e.g. coupled ocean/ice models) to derive more accurate ice volume estimates.
In the last five years, attention has also been given to sea ice displacement estimates, thanks to the use of low resolution scatterometers and radiometers. Such data have been produced (e.g. CitationGirard-Ardhuin & Ezraty 2012) since the 1990's and are widely used for models and contribute to the description of the sea ice and its long term monitoring. Scatterometers enable detection and tracking of multi-year sea ice during the winter: the ASCAT-A recalibrated data (2007–2014, available in 2014) will contribute to the long term first-year/multi-year sea ice extent time series available since the 1990's with ERS-1&2 scatterometers. The continuity of the C-band data time series is ensured with ASCAT-B (launched) and -C (to be launched) until 2020.
High resolution sea ice analysis relies on SAR data. Automatic sea ice classification has been taken forward by utilization of dual polarization SAR data from ENVISAT and Radarsat (CitationZakhvatkina et al. 2013). Repeat high resolution SAR data also allow estimation of the sea ice rheology (mechanical behaviour) and deformation field displacements (CitationKwok et al. 2003). The amount of SAR data available for near real-time sea ice detection should improve significantly following the successful launch of the Sentinel 1-A satellite on April 3rd, 2014.
Surface winds from scatterometer and radiometer
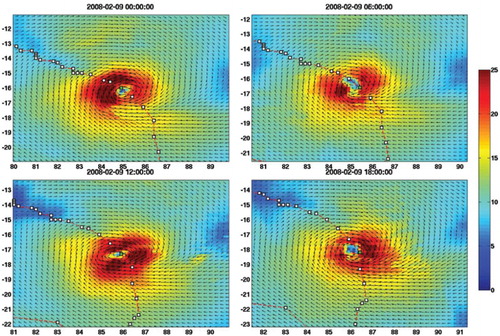
Scatterometers on board polar orbiting satellites are the principal source of surface wind speed and direction data over the global ocean. Over the past five years, the following scatterometers have been operating: ASCAT-A (2006-present) and ASCAT-B (2013-present) onboard METOP satellites, OSCAT onboard Oceansat-2 satellite (2009–2014), and HY-2A scatterometer (2011-present). Thanks to the overlapping periods between missions, scatterometer winds have been continuously available over global ocean and span more than two decades (1992 – present). Continuous efforts are required to enhance the accuracy of surface wind speeds and directions, the consistency of the retrievals from various scatterometers onboard different satellites and their spatial and temporal resolutions (CitationBourassa et al. 2010). Recent studies (CitationBentamy et al. 2012a; CitationBentamy et al. 2013; CitationGrodsky et al. 2012) assessed the differences between ERS-2, QuikSCAT and ASCAT winds as a function of instrumental characteristics as well as of geophysical parameters. New methods are set up to reduce departures between the scatterometer retrievals. The former will be extended to ERS-1 and to OSCAT and HY-2 data. To meet the requirement of enhanced spatial and temporal resolutions, several studies have considered the problem of producing synoptic wind maps from scatterometer-derived winds and models using geostatistical or variational methods (e.g. CitationBentamy et al. 2012b). shows examples of 6-hourly wind fields with a spatial resolution of 0.125 km in longitude and latitude.
Figure 7. Example of blended wind fields estimated from corrected QuikSCAT and ASCAT wind observations for the four epochs (00h:00, 06h:00, 12h:00, 18h:00 UTC) of February, 2nd 2008 during tropical cyclone Hondo. Circles indicate cyclone path. Units are m/s.
Sea surface salinity
The scientific relevance for measuring Sea Surface Salinity (SSS) is more and more recognised in the ocean community. SSS plays an important role in the dynamics of the thermohaline overturning circulation, interannual large-scale variability like ENSO, and is the key tracer for the marine branch of the global hydrologic cycle. SSS is also required to constrain ocean models and GODAE at its start formulated specific requirements that guided the development of satellite missions. Two satellite missions: the ESA Soil Moisture and Ocean Salinity (SMOS) and the NASA-CONAE Aquarius/ SAC-D have been currently in orbit since 3–4 years and operating with the aim of measuring salinity from space for the first time (CitationLagerloef et al. 2012; CitationFont et al. 2013).
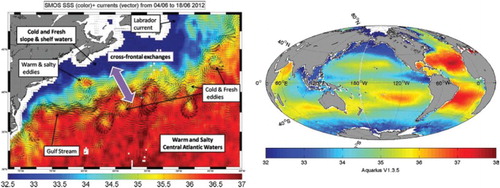
Both sensors have differing technology approaches but are operating in the same spectral band (L-Band). They provide global SSS at spatial resolution varying from 50 km (SMOS) to 100 km (Aquarius) on weekly-to-monthly time scales (). In-situ validation of the satellite SSS against drifting buoys data shows that after four years in orbit, the general accuracy currently obtained from SMOS SSS retrievals over the ocean is on the order of 0.3 psu and 0.5 psu for a 10–30 day average for open ocean area of 50 x 50 km2 in respectively the tropics and the mid to high latitudes (CitationReul et al. 2014) and when one considers data acquired relatively far from land. Strong efforts are carried out to improve the data quality but also to demonstrate the scientific interest of SSS satellite products. Several scientific studies have already revealed the strong potential of these new data sets. Efforts to demonstrate the impact of satellite SSS data assimilation for ocean analysis and forecasting are an on-going activity. Measurement errors remain an issue but more work should be carried out in the coming years thanks to improved data sets and products.
Figure 8. Sea Surface Salinity from SMOS data in the Gulf Stream Region averaged over a 10 day period superimposed with coincident currents from altimetry (left). Monthly global averaged SSS from Aquarius sensor. Units are psu.
Waves
Knowledge of ocean waves and wave climate are needed for various applications within offshore operations/engineering, fisheries, ship routing and coastal/harbour management. Over the past five years, there have been significant advances to develop and make accessible harmonized set of altimeter and SAR wave products. These have been invaluable for numerical wave modeling and for applications. In particular, multiple altimeter missions have continued to provide precise significant wave height observations with a global coverage that are essential to calibrate and validate numerical wave models and improve their forecasting skills through data assimilation (CitationLefèvre et al. 2006). The sequence of ESA Synthetic Aperture Radar (SAR) instruments continuously operated on the ERS-1, ERS-2 and ENVISAT satellites during 1991–2012 has also had a measurable impact on ocean wave observation and modeling, especially concerning adequate determination of the swell attenuation over large distances (CitationArdhuin et al. 2009). A consensus has been reached regarding the major understanding of the peculiar SAR imaging mechanism of ocean waves and swells. The non-linearity of this imaging mechanism is still subject to research to recover more precise estimates of the surface wave amplitudes, especially for short wavelength wave systems (CitationCollard et al. 2013). Breakthrough regarding this challenging issue is expected to strengthen the investigation and application of SAR ocean wave imaging with respect to extreme sea states in intense storms, crossing waves, identification of ‘freak’ events and improved representation of wave-current, as well as detailed interactions for air-sea flux estimations.
Challenges for the next decade and forthcoming missions
Main challenges
Future satellite oceanography observing challenges can be organized into three types: (1) continuity and reliability, (2) resolution and coverage and (3) knowledge. These challenges are not necessarily mutually exclusive of one another, but serve to highlight the merits and importance of planned or proposed ocean satellite programs listed in this paper with respect to operational oceanography needs.
Continuity and reliability challenge
The benefits of operational oceanography services can only be realized if our observation capabilities are sustained and non-degrading. Likewise, climate change research requires long term and uninterrupted observations. This requires long-term programmatic coordination and commitments and capacity for operational activities as well as faster transition of experimental sensors to operational use. Operational agencies also need to work with the R&D agencies for measurements of interest on a continuing basis.
Resolution and coverage challenge
Many key ocean phenomena are still under sampled and require (much) higher space and time resolution. Model resolutions are regularly increasing but our observation capabilities are not. Coastal regions which are of paramount importance are characterized by small scales. There is also growing evidence that we need to better observe the submesoscale ocean dynamics. This resolution and coverage challenge is partly addressed through the development of virtual constellations but also requires developing new and improved observing capabilities.
Knowledge challenge
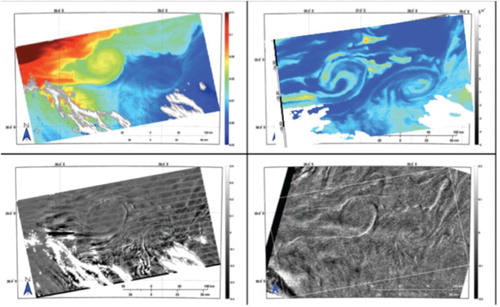
A knowledge challenge is required to improve current observing capabilities (e.g. platforms, sensors, and algorithms) and develop entirely new satellite observing capabilities (e.g. surface currents). Fusing of different types of observations to extract better information is another approach (CitationChapron et al. 2010). A new framework for combining remote sensing observations (see ) is required, in particular, to yield a much better understanding and monitoring of the dynamics in the upper ocean (CitationKudryavtsev et al. 2012).
Figure 9. Surface expression of mushroom like eddy structure and filaments with a scale of 5-50 km. (Upper left) MODIS SST map, (lower left) the mean square slope derived from the MODIS reflected shortwave signal, (upper right) MODIS derived chlorophyll-a map, and (lower right) the contemporaneous Envisat ASAR backscatter image (from CitationKudryavtsev et al. 2012).
Review of forthcoming missions
A review of the most relevant future satellite missions for operational oceanography is given here after. A complete overview of future satellite ocean mission details is maintained within the CEOS Earth Observation handbook [http://www.eohandbook.com/] or WMO Observing Systems Capability Analysis and Review (OSCAR) tool [http://www.wmo-sat.info/oscar/].
Jason-3 and Jason continuity of service
The essential next step to continue the long time series of reference measurements with T/P and the Jason-1/2 series is to launch Jason-3 (Mid 2015). Beyond Jason-3, the Jason Continuity of Service (Jason-CS/Sentinel-6) series is proposed to ensure the continuity of the reference measurements into the 2020’s and 2030’s. Jason-CS will provide enhancements with a high resolution altimetry based on a SAR mode capability that is combined with the Jason Low Resolution Mode in a non-exclusive manner (CitationCullen & Francis 2013). In this way full backward compatibility with its predecessors will be established while also meeting the resolution and coverage requirements for the intermediate future.
Sentinel-3
The Sentinel-3 (CitationDonlon et al. 2012) mission is sometimes called the ‘ocean sentinel’, because it brings together ocean colour radiometry, reference Sea Surface Temperature retrievals and SAR Mode altimetry. It foresees a series of satellites, each having 7-year lifetime, over a 20-year period starting with the launch of Sentinel-3A in late 2015 and of Sentinel-3B in late 2016. During full operations two identical satellites will be maintained in the same orbit with a phase delay of 180°. Sentinel-3A and -3B will board an Ocean and Land Colour Imager (OLCI) delivering multi-channel wideswath optical measurements of the ocean surface, a dual view conical imaging radiometer called the Sea and Land Surface Temperature Radiometer (SLSTR) and a dual frequency, SAR Altimeter (SRAL).
HY-2 series
China has formulated and implemented several medium and long-term national plans on the development of HY satellites. HY-2A satellite has been operational from October 2011. It carries an altimeter, a microwave radiometer and a scatterometer. HY-2B is just approved and will be launched at the end of 2016 and HY-2C should follow in 2019. Long term plans for an altimeter constellation (called HD satellite net) are also discussed. HD-1A/HD-1B will be flown simultaneously and should be launched before 2020.
Sentinel-1
Sentinel-1 (CitationTorres et al. 2012) is a C-band Synthetic Aperture Radar (SAR) imaging mission. It carries a 12 m-long radar antenna which can operate in four distinct modes (20 by 20 km wave mode, > 80 km strip map mode, > 250 km wide swath mode, > 410 km extra-wide-swath mode) and in single and dual polarization. The Sentinel-1 mission is designed as an operational two-satellite constellation. Sentinel-1A has been launched on 3rd April 2014. Sentinel-1B is expected to be launched end 2015.
SWOT
The NASA/CNES/CSA Surface Water Ocean Topography (SWOT) mission is a wide-swath altimetry mission using Ka band SAR-interferometric technology, aiming to achieve an order of magnitude improvement in both spatial resolution and sea surface height precision. SWOT should be launched in 2020. SWOT aims to provide global maps of sea surface topography (up to 78°N and S) on a 1 km grid with full coverage every 21 days. SWOT will provide an effective resolution of 15 km for ocean dynamics, compared to the 150 km resolution available today from gridded along-track altimeter data. Although SWOT is a research-oriented mission, its new approach to altimetry has the potential to provide valuable fine-scale datasets for the next generation of ocean models and marine applications. JAXA is also planning a new X-band interferometric SAR high-resolution altimetry mission called COMPIRA.
CFOSAT
The Surface Waves Investigation and Monitoring (SWIM) on the Chinese-French Oceanography Satellite (CFOSAT) is a great promise to complement other observations (in-situ, satellite altimeters and Sentinel-1) for advanced modelling of surface waves (CitationHauser et al. 2010). In particular, SWIM shall provide improved directional surface wave spectra over scales of about 70 x 70 km, combined with scatterometer estimates, to further help study air-sea momentum fluxes. CFOSAT should be launched in 2018.
Ocean measurements from meteorological programs
Mandatory satellite programs for global Numerical Weather Prediction also ensure the continuity of several vital ocean observations. The geostationary Meteosat Third Generation satellites (first satellite should be ready for launch from 2018) will fly four Flexible Combined Imagers continuing SEVIRI observations on Meteosat Second Generation. METimage as part of the EUMETSAT Polar System Second Generation (EPS-SG) program (post 2020) is a multi-spectral imaging radiometer, successor of the AVHRR on the EPS/METOP satellite series (CitationPhillips et al. 2011). EPS-SG also includes the scatterometer SCA, the follow-on of the ASCAT on EPS/METOP (CitationLin et al. 2012). The Visible Infrared Imaging Radiometer Suite (VIIRS) onboard the Suomi National Polarorbiting Partnership (Suomi NPP) platform was launched in October 2011, extending SST and ocean colour measurements initiated with AVHRR and MODIS. The VIIRS sensor will be carried on the operational Joint Polar Satellite System platforms, JPSS-1 and JPSS-2. JPSS-1 is presently planned to be launched in 2017. These will be complemented by NOAA’s next generation geostationary platforms, with the GOES series continuing with the launch of GOES-R in 2016.
Microwave SST
Passive microwave SSTs are used by a variety of operational oceanography communities. The major challenge for the future is to ensure operational continuity of passive microwave SSTs. JAXA is discussing a follow on mission to GCOM-W AMSR/2. In the long term it is a priority to establish a redundant capability passive microwave SST’s. ESA has also pre-phase-A studies for a passive microwave multifrequency mission called Microwat (CitationPrigent et al. 2013). Significant enhancements in antenna technology are required to enlarge the real aperture in order to address a primary user requirement for improved spatial resolution (5–15 km).
Sea surface salinity
Several mission concepts with L-band passive sensors are currently studied from the European side as a follow on of SMOS: SMOSOps and SUPER MIRAS (ESA led) and SMOS NEXT (CNES led) which is targeting high-resolution (1–10 km) SSS mapping. Note that, early 2015, the NASA Soil Moisture Active-Passive mission SMAP will also provide global measurements of L-band brightness temperatures with a resolution on the order of 40 km. While focused on land science applications, SMAP will bring very interesting data to complement SMOS and Aquarius observations over the oceans.
Geostationary ocean colour
A key example for providing an enhanced temporal coverage of ocean colour products is the South Korean Geostationary Ocean Colour Instrument (GOCI) (CitationRyu & Ishizaka 2012). The follow-on of GOCI (GOCI-II) (CitationRyu, 2013) is planned for 2018–2028. Several other geostationary missions have been proposed (Geo-Cape, Geo-OCAPI and Geo-Oculus missions) with some in early stages of development. An overview on geostationary Ocean Colour Radiometry is provided in IOCCG report 12 (CitationIOCCG 2012).
Future mission concepts
Ocean surface current mission
Extensive work has been performed in the area of ocean current mapping using radar and very encouraging results have been achieved using both Doppler anomaly and along-track interferometry derived from SAR instruments (CitationChapron et al. 2005; CitationJohannessen 2008). To produce a 2D map of ocean surface currents, azimuthal diversity is necessary. To this end, instruments can be designed to cover swaths illuminated by both forward and aft squinted antennas (CitationBuck et al. 2011) to allow analysis in nearly orthogonal directions.
Ocean biology and biogeochemistry and hyperspectral measurements
NASA’s PACE (Pre-Aerosol, Clouds, and ocean Ecosystem) mission will make global ocean colour measurements and provide extended data records on ocean ecology and global biogeochemistry along with polarimetry measurements to provide extended data records on clouds and aerosols. The availability of hyperspectral measurements will help resolving optically active water constituents, and together with the development of new methods and approaches, should also allow help reduce the uncertainty of the ocean colour estimates in coastal regions and help facilitate usage of OCR data for coastal analysis and (ecological) forecasting.
Conclusions: summary of achievements and long-term prospects
There have been important achievements of the past five years to ensure real time availability of high quality satellite data and to develop the use of satellite observations for operational oceanography. Multiple mission high resolution altimeter products are now readily available. There have been many improvements (timeliness, new products) and major efforts were undertaken to include new missions in the operational data stream in a very limited time. New MDTs from GRACE and GOCE have a major impact on data assimilation systems and further improvements are expected. Thanks to GHRSST, major improvements in SST data processing issues and use of different types of sensors have occurred. The use of ocean colour data in operational oceanography has become a reality and there has been a continuous progress in data access, data processing and data assembly systems. SMOS and Aquarius have demonstrated the feasibility and utility of measuring SSS from space. The ocean community and GOV now need to fully invest in the critical assessment and application of the data.
Improvements of models and data assimilation techniques have resulted in a better use of our satellite observing capabilities. We are not fully exploiting, however, the information content of satellite observations. Use of new theoretical frameworks to better exploit high resolution information from satellite data is required and further improvements in data assimilation schemes are needed. The potential of ocean colour data to support ecological and biogeochemical model development and operational implementation is considerable but development lags behind other remote sensing techniques. This is a challenging and high priority research topic for operational oceanography. The development of OSE/OSSE activities (this issue) as a joint effort between satellite and modeling and data assimilation teams is also required.
In-situ data are mandatory to calibrate and validate and to complement satellite observations. Although the consolidation of the Argo in-situ observing system and its integration with satellite altimetry and operational oceanography (CitationLe Traon 2013) represents outstanding progress, the evolution of the in-situ observing system remains a strong concern.
Finally it is important to remind that the status of satellite observing system for our key core ocean variables was not optimal over the past five years. There were significant risks of degraded service for operational oceanography. Although these were minimized through a faster operational use of new satellite missions, ensuring a long term optimized high resolution satellite observing system remains a challenge. Review of future missions for the next decade shows clear progress. The satellite constellation should be improved and new missions with a potentially large impact for operational oceanography should be demonstrated. It will be essential, however, to consolidate international collaboration to optimize and make the best use of satellite observations from a growing number of space agencies. The role of international cooperation (e.g. GOOS, CEOS, and WMO) and well organized scientific communities OSTST (altimetry), GHRSST (SST), IOCCG (Ocean Colour), IOVWST (Winds) is essential. The space agencies should, in particular, carefully assess orbits and phasing versus the user needs and optimize the synergy between different missions and sensors. More efforts will be also required to ensure homogenized and inter-calibrated data sets from multiple missions for all essential ocean variables.
Notes
1. Following EuroGOOS, operational oceanography can be defined as the activity of systematic and long-term routine measurements of the seas, oceans and atmosphere, and their rapid interpretation and dissemination.
Related Research Data
References
- Andersen OB. 2010. The DTU10 Gravity field and Mean Sea SurfaceSecond international symposium of the gravity field of the Earth (IGFS2), Fairbanks, Alaska.
- Ardhuin F, Chapron B, Collard F. 2009. Observation of swell dissipation across oceans. Geophys Res Lett. 36:L06607, doi:10.1029/2008GL037030.
- Becker S, Brockmann JM, Schuh WD. 2014. Mean dynamic topography estimates purely based on GOCE gravity field models and altimetry. Geophys Res Lett. 41:2063–2069, doi:10.1002/2014GL059510.
- Bentamy A, Grodsky SA, Carton JA, Croizé-Fillon D, Chapron B. 2012a. Matching ASCAT and QuikSCAT winds. J Geophys Res. 117: C02011, doi:10.1029/2011JC007479.
- Bentamy A, Croize-Fillon D. 2012b. Gridded surface wind fields from Metop/ASCAT measurements. International J Remote Sens. 33(6): 1729–1754. Publisher’s official version http://dx.doi.org/10.1080/01431161.2011.600348. doi: 10.1080/01431161.2011.600348
- Bentamy A, Grodsky SA, Chapron B, Carton JA. 2013. Compatibility of C- and Ku-band scatterometer winds: ERS-2 and QuikSCAT. J. Mar. Syst., 117–11872–80.
- Bidwell SW, Flaming GM, Durning JF, Smith EA. 2005. The Global Precipitation Measurement (GPM) Microwave Imager (GMI) instrument: role, performance, and status. Geoscience and Remote Sensing Symposium, 2005. IGARSS ‘05. Proceedings, doi:10.1109/IGARSS.2005.1526109.
- Bonekamp H, co-authors. 2010. Transitions Towards Operational Space Based Ocean Observations: From Single Research Missions into Series and Constellations in Proceedings of OceanObs’09: Sustained Ocean Observations and Information for Society (Vol. 1), Venice, Italy, 21–25 September 2009, Hall J, Harrison DE, Stammer D. Eds., ESA Publication WPP-306, doi:10.5270/OceanObs09.pp.06.
- Bourassa M, co-authors. 2010. Remotely sensed winds and wind stresses for marine forecasting and ocean modelling. Proceedings of the OceanObs 09: Sustained Ocean Observations and Information for Society Conference, Venice, Italy, IOC/UNESCO and ESA, Vol. 2.
- Boy F, Picot N, Moreau T, Labroue S. 2013. CryoSat-2 SAR Mode Over Ocean: One Year of Data Quality Assessment. Presented at the 2013 Ocean Surface Topography Science Team meeting.
- Bruinsma SL, Förste C, Abrikosov O, Marty JC, Rio MH, Mulet S, Bonvalot S. 2013. The new ESA satellite-only gravity field model via the direct approach. Geophys Res Lett. 40, doi:10.1002/grl.50716.
- Buck C, Aguirre M, Donlon C, Petrolati D, D’Addio S. 2011. Steps towards the preparation of a Wavemill mission. Geoscience and Remote Sensing Symposium (IGARSS), IEEE International. 3959–3962, doi:10.1109/IGARSS.2011.6050098.
- Chapron B, Bingham A, Collard F, Donlon C, Johannessen JA, Piolle JF, Reul N. 2010. Ocean remote sensing data integration - examples and outlook. Proceedings of OceanObs’09: Sustained Ocean Observations and Information for Society Publisher’s official version http://dx.doi.org/10.5270/OceanObs09.pp.12.
- Chapron B, Collard F, Ardhuin F. 2005. Direct measurements of ocean surface velocity from space: Interpretation and validation. J Geophys Res. 110:C07008, doi:10.1029/2004JC002809.
- Choi JK, Park YJ, Ahn JH, Lim HS, Eom J, Ryu JH. 2012. GOCI, the world’s first geostationary ocean color observation satellite, for the monitoring of temporal variability in coastal water turbidity. J Geophys Res. 117:C09004, doi:10.1029/2012JC008046.
- Clark C, Wilson S. 2009. An overview of global observing systems relevant to GODAE. Oceanography 22(3):22–33. in-situ observing system authors, satellite observing system authors, doi:10.5670/oceanog.2009.63.
- Collard C, Johnsen H, Lotfi A, Chapron B. 2013. Wave mode processing algorithms, product validation and assimilation. In Proceedings of ‘SEASAR 2012’, Tromsø, Norway, 18–22 June 2012 ESA SP-709.
- Cullen R, Francis R. 2013. The Jason-CS Ocean Surface Topography Mission Payload Design and Development. GODAE OceanView Symposium, Baltimore.
- Dibarboure G, Boy F, Desjonqueres JD, Labroue S, Lasne Y, Picot N, Poisson JC, Thibaut P. 2014. Investigating short wavelength correlated errors on low-resolution mode altimetry. J. Atmos. Ocean Technol. 31(6):1337–1362. doi: 10.1175/JTECH-D-13-00081.1
- Dibarboure G, Pujol MI, Briol F, Le Traon P-Y, Larnicol G, Picot N, Mertz F, Ablain M. 2011a. Jason-2 in DUACS: First tandem results and impact on processing and products. Mar Geod. 34(3–4):214–241, doi:10.1080/01490419.2011.584826.
- Dibarboure G, Renaudie C, Pujol MI, Labroue S, Picot N. 2011b. A demonstration of the potential of CryoSat-2 to contribute to mesoscale observation. Adv Space Res, doi:10.1016/j.asr.2011.07.002.
- Donlon C, co-authors. 2007. The Global Ocean Data Assimilation Experiment High-resolution Sea Surface Temperature Pilot Project. Bull Am Meteorol Soc Volume 88, Issue 8 (August 2007):1197–1213, http://dx.doi.org/10.1175/BAMS-88-8-1197. doi: 10.1175/BAMS-88-8-1197
- Donlon C, co-authors. 2012. GMES Sentinel-3 mission. Remote Sens Environ. 120: 37–57, doi:10.1016/j.rse.2011.07.024.
- Drinkwater M, co-authors. 2010. Status and Outlook for the Space Component of an Integrated Ocean Observing System in Proceedings of OceanObs’09: Sustained Ocean Observations and Information for Society (Vol. 1), Venice, Italy, 21–25 September 2009, Hall J, Harrison DE, Stammer D, Eds., ESA Publication WPP-306, doi:10.5270/OceanObs09.pp.17.
- Falcini F, co-authors. 2012. Linking the historic 2011 Mississippi River flood to coastal wetland sedimentation. Nat Geosci. 5(11):803–807. doi: 10.1038/ngeo1615
- Font J, co-authors. 2013. SMOS first data analysis for sea surface salinity determination. Int. J Remote Sens. 34(9–10):3654–3670. doi: 10.1080/01431161.2012.716541
- Geiger EF, Grossi MD, Trembanis AC, Kohut JT, Oliver MJ. 2013. Satellite-derived coastal ocean and estuarine salinity in the Mid-Atlantic. Cont Shelf Res. 63:S235–S242. doi: 10.1016/j.csr.2011.12.001
- Girard-Ardhuin F, Ezraty R. 2012. Enhanced Arctic sea ice drift estimation merging radiometer and scatterometer data. IEEE Trans. Geosci. Remote Sens. 50(7):2639–2648. Part I, doi:10.1109/TGRS.2012.2184124.
- Gohin F. 2011. Annual cycles of chlorophyll-a, non-algal suspended particulate matter, and turbidity observed from space and in-situ in coastal waters. Ocean Sci. 7:705–732, doi:10.5194/os-7-705-2011.
- Gregg WW. 2008. Assimilation of SeaWiFS ocean chlorophyll data into a three-dimensional global ocean model. J. Mar. Syst. 69(3–4):205–225, doi:10.1016/j.jmarsys.2006.02.015.
- Grodsky SA, Kudryavtsev VN, Bentamy A, Carton JA, Chapron B. 2012. Does direct impact of SST on short wind waves matter for scatterometry? Geophys Res Lett. 39:L12602, doi:10.1029/2012GL052091.
- Haines K, Johannessen JA, Knudsen P, Lea D, Rio MH, Bertino L, Davidson F, Hernandez F. 2011. An ocean modelling and assimilation guide to using GOCE geoid products. Ocean Sci. 7:151–164. doi: 10.5194/os-7-151-2011
- Hauser D, Tison C, Lefevre JM, Lambin J, Chapron B, Aouf L, Ardhuin F, Amiot T, Collard F, Castillan P, Thouvenot E. 2010. Measuring ocean waves from space: Objectives and characteristics of the China-France oceanography satellite (CFOSAT). OMAE 2010 Shanghai (China), 6–11 June 2010.
- Høyer JL, Le Borgne P, Eastwood S. 2014. A bias correction method for Arctic satellite sea surface temperature observations. Remote Sens Environ, 2014 ISSN 0034-4257. http://dx.doi.org/10.1016/j.rse.2013.04.020.
- IOCCG. 2012. Ocean-Colour Observations from a Geostationary Orbit. Reports of the International Ocean-Colour Coordinating Group, No. 12, IOCCG, Dartmouth, Canada.
- Johannessen JA, Chapron B, Collard F, Kudryavtsev V, Mouche A, Akimov D, Dagestad K. 2008. Direct ocean surface velocity measurements from space: Improved quantitative interpretation of Envisat ASAR observations. Geophys. Res. Lett. 35:L22608, doi:10.1029/2008GL035709.
- Kaleschke L, Tian-Kunze X, Maaß N, Mäkynen M, Drusch M. 2012. Sea ice thickness retrieval from SMOS brightness temperatures during the Arctic freeze-up period. Geophys. Res. Lett. doi:10.1029/2012GL050916.
- Kudryavtsev V, Myasoedov A, Chapron B, Johannessen JA, Collard F. 2012. Imaging mesoscale upper ocean dynamics using synthetic aperture radar and optical data. J. Geophys. Res. 117:C04029, doi:10.1029/2011JC007492.
- Kwok, R., G. F. Cunningham, and W. D. Hibler III. 2003. Sub-daily sea ice motion and deformation from RADARSAT observations, Geophys Res Lett. 30(23), 2218, doi:10.1029/2003GL018723, 2003
- Labroue S, Boy F, Picot N, Urvoy M, Ablain M. 2012. First quality assessment of the Cryosat-2 altimetric system over ocean. Adv Space Res 50(8):1030–1045. doi: 10.1016/j.asr.2011.11.018
- Lagerloef G, Wentz F, Yueh S, Kao HY, Johnson GC, Lyman JM. 2012. Aquarius satellite mission provides new, detailed view of sea surface salinity, State of the Climate in 2011. Bull. Am. Meteorol. Soc. 93(7):S70–71.
- Laxon SW, Giles KA, Ridout AL, Wingham DJ, Willatt R, Cullen R, Kwok R, Schweiger A, Zhang J, Haas C, et al. 2013. CryoSat-2 estimates of Arctic sea ice thickness and volume. Geophys. Res. Lett. 40:732–737. doi: 10.1002/grl.50193
- Lazzari P, Teruzzi A, Salon S, Campagna S, Calonaci C, Colella S, Tonani M, Crise A. 2010. Pre-operational short-term forecasts for Mediterranean Sea biogeochemistry. Ocean Sci. 6:25–39, doi:10.5194/os-6-25-2010.
- Le Borgne P, Marsouin A, Orain F, Roquet H. 2012. Operational sea surface temperature bias adjustement using AATSR data. Remote Sens of Environ. 116:93–106. doi: 10.1016/j.rse.2010.02.023
- Le Traon P-Y. 2011. Satellites and Operational Oceanography. In Operational Oceanography in the 21st Century (Springer-Verlag Berlin). [http://archimer.ifremer.fr/doc/00073/18383/].
- Le Traon P-Y. 2013. From satellite altimetry to Argo and operational oceanography: three revolutions in oceanography. Ocean Sci. 9(5):901–915, http://dx.doi.org/10.5194/os-9-901-2013. doi: 10.5194/os-9-901-2013
- Lefèvre JM, Aouf L, Skandrani S, Queffeulou P. 2006. Contribution of satellite altimetry to wave analysis and forecasting. 15 years of progress in radar altimetry Symposium, Venice, Italy.
- Lin CC, Betto M, Belmonte Rivas M, Stoffelen A, de KloeFig J. 2012. EPS-SG Wind scatterometer concept tradeoffs and wind retrieval performance assessment. IGRS. 50(7).
- Maritorena S, Hembise Fanton d’Andon O, Mangin A, Siegel DA. 2010. Merged Ocean Colour Data Products Using a Bio-Optical Model: Characteristics, Benefits and Issues. Remote Sens of Environ. 114(8):1791–1804. doi: 10.1016/j.rse.2010.04.002
- Maximenko N, Niiler P, Rio MH, Melnichenko O, Centurioni L, Chambers D, Zlotnicki V, Galperin B. 2009. Mean Dynamic Topography of the ocean derived from satellite and drifting buoy data using three different techniques. J. Atmos. Oceanic Technol. doi:10.1175/2009JTECHO672.1.
- Mulet S, Rio MH, Bruinsma S. 2012. Accuracy of the preliminary GOCE GEOID models from an oceanographic perspective. Mar Geod. 35:314–336, doi:10.1080/01490419.2012.718230.
- O’Carroll AG, August T, Le Borgne P, Marsouin A. 2012. The accuracy of SST retrievals from Metop-A IASI and AVHRR using the EUMETSAT OSI-SAF matchup dataset. Remote Sens of Environ 126, November 2012: 184–194. ISSN 0034-4257. http://dx.doi.org/10.1016/j.rse.2012.08.006. doi: 10.1016/j.rse.2012.08.006
- Ondrusek M, Stengel E, Kinkade CS, Vogel RL, Keegstra P, Hunter C, Kim C. 2012. The development of a new optical total suspended matter algorithm for the Chesapeake Bay. Remote Sens of Environ. 119:243–254. doi: 10.1016/j.rse.2011.12.018
- Phillips P L, Schlüssel P, Accadia CJ, Banfi S, Zerfowski I. 2011. Observation requirements for the second generation EUMETSAT polar system visible/infrared imager. Proc. SPIE 8176, Sensors, Systems, and Next-Generation Satellites XV, 817608, doi:10.1117/12.897993.
- Picot N, Lachiver JM, Lambin J, Poisson JC, Legeais JF, Vernier A, Thibaut P, Mingsen L, Yongjun J. 2013. Towards an operational use of HY-2A in SSALTO/DUACS: Evaluation of the altimeter performances using S-IGDR data from NSOAS. Presented at the 2013 Ocean Surface Topography Science Team meeting.
- Prigent C, Aires F, Bernado F, Ohrlac JC, Goutoule JM, Roquet R, Donlon C. 2013. Analysis of the potential and limitations of microwave radiometry for the retrieval of sea surface temperature: Definition of MICROWAT, a new mission concept. J Geophys Res. 118:3074–3086, doi:10.1002/jgrc.20222.
- Reul N, Fournier S, Boutin J, Hernandez O, Maes C, Chapron B, Alory G, Quilfen Y, Tenerelli J, Morisset S, Kerr Y, Mecklenburg S, Delwart S. 2014. Sea Surface Salinity Observations from Space with the SMOS Satellite: A new means to monitor the marine branch of the water cycle. Surveys in Geophysics. 35(3):681–722, Publisher’s official version [http://dx.doi.org/10.1007/s10712-013-9244-0]. doi: 10.1007/s10712-013-9244-0
- Rio MH, Guinehut S, Larnicol G. 2011. New CNES-CLS09 global mean dynamic topography computed from the combination of GRACE data, altimetry, and in situ measurements. J Geophys Res. 116:C07018, doi:10.1029/2010JC006505.
- Rio MH, Mulet S, Picot N. 2013. New global Mean Dynamic Topography from a GOCE geoid model, altimeter measurements and oceanographic in-situ data. Proceedings of the ESA Living Planet Symposium, Edinburgh, September 9–13, 2013.
- Ryu JH, Ishizaka J. 2012. GOCI Data Processing and Ocean Applications. Ocean Sci J. 47(3) [http://dx.doi.org/10.1007/s12601-012-0023-5].
- Ryu JH. 2013. GOCI Status and GOCI-II Plan Joo-Hyung. Presentation at the 1st International Ocean Colour Science Meeting, Darmstadt, May 2013.
- Schaeffer P, Faugère Y, Legeais JF, Ollivier A, Guinle T, Picot N. 2012. The CNES_CLS11 Global Mean Sea Surface computed from 16 years of satellite altimeter data. Mar Geod. 35(1).
- Tapley BD, Flechtner SV, Bettadpur M, Watkins M. 2013. The status and future prospect for GRACE after the first decade. Eos Trans., Fall Meet. Suppl., Abstract G22A-01.
- Torres R, co-authors. 2012. GMES Sentinel-1 Mission. Remote Sens of Environ. 120:9–24. doi: 10.1016/j.rse.2011.05.028
- Vignudelli S, Kostianoy AG, Cipollini P, Benveniste J. (eds.) 2011. Coastal Altimetry, Springer-Verlag Berlin Heidelberg, 578, doi:10.1007/978-3-642-12796-0.
- Volpe G, Colella S, Forneris V, Tronconi C, Santoleri R. 2012. The Mediterranean Ocean Colour Observing System – system development and product validation. Ocean Sci. 8: 869–883. doi: 10.5194/os-8-869-2012
- Volpe G, Santoleri R, Vellucci V, Ribera d’Alcala M, Marullo S, D’Ortenzio F. 2007. The colour of the Mediterranean Sea: Global versus regional bio-optical algorithms evaluation and implication for satellite chlorophyll estimates. Remote Sens. Environ. 107:625–638. doi: 10.1016/j.rse.2006.10.017
- Zakhvatkina NY, Alexandrov VY, Johanessen OM, Sandven S, Frolov IY. 2013. Classification of sea ice type in ENVISAT Synthetic Aperture Radar images. IEEE Trans. Geosci. Remote Sens. 51(5):2587–2600, doi:10.1109/TGRS.2012.2212445.