
ABSTRACT
An ocean circulation forecasting model for the Madeira Archipelago is operational since May 2010. Developing a forecasting system for a small island oceanic region, deprived from in-situ observations, is a challenging task since there are limited ways to validate predictions. Furthermore, model resolution concurrent with insufficient computational power, locally available, are other limiting factors to consider. Regional models combined with the possibility to downscale solutions onto a higher resolution island-scale model is a way to overcome some of such limitations. Nevertheless, generalised regional models must be able to accurately represent the far-field and transport important features such as meddies onto the local systems; while island-scale models must have sufficient grid resolution as well as adequate physics and accurate atmospheric forcing to resolve the near-field phenomena. An island-induced cyclonic eddy event was successfully observed and forecasted with the current approach (regional-local). Generalised single (regional) model initiatives will prove to be insufficient to deal with mesoscale dynamic systems, islands and seamounts are important generators of mesoscale features in the NE Atlantic, with basin scale implications. The forecasting systems of the future should also consider upscaling valid local (island-scale) solutions onto Regional and/or Global models.
Introduction
Very little effort has been made to install and maintain operational platforms around some of the Atlantic Archipelagos. Despite the fact that Azores and Madeira regions account for over 80% of the Portuguese Economic Exclusive Zone (EEZ), most of the operational and observational instruments have been installed in the Portuguese continental shelf. The Portuguese Hydrographic Institute of the Navy operates most of these platforms, producing tidal and wave forecasts for the whole EEZ, including the islands. Notwithstanding, after the two wave buoys (maintained by the Madeira Ports Authority) were damaged by a storm event in December 2013, forecasts validation were discontinued by lack of in-situ data. In fact, to the best of our knowledge, there has never been a long-term monitoring of environmental parameters (e.g. temperature, salinity, etc.), and there are no measurements of ocean currents speed and direction available in the Madeira region. The last systematic oceanographic campaign carried out in the Madeira EEZ led by the Portuguese National Institute for Fisheries took place between 1979 and 1984 (INIP Citation1980, Citation1982, Citation1984a, Citation1984b). Sporadic oceanographic campaigns have collected some in-situ information since then, but data are scarce, not catalogued and most often not freely available for scientific use.
Several research studies based on satellite, numerical modelling and in-situ observations were carried out in recent years (e.g. Caldeira et al. Citation2002, Citation2014; Couvelard et al. Citation2012; Grubišić et al. Citation2015). The meteo-oceanographic phenomena known to occur around the Madeira Island are mostly due to these scientific efforts. The environmental consultancy community often cites these scientific results in their reporting (Campuzano et al. Citation2010), yet many coastal developments around the island were built without proper environmental assessments. The lack of oceanographic information leads to the building of coastal infrastructures such as the ‘Marina do Lugar-de-Baixo’ which currently adds up to ∼100 M euros of public money spent in repair costs, due structural damages during ‘atypical’ wave events. The initial predicted cost for this infrastructure was ∼7 M euros. Other projects which benefited from EU funds were also not successfully implemented. In the previous frameworks (e.g. FP6; FP7), EU approved funding for infrastructural investments for developing countries like Portugal, without considering (proper) environmental assessment. The Directive 2000/60/EC was Europe’s key tool for protecting the quality of its coastal waters. It established a framework for Community action in the field of water policy, and obligated Member States to publish a management plan for each coastal basin within the first 9 years. In January 2014, Portugal had failed to adopt and publish the ‘Sate of the Marine Environment’ in the scope of this Directive.
On a volunteer basis, and in the scope of several scientific projects, efforts were made to implement the first and the only ocean circulation forecasting system currently available for the Madeira Archipelago. At first, the system was available through a University website (http://wakes.uma.pt); however, most recently (January 2014) it has been moved to CIIMAR-Madeira, a non-profit organisation in order to be freed from the administrative burden of academic institutions (http://ciimarmadeira.org). The development of the Madeira ocean circulation forecasting system started in December 2009 and the first forecasts were available online in May 2010. Apart from the ocean forecasting system itself, the institution also provides a series of satellite observations for comparison. To overcome the limited computational resources available on the island, the forecasts and observations are processed on a High Performance Computational unit located in Oporto (the second largest city in the north of Continental Portugal). Only a partial amount of the results are transferred to the local servers (on the island) for further processing.
The aim of this article is to document all the efforts, challenges and results achieved during the last 5 years, after the implementation of the first operational oceanic system in the region. After this introduction, the forecasting system components and procedures are described in Section 2; Section 3 addresses some of the efforts that were made to cross-validate model predictions, whereas Section 4 offers some general conclusions and future prospects.
Oceanic forecasting system: regional to (local) island-scales
Implementing an open-ocean circulation forecasting system on a small island poses several logistical and technical difficulties. Madeira Island is located ∼400 km offshore of the African Coast and ∼900 km from the European Continent (Portugal). Running numerical models with four open-boundaries (OB) can be unstable (i.e. hard to keep mass conservation) and climatic nudging often provides inaccurate reference states to produce daily forecasts. Climatic profiles of temperature and salinity are often very different from daily and/or seasonal profiles. Moreover, large numerical domains at medium to high resolutions (temporal and/or spatial) have high computational costs, thus the availability of a global and/or regional model solutions to force local models permits the production of forecasts for isolated archipelagic regions such as Madeira.
The Madeira ocean circulation modelling system was initiated with climatological data at the oceanic boundaries and reanalysed atmospheric solutions from the National Centers for Environmental Prediction (NCEP). The spin-up period lasted three (model) years and computed solutions until April 2010. The forecasting mode started in May of 2010, whereby the ocean climatology was replaced by the Regional model solution (MERCATOR) and the atmosphere by its forecasting counterpart, that is, the Global Forecasting System (GFS). Every week, the MERCATOR model solution (PSY2V4R4) is used to force the Regional Ocean Modeling System (ROMS).
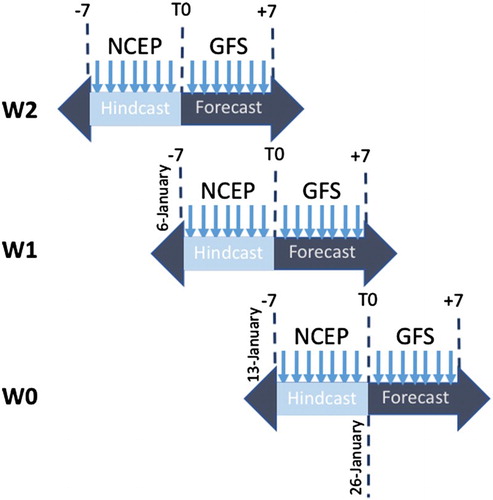
The GFS at 1/4° provides the atmospheric wind, humidity, pressure, temperature, precipitation and radiation to the regional model. ROMS uses these data to calculate the air-sea fluxes internally through the bulk formulae. The atmospheric fields are renewed every day, whereas the oceanic model boundary fields (7 days hindcast + 7 days forecast) are renewed once a week. Every Wednesday (T0) the whole oceanic forecasting system renews 7 days of hindcast (including nowcasts) for the previous 7 days and produces 7 new days of forecasts (). GFS reanalysis (hindcast) products are identified in the figure as NCEP to differentiate from its forecast counterpart (GFS).
Figure 1. Timeline of the Madeira oceanic forecasting system. Atmospheric forcing is renewed daily, whereas the oceanic lateral boundary forcing (MERCATOR) is renewed weekly, nevertheless the modelling forecasting system renews forecasts every day in order to update atmospheric conditions. NCEP represent hindcast atmospheric forcing (reanalysis), whereas GFS represent forecast only products. Weekly-MERCATOR product has 21 days (14 hindcasts and 7 forecasts), thus allowing to advance hindcast/forecasts every day.
The MERCATOR PSY2V4R4 system uses version 3.1 of the Nucleus for European Modeling of the Ocean (NEMO). The physical configuration is based on the tripolar (non-uniform) grid type with an horizontal resolution of 9 km at the equator, 7 km at Cape Hatteras (mid-latitudes) and 2 km toward the Ross and Weddell seas. The 50-level vertical discretisation has 1 m resolution at the surface decreasing to 450 m at the bottom, with 22 levels within the upper 100 m. ‘Partial cells’ parametrisation was chosen for a better representation of the topographic floor (Barnier et al. Citation2006) and the momentum advection term is computed with the energy and enstrophy conserving scheme proposed by Arakawa and Lamb (Citation1981). The advection of the tracers (temperature and salinity) is computed with a total variance diminishing (TVD) advection scheme (Lévy et al. Citation2001; Cravatte et al. Citation2007). The high-frequency gravity waves are filtered out by a free surface (Roullet & Madec Citation2000). A Laplacian lateral isopycnal diffusion on tracers and a horizontal biharmonic viscosity for momentum are used. In addition, the vertical mixing is parametrised according to a turbulent closure model (order 1.5) adapted by Blanke and Delecluse (Citation1993), the lateral friction condition is a partial-slip condition with a regionalisation of a no-slip condition (over the Mediterranean Sea) and the Elastic-Viscous-Plastic rheology formulation for the LIM2 ice model (Fichefet & Maqueda Citation1997) has been activated (see also Hunke & Dukowicz Citation1997). The bathymetry used in the system comes from a combination of interpolated ETOPO and GEBCO8 (Becker et al. Citation2009) databases. The monthly river outflow climatology is built with data on coastal runoffs and 100 major rivers from Dai and Trenberth (Citation2002) together with an annual estimate of Antarctica ice sheets melting given by Jacobs et al. (Citation1992).
The atmospheric fields forcing NEMO are taken from the ECMWF (European Centre for Medium-Range Weather Forecasts) Integrated Forecast System. A 3 h sampling is used to reproduce the diurnal cycle, in order to force the upper layers of the ocean model, with a thickness of 1 m for the uppermost level. Momentum and heat turbulent surface fluxes are computed from CORE bulk formulae using the usual set of atmospheric variables: surface air temperature at a height of 2 m, surface humidity at a height of 2 m, mean sea-level pressure and wind at a height of 10 m. Downward longwave and shortwave radiative fluxes and rainfall fluxes are also used in the surface heat and freshwater budgets. MERCATOR forecasting system does not include tides.
The data in MERCATOR are assimilated by means of a reduced-order Kalman filter with a 3D multivariate modal decomposition of the forecast error. It includes an adaptive-error estimate and a localisation algorithm. A 3D-Var scheme provides a correction for the slowly-evolving large-scale biases in temperature and salinity (Dombrowsky et al. Citation2013). ‘MyOcean’ altimeter data, in-situ temperature and salinity vertical profiles from ARGO drifters, and satellite Sea Surface Temperature (SST) are jointly assimilated to estimate the initial conditions for numerical ocean forecasting. In addition to the quality control performed by data producers, the system carries out an internal quality control on temperature and salinity vertical profiles in order to minimise the risk of erroneous observed profiles being assimilated in the model. Note that in addition to Jason-2 and CryoSat-2 altimetry observations, Jason-1 altimetry observations are assimilated until June 2013 (until the end of the mission on June 21st) and SARAL/Altika observations start being assimilated in August 2013. As expected, the assimilation only pursued in hindcast products to produce the analysis. The analysis is not performed at the end of the assimilation window but at the middle of the 7-day assimilation cycle. The objective is to take into account both past and future information and to provide the best estimate of the ocean centred in time. With such an approach, the analysis acts like a ‘smoother algorithm’ of the hindcast solutions.
In October 2010, the Envisat altimeter was brought to a lower orbit, which has led to a slight degradation of data quality (Ollivier & Faugere Citation2010). This degradation is due to the fact that Sea-Level Anomalies (SLA) is computed with respect to a Mean Sea Surface of lower quality because it falls outside the historical repeated track. This is particularly true at high latitudes where no tracks from other missions are available. For this reason, the Envisat error was increased by 2 cm over the entire domain and by 5 cm above 66° N. In view of this, 2–5 cm differences as calculated for the North East Atlantic (NEA) region are not as significant as originally considered.
To resolve the island-scales, the ROMS-Adaptive Grid Refinement in Fortran (AGRIF) numerical system was used, which is described in detail in Shchepetkin and McWilliams (Citation2003, Citation2005). ROMS is a split-explicit, free-surface and terrain-following vertical coordinate oceanic model, where short time steps are used to advance the surface elevation and barotropic momentum equation, and a larger time step is used for temperature, salinity and baroclinic momentum. ROMS employs a two-way time-averaging procedure for the barotropic mode which satisfies the 3D continuity equation. The specially designed predictor-corrector time-step algorithm allows a substantial increase in the permissible time-step size. The third-order, upstream-biased, dissipative advection scheme for momentum allows the generation of steep gradients, enhancing the effective resolution of the solution for a given grid size (Shchepetkin & McWilliams Citation1998). For tracers, the RSUP3 scheme, where diffusion is split from advection, is used and represented by a rotated geopotential biharmonic diffusion scheme (Marchesiello et al. Citation2009) in order to avoid excessive spurious diapycnal mixing associated with sigma coordinates. Explicit lateral viscosity is null everywhere in the model, except in sponge layers near the OB where it increases smoothly on several grid points. A K-Profile Parametrization (KPP) boundary layer scheme (Large et al. Citation1994) accounts for the subgrid-scale vertical mixing processes.
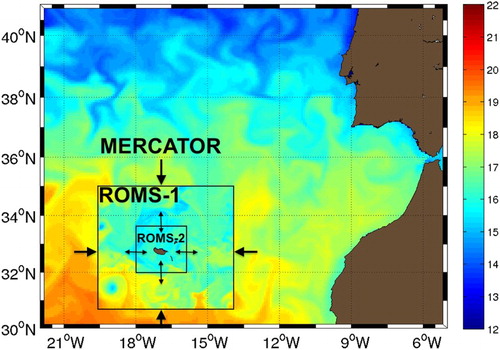
The model grid, the atmospheric forcing, the initial and boundary conditions were all built using an adapted version of the ROMSTOOLS package (Penven et al. Citation2007). The bottom topography is derived from the GEBCO 30″ resolution database (www.gebco.net). Despite the current implementation of a new pressure gradient scheme associated with a modified equation of state that limits computational errors of the pressure gradient (Shchepetkin & McWilliams Citation2003), the bathymetry still needs to be smoothed, so that the slope parameter (r = Δh/2 h; Beckmann & Haidvogel Citation1993) remains lower than 0.2. To ensure acceptable resolution of the upper ocean, we use 35 vertical levels with stretched s-coordinates, with surface and bottom stretching parameters of θs = 6, θb = 0, respectively (Song & Haidvogel Citation1994). At the lateral boundaries facing the open ocean, a mixed passive-active, implicit, radiation condition (Marchesiello et al. Citation2001) connects the regional model to the global model inputs (one-way, offline nesting). A Newtonian nudging was used to adjust MERCATOR data to ROMS dynamics at lateral boundaries of the parent grid only. Nudging was performed during the hindcast and nowcast steps and released during forecast. Two nested grids inside ROMS allow the increase in spatial resolution from ∼3 km (1/32°) up to approximately 900 m (1/118°), near the coast (see ). The AGRIF package implementation in ROMS was thoroughly discussed in Debreu et al. (Citation2012). One of the major advantages of AGRIF is the ability to manage an arbitrary number of fixed grids and an arbitrary number of embedding levels. In the Madeira forecasting system, AGRIF was used in two-way mode between parent and child grids, thus eddies, fronts and oceanographic dynamic structures were allowed to move between the two model grids. In order to preserve the Courant–Friedrichs–Lewy condition, for a typical coefficient of refinement with a factor of 3 (e.g. a 5 km resolution grid embedded in a 15 km grid), for each parent time step the child must be advanced using a time step divided by the coefficient of refinement as many time as necessary to reach the time of the parent (Blayo & Debreu Citation1999; Debreu & Blayo Citation2008; Debreu et al., Citation2012). In the Madeira system, grid refinement between the two adjacent domains was kept to a factor of 3 (900 m child grid embedded in the 3 km parent grid).
Figure 2. Graphical representation of the Madeira forecasting system whereby the MERCATOR model is nudged onto ROMS. ROMS has two sub-domains with grid resolutions of 1/36° (ROMS-1) and 1/118° (ROMS-2). The two ROMS domains are coupled in two-way mode using AGRIF.
A Shell script manages the whole procedure automatically: download and pre-processing, hindcast and forecast simulations, post-processing, data storage and preparation of the next nowcast/forecast cycle.
Model validation
Despite the fact that the model is operational in forecasting mode since May 2010, there was a need to discard historical results in order to clear space for more recent ones. Nevertheless, the 2014 results were preserved enabling an evaluation of the models performance relative to observations.
Representing the sea surface
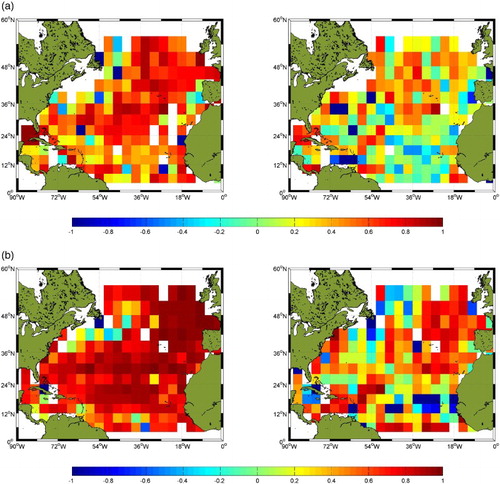
In general, MERCATOR represents well the NEA (known) sea surface circulation patterns. In some instances, MERCATOR under- or over-estimates current speed but in general most of the surface dynamics are well represented. In order to analyse the accuracy of the model, the Brier skill score (SS) developed by Wilks (Citation2006) was used:
The reference data (Refm) are the climatological values obtained from WOA13 (Locarnini et al. Citation2013; Zweng et al. Citation2013); the observed values (Obsm) were extracted from the ARGO profiles (http://www.argo.ucsd.edu) available for the N. Atlantic region of the model domain, whereas the Forecastm were the model calculated values. When the SS values are close to 0 the model results are close to the climatology; for SS values close to 1, the model offers a better estimate, comparatively to the climatology, that is, observed values were far from climatological values. Negative values represent erroneous predictions. In order to obtain several ARGO profiles in the same region to compare to model profiles, regions of 4° of latitude by 4° of longitude were considered. A total of 9215 ARGO profiles were used for the 2014 SS calculations and 11,337 for 2015. Several depth ranges were evaluated: (i) 0–2000 m; (ii) 10–500 m; (iii) 501–1000 m; (iv) 1001–1500 m and (v) 1501–2000 m. Data for 2014 and 2015 were independently considered.
As can be depicted from , MERCATOR forecasts for temperature are often better than the salinity forecasts (values closer to 1). Perhaps due to the larger ARGO dataset available to assimilate, 2015 showed an improvement in the model skill factor, relatively to 2014. Less accurate predictions are often associated with highly dynamic regions such as the Gulf Stream, Azores Current and Equatorial regions. Although not shown, temperatures between the 10–500 m depth range were very well predicted by the model, remaining positive in the deeper layers, particularly in the centre and northern parts of the MERCATOR domain. The analysis also showed a substantial decrease of available ARGO data in the deepest layers to compare with the model, that is, 1001–1500 m; 1501–2000 m; thus we choose to show an integrated calculation considering as much of the available data as possible.
Figure 3. SS values for MERCATOR. When SS is close to 0 the model results are close to the climatology; left panels are for temperature; right panels salinity. For SS values close to 1, the model offers a better estimate, relative to the climatological value, that is, observed values are far from the climatological range. Negative values represent an erroneous prediction. For (a) 2014; (b) 2015.
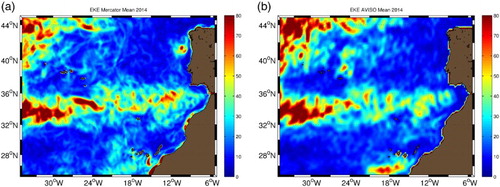
Considering that the surface currents are well represented by the regional model, the comparisons between MERCATOR and AVISO (Archiving, Validation and Interpretation of Satellite Oceanographic) for 2014 show striking similarities. The strong Eddy Kinetic Energy (EKE) signal from the Gulf Stream, NW of the Azores, as well as on the Azores Front are present in both datasets (). Seasonal comparisons (not shown) also attain similar results. The geostrophic currents (ug, vg) were calculated from Sea Surface Height (SSH) for both datasets, which in turn were used to calculate EKE (=0.5*[ug2 + vg2]). Most notable differences between model and AVISO EKE are observed in the NW of Portugal, over the Galician seamount, where the model shows stronger EKE activity than AVISO. North of the Azores and south of the Canary Archipelago, the model shows weaker EKE than AVISO. Considering that these small islands are 50 km wide (or less), MERCATOR with 10 km resolution (1/12°) is clearly not adequately resolving all the island-induced perturbations. If we consider the Rossby deformation radius (Rd = Nh/f), where N is the Brunt-Väisälä frequency (the vertical density gradient is parametrised as N2 = −(g/ρ0) (dρ/dz), where g is the gravitational acceleration, ρ0 is the reference seawater density and ρ the water parcel density at a certain depth [z]), h is the surface layer thickness (i.e. depth of upper thermocline) and f the Coriolis parameter (f = 2Ωsinϕ, where Ω is the angular speed of the earth and ϕ is the latitude); considering typical NEA profiles near Madeira and Canary islands we obtain 10 < Rd < 25 km. Therefore, a priori small mesoscale oceanographic features (10–20 km) are not going to be appropriately resolved by the 10 km model grid.
Figure 4. Mean EKE (cm2/s2) calculated from (a) MERCATOR; (b) AVISO for 2014.
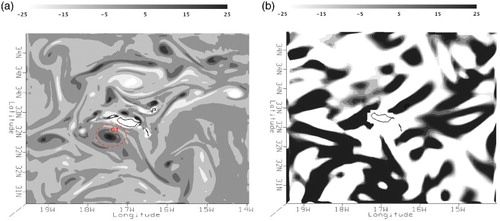
The regional model (ROMS) by increasing its spatial resolution around the islands improves the representation of surface currents, relative to the observations. shows how ROMS represents the formation of a cyclonic vortex on the 12th of July 2014 detected with altimetry data, whereas MERCATOR misses an accurate representation of this phenomenon. Although the global model represents well the basin scale currents as shown above, higher resolution regional models are essential to calculate the island-induced mesoscale dynamics.
Figure 5. Relative vorticity (X10−5 s−1) for the Madeira Archipelago Region (27-Junho-2014), comparing ROMS (a) with (b) MERCATOR. The mesoscale island-induced cyclonic eddy (C1) is well resolved in ROMS (see for observations).
shows further evidences of the occurrence of this cyclonic structure forming leeward of Madeira. Cyclones induce upwelling of cold, nutrient-rich water to the surface promoting phytoplankton growth. The Moderate-resolution Imaging Spectroradiometer (MODIS) is a radiometer flying onboard the NASA Terra and Aqua satellite platforms. MODIS Aqua Global Level-3 Mapped Thermal SST products consists of SST data with 4 km resolution extracted during daytime. (a) shows the cold sea surface signature of the cyclonic eddy, forming SW of Madeira Island on the 15th June 2014. The eddy core has temperatures as low as 19.2°C, whereas in the surrounding regions the highest SST reaches 22.7°C. (b) shows a ‘bloom’ of sea surface chlorophyll with concentrations of 0.1 mg/m3 from a concurrent MODIS image for the same day. Madeira waters are generally considered oligotrophic (i.e. nutrient depleted), therefore high chlorophyll values are not expected, unless the ocean currents brings nutrients to the sea surface, promoting phytoplankton growth, as it is the case in core of cyclonic eddies. ROMS-forecasted SST (parent grid) also shows the formation of the June 2014 cyclonic eddy.
Figure 6. Cyclonic eddy episode April–June 2014. Best concurrent independent observations (a) MODIS SST (°C); (b) Chlorophyll-a concentration (mg/m3); (c) ROMS-SST (°C); (d) relative vorticity calculated from altimetry data (X10−5 s−1). Same cyclonic (C1) and anticyclonic (A1) mesoscale eddies are observed in (c) and (d).
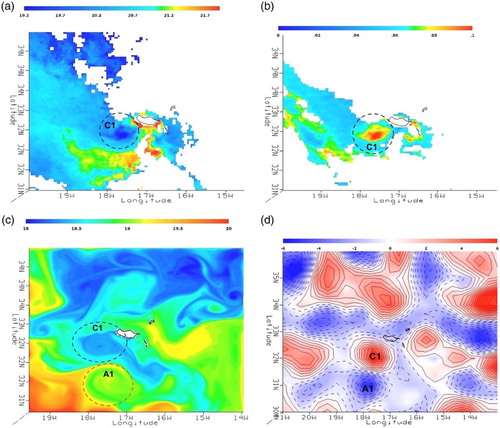
Although with different absolute SST values, the eddy size and location are very well resolved by ROMS. As can be seen from both the MODIS-SST image and ROMS-SST ((a) and (c)), small features such as the advection of coastal water into the eddy are also depicted by both (measurements and by the model). The model is 1–2°C cooler when compared to the satellite measurements. Apart from the cyclonic eddy the model also resolves an anticyclonic vortex observed to the south of the cyclonic one. In fact, a vorticity map of the sea surface currents, derived from altimetry measurements, also shows these dipole features forming leeward of Madeira ((d)). Due to the interaction of the bathymetry with the incoming ocean currents, Madeira Island is known to induce the formation of both cyclonic and anticyclonic eddies, and there are several observations of these reported in the scientific literature (Caldeira et al. Citation2002, Citation2014). The forecast of these island-induced features is important in order to use the system to forecast the transport of pollutants and/or larvae, coastal drift, during search and rescue missions, etc.
Due to the formation of atmospheric von Kármán vortex streets, Madeira leeward side is often exposed to higher solar radiation inducing the formation of a warm ‘skin layer’ (a.k.a. warm wake), particularly during summer months. This layer is well depicted by the satellite sensors and it has been frequently observed and documented (Caldeira et al. Citation2002; Caldeira & Tomé Citation2013). Nevertheless, recent (unpublished) studies by the authors have shown that without a high-resolution coupled atmosphere-ocean modelling system is not possible to (numerically) resolve this ‘skin layer’ effect. Therefore, considering that neither the global model nor ROMS are currently coupled to high-resolution atmospheric model fields, realistic SST values will be hard to obtain with the current forecasting systems.
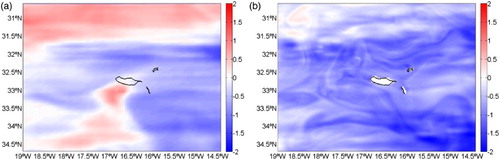
shows the SST anomalies calculated from subtracting satellite measurements from model calculations (MERCATOR 7a; ROMS 7b), confirming that while ROMS under-estimates (−1 to −2°C) SST values MERCATOR over-estimates absolute values by ±1°C. Notwithstanding, the importance of this ‘skin-layer’ to mediate air-sea interactions, it is not expected that this imprecision would compromise the representation of the deeper layer dynamics. Previous studies and observations have suggested this to be a daily feature with 24 h cycles, affecting the first 5 m of the water column, during the warmer months (e.g. Caldeira et al. Citation2002).
Figure 7. Sea surface maps of SST anomalies, comparing (a) MERCATOR-SST and (b) ROMS-SST, with satellite-derived SST (GHRSST), for the 27th June 2014.
Water mass representation
In terms of water mass representation, the Theta-S analysis shows a good agreement between MERCATOR forecasts and ARGO profiles, for 2014 (). This is somewhat expected since most of these profiles are assimilated onto MERCATOR hindcasts. Most interesting to observe, however, is the fact that in periods when the surface mixed layer is destroyed (Winter and Autumn), there are less variability when compared to periods with greater atmospheric and surface gradients, such as in the summer months. Thus, the seasonal variability is also well depicted by MERCATOR (not shown).
Figure 8. Map showing (a) the MERCATOR grid points (black dots) and the CORIOLIS-ARGO profiles (red dots); (b) Theta-S diagrams comparing MERCATOR T-S variability with the observed Coriolis-ARGO dataset for 2014.
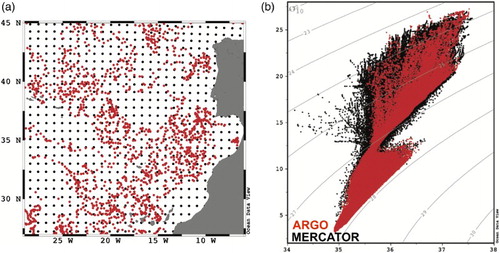
Figure 9. Comparison between ROMS profiles (black dots) and CORIOLIS-ARGO profiles (red dots) in the Madeira Archipelago Region during 2014.
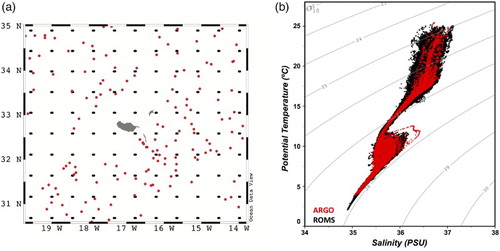
Despite having no data assimilation, the regional model (ROMS) maintains the realistic representation of the water masses around the Madeira Archipelago, inherited from the MERCATOR model solution. shows a comparison between ARGO and ROMS Theta-S profiles for the whole year (2014). ROMS shows slightly more variability at the surface but it keeps a realistic representation of the North Atlantic Central Surface Water (NACSW; T: 4–20°C; S: 35–36.8 PSU); of the Mediterranean Intermediate Water (MIW; T: 6–11.9°C; S: 35.3–36.5 PSU); as well as of the North Atlantic Deep Water (NADW; T: 3–4°C; S: 34.9–35. 0 PSU). The MIW is a prominent feature in the NEA and it often reaches the Madeira Island region between 1000 and 2000 m. In fact, the black scabbardfish (Aphanopus carbo, Lowe 1839) is an important commercial exploited fish that lives in this MIW layer. Thus forecasting the MIW occurrence around Madeira could be important to support fish stock management in the future.
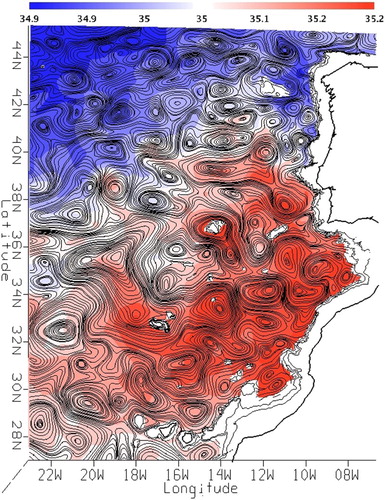
Figure 10. Maps of salinity (PSU) and currents (streamlines) at 1941 m extracted from MERCATOR for the 27th of April 2014. The MIW lower layer transports MEDDIES southward to the Madeira region. Bathymetry isolines shown for 1000–3000 m, every 500 m.
Forecasting MEDDIES in the NEA
The Mediterranean outflows the Gibraltar Strait in two main layers (a.k.a. cores): an upper layer, between 600 and 1000 m and a lower layer which forms between 1000 and 2000 m (e.g. Ambar et al. Citation2008). The interaction of this water with the topographic promontories and seamounts breaks the outflow inducing the generation of vortices, often named after its dominant water mass component, that is, MEDDIES – Mediterranean Eddies. Both cyclones and anticyclones are formed during these interactions. (e.g. Richardson et al. Citation2000), with typical radii varying between 10 and 50 km (Bower et al. Citation1997). Numerical models have successfully resolved these vortices which result from the interaction of MIW with the seamounts. Aguiar et al. (Citation2013) has done a 20-year (numerical) census of meddies formed in the NEA region (see also Carton et al., Citation2002; Aiki & Yamagata Citation2004). Since meddies are responsible for the re-distribution of salt on the North Atlantic Basin, forecasting their occurrence, trajectory and interactions is of outmost importance.
As shown above by the Theta-S analysis, the MERCATOR does solve for the Mediterranean Intermediate layer and their interaction with the Iberian shelf and with the Madeira-Tore seamounts, which results in the generation of these meddies (). There are also two main trajectories for the MIW in MERCATOR: a northward trajectory, which is often associated with the upper layer (600–1000 m), and a southward travelling outflow, which is associated with the lower layer (1000–2000 m). Most of the MEDDIES that reached Madeira travel in this lower MIW layer ().
The MIW also interacts with the Madeira Islands, often reaching the Archipelago from the northeast. As it occurs around the NEA seamounts, the Archipelago bathymetry induces further fragmentation and re-distribution of Mediterranean waters (meddies).
Figure 11. (a) 3D plot representing ROMS Salinity (PSU) over the bathymetry showing the incoming Mediterranean at 1500 m interacting with the islands, for the 12th of June 2014; bathymetric isolines (white) from 0 to 1500 m every 500 m. (b) Relative vorticity (X10−6 s−1) calculated from ROMS velocity fields at 1500 m for the 30th June 2014, showing vortices forming due to the interaction of the incoming Mediterranean flow with island’s bathymetry. Bathymetric isolines from 500 to 2500 m every 500 m.
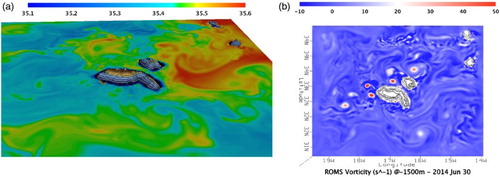
(a) shows the incoming salty outflow that reaches Madeira at 1500 m, interacting with the island (27th of June 2014). Without having this signal from MERCATOR transported onto ROMS, it would have not been possible to forecast the MIW interactions with the islands, in the first place. Therefore apart from having a local model solving the near-field, it is equally important that the far-field is being adequately represented. Meddies are features often misrepresented in climatic models and not well resolved in many numerical studies of the NEA. Thus, forecasting them is a challenging task yet extremely important to fully represent the regional dynamics.
(b) shows the EKE derived from ROMS velocity fields at 1500 m enhancing the intense vortex generation at these depths occurring around the islands (30th June 2014). The vortices are 20–50 km wide, and are well depicted by the 3 km ROMS grid (as in Aguiar et al. Citation2013). It is important to note that Madeira is about 1000 km from the source of the MIW, yet meddies are often observed interacting with the islands, and/or forming in this region, hence their importance in the redistribution of salt across the Atlantic Basin.
General discussion and future work
As it was demonstrated herein, building and maintaining a realistic forecasting system for a small island region is a challenging task. Islands are small territories, often isolated in deep oceanic regions and models need to consider adequate grid resolutions and four stable OB conditions. Large high-resolution domains are expensive to calculate in small computational structures, often available in these remote archipelagos. Most often island forecasting systems depend on global and/or basin (regional) scale models to provide adequate far-field conditions, as well as on powerful computational resources available over the internet, yet Global and Regional forecasting systems do not realistically represent the oceanic dynamics without resolving these island-induced features. In the Madeira Island case, MERCATOR weekly forecasts were used to force the Regional Ocean Circulation Modeling System. With data assimilation MERCATOR maintains an adequate representation of both, the surface and deep-water systems, and the currents and water masses that are known to reach Madeira compared well with satellite and in-situ datasets. MERCATOR delivers meddies and MIW to the Archipelago, and the regional model can resolve the interaction processes. At the island (coastal) scales data are often scarce and mesoscale processes are hard to validate, nevertheless a cyclonic eddy episode was accurately forecasted by ROMS and detected by satellite observations. High-resolution global forecasting models are not sufficient to resolve all the near-field dynamics which occur around these small islands. Forecasting atmospheric island-scale phenomena, such as the warming of the sea surface ‘skin-layer’ is not achievable without a fully couple atmospheric-oceanic system. Thus apart from promoting a (generalised) European effort to improve one forecasting system such as MERCATOR, EU should also start to consider the geophysical processes that often form around these small Atlantic Archipelagos and seamounts, thus increasing efforts to promote numerical studies concurrent with intense local observations. The climatic representation and importance of these mesoscale (localised) phenomena has recently started to be considered (e.g. Fox-Kemper et al. Citation2011). Future forecasting systems will need to better resolve these island-induced phenomena, including continuing the validation of numerical calculations with adequate observations, which are very scarce for these fine scales. Upscaling these validated model solutions onto Regional and Global systems using assimilation techniques might also be a way of addressing the limitations of these generalised systems. In brief, Global systems can continue to provide the forcing fields to the local forecasting systems, which in turn should aim to adequately resolve and validate the small-scale dynamics, before being incorporated back onto the Global system, using data-assimilation techniques. The downscaling of generalised models onto regional models could benefit from an upscaling of representative local solutions. It is not expected that a singular numerical approach and/or a single institution will be able to manage data collection in all the North Atlantic sub-regions and at all scales, thus monitoring islands and seamounts to improve global and regional forecasting systems can be considered somewhat visionary, particularly if Europe aims to achieve a truly Atlantic dimension, with their forecasting systems.
In the near future, the current configuration should be replaced by a coupled atmosphere-ocean system in order to improve the representation of the SST fields. Recent (unpublished) studies have demonstrated that the best way to replicate the Madeira warm wake which often occurs in the leeward side of the island is to have the correct radiation fluxes, achievable with coupled systems. In the scope of the recently formed Oceanic Observatory of Madeira (OOM: http://oom.arditi.pt), the collection of new datasets is also expected to help improve the island forecasting system.
Acknowledgements
MERCATOR solutions are provided weekly by ‘MyOcean’ (now CMEMS), under Contract Reference 2012_125-NCUTR-43 (2009–present). We are indebted to Jesus dos Reis for the help in the production of some figures. Constructive comments from an anonymous reviewer helped improve the original version of this manuscript.
Disclosure statement
No potential conflict of interest was reported by the authors.
ORCiD
Rui Caldeira http://orcid.org/0000-0001-8805-3016
Xavier Couvelard http://orcid.org/0000-0003-4868-714X
Rui Vieira http://orcid.org/0000-0002-9440-2355
Carlos Lucas http://orcid.org/0000-0002-5500-8785
Iria Sala http://orcid.org/0000-0001-5018-3544
Additional information
Funding
Related Research Data
References
- Aguiar A, Peliz A, Carton X. 2013. A census of Meddies in a long-term high-resolution simulation. Progr Oceanogr. 116:80–94. doi: 10.1016/j.pocean.2013.06.016
- Aiki H, Yamagata T. 2004. A numerical study on the successive formation of Meddy-like lenses. J Geophys Res. 109:C06020. doi:10.1029/2003JC001952
- Ambar I, Serra N, Neves F, Ferreira T. 2008. Observations of the Mediterranean undercurrent and eddies in the gulf of Cadiz during 2001. J Marine Sys. 71:195–220. doi: 10.1016/j.jmarsys.2007.07.003
- Arakawa A, Lamb VR. 1981. A potential enstrophy and energy conserving scheme for the shallow water equations. Mon Weather Rev. 109:18–36. doi: 10.1175/1520-0493(1981)109<0018:APEAEC>2.0.CO;2
- Barnier B, Madec G, Penduff T, Molines JM, Treguier AM, Le Sommer J, Beckmann A, Biastoch A, Böning C, Dengg J, et al. 2006. Impact of partial steps and momentum advection schemes in a global circulation model at eddy permitting resolution. Ocean Dynam. 56:543–567. doi: 10.1007/s10236-006-0090-1
- Becker JJ, Sandwell DT, Smith WHF, Braud J, Binder B, Depner J, Fabre D, Factor J, Ingalls S, Kim SH, et al. 2009. Global bathymetry and elevation data at 30 arc seconds resolution: SRTM30_PLUS. Mar Geod. 32:355–371. doi: 10.1080/01490410903297766
- Beckmann A, Haidvogel D. 1993. Numerical simulation of flow around a tall isolated seamount. Part I: Problem formulation and model accuracy. J Phys Oceanogr. 23:1736–1753. doi: 10.1175/1520-0485(1993)023<1736:NSOFAA>2.0.CO;2
- Blanke B, Delecluse P. 1993. Variability of the tropical Atlantic-Ocean simulated by a general-circulation model with 2 different mixed-layer physics. J Phys Oceanogr. 23:1363–1388. doi: 10.1175/1520-0485(1993)023<1363:VOTTAO>2.0.CO;2
- Blayo E, Debreu, L. 1999. Adaptive mesh refinement for finite-difference ocean models: first experiments. J Phys Oceanogr. 29:1239–1250. doi: 10.1175/1520-0485(1999)029<1239:AMRFFD>2.0.CO;2
- Bower AS, Armi L, Ambar I. 1997. Lagrangian observations of Meddy formation during a Mediterranean undercurrent seeding experiment. J Physical Oceanogr. 27:2545–2575. doi: 10.1175/1520-0485(1997)027<2545:LOOMFD>2.0.CO;2
- Caldeira RMA, Groom S, Miller P, Pilgrim D, Nezlin N. 2002. Sea-surface signatures of the island mass effect phenomena around Madeira Island, Northeast Atlantic. Remote Sens Environ. 80:336–360. doi: 10.1016/S0034-4257(01)00316-9
- Caldeira RMA, Stegner A, Couvelard X, Araujo IB, Testor P, Lorenzo A. 2014. Evolution of an oceanic anticyclone in the lee of Madeira Island: In situ and remote sensing survey. J Geophys Res Oceans. 119:1195–1216. doi: 10.1002/2013JC009493.
- Caldeira RMA, Tomé R. 2013. Wake response to an ocean-feedback mechanism: Madeira Island case study. Boundary-Layer Meteorol. 148:419–436. doi: 10.1007/s10546-013-9817-y
- Campuzano F, Nunes S, Malhadas M, Neves R. 2010. Modelling hydrodynamics and water quality of Madeira Island (Portugal). Globec Int Newsletter. 16(1):40–42.
- Carton X, Cherubin L, Paillet J, Morel Y, Serpette A, Le Cann B. 2002. Meddy coupling with a deep cyclone in the Gulf of Cadiz. J Marine Sys. 32:13–42. doi: 10.1016/S0924-7963(02)00028-3
- Couvelard X, Caldeira RMA, Araújo IB, Tomé R. 2012. Wind mediated vorticity-generation and eddy-confinement, leeward of the Madeira Island: 2008 numerical case study. Dynamics Atmospheres Oceans. 58:128–149. doi: 10.1016/j.dynatmoce.2012.09.005
- Cravatte S, Madec G, Izumo T, Menkes C, Bozec A. 2007. Progress in the 3-D circulation of the eastern equatorial Pacific in a climate. Ocean Model. 17:28–48. doi: 10.1016/j.ocemod.2006.11.003
- Dai A, Trenberth KE. 2002. Estimates of freshwater discharge from continents: latitudinal and seasonal variations. J Hydrometeorol. 3:660–687. doi: 10.1175/1525-7541(2002)003<0660:EOFDFC>2.0.CO;2
- Debreu L, Blayo E. 2008. Special Issue on multi-scale modelling: nested grid and unstructured mesh approaches. Ocean Dynamics. 58:415–428. doi:10.1007/s10236-008-0150-9
- Debreu L, Marchesiello P, Penven P, Cambon G. 2012. Two-way nesting in split-explicit ocean models: algorithms, implementation and validation. Ocean Model. 49–50:1–21. doi:10.1016/j.ocemod.2012.03.003
- Dombrowsky T, Regnier C, Lellouche J-M, Legalloudec O, Desportes C, Drevillon M. 2013. Quality information document (MYO2-GLO-QUID-001–002-V1.2). Available from: http://marine.copernicus.eu/automne_modules_files/pmedia/public/r1135_9_myo2-glo-quid-001-002-v1.2_accepted_rfc-394.pdf.
- Fichefet T, Maqueda MA. 1997. Sensitivity of a global sea ice model to the treatment of ice thermodynamics and dynamics. J Geophys Res. 102:12609–12646. doi: 10.1029/97JC00480
- Fox-Kemper B, Danabasoglu G, Ferrari R, Griffies SM, Hallberg RW, Holland MM, Maltrud ME, Peacock S, Samuels BL. 2011. Parameterization of mixed layer eddies. III: implementation and impact in global ocean climate simulations. Ocean Model. 39(1):61–78. doi: 10.1016/j.ocemod.2010.09.002
- Grubišić V, Sachsperger J, Caldeira RMA. 2015. Atmospheric wake of Madeira: first aerial observations and numerical simulations. J Atmos Sci. 72:4755–4776. doi:10.1175/JAS-D-14-0251.1
- Hunke EC, Dukowicz JK. 1997. An elastic-viscous-plastic model for sea ice dynamics. J Phys Oceanogr. 27:1849–1867. doi: 10.1175/1520-0485(1997)027<1849:AEVPMF>2.0.CO;2
- INIP. 1980. Programa de Apoio as Pescas na Madeira-I cruzeiro de Reconhecimento de Pesca e Oceanografia 020080779 (Relatorio Tecnico Administrativo, vol. 3, 141 pp.). Lisboa: INIP.
- INIP. 1982. Programa de Apoio as Pescas na Madeira-II cruzeiro de Reconhecimento de Pesca e Oceanografia 020170680 (Relatorio Tecnico Administrativo, vol. 11, 220 pp.). Lisboa: INIP.
- INIP. 1984a. Programa de Apoio as Pescas na Madeira-III cruzeiro de Reconhecimento de Pesca e Oceanografia 020330981 (Relatorio Tecnico Administrativo, vol. 22, 124 pp.). Lisboa: INIP.
- INIP. 1984b. Programa de Apoio as Pescas na Madeira-IV cruzeiro de Reconhecimento de Pesca e Oceanografia 020390582 (Relatorio Tecnico Administrativo, vol. 3, 120 pp.). Lisboa: INIP.
- Jacobs S, Hellmer H, Doake CSM, Jenkins A, Frolich RM. 1992. Melting of ice shelves and the mass balance of Antarctica. J Glaciol. 38:375–387.
- Large W, Mcwilliams JC, Doney S. 1994. Oceanic vertical mixing - a review and a model with no local boundary layer parameterization. Rev Geophys. 32:363–403. doi: 10.1029/94RG01872
- Lévy M, Estublier A, Madec G. 2001. Choice of an advection scheme for biogeochemical models. Geophy Res Lett. 28:3725–3372. doi: 10.1029/2001GL012947
- Locarnini RA, Mishonov AV, Antonov JI, Boyer TP, Garcia HE, Baranova OK, Zweng MM, Paver CR, Reagan JR, Johnson DR, et al. 2013. World ocean atlas 2013, volume 1: temperature. In: Levitus S, editor, Mishonov A, Technical Ed. Silver Spring, MD: NOAA Atlas NESDIS 73, 40 pp.
- Marchesiello P, Debreu L, Couvelard X. 2009. Spurious diapycnal mixing in terrain-following coordinate models: the problem and a solution. Ocean Model. 26:156–169. doi: 10.1016/j.ocemod.2008.09.004
- Marchesiello P, McWilliams JC, Shchepetkin A. 2001. Open boundary conditions for long-term integration of regional oceanic models. Ocean Model. 3:1–20. doi: 10.1016/S1463-5003(00)00013-5
- Ollivier A, Faugere Y. 2010. Envisat RA-2/MWR ocean data validation and cross-calibration Activities. Yearly report. Technical Note CLS.DOS/NT/10.018.
- Penven P, Marchesiello P, Debreu L, Lefevre J. 2007. Software tools for pre- and post-processing of oceanic regional simulations. Environ Model Softw. 23:660–662. doi: 10.1016/j.envsoft.2007.07.004
- Richardson PL, Bower A, Zenk W. 2000. A census of meddies tracked by floats. Progr Oceanogr. 45:209–250. doi: 10.1016/S0079-6611(99)00053-1
- Roullet G, Madec G. 2000. Salt conservation, free surface, and varying levels: a new formulation for ocean general circulation models. J Geophys Res. 105:23927–23942. doi: 10.1029/2000JC900089
- Shchepetkin AF, McWilliams JC. 1998. Quasi-monotone advection schemes based on explicit locally adaptive dissipation. Mon Wea Rev. 126:1541–1580. doi: 10.1175/1520-0493(1998)126<1541:QMASBO>2.0.CO;2
- Shchepetkin AF, McWilliams JC. 2003. A method for computing horizontal pressure-gradient force in an oceanic model with a nonaligned vertical coordinate. J Geophys Res-Oceans. 108(C3):3090. doi:10.1029/2001JC001047.
- Shchepetkin AF, McWilliams JC. 2005. The regional oceanic modeling system (ROMS): a split-explicit, free-surface, topography-following-coordinate oceanic model. Ocean Model. 9:347–404. doi: 10.1016/j.ocemod.2004.08.002
- Song Y, Haidvogel D. 1994. A semi-implicit circulation model using a generalized topography-following coordinate system. J Comput Phys. 115:228–244. doi: 10.1006/jcph.1994.1189
- Wilks DS. 2006. Statistical methods in the atmospheric sciences. 2nd edn. Burlington, MA: Academic Press.
- Zweng MM, Reagan JR, Antonov JI, Locarnini RA, Mishonov AV, Boyer TP, Garcia HE, Baranova OK, Johnson DR, Seidov D, Biddle MM. 2013. World ocean atlas 2013, volume 2: salinity. Levitus S, editor, Mishonov A, Technical Ed. Silver Spring, MD: NOAA Atlas NESDIS 74, 39 pp.