
 ?Mathematical formulae have been encoded as MathML and are displayed in this HTML version using MathJax in order to improve their display. Uncheck the box to turn MathJax off. This feature requires Javascript. Click on a formula to zoom.
ABSTRACT
A three-site short-range (25 MHz) CODAR SeaSonde High-Frequency (HF) radar system has been operating in the Gulf of Naples (Tyrrhenian Sea) since 2004. HF radars use first-order echoes to determine surface currents, while second-order ones can be exploited to estimate the main parameters characterising the wave field: significant wave height, direction and period. Waves were studied in the Gulf of Naples at each radar site over a range cell located between 5 and 6 km from the coast. The data acquired in the reference year 2010 were compared with the measurements recorded over the same period by a directional wave buoy installed in the outer part of the basin. This study aims at verifying the agreement between the recordings of the two platforms, in order to test the robustness of the HF radar-derived wave measurements. In addition, the analyses here presented investigate the seasonal patterns of the wave parameters, showing the different responses of the wave field in different sectors of the basin and the responsiveness of HF radars in critical environmental conditions. The two platforms showed consistent results, indicating the reliability of HF radars as wave measurement tools and opening the way to further applications in wave monitoring and analysis in coastal areas.
1. Introduction
High frequency (HF) radars are nowadays invaluable instruments for a synoptic, basin-scale observation of oceanographic processes (Paduan and Washburn Citation2013), and their potential is currently being explored in the framework of operational oceanography, to provide data to be assimilated into numerical models in order to enhance hind- and forecast of the ocean state (e.g. Iermano et al. Citation2016). Most of the available literature on these systems has focused on the extraction of surface currents (e.g. Paduan and Rosenfeld Citation1996; Molcard et al. Citation2009; Uttieri et al. Citation2011; Bellomo et al. Citation2015; Cianelli et al. Citation2015, Citation2013; Lorente et al. Citation2015, Citation2016; Kalampokis et al. Citation2016; see Ranalli et al. Citation2017 for considerations on the peculiar geometric nature of HF radar current data), although HF radars have also the potential of analysing the characteristics of the surface wave field in terms of wave height, direction and period (e.g. Lipa et al. Citation1990, Citation2006; Gurgel et al. Citation2006; Wyatt and Green Citation2009; Long et al. Citation2011; Wyatt Citation2011; Falco et al. Citation2016; Rubio et al. Citation2017) as well. Knowledge of wave conditions is fundamental in urbanised coastal areas for a wide variety of applications, including uses in physical oceanography, wave forecasting, coastal erosion modelling, flood warning, coastal engineering and ship traffic management (Wyattet al. Citation2005a).
HF radars employ the echo backscattered by the rough sea surface, according to the physics first described by Crombie (Citation1955). In the presence of Bragg scattering, the signal due to the waves travelling radially with respect to the antenna (either approaching or moving away from it) yields a Doppler-shifted peak as a result of the current field within which the wave is propagating (Barrick et al. Citation1977). The first-order echoes generally produce strong signals, used for robust measurements of surface currents (Paduan and Graber Citation1997; Gurgel et al. Citation1999). Additional contributions to the Doppler signature are due to nonlinear wave interactions and double-scattering processes leading to second-order echoes (Lopez et al. Citation2016) which, in turn, can be used to extract information on the wave field itself (Barrick Citation1986; Gurgel et al. Citation1999; Lipa and Nyden Citation2005). Barrick (Citation1977a) established a relationship between the ocean wave directional spectrum and the radar Doppler spectrum one. In order to retrieve information about the wave parameters, this relationship has to be inverted using either empirical (Barrick Citation1977b; Wyatt Citation1988, Citation2002; Gurgel et al. Citation2006), model-fitting (Wyatt Citation1986; Lipa and Nyden Citation2005) or full numerical inverse methods (Lipa Citation1978; Wyatt Citation1990; Hisaki Citation1996, Citation2015; Wyatt Citation2000; Green and Wyatt Citation2006). Second-order echoes, however, are weaker and noisier than first-order ones, posing some limitations on their utilisation (Gurgel et al. Citation2006), and making the analysis of the spectrum for wave applications a still-developing topic (Wyatt et al. Citation2005b; Lopez et al. Citation2016).
In low-sea states, the limit on detectable wave height is the spectral noise. When the second-order echo is too small compared to spectral noise, generally with surface waves below ∼0.5 m, this leads to erroneous readings or data gaps (Wyatt and Green Citation2009; Wyatt et al. Citation2011; Atan et al. Citation2016; Lopez et al. Citation2016). In high-sea states, the wave spectrum saturates, first- and second-order echoes merge together making the retrieval of wave parameters impracticable (Lipa and Nyden Citation2005), and reducing the maximum range of operation of the radar (Wyatt and Green Citation2009). The operating frequency of a radar site sets an upper limit to the detectability of waves (e.g. Lipa et al. Citation1990; Wyatt and Green Citation2009). The maximum recordable wave height hsat depends upon the operating wavelength λ following the equation (Lipa and Nyden Citation2005):(1)
(1) where
(2)
(2) is the radar wavenumber. The lower the operating frequency of a radar, the more efficiently are high-sea states recorded (Lipa et al. Citation1990; Wyatt and Green Citation2009). Wave heights above this threshold are not accurately measured, resulting in either underestimation (Lipa and Nyden Citation2005; Lopez et al. Citation2016) or overestimation (Wyatt and Green Citation2009 and references therein) of real waves. These relationships hold in deep waters, when the following condition is verified (Lipa et al. Citation2008):
(3)
(3)
d and L being the water depth and the dominant ocean wavelength, respectively. As the bottom becomes shallower, the second-order spectral energy increases and hsat diminishes (Lipa et al. Citation2008).
HF radar retrieved waves from different systems (CODAR SeaSonde, WERA, PISCES, OSCR) have been typically validated – qualitatively and quantitatively – using wave buoys (e.g. Wyatt et al. Citation1999, Wyatt et al. Citation2005a; Atan et al. Citation2016), while Lipa and Nyden (Citation2005) assessed radar performance through comparison with a bottom installed electromagnetic current metre equipped with a pressure transducer. Studies on the comparison between HF radar, wave buoys and wave model (Wavewatch III, SWAN and WAM), in particular on the topic of data assimilation, are also present in literature (Caires and Wyatt Citation2003; Siddons et al. Citation2009; Waters et al. Citation2013; Hisaki Citation2014; Lorente et al. Citation2018).
To date, studies using HF radars to evaluate wave features have been mostly limited to short periods (up to a few months; e.g. Lipa et al. Citation1990; Wyatt Citation1997; Wyatt et al. Citation1999, Citation2011; Siddons et al. Citation2009; Wyatt and Green Citation2009; Jin et al. Citation2016; Lopez et al. Citation2016), or to specific events (e.g. tsunamis: Lipa et al. Citation2006, Citation2012; Gurgel et al. Citation2011; storms: Lipa et al. Citation2014). To the very best of the authors’ knowledge, only few works have so far delved into the assessment of wave retrieval by HF radars over long periods, namely Wyatt et al. (Citation2006) in UK, Long et al. (Citation2011) in Central California, and Atan et al. (Citation2016) in Galway Bay (Ireland).
In the present contribution, we further explore the robustness of wave measurements from SeaSonde HF systems by assessing the performance of a network of three radars operating in the Gulf of Naples (GoN) (Tyrrhenian Sea, Western Mediterranean Sea). This is achieved by presenting a year-long comparison of wave parameters (significant wave height, direction and period) between the three HF sites and a wave buoy deployed in the outer part of the basin. The results show good consistency between the measurements obtained by the two platforms, depicting seasonal patterns in the wave field and highlighting specific responses in different sectors of the basin. Additionally, this research focuses on the performance of SeaSonde HF radars in monitoring waves over long periods and under the action of season-dependent meteorological forcings, paving the way to applications in other coastal areas.
2. Study area
The GoN is a semi-enclosed basin located in the South-Eastern Tyrrhenian Sea (). It is delimited by the Sorrento Peninsula and the island of Capri to the south, and by Ischia and Procida islands to the north. The average depth of the basin is 170 m, but the Magnaghi and Dohrn canyons can reach depths of up to 800 m and, representing the main bathymetric feature of the Bocca Grande area (i.e. the area between Ischia and Capri islands) (Cianelli et al. Citation2012 and references therein), the main aperture of the GoN towards the Tyrrhenian Sea. The local orography shows peculiar features, with the Vesuvius volcano (elevation: 1.281 m), the hills in the Naples urban area (elevation up to 450 m) in the northern part, and the Lattari mountains (Mount Faito: 1.131 m) in the south-east.
Figure 1. Map of the Gulf of Naples (Tyrrhenian Sea, Western Mediterranean Sea; see inset) with the locations of the three HF radar sites, of the ISPRA weather station and of the PC wave buoy. The red partial circles represent RC5 (see text). Toponyms of the main geographic sites are indicated. The bathymetric and orographic contours are spaced every 100 m; elevation isolines are plotted starting from 300 m for graphical reasons. Coastline data: NOAA National Geophysical Data Center, Coastline extracted: WLC (World Coast Line), Date Retrieved: 2015 April 1, http://www.ngdc.noaa.gov/mgg/shorelines/shorelines.html; bathymetric and elevation data from Amante and Eakins (Citation2009) [accessed 2011 Sept 8].
![Figure 1. Map of the Gulf of Naples (Tyrrhenian Sea, Western Mediterranean Sea; see inset) with the locations of the three HF radar sites, of the ISPRA weather station and of the PC wave buoy. The red partial circles represent RC5 (see text). Toponyms of the main geographic sites are indicated. The bathymetric and orographic contours are spaced every 100 m; elevation isolines are plotted starting from 300 m for graphical reasons. Coastline data: NOAA National Geophysical Data Center, Coastline extracted: WLC (World Coast Line), Date Retrieved: 2015 April 1, http://www.ngdc.noaa.gov/mgg/shorelines/shorelines.html; bathymetric and elevation data from Amante and Eakins (Citation2009) [accessed 2011 Sept 8].](/cms/asset/823d8454-b304-45da-ac11-5b508a0f853a/tjoo_a_1565853_f0001_oc.jpg)
The main local factor influencing the surface circulation of the GoN is wind, with recognisable seasonal regimes (Menna et al. Citation2007; Cianelli et al. Citation2013, Citation2015, Citation2017). Intense NNE–NE winds are typical of the winter season, with occasional alternations with SW ones associated with the transit of depression systems (Menna et al. Citation2007). Owing to the deviating effect of the Vesuvius and of the hills surrounding Naples, a coast–offshore jet current develops under the effect of NNE–NE winds favouring water renewal (Menna et al. Citation2007; Cianelli et al. Citation2012, Citation2013, Citation2015, Citation2017). By contrast, south-westerly winds induce the formation of cyclonic and anticyclonic structures, and surface currents are mostly directed towards the coast (Menna et al. Citation2007; Cianelli et al. Citation2012, Citation2013, Citation2015). In late spring and summer, the main wind regime is represented by breeze (Menna et al. Citation2007). The absence of stronger, larger-scale wind forcing (e.g. the transit of low pressure systems) during this period of the year is typically due to the reinforcement of the Azores anticyclone, making this circulation scheme persistent and driving a 24 h clockwise rotation of the surface current field (Uttieri et al. Citation2011; Cianelli et al. Citation2015).
As far as wave climate in the area, its general description can be drawn from measurements gathered between mid-1980s and early 2000s by a non-directional wave buoy deployed along the Sorrento Peninsula, which provided information also on extreme events over the area (Pugliese Carratelli and Sansone Citation1987; Benassai et al. Citation1994a, Citation1994b; Buonocore et al. Citation2003). These previous studies have shown that the wave field was subject to seasonal variations, the maximum wave heights being recorded in winter and autumn with values up to 4.8 m during sea storms, while lower waves (0.4–0.6 m) were scored in summer.
3. Material and methods
3.1. HF radars
Wave measurements in the GoN have been collected through an HF radar system based on SeaSonde 25 MHz transceiving stations (CODAR Ocean Sensors, Mountain View, California, USA), used for the simultaneous measurement of the surface current and wave fields (Falco et al. Citation2016). The network, operated by the Department of Science and Technology at the ‘Parthenope’ University of Naples, was started in 2004 with two monostatic antennas, in Portici (PORT) and Massa Lubrense (SORR), and then expanded in 2008 through the installation of a third site in Castellammare di Stabia (CAST) (). This configuration was ideal for wave analysis over the basin, as PORT and CAST covered the internal part of the GoN near the coast, while SORR monitored a sector representative of the external part of the basin (). The network is presently operational, although since 2013 the SORR site has been discontinued.
In SeaSonde systems, information on wave parameters (significant wave height (HsHF), centroid period (THF) and direction (θHF)) are extracted from the second-order spectrum by applying a Pierson–Moskowitz model (Lipa and Nyden Citation2005). This model has proven robust enough to describe unimodal energy spectra, satisfactorily describing the wave field on numerous occasions (Lipa et al. Citation2018). The wave characteristics are measured along equally spaced (1 km), circular annuli (range cells, RCs) centred on the antenna. For each RC, a single spatially averaged value for each wave parameter is then provided. In the GoN system, single spectra were recorded and averaged every 10 min over 12 RCs for PORT and SORR sites, and over 15 RCs for CAST with CODAR proprietary software (Seasonde Radial Suite R7u2). According to Equations (1) and (2), for the 25 MHz system operating in the GoN λ = 12 m and thus k0 = 0.52 m−1, resulting in hsat ∼4 m, with a minimum recordable HsHF ≈ 0.5 m.
In the present work, wave data collected from all three sites operating in the GoN over the reference year 2010 were analysed. This year was chosen as all radar sites operated optimally, with only minor discontinuities in the acquisition. As a reference (see Section ‘HF Radar RC Selection’ for details), attention was focused on data retrieved from a range cell representative of the annulus located between 5 and 6 km from the coast (RC5) (), along which wave conditions are homogeneous as verified through comparisons with WWIII wave model (Saviano et al. Citation2017; Saviano Citation2018). Due to the geometry of the basin and to the fields of view of the antennas, the wave fields observed by each HF radar were not overlapping (). While this prevented a comparison of measurements from different antennas for the same area, it allowed the analysis of wave parameters over different sub-basins of the GoN, highlighting region-specific properties. A preliminary assessment of radar performances in wave retrieval from the PORT site over the entire year 2009 has been presented in Falco et al. (Citation2016).
3.2. Wave buoy
Wave measurements collected by the radar network of the GoN in 2010 were compared with the simultaneous recordings of a wave buoy deployed at Punta Carena (Capri Island) in the outer part of the basin (PC buoy; latitude: 40.535°N, longitude: 14.190°E, see ), over a depth of 100 m. A SEAWATCH Wavescan Buoy, assembled by Fugro OCEANOR (Trondheim, Norway), was managed by the Civil Protection Department of the Campania Region and was operating from August 2009 to mid-December 2010 and from mid-March to November 2012. The buoy was equipped with a directional wave data sensor and collected information about: significant wave height (Hsb), mean (Tm_b) and peak (Tp_b) periods, and wave direction (θb). The buoy provided two estimates of wave period: peak (or dominant, Tp_b), which is the inverse of the frequency corresponding to the maximum wave height recorded in the spectrum; and mean (or average, Tm_b), defined as the square root of the ratio of the zeroth spectral moment to the second spectral moment. The buoy was also equipped with meteorological sensors: HMP45A and HMP45D probes for relative humidity and air temperature, PTB220 barometer for atmospheric pressure and wind gauge (WindSonic). Data were output at 30 min intervals.
3.3. Meteorological data
To determine the influence of wind on wave parameters, wave datasets (from HF radars and PC buoy) were integrated with the data acquired from the weather station managed by the Istituto Superiore per la Protezione e la Ricerca Ambientale (ISPRA) and located in the port of Naples (Molo del Carmine; latitude: 40.840°N; longitude: 14.275°E; anemometric sensor height: 10 m a.m.s.l.; data freely downloadable at http://www.mareografico.it/) ().
The station was equipped with wind speed (SIAP + MICROS, mod. T006 TVV) and direction (SIAP + MICROS, mod. T007 TDV) transducers (data output frequency: 10 min), and with a barometric sensor (SIAP + MICROS, mod. PA9880), (data output frequency: 1 h).
3.4. Assessment of wave characteristics
In previous literature focusing on HF radar-buoy intercomparisons (e.g. Lipa et al. Citation1990; Wyatt et al. Citation1999; Howarth et al. Citation2007; Wyatt and Green Citation2009; Atan et al. Citation2016; Jin et al. Citation2016), the in situ instrument was typically installed inside the region covered by the radar, allowing for the direct validation of HF radar measurements. As evident from , in the current case the PC buoy was deployed in a region not directly covered by HF radars, with an average distance from the RC5 used in the comparison of ∼20 km, but accounting for the larger scale dynamics of the Tyrrhenian Sea. The comparison of wave measurements from the radars and the buoy was thus aimed at verifying the agreement between the platforms in terms of wave pattern and sea states, rather than as a strict validation of radar measurements. To further complement the analysis, a comparison with previously published literature (Pugliese Carratelli and Sansone Citation1987; Benassai et al. Citation1994a, Citation1994b; Buonocore et al. Citation2003) was carried out.
In the present work, the assessment of yearly wave characteristics in the GoN was carried out addressing different issues, namely:
reconstruction of yearly and seasonal atmospheric pressure and wind regimes over the basin of interest;
identification of the optimal RC for the HF radar data;
data quality assessment for both HF radar and wave buoy;
general analysis of wave characteristics for each site using both HF radar and wave buoy datasets in relation to atmospheric pressure for yearly and seasonal periods;
accuracy assessment of HF radar measurement relative to the wave buoy recordings using statistical analyses, including root mean square error (RMSE) and correlation coefficient (r);
comparison of wave periods between HF radars and wave buoy;
identification of the differences in the acquisition of the three radar stations in terms of HsHF in relation to their position in the GoN.
Owing to the specific sampling rates of each instrument, wave parameters from the HF radars were subsampled at 30 min intervals, for consistency with buoy measurements, while atmospheric pressure from buoy data were subsampled at 1 h intervals, consistently with the ISPRA weather station recordings. For the reference year 2010, the wave buoy did not acquire wind data, thus only ISPRA measurements were used. In this work, we refer to the meteorological classification of seasons as given in Glickman (Citation2000). In addition, the typical meteorological and oceanographic directional conventions are used, i.e. directions indicate the provenance of winds or waves.
3.5. HF radar RC selection
As discussed in a previous section, in SeaSonde systems wave data are retrieved along single RCs, and the acquisition depends on the sea surface characteristics along the cell itself. As a consequence, the percentage of data recorded might differ among RCs.
The performance of HF radars are limited by numerous sources of error, as discussed by Laws et al. (Citation2010) and references therein for surface current measurements. Environmental noise, such as radio-frequency interferences, and undesired echoes, such as ship ones, can generate disturbing spectral signatures which contaminate the values of Doppler frequencies and spectral amplitudes of ocean waves. Additional errors may also be due to existing interpretation methods (integral inversion and model fitting) and to limitations of these when waveheight exceeds a limiting value defined by the radar frequency. These errors decrease the accuracy of raw measurements, especially at far distances where radar signals are weak.
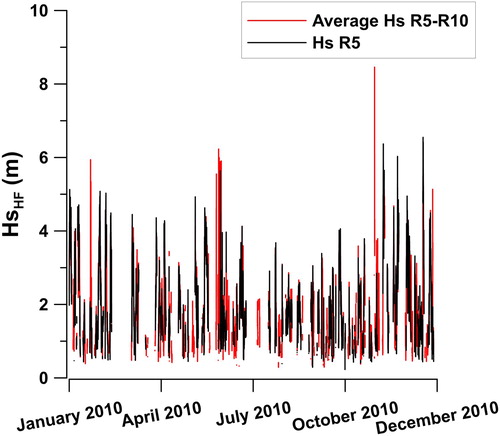
To improve data quality, in the literature SeaSonde data are often averaged among the best acquisition RCs (e.g. Long et al. Citation2011; Atan et al. Citation2016). In this study, we looked for the highest percentage of captured data and performed preliminary sensitivity studies on the reproduction of the trend of acquisition between the RCs, both on the average data between RCs and on single cells alone. Results show that, for all three radar sites of the GoN, the most populated RCs were comprised between 4 and 11 km from the coast (data not shown). On these grounds, for all three HF radar sites, the RC selected for the present research is RC5, located between 5 and 6 km from the coast. This represents an optimal operational trade-off, as it guarantees the highest number of recordings at an intermediate distance from the coast: close enough, so as the sea echo intensity is sufficiently high to ensure good data quality, but at the same time deep enough to avoid wave breaking. The mean depths of RC5 for PORT, CAST and SORR are 117, 65 and 98 m, respectively, in compliance with the limits prescribed by Equation (3) and by Lipa et al. (Citation2008). As an example, reports the year-long timeseries of HsHF from RC5 alone and from the average RC5-RC10 for SORR station. It is evident that RC5 presents a good percentage of captured data (35%), preserving the seasonal pattern of the RC5-RC10 mean (40% of captured data), and thus representing a good proxy for the wave field over a larger sector.
Figure 2. Comparison of HsHF derived for the average of range cells RC5-RC10, (red) and for the single RC5 (black) for the SORR site over the entire year 2010. Data from PORT and CAST are consistent with SORR, but are not shown here.
3.6. Data quality assessment
A quality control filter was applied to both HF radar and buoy wave datasets, in line with the methods discussed in Long et al. (Citation2011). The datasets were preliminarily reprocessed to eliminate spurious data and spikes following the procedure explained below. The timeseries were divided into consecutive windows of 72 samples (corresponding to 12 h of observations), excluding from further analyses those windows containing less than 25% of data (spurious data filtering). For each of the time series thus obtained, the difference in the wave parameters (Hs, T and θ) between consecutive steps was calculated and the associated mean and standard deviations were computed. The time series was then processed again for spikes and thus disregarding all those samples falling outside the mean ± 5 × standard deviation range (spike filtering), similarly to the procedure discussed in Buonocore et al. (Citation2003) in the same basin. This threshold was adopted following numerous sensitivity tests, aimed at verifying the capacity of eliminating spikes without altering the observed pattern of wave motion.
3.7. Statistical analyses
Descriptive and numerical statistics were used to analyse the results. Best linear fit of scatter plots were used to analyse the correlation between datasets. The correlation coefficient r measured the strength and direction of the relationship between the variables on a scatterplot. The root mean square error (RMSE), i.e. the square root of the variance of the residuals, indicated the absolute fit of the model to the data. The RMSE can be interpreted as the standard deviation of the unexplained variance and has the useful property of being in the same units as the response variable.
4. Results
4.1. Atmospheric pressure and wind regimes
Atmospheric pressure was used here to identify periods of low pressure impacting on the basin, which generally indicate the occurrence of coastal storms. The comparison of the datasets recorded by the ISPRA station and the PC buoy returned an excellent agreement with a correlation coefficient equal to 0.99 (result not shown). The trend is typical of the defined geographical area, with stable high pressure in summer and marked low-pressure systems in winter and autumn, as discussed in Menna et al. (Citation2007). Since the ISPRA dataset was more consistent in terms of acquisition, it was selected for the comparative analysis with the wave parameters in the present study.
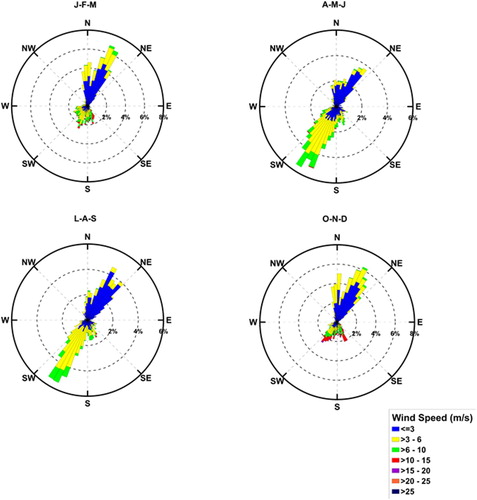
Wind is a dominant factor contributing to surface wave formation, thus an assessment on the influence of wind speed and direction on wave occurrence was conducted. shows the seasonal wind roses at ISPRA station. As expected from previous works (Menna et al. Citation2007; Cianelli et al. Citation2015, Citation2017), in spring and summer the wind regime is driven by breezes, with winds from SW and NE alternating over the day. In winter and autumn, the first quadrant is the dominant sector, though the wind magnitude is higher for winds blowing from SW (i.e. from the Tyrrhenian Sea) in correspondence with the transit of depression systems.
Figure 3. Seasonal wind roses of data collected by the ISPRA weather station in the reference year 2010. The radial scale reports wind frequency, while each spoke is colour-divided according to wind speed ranges (see legend).
4.2. Seasonal characteristics of the wave field
An assessment of the seasonal features of the wave field using Hs and θ acquired from both HF radars and the wave buoy is reported in and , together with the operational timelines of each instrument.
Figure 4. Yearly comparison between HF radar and PC wave buoy datasets in the year 2010 in relation to atmospheric pressure (from ISPRA weather station). The line at the bottom of each plot represents the operational timeline of the instruments (red: PC wave buoy; blue: HF radar). The dotted lines represent the theoretical upper and lower detectability thresholds of HF radars.
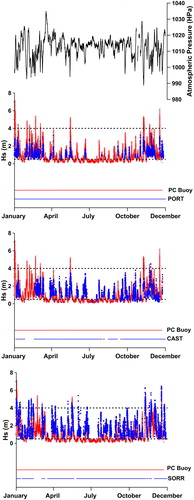
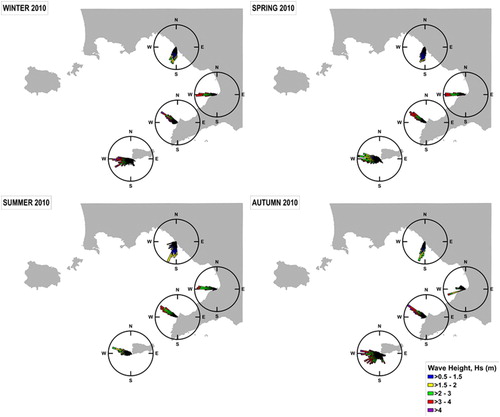
Figure 5. Seasonal wave rose diagrams for year 2010 for the three HF radar stations and the PC wave buoy.
The comparison of HsHF and Hsb in relation to atmospheric pressure () shows that the patterns of the timeseries were comparable between the PC buoy and the HF radars. The wave field in autumn and winter behaved differently than in spring and summer, with a pattern closely associated with the pressure field acting over the basin, which itself expresses a seasonal behaviour (as discussed in a previous section). In winter and autumn, numerous low-pressure systems passed over the basin, with frequent stormy and windy events. This resulted in severe sea state, with both HsHF and Hsb reaching values consistent with previously published literature, as for the extreme event in winter 1987 with Hs equal to 4.76 m (Benassai et al. Citation1994b; Buonocore et al. Citation2003). By contrast, in spring and summer the set up and reinforcement of the Azore anticyclone determined the onset of moderate breeze systems (Uttieri et al. Citation2011; Cianelli et al. Citation2012, Citation2013, Citation2015, Citation2017). These determined a stable and persistent high-pressure field, with lower Hs (both for HsHF and Hsb). The year-long data time series showed good consistency of the wave patterns recorded by all platforms (HsHF and Hsb). As expected, PORT and CAST recorded HsHF values lower than the concomitant ones by SORR site, which is closer to the open Tyrrhenian waters. SORR presented the most complete radar-derived dataset (with minimal gaps) and the most comparable one, in term of Hs, to the wave buoy measurements, as a consequence of the geographical proximity and of the similarity (morphological and bathymetrical) of the sites.
The yearly maximum Hsb was 7.1 m, while for the PORT, CAST and SORR stations the highest observed HsHF were 3.3, 4.5 and 6.4 m, respectively, in agreement with historical data in the GoN (Pugliese Carratelli and Sansone Citation1987; Benassai et al. Citation1994a, Citation1994b; Buonocore et al. Citation2003). The theoretical upper limit for a 25 MHz radar (see Equation (1)) was frequently exceeded in the SORR dataset in agreement with similar concomitant recordings from the wave buoy. As a consequence, these values were not disregarded but kept in the dataset.
The percentage of captured data was higher in autumn and winter for all the HF radar stations, owing to the low sea-state limitations discussed above. It is evident from that, as soon as Hsb went below the 0.5 m threshold, the HF radars could not detect waves efficiently, although they were functioning normally, an event particularly evident in spring-summer during the breeze regime.
The analysis of θ in highlights again a site-dependent pattern. The sector of wave provenance was relatively constant over the seasons for each individual HF station and for the PC buoy, due to the geomorphological configuration of GoN. In autumn and winter stronger winds resulted in higher wave events with dominant wave direction between 225° and 280° for the PC buoy, between 180° and 210° for PORT, 265° and 275° for CAST and 270° and 300° for SORR. The wave observations by the PC buoy are in agreement with those described in Morucci et al. (Citation2016) for other buoys deployed in the Tyrrhenian Sea, whose particular geomorphological and meteorological characteristics determine a marked directionality with high waves mainly originating from the third quadrant.
4.3. Variability in Hs between HF radar and buoy
Further investigations about the variability in Hs between the two types of platforms were conducted. As explained above, HF radars cannot detect waves with Hs < 0.5 m, so the PC buoy dataset was filtered to remove all values below this threshold, accounting to approximately 35% of the entries. As a consequence, the statistical analysis was conducted on the HF radar dataset and the filtered wave buoy dataset.
shows the seasonal scatter plot between HsHF and Hsb, while the skill metrics (r and RMSE) between the Hs values recorded by the PC buoy and the three HF stations are provided in . As a general outcome, a good agreement between the PC buoy and the HF SORR site in terms of r and RMSE was scored, while lower consistencies were reported between the buoy and the two most internal radars (PORT and CAST). It is worth remembering here that, since the radars and the buoy were not co-located, the results here presented should be interpreted primarily in terms of patterns, rather than of their strict numerical value. In winter and autumn all the platforms recorded Hs higher than 3 m; HF SORR and the PC buoy in this season often recorded concomitant Hs values higher than 4 m, confirming that the overshoot of the radar was realistic. These results were further supported by preliminary comparisons with WWIII wave model (Saviano et al. Citation2017; Saviano Citation2018).
Figure 6. Seasonal scatter plot for year 2010 of Hs obtained from the HF radar data (HsHF) and from the PC wave buoy (Hsb) measurements.
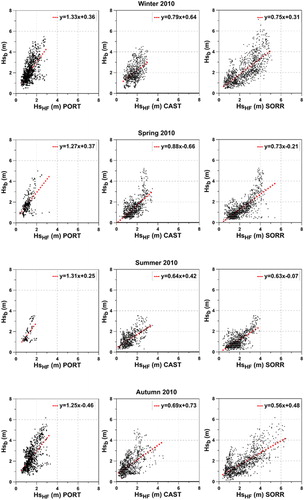
Table 1. Statistical analysis of the agreement between Hs measurements recorded by HF radar stations (HsHF) and PC buoy (Hsb).
reports the r and RMSE values for different radar systems discussed in earlier studies on the validation studies of HF radar data compared with in situ wave measurements. The skill metrics of the present study are in line with comparison analysis presented in the literature and confirm the operational usefulness of HsHF data to analyse the wave characteristics.
Table 2. Review of earlier studies on the validation studies of Hs from HF radar data with in situ wave measurements.
4.4. Wave period estimates
The analysis carried out in the present work also focused on the assessment of wave period (T) estimates from the HF radars and the wave buoy. As discussed in previous sections, both instruments provided different output periods: the radar returned a period representing the centroid of the model being fitted to the second-order Doppler spectrum (THF), while the buoy provided the mean (Tm_b) and peak (Tp_b) periods. The THF analysis does not show any remarkable seasonal-dependent variation.
As discussed in Long et al. (Citation2011), THF can be assumed as a stable estimator as Tm_b, while being more stable than Tp_b, which in turn is noisier. The comparison between Tm_b and THF for all the three HF stations for year 2010 is shown in . The scatter plots show a positive correlation in all comparisons, scoring correlation coefficients r of 0.77, 0.75 and 0.62 for PORT, CAST and SORR, respectively. In , the yearly statistical analysis and the yearly mean difference between the HF radar and buoy periods are reported for all radar sites. Negative values indicated that the THF was greater than Tm_b, while positive ones that THF was lower than Tp_b. THF estimates fell between Tm_b and Tp_b, in line with previous reports (Long et al. Citation2011; Lipa et al. Citation2014).
Figure 7. Scatter diagrams between Tm_b of the PC wave buoy and the centroid period THF of the HF radars in the reference year 2010. Panel (a) PORT; panel (b) CAST; panel (c) SORR.
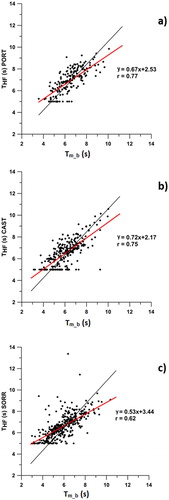
Table 3. Yearly correlation coefficient (r) between PC buoy mean period (Tm_b) and HF centroid period (THF), number of observations (N) of HF radar stations, mean difference between peak and mean buoy periods (Tm_b and Tp_b) and THF for the reference year 2010.
5. Discussion and conclusions
Monitoring the physical processes taking place in coastal areas is a fundamental prerequisite for proper integrated management of these systems. In this framework, HF radars presently provide a challenging opportunity of simultaneously measuring surface currents and wave parameters. The results presented in this work aspire to push the boundary of HF radar applications in terms of wave analysis. A yearly assessment of seasonal wave characteristics has been carried out, comparing measurements from a wave buoy and a network of three HF radars operating in the GoN. HF radar-derived measurements depict the same wave pattern retrieved by the PC buoy, both under calm (Hs between 0.5 and 1.0 m) and stormy conditions (Hs greater than 2.5 m). The agreement between the two systems points out the ability of both platforms to resolve the main structure of the wave field. The results indicate that the wave field is predominantly locally wind-driven, with specific patterns depending on the sub-basin of the GoN under analysis. In addition, our outcomes highlight that the percentage of recorded data is strongly linked to the typical GoN atmospheric seasonality. As in Atan et al. (Citation2016), the best comparative results are obtained in autumn and winter, when the wave field is more energetic and the limitations due to low sea-states are rarely met. This is in line with previous literature for the GoN (Pugliese Carratelli and Sansone Citation1987; Benassai et al. Citation1994a, Citation1994b; Buonocore et al. Citation2003; Falco et al. Citation2016), with higher Hs in winter-autumn and lower scores in spring-summer. In particular, for PORT site the results discussed in this work for year 2010 in terms of HsHF, θHF and THF are comparable to those scored in 2009 (Falco et al. Citation2016), evidencing recurrent seasonal patterns.
The analysed dataset allowed for the verification of the theoretical limits of HF radars in terms of the detectability range of waves. In particular, our results confirm the inability of these systems to detect waves with Hs < 0.5 m owing to reduced back-scattering from the sea surface, as discussed by Wyatt and Green (Citation2009). On the other hand, the comparison between PC buoy and HF radars (in particular, SORR site) under high sea-states shows a good performance of the radars. Under these circumstances, the theoretical limitations discussed in Equations (1) and (2) are not verified, the HF radar recordings being in good agreement with the buoy ones. In most of the cases, the SORR recordings were lower than the concurrent ones from the PC buoy, suggesting some degree of underestimation. However, since the radar and the buoy were not co-located, in our study we focused principally on the wave pattern rather than on the specific validation of the radar measurements. Moreover, literature reports on these specific issues are rather controversial: Lipa and Nyden (Citation2005) (for a SeaSonde system) and Lopez et al. (Citation2016) (for a WERA radar) reported an underestimation of HsHF, whereas Wyatt and Green (Citation2009) (for WERA and PISCES applications) reported an overestimation. As different sources of errors might play different roles (e.g. basin structure, optimisation and calibration of the radar system, inversion method), this topic deserves further study.
The selection of the RC was carried out with the specific aim of defining an optimal working distance to retrieve accurate wave measurements over well-populated circular annuli. Our work highlighted RC5 as the best trade-off, confirming the results by Lipa et al. (Citation2014) who noticed that coastal RCs provide more robust estimates of wave parameters by covering a smaller area compared to farther offshore annuli.
Our study supports previous findings on wave period estimates from SeaSonde systems (Long et al. Citation2011; Lipa et al. Citation2014). The radar centroid period includes all contributions to the second-order spectrum, from swells to wind waves (Lipa et al. Citation2014). Wave buoys, instead, may measure swell periods separately from wind wave ones (Long et al. Citation2011). The centroid period measured by HF radars with SeaSonde technology can be considered a stable estimator, like the buoy average one, though the latter favours higher wave frequencies (Long et al. Citation2011). The year-long results from the GoN demonstrate that the centroid period lies between the mean and peak periods measured by the wave buoy, in line with Long et al. (Citation2011) and Lipa et al. (Citation2014).
The results collected in the GoN demonstrate the potential of HF radars to efficiently monitor the wave field, highlighting site-specific characteristics and good agreement with the patterns recorded by traditional wave buoys. For a given basin, two or more radars can provide a more accurate recording of wave parameters in different sub-basins, particularly in those cases with varied orography and bottom topography. In the GoN, despite its being a semi-enclosed basin, we observe important differences in wave parameters among the areas covered by each three radars, in particular during storm events. This emphasises the ability of these systems to resolve the basin-scale variability in the wave field, in particular when compared with measurements returned by single instruments (e.g. bottom-installed pressure gauges, wave buoys) operating in a given area.
The operational use of HF radars is a topical issue of the INCREASE (Innovation and Networking for the integration of Coastal Radars into European mArine SErvices; www.cmems-increase.eu) project within the Copernicus Marine Environment Monitoring Service (CMEMS) framework. The project is presently developing the tools to integrate HF radar data into CMEMS, with a major focus on surface current fields. Radar-retrieved wave measurements from the GoN have been preliminarily compared with model-derived ones (Saviano et al. Citation2017), providing convergent descriptions of the wave field. It is thus conceivable that future developments of INCREASE as well as other projects will integrate HF radar-derived wave information, thus providing a more complete real-time description of coastal basins (Rubio et al. Citation2017).
The performance of the HF radar system operating in the GoN supports the idea that HF radars can qualify for wave field operational applications (Wyatt et al. Citation1999), though still needing standardised QA/QC procedures for both post-processing and real-time uses (Wyatt et al. Citation2011). In addition, direction-finding systems like SeaSonde require the validation of the assumption of spatial homogeneity along each annulus, while phased array ones do not (Graber et al. Citation1997; Wyatt et al. Citation2006). The accuracy of wave measurement must also be considered in relation to the inversion method adopted and to the operating frequency of the system. The major shortcoming of radar technology is the lack of continuity in measurements, due to inherent limitations in the physics of the phenomenon (Wyatt et al. Citation1999). Improvement in background theory and signal filtering (Wyatt et al. Citation2011), as well as the implementation of more refined algorithms for the retrieval of wave parameters (Lopez et al. Citation2016), are necessary actions to be taken in light of operational uses.
Acknowledgements
The Department of Science and Technology (formerly the Department of Environmental Sciences) of the ‘Parthenope’ University of Naples operates the HF radar system on behalf of the AMRA consortium (formerly CRdC AMRA), a regional competence centre for the analysis and monitoring of environmental risks. Our radar remote sites are hosted by the ENEA Centre of Portici, the ‘Villa Angelina Village of High Education and Professional Training’ and ‘La Villanella’ resort in Massa Lubrense, and the Fincantieri shipyard in Castellammare di Stabia, whose hospitality is gratefully acknowledged. The authors gratefully acknowledge the Civil Protection Department of the Campania Region for providing buoy data, the Port Authority of Capri Island for general information about the installation of the PC wave buoy, and the CAE company for providing technical information on sensors installed on the PC wave buoy. The authors wish to thank two anonymous Reviewers for their comments on a previous version of the manuscript. The authors owe a vote of thanks to Belinda Lipa and Donald Barrick for insightful comments and suggestions that improved an earlier version of the manuscript. Exchanges with Berardino Buonocore, Pierpaolo Falco and Giovanni Zambardino additionally stimulated discussion.
Disclosure statement
No potential conflict of interest was reported by the authors.
ORCID
Simona Saviano http://orcid.org/0000-0001-9482-8068
Alkiviadis Kalampokis http://orcid.org/0000-0001-5619-5407
Enrico Zambianchi http://orcid.org/0000-0001-5474-7466
Marco Uttieri http://orcid.org/0000-0001-7026-0156
Additional information
Funding
References
- Amante C, Eakins BW. 2009. ETOPO1 1 Arc-minute global relief model: procedures, data sources and analysis. Boulder, CO: NOAA Technical Memorandum NESDIS NGDC-24. National Geophysical Data Center, NOAA [accessed 2011 Sept 8]. doi:10.7289/V5C8276M.
- Atan R, Goggins J, Harnett M, Agostinho P, Nash S. 2016. Assessment of wave characteristics and resource variability at a 1/4-scale wave energy test site in Galway Bay using waverider and high frequency radar (CODAR) data. Ocean Eng. 117:272–291. doi: 10.1016/j.oceaneng.2016.03.051
- Atan R, Goggins J, Harnett M, Nash S, Agostinho P. 2015. Assessment of extreme wave height events in Galway Bay using high frequency radar (CODAR) data. In: Renewable Energies Offshore. CRC Press: Boca Raton, FL, USA; p. 49–56. doi:10.1201/b18973-8.
- Barrick DE. 1977a. Extraction of wave parameters from measured HF radar sea-echo Doppler spectra. Radio Sci. 12:415–424. doi: 10.1029/RS012i003p00415
- Barrick DE. 1977b. The ocean wave height nondirectional spectrum from inversion of the HF sea-echo Doppler spectrum. Remote Sens Environ. 6:201–227. doi: 10.1016/0034-4257(77)90004-9
- Barrick DE. 1986. The role of the gravity-wave dispersion relation in HF radar measurements of the sea surface. IEEE J Ocean Eng 11:286–292. doi: 10.1109/JOE.1986.1145156
- Barrick DE, Evans MW, Weber BL. 1977. Ocean surface currents mapped by radar. Science. 198:138–144. doi: 10.1126/science.198.4313.138
- Bellomo L, Griffa A, Cosoli S, Falco P, Gerin R, Iermano I, Kalampokis A, Kokkini Z, Lana A, Magaldi MG, et al. 2015. Toward an integrated HF radar network in the Mediterranean Sea to improve search and rescue and oil spill response: the TOSCA project experience. J Oper Oceanogr. 8:95–107.
- Benassai G, de Maio A, Mainolfi R, Sansone E. 1994a. Previsione delle onde estreme e persistenza delle mareggiate nel Golfo di Napoli. Annali I.U.N. 61:47–60.
- Benassai G, de Maio A, Sansone E. 1994b. Altezze e periodi delle onde significative nel Golfo di Napoli dall’aprile 1986 al giugno 1987. Annali I.U.N. 61:3–9.
- Buonocore B, Sansone E, Zambardino G. 2003. Rilievi ondametrici nel Golfo di Napoli. Annali I.U.N. LXVII:203–211.
- Caires S, Wyatt LR. 2003. A linear functional relationship model for circular data with an application to the assessment of ocean wave measurements. J Agric Bio Environ Stat. 1(153):8–153.
- Chen Z, Zhao C, Jiang Y, Hu W. 2011. Wave measurements with multi-frequency HF radar in the East China Sea. J Electromagn Waves Appl. 25:1031–1043. doi: 10.1163/156939311795253902
- Cianelli D, D'Alelio D, Uttieri M, Sarno D, Zingone A, Zambianchi E, Ribera d’Alcalà M. 2017. Disentangling physical and biological drivers of phytoplankton dynamics in a coastal system. Sci Rep. 7:15868. doi:10.1038/s41598-017-15880-x.
- Cianelli D, Falco P, Iermano I, Mozzillo P, Uttieri M, Buonocore B, Zambardino G, Zambianchi E. 2015. Inshore/offshore water exchange in the Gulf of Naples. J Mar Syst. 145:37–52. doi:10.1016/j.jmarsys.2015.01.002.
- Cianelli D, Uttieri M, Buonocore B, Falco P, Zambardino G, Zambianchi E. 2012. Dynamics of a very special Mediterranean coastal area: the Gulf of Naples. In: Williams GS, editor. Mediterranean ecosystems. New York: Nova Science Publishers. Inc.; p. 129–150. ISBN 978-1-61209-146-4.
- Cianelli D, Uttieri M, Guida R, Menna M, Buonocore B, Falco P, Zambardino G, Zambianchi E. 2013. Land-based remote sensing of coastal basins: use of a HF radar to investigate surface dynamics and transport processes in the Gulf of Naples. In: Alcântara E, editor. Remote sensing: techniques, applications and technologies. New York: Nova Science Publishers; p. 1–30. ISBN:978-1-62417-145-1.
- Crombie DD. 1955. Doppler spectrum of sea echo at 13.56 Mc/s. Nature. 175:681–682. doi: 10.1038/175681a0
- Falco P, Buonocore B, Cianelli D, De Luca L, Giordano A, Iermano I, Kalampokis A, Saviano S, Uttieri M, Zambardino G, et al. 2016. Dynamics and sea state in the Gulf of Naples: potential use of high-frequency radar data in an operational oceanographic context. J Oper Oceanogr. 9:s33–s45. doi:10.1080/1755876X.2015.1115633.
- Glickman TS. 2000. Glossary of meteorology. 2nd ed. Boston, MA: American Meteorological Society.
- Graber HC, Haus BK, Chapman RD, Shay LK. 1997. HF radar comparisons with moored estimates of current speed and direction: expected differences and implications. J Geophys Res. 102:18749–18766. doi: 10.1029/97JC01190
- Green JJ, Wyatt L. 2006. Row-action inversion of the Barrick–Weber equations. J Atmos Oceanic Technol. 23:501–510. doi: 10.1175/JTECH1854.1
- Gurgel K-W, Antonischki G, Essen H-H, Schlick T. 1999. Wellen radar WERA: a new ground-wave HF radar for ocean remote sensing. Coastal Eng. 37:219–234. doi: 10.1016/S0378-3839(99)00027-7
- Gurgel K-W, Dzvonkovskaya A, Pohlmann T, Schlick T, Gill E. 2011. Simulation and detection of tsunami signatures in ocean surface currents measured by HF radar. Ocean Dyn. doi:10.1007/s10236-011-0420-9.
- Gurgel K-W, Essen H-H, Schlick T. 2006. An empirical method to derive ocean waves from second-order Bragg scattering: prospects and limitations. IEEE J Ocean Eng. 31:804–811. doi: 10.1109/JOE.2006.886225
- Hisaki Y. 1996. Nonlinear inversion of the integral equation to estimate ocean wave spectra from HF radar. Radio Sci. 31:25–39. doi: 10.1029/95RS02439
- Hisaki Y. 2014. Inter-comparison of wave data obtained from single high-frequency radar, in situ observation and model prediction. J Remote Sens. 35:3459–3481. doi: 10.1080/01431161.2014.904971
- Hisaki Y. 2015. Development of HF radar inversion algorithm for spectrum estimation (HIAS). J. Geophys Res. 120:1725–1740. doi: 10.1002/2014JC010548
- Howarth MJ, Player RJ, Wolf J, Siddons LA. 2007. HF radar measurements in Liverpool Bay, Irish Sea, OCEANS 2007 – Europe. IEEE 1346-1351. 1:1–6.
- Iermano I, Moore AM, Zambianchi E. 2016. Impacts of a 4-dimensional variational data assimilation in a coastal ocean model of southern Tyrrhenian Sea. J Marine Sys. 154:157–171. doi:10.1016/j.jmarsys.2015.09.00 doi: 10.1016/j.jmarsys.2015.09.006
- Jin L, Wen B, Zhou H. 2016. A new method of wave mapping with HF radar. J Antennas Propag. 2016:1–7. Article ID 4135404. doi: 10.1155/2016/4135404
- Kalampokis A, Uttieri M, Poulain PM, Zambianchi E. 2016. Validation of HF radar-derived currents in the Gulf of Naples with Lagrangian data. IEEE Geosci Remote Sens Lett. 13:1452–1456. doi: 10.1109/LGRS.2016.2591258
- Laws K, Paduan JD, Vesecky J. 2010. Estimation and assessment of errors related to antenna pattern distortion in CODAR SeaSonde high-frequency radar ocean current measurements. J Atmos Ocean Technol. 27(6):1029–1043. doi: 10.1175/2009JTECHO658.1
- Lipa B. 1978. Inversion of second-order radar echoes from the sea. J Geophys Res. 83:959–962. doi: 10.1029/JC083iC02p00959
- Lipa B, Barrick D, Alonso-Martirena A, Fernandes M, Ferrer MI, Nyden B. 2014. Brahan project high frequency radar ocean measurements: currents, winds, waves and their interactions. Remote Sens. 6:12094–12117. doi: 10.3390/rs61212094
- Lipa BJ, Barrick DE, Bourg J, Nyden BB. 2006. HF radar detection of tsunamis. J Oceanogr. 62:705–716. doi: 10.1007/s10872-006-0088-9
- Lipa BJ, Barrick D, Isaacson J, Lilleboe PM. 1990. CODAR wave measurements from a north Sea semisubmersible. IEEE J Ocean. Eng. 15:119–125. doi: 10.1109/48.50697
- Lipa B, Daugharty M, Fernandes M, Barrick D, Alonso-Martirena A, Roarty H, Dicopoulos J, Whelan C. 2018. Developments in compact HF-radar ocean wave measurement. In: Yurish SY, editor. Advances in sensors: Reviews. Vol. 5. Barcelona: IFSA Publishing S. L; p. 469–495.
- Lipa B, Isaacson J, Nyden B, Barrick D. 2012. Tsunami arrival detection with high frequency (HF) radar. Remote Sens. 4:1448–1461. doi: 10.3390/rs4051448
- Lipa B, Nyden B. 2005. Directional wave information from the SeaSonde. IEEE J Ocean Eng. 30:221–231. doi: 10.1109/JOE.2004.839929
- Lipa B, Nyden B, Barrick D, Kohut J. 2008. HF radar sea-echo from shallow water. Sensors. 8:4611–4635. doi: 10.3390/s8084611
- Long RM, Barrick D, Largier JL, Garfield N. 2011. Wave observations from central California: SeaSonde systems and in situ wave buoys. J Sensors. 2011:1–18. Article ID 728936. doi: 10.1155/2011/728936
- Lopez G, Conley DC, Greaves D. 2016. Calibration, validation, and analysis of an empirical algorithm for the retrieval of wave spectra from HF radar sea echo. J Atmos Oceanic Technol. 33(2):245–261. doi: 10.1175/JTECH-D-15-0159.1
- Lorente P, Piedracoba S, Fanjul E. 2015. Validation of high-frequency radar ocean surface current observations in the NW of the Iberian Peninsula. Cont Shelf Res. 92:1–15. doi: 10.1016/j.csr.2014.11.001
- Lorente P, Piedracoba S, Sotillo MG, Aznar R, Amo-Baladrón A, Pascual A. 2016. Ocean model skill assessment in the NW Mediterranean using multi-sensor data. J Oper Oceanogr. 9:75–92.
- Lorente P, Sotillo MG, Aouf L, Amo-Baladrón A, Barrera E, Dalphinet A, Toledano C, Rainaud R, De Alfonso M, Piedracoba S, et al. 2018. Extreme wave height events in NW Spain: a combined multi-sensor and model approach. Remote Sens. 10:1. doi: 10.3390/rs10010001
- Menna M, Mercatini A, Uttieri M, Buonocore B, Zambianchi E. 2007. Wintertime transport processes in the Gulf of Naples investigated by HF radar measurements of surface currents. Nuovo Cimento. 30 C:605–622.
- Molcard A, Poulain PM, Forget P, Griffa A, Barbin Y, Gaggelli J. 2009. Comparison between VHF radar observations and data from drifter clusters in the Gulf of La Spezia (Mediterranean Sea). J Mar Syst 78:S79–S89. doi: 10.1016/j.jmarsys.2009.01.012
- Morucci S, Picone M, Nardone G, Arena G. 2016. Tides and waves in the central Mediterranean Sea. J Oper Oceanogr. 9:s10–s17.
- Paduan JD, Graber HC. 1997. Introduction to high-frequency radar: reality and myth. Oceanogr. 10:36–39. doi: 10.5670/oceanog.1997.18
- Paduan JD, Rosenfeld LK. 1996. Remotely sensed surface currents in Monterey Bay from shore-based HF radar (coastal ocean dynamics application radar). J Geophys. Res. 101:20669–20686. doi: 10.1029/96JC01663
- Paduan JD, Washburn L. 2013. High-frequency radar observations of ocean surface currents. Ann Rev Mar Sci. 5:115–136. doi: 10.1146/annurev-marine-121211-172315
- Pugliese Carratelli E, Sansone E. 1987. Rilievi ondametrici nel Golfo di Napoli. Annali I.U.N. 50:87–97.
- Ranalli M, Lagona F, Picone M, Zambianchi E. 2017. Segmentation of sea current fields by cylindrical hidden Markov models: a composite likelihood approach. J Roy Stat Soc C-App. doi:10.1111/rssc.12240.
- Rubio A, Mader J, Corgnati L, Mantovani C, Griffa A, Novellino A, Quentin C, Wyatt L, Schulz-Stellenfleth J, Horstmann J, et al. 2017. HF radar activity in European coastal seas: next steps toward a pan-European HF radar network. Front Mar Sci. 4:8. doi: 10.3389/fmars.2017.00008
- Saviano S. 2018. Retrieval of surface gravity waves in the Gulf of Naples from HF radar data [PhD]. Naples: University of Naples “Parthenope”.
- Saviano S, Besio G, Uttieri M, Zambianchi E. 2017. Wave measurements and models in the Tyrrhenian Sea. Geophys Res Abstracts. 19:1569.
- Siddons LA, Wyatt LR, Wolf J. 2009. Assimilation of HF radar data into the SWAN wave model. J Marine Syst. 77:312–324. doi: 10.1016/j.jmarsys.2007.12.017
- Uttieri M, Cianelli D, Buongiorno Nardelli B, Buonocore B, Falco P, Colella S, Zambianchi E. 2011. Multiplatform observation of the surface circulation in the Gulf of Naples (Southern Tyrrhenian Sea). Ocean Dyn. 61:779–796. doi:10.1007/s10236-011-0401-z.
- Waters J, Wyatt LR, Wolf J, Hines A. 2013. Data assimilation of partitioned HF radar wave data into Wavewatch III. Ocean Model. 72:17–31. doi: 10.1016/j.ocemod.2013.07.003
- Wyatt L. 1986. The measurement of the ocean wave directional spectrum from HF radar Doppler spectra. Radio Sci. 21:473–485. doi: 10.1029/RS021i003p00473
- Wyatt LR. 1988. Significant waveheight measurement with h.f. radar. Int J Remote Sens. 9:1087–1095. doi: 10.1080/01431168808954916
- Wyatt LR. 1990. A relaxation method for integral inversion applied to HF radar measurement of the ocean wave directional spectrum. Int J Remote Sens. 11:1481–1494. doi: 10.1080/01431169008955106
- Wyatt LR. 1997. The ocean wave directional spectrum. Oceanogr. 10(2):85–89. doi: 10.5670/oceanog.1997.31
- Wyatt LR. 2000. Limits to the inversion of HF radar backscatter for ocean wave measurements. J Atmos Oceanic Technol. 17:1651–1666. doi: 10.1175/1520-0426(2000)017<1651:LTTIOH>2.0.CO;2
- Wyatt LR. 2002. An evaluation of wave parameters measured using a single HF radar system. J Remote Sens. 28:205–218.
- Wyatt LR., IEEE. 2011. Wave mapping with HF radar. In: 2011 IEEE/OES 10th current, waves and turbulence measurements (CWTM). Monterey, CA, USA: IEEE; p. 25–30.
- Wyatt LR, Green JJ. 2009. Measuring high and low waves with HF radar, OCEANS 2009-EUROPE. IEEE Bremen. 1:1–5.
- Wyatt LR, Green JJ, Gurgel K-W, Borge JCN, Reichert K, Hessner K, Gnther H, Rosenthal W, Saetra O, Reistad M. 2003. Validation and intercomparisons of wave measurements and models during the EuroROSE experiments. Coastal Eng. 48:1–28. doi: 10.1016/S0378-3839(02)00157-6
- Wyatt LR, Green JJ, Middleditch A. 2005a. Wave, current and wind monitoring using HF radar. Proceedings of the IEEE/OES Eighth Working Conference on Current Measurement Technology, 53–57.
- Wyatt LR, Green JJ, Middleditch A. 2011. HF radar data quality requirements for wave measurement. Coastal Eng. 58:327–336. doi: 10.1016/j.coastaleng.2010.11.005
- Wyatt LR, Green JJ, Middleditch A, Moorhead MD, Howarth J, Holt M, Keogh S. 2006. Operational wave, current and wind measurements with the Pisces HF radar. IEEE J Oceanic Eng. 31:819–834. doi: 10.1109/JOE.2006.888378
- Wyatt LR, Liakhovetski G, Graber H, Haus B. 2005b. Factors affecting the accuracy of HF radar wave measurements. J Atmos Oceanic Technol. 22:847–859. doi: 10.1175/JTECH1728.1
- Wyatt LR, Thompson SP, Burton RR. 1999. Evaluation of HF radar wave measurement. Coastal Eng. 37:259–282. doi: 10.1016/S0378-3839(99)00029-0