
ABSTRACT
The Integrated Management System for the Aquaculture (SIMA in Spanish) is a comprehensive interoperable information and modelling platform that has been developed to provide the Chilean Aquaculture industry and government agencies with access to improved environmental intelligence allowing them to make better informed strategic and operational decisions. SIMA is built upon an integrated system of biophysical production data, catchment and coastal-marine models, visualisation, reporting and risk-based decision support tools. This communication briefly describes the SIMA architecture and components and provides examples of applications of how it can be used to inform policy and management decisions, and discusses challenges and key learnings and considers future developments and applications.
Introduction
Aquaculture is the fastest growing food producing sector in the world, with a global aquaculture production in 2016 of 110.2 million tonnes, an estimated value of US$243.5 billion and employing ∼ 19.3 million people (FAO Citation2018a). Given this growth, there is a great expectation that aquaculture – enabled by technical innovation that will further increase resource efficiency – will bridge the future global supply-demand gap for aquatic food (Waite et al. Citation2014). In this regard, aquaculture is considered a positive means of addressing several of the UN sustainable development goals (SDGs) adopted in 2015 (United Nations Citation2015) – including ending poverty (SDG 1), ensuring universal food security (SDG 2), good health outcomes (SDG 3), employment and economic growth (SDG 8) and sustainable marine ecosystems (SDG 14).
However, aquaculture must also overcome a number of challenges that threaten its operation and sustainability and the surrounding environment in which it operates, such as eutrophication; climate-related extreme events and changing habitat suitability; ocean acidification; the increasing occurrence and severity of algal blooms and red tides; and outbreaks of parasitic, bacterial and viral diseases that have led to high mortalities, interrupted production cycles, massive economic losses, unemployment and supply interruptions that affect markets and prices (Quiñones et al. Citation2019).
To ensure the long-term health and prosperity of the industry it is now recognised that four facets of sustainability – social, economic, environmental, and governance – will need to be addressed. Carrying capacity needs to be defined at a regional level and in doing so needs to recognise the many interconnected forms (McKindsey et al. Citation2006; Ross et al. Citation2013): physical (limits on suitable space available), production (based on operational details), ecological (broader environmental impacts on water quality and the food webs surrounding farms), economic (dictates when the industry is profitable) and social (details when the industry is considered socially acceptable by the broader community).
Best-practice from around the world (e.g. Norway, www.barentswatch.no; BlueBridge, https://www.bluebridge-vres.eu) indicates that a combination of industry’s green narratives with integrated-tiered information delivery systems and a hierarchical risk assessment platform is an effective means of ensuring that aquaculture does not breach these many dimensions of carrying capacity and has been demonstrated to provide countries such as Norway with a market advantage (Fløysand and Jakobsen Citation2017; Asche et al. Citation2018). Such decision support tools combined with databases, information services and underpinned by various models (e.g. epidemiological, statistical, environmental and system-wide) help to create tools that can communicate the current status and trends – derived from public and industry data – along with predicted future states to inform management decisions and to address strategic planning scenarios.
SIMA Austral Footnote1 is such an information system (Steven et al. Citation2018). It was commissioned by the Chilean government in 2015, to address the sustainability and competitiveness of the still growing USD$3.5 billion Chilean aquaculture industry of the Austral region (Patagonia), which focuses mainly on the production of salmon (∼90% of production, >663,000 tonnes in 2016), but also includes mussels, seaweed, oysters and abalone. This Industry has been challenged by disease outbreaks, most notably in 2007 when an outbreak of viral Infectious Salmon Anaemia (ISA) led to the collapse of salmon production resulting in the loss of 400,000 tonnes of fish, and up to 20,000 jobs (e.g. Mardones et al. Citation2009; Iizuka and Katz Citation2017). More recently, the occurrence of harmful algal blooms in early 2016 and 2018 have caused massive losses and dire economic consequences for the industry. It has been estimated that more than 1 million salmonids escape each year, mainly due to weather conditions and technical and operational failures of net-pens, leading to the establishment of self-sustainable populations resulting in the predation of, and disease and pathogen transfer to, native fish fauna (Sepúlveda et al. Citation2013).
Further, the excessive use of antibiotics by Chilean industries to combat these diseases has raised concerns as to the accumulated long-term impact on the marine environment (Buschmann et al. Citation2012), but also economically has led to lower retail prices and consumption of Chilean salmon internationally. Thus, local trust in the industry has been eroded and the social licence to operate (SLO) has become a significant issue, undermining broader support for the industry’s operations and creating significant tension (Chávez et al. Citation2019). Nevertheless, the industry continues to expand further into southern Patagonia with total production forecast to increase to 1.2–1.3 million tonnes, with exports in excess of US$6.5–7 billion and employment of 70,000–90,000 workers (Wurmann Citation2017).
SIMA was developed over a 3-year period by a multi-disciplinary team of more than 20 scientists, who engaged on a regular basis with key government, industry and research stakeholders. SIMA became fully operational in January 2019 and delivers a range of products, to inform operational, reporting, incident response and scenario planning requirements (Steven et al. Citation2018). This communication summarises the architecture and components and describes existing applications of SIMA, discusses challenges and key learnings, both technical and from an end-user perspective, as well as considering future developments and applications.
SIMA architecture and components
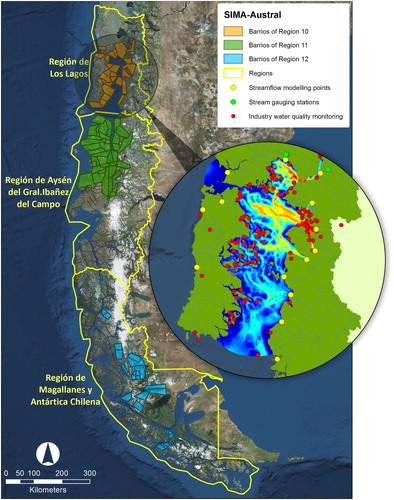
SIMA is built upon an integrated system of data, physical and socioecological marine models, reporting, visualisation, and decision support tools () that enable users through a web-based dashboard to run a range of regulatory and non-regulator reportsFootnote2; access risk-based tools for strategic and tactical planning and for incident response such as disease outbreaks that inform the assessment of various carrying capacities (). SIMA spans Patagonian Chile – Los Lagos, Aysén and Magallanes regions – an area of ∼ 300,000 km2 ().
Figure 1. Conceptual diagram of SIMA information platform showing user-level functionality and the SIMA model and databases to be implemented.
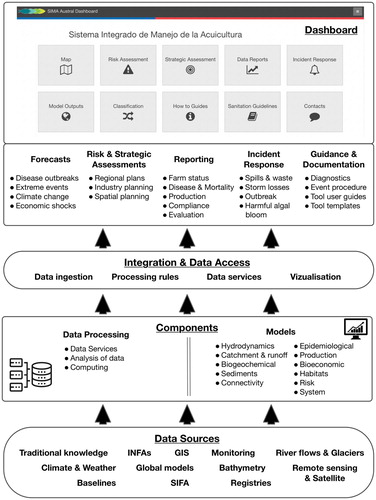
Figure 2. Application of SIMA components to use cases defined by carrying capacity.
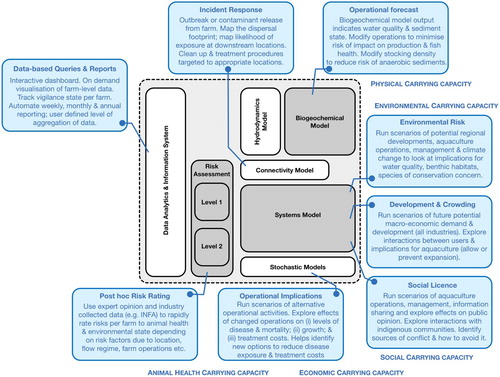
Figure 3. Map of southern Chile showing the extent of environmental and ecosystem models, and the occurrence of salmonid and mussel farming leases. The inset of the Los Lagos Region also shows stream gauge and water quality monitoring stations.
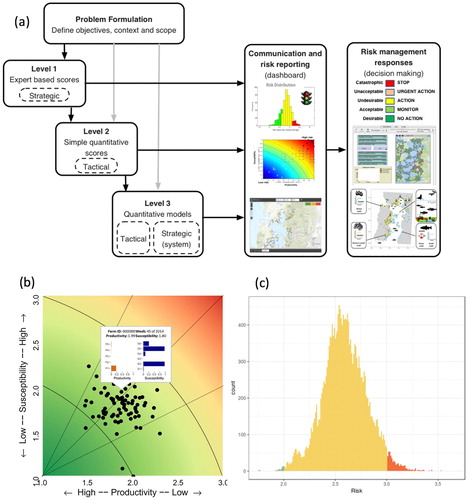
The information delivering this functionality is derived from production and environmental data sourced both from within and external to the Servicio Nacional de Pesca y Acuicultura (SERNAPESCA), and coupled with regional-scale environmental (hydrodynamic, biogeochemical, sediment and stream flow) and socioecological models that include statistical, process and agent-based approaches. This information is delivered directly as data layers, but also via a hierarchical Ecological Risk Assessment framework originally developed in Australia (Hobday et al. Citation2011; Plagányi et al. Citation2011; Williams et al. Citation2011; Zhou et al. Citation2016; Hornborg et al. Citation2018), that is now the basis of risk assessments for Australian federal fisheries (AFMA Citation2017). It has also been applied in various forms to other fisheries around the world, including Canada (Martone et al. Citation2015), USA (Gaichas et al. Citation2018), the EU (Piet et al. Citation2015) and the International Commission for the Conservation of Atlantic Tunas (ICCAT; Cortés et al. Citation2015). The framework allows for a range of rapid strategic assessments, data-driven evaluations and in-depth quantitative analyses and modelling at different points in the planning and productionFootnote3 management cycles ((a)).
Figure 4. Schematic of the three-tiered risk assessment framework implemented for SIMA Austral, showing the two levels of assessment – semi-quantitative (using simple metrics by impact factors) and the fully dynamic quantitative models and the various levels of responses and outputs.
SIMA has been developed in close cooperation with SERNAPESCA staff (primarily from their animal health and environmental departments, and regional offices) to define – via user stories developed during one-on-one interviews and group sessions – the structure and functionality of SIMA. Similarly, the content of the models – and the definition of the scenarios to be explored using the models – was done in consultation with experts (including veterinarians, aquaculture and fishing industries and their regulators, indigenous communities, regional government officials and NGOs) in the three regions using a qualitative modelling approach of Dambacher et al. (Citation2003). This information was supplemented by discussions with Australian aquaculture operational and epidemiological experts and an extensive review of available literature on each aspect of aquaculture; production, economics, ecological interactions, environmental conditions and interactions with management and society.
Below, we will briefly outline the contents of the different components of the SIMA platform before providing some illustrative examples of its application. Space precludes an exhaustive description of the model content, data sources and skill metrics. Interested readers are referred to the supplemental material online for a table that summarises model content, forcing variables and data sources, validation status and technical references.
SIMA systems models
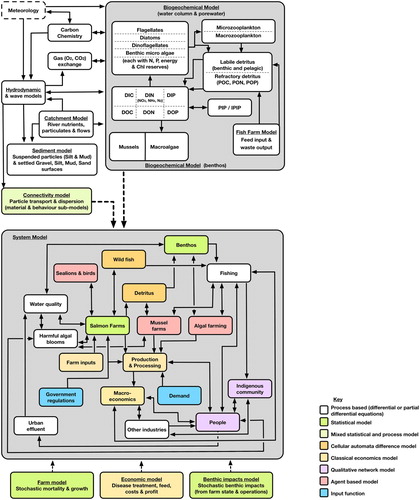
The individual components (sub-models) of the SIMA Systems model (bottom grey panel of (b)) draw on data layers from other parts of SIMA (both models and data sources). The sub-models can be used as standalone components (e.g. to consider epidemiological or economic questions) or can be coupled in a modular way – supplemented by simple representations of non-aquaculture industries and the ecosystem – to form a systems model that encapsulates the entire regional system. The output of the systems model provides insight on potential strategic risks across the socioecological system, including responses to potential market, management or environmental scenarios that have been defined by the users (Fulton et al. Citation2018). Further details of all components and sub-models are provided in the supplemental material.
Figure 5. Schematic showing components of environmental and systems models colour-coded according to modelling approach.
Farm-scale epidemiological and economic models
At the heart of the systems model is a spatially implicit ‘farm-scale’ epidemiological model, which is a statistically-derived probabilistic model that simulates fish growth, mortality and disease dynamics. The model parameters and transition probabilities between infection states have all been directly estimated (at a regional scale) from weekly data reported by industry to SERNAPESCA between August 2010 and September 2017 (Richards and Fulton Citation2018).
The model simulates dynamics for three species – Atlantic salmon (Salmo salar), Coho salmon (Oncorhyncus kisutch) and rainbow trout (Oncorhyncus mykiss) – and two of their common diseases, Salmonid Rickettsial Septicemia (SRS) and bacterial kidney disease (BKD). The user defines the region, number of farms within the production neighbourhoods,Footnote4 species mix and farming practices (size at stocking, time of year when production begins, period over which fish are put in the water, species mix across the neighbourhood, fallow period, etc.). The model outputs growth, fish survival, total production and predicted disease prevalence as the production cycle progresses.
The economic model is a simple cost model, parameterised with a typology of business operation behaviours, that is tied directly to the farm-model to provide estimated costs and revenue (van Putten et al. Citation2018). This model encapsulates growth costs (smolt, feed, labour, sanitary and animal health treatments, leases, insurance and other overheads, harvesting, management costs such as observation, sampling. enforcement and associated reporting), price and operator structure (number and location of centres, volume and type of production, ownership and how that influences production and treatment regimes, and degree of integration). This level of understanding is important for delivering maximum economic efficiency, but also for making sure operations do not exacerbate disease risks and treatment costs, as Chilean salmon producers used more than 380 tonnes of antibiotics in 2016 alone, making antimicrobial resistance a real concern (Miranda et al. Citation2018).
Regional models
The regional systems model (Fulton et al. Citation2018) embeds the farm and economic model within the broader socioecological system, linking them with more than 20 other numerical models including: simple time series forcing, including of economic demand; qualitative networks (social aspects); statistical models (e.g. epidemiology); process-based analytical models (e.g. age-structured metapopulation models for wild fish stocks); and an agent-based representation of large marine mammals such as sealions and blue whales (Figure 4, supplemental material).
The conceptual structure of the model is modified from Engelen et al. (Citation1997) and uses a cellular automaton to track the marine habitats; the abundance of the wild fish stocks (hake, sardine, urchin, crab and wild salmonids); the adjacent marine and terrestrial non-aquaculture industries (tourism; commercial, artisanal and indigenous fishing; farming; plantations; logging, mining; and urban retail and services); as well as terrestrial vegetation types.
The aquaculture production centres, settlements, human population (labour force and general community) and marine mammals (sealions and blue whales) are represented using an agent-based modelling approach. This approach tracks the individual behaviour and state of these components. The overall demand for each sector and the representation of the terrestrial components is based on Fulton et al. (Citation2017), modified to reflect local decision-making and operational practices. The aquaculture component of the systems model takes the farm-scale model and replicates it per farm site and tracks its neighbours and connections to other farms, settlements, transport routes and processing plants.
Outputs from this model include maps and time series for each major indicator, such as biomasses per stock, biodiversity, fish catch, aquaculture production, disease levels, production per industry, population, human footprint, income and revenue.
Model parameterisation and calibration was performed using information from Instituto de Fomento Pesquero (IFOP), Subsecretaría de Pesca y Acuicultura (SUBPESCA), SERNAPESCA, other Chilean national government departments via their geospatial infrastructure network IDE Chile,Footnote5 and regional governments. Data input and Validation procedures are further summarised in the supplemental material.
Environmental models
The SIMA Environmental model (top half of (a)) is an implementation of the CSIRO Environmental Modelling Suite (EMS) that comprises a hydrodynamic model SHOC (Sparse Hydrodynamic Ocean Code; Herzfeld Citation2006; Herzfeld et al. Citation2018) – driven at the catchment boundary by a purpose-built rainfall-snowmelt-runoff model – that is coupled to sediment (Margvelashvili Citation2009) biogeochemical and spectral optics models (Baird et al. Citation2016). This environmental modelling suite delivers data and maps of key oceanographic and ecological conditions, but is currently only fully implemented for the Los Lagos region due to constraints on appropriate available fine-scale data for model construction and validation (Wild-Allen et al. Citation2018).
Hydrodynamic, hydrologic and connectivity models
The hydrodynamic model (Herzfeld et al. Citation2018) is implemented on a fine-scale (600 m horizontal; 1–50 m vertical resolution) 3D grid of the Los Lagos Inland Sea, and nested within a regional shelf and global ocean (BLUElink, Oke et al. Citation2008) model, to allow for accurate inshore propagation of circulation and water properties. Atmospheric fluxes are computed from the ACCESS-G global meteorological model.Footnote6
Daily river discharges for the 22 major river catchments in the region (Aryal et al. Citation2016; Aryal Citation2018) are simulated using the GR4J rainfall runoff model (Perrin et al. Citation2003) with a snow component (Nepal et al. Citation2017). Daily precipitation, evapotranspiration, minimum and maximum temperatures and river flow data, available for four catchments from the CAMELS-CL climate datasetFootnote7 (Alvarez-Garreton et al. Citation2018), were used to calibrate and validate the runoff model which was then used to derive the freshwater flows for the other rivers across the region.
Simulations of surface elevation, temperature and salinity were compared against observations from tide gauges, moorings and field campaigns (). Overall, the hydrodynamic model shows good agreement to available observations and can be considered a suitable platform to investigate system characterisation or drive transport for biogeochemical or sediment transport models. The hydrodynamic model can be used to generate flushing times, residence times and statistical distributions of passive tracers to assist with assessing connectivity within the domain. As an example, shows how a tracer released at different locations in the model domain (east, west and at multiple points) is rapidly transported through the system.
Figure 6. Hydrodynamic model output of the Los Lagos region showing mean (left) summer and winter (right) salinity with vectors representing surface velocity.
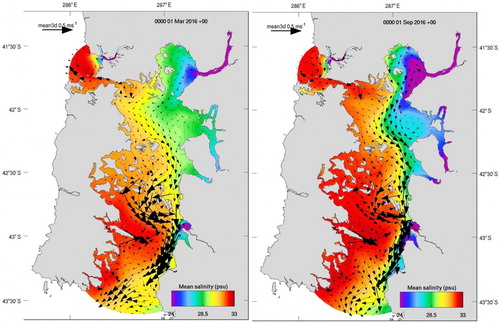
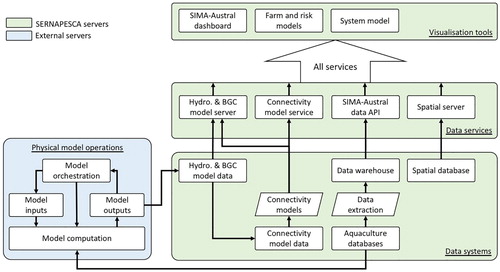
Figure 7. Schematic of the SIMA-Austral platform, which brings together data and models through a suite of data systems, data services and interactive visualisation tools.
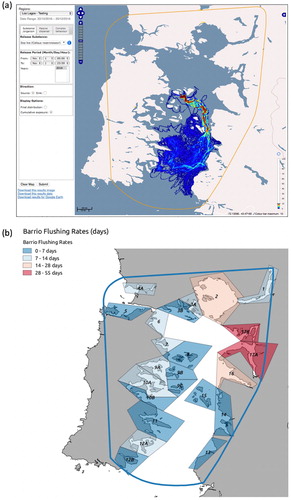
The connectivity tool CONNIE3 (CONNectivity InterfacE v3: www.csiro.au/connie/) combines currents generated by the regional hydrodynamic model with particle tracking techniques to make statistical estimates of exposure risk and flushing rates. It can be used for assessing the connectivity between regions or farm-to- farm – providing estimates of the dispersal of contaminants (e.g. nutrients, sediments, oil, debris) and particles e.g. through the Los Lagos region (Gorton and Condie Citation2018). CONNIE3 includes a range of biological behaviours, including horizontal swimming (constant or random), diurnal vertical migration, and accumulation within surface slicks. Preloaded behaviours (such as the life history and behaviour of Caligus) can be selected for substances and organisms of particular interest. For each model run particles are seeded within a user-specified source (or sink) region at a constant rate of 100 particles per grid cell per day over the user-specified release period. This seeding rate adequately captures dispersal statistics, while maintaining relatively rapid computational rates. Following seeding, particles are tracked individually using a 4th-order Runge–Kutta ordinary differential equation (ODE) solver that linearly interpolates to find the horizontal velocity at the required depth and time. If the user specifies the release area as a source, then particles are tracked forward in time from the release; conversely, if an area is defined as a sink, then particles are tracked backward in time ending at the release cells. As an example, shows the potential dispersal of sea lice from the islands of the Gulf of Ancud.
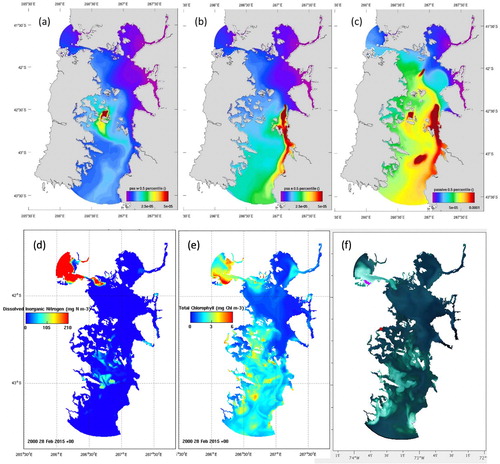
Figure 8. Example Environmental Model output showing (a) median distributions of tracer due (in kg m−3) to the release of 1 kg s−1 flux into the surface at a western (a) and eastern (b) site and (c) four sites across the model domain; (d) surface dissolved inorganic nitrogen (e) total chlorophyll and (f) surface water true colour.
Sediment and biogeochemical models
The sediment transport model ((a)) simulates the sinking, deposition and resuspension of multiple size-classes of suspended sediment (Margvelashvili Citation2018). Simulated spatial distributions of gravel, sand and mud have been compared with benthic sample data collected throughout the model domain and characterise the spatial footprint of catchment sediment loads entering coastal waters (supplementary material).
The biogeochemical model ((a)) simulates the cycling of carbon, nitrogen, phosphorus and dissolved oxygen (e.g. ) through four groups of phytoplankton (small, large, dinoflagellates, microphytobenthos) plus benthic macroalgae, two groups of zooplankton (micro, meso), labile and refractory detritus and dissolved organic and inorganic nutrient pools (Wild-Allen et al. Citation2018). Micro- and macro-algae grow at a rate determined by access to dissolved nutrients (nitrogen and phosphate) and spectrally resolved light ((c)). Fish farm waste discharge was derived from fish biomass at each farm location, a statistical Salmon growth model and assimilation efficiencies (Buschmann et al. Citation2006).
Sediment and nutrient loads from rivers are estimated from observations collated by Chile’s Dirección General de Aguas (DGA)Footnote8 and the Center for Climate and Resilience ResearchFootnote9 and nutrient loads from waste water were derived from data supplied by the Chilean Superintendencia de Servicios SanitariosFootnote10 and the environmental information system of the Ministerio del Medio Ambiente.Footnote11
An optical model integrates the absorption and scattering of incident irradiance from all dissolved and particulate substances in the model to determine the in situ light field and spectral sea leaving radiance. Simulated surface ocean colour can then be compared directly with remotely sensed products including true colour and algorithms for chlorophyll or CDOM. Model skill is assessed against available data from moorings are summarised in the supplementary material and detailed in Margvelashvili (Citation2018) and Wild-Allen et al. (Citation2018).
Data integration, informatics, reporting and visualisation
SIMA relies on databases, some internal to SERNAPESCA and some held externally by other government and industry organisations (). Within SERNAPESCA, a number of databases have over time been developed but have limited inter-operability. These databases are primarily used to ingest and store data on aquaculture production, mortalities, treatments and vaccinations as well as operational information such as transport of fish and all other products required by the aquaculture industry. Additional databases contain information about the start and end of production cycles, fallow periods, as well as the stocking plans, company ownership, lease management, and information on non-salmonid aquaculture (mussels, algae and oysters), and environmental monitoring of the anaerobiosis of the benthos, and simple measures of water quality. The information contained in these databases is primarily collected and submitted by farm operators, although data such as environmental investigations and pathology reports are submitted by authorised consultants and laboratories. Structurally these databases are complex, due to the diversity of data providers and the functional modules allowing them to submit data. Subsequently, report generation and data investigation is limited by rigid workflows that required customisation of new functions.
The approach taken during the development of SIMA (Hodge et al. Citation2018) was to enable the internal and external systems to more effectively inter-operate by establishing a series of data services over the top of existing databases, spatial data systems and model data (). The key additional services include a model service layer, a spatial data server, a Queryable data API and on-the-fly data processing services. This approach provides the flexibility to add new products and services to allow ingestion into various end-user tools. These data services, sit behind the SIMA dashboard and bring together the various SIMA data products into an easy-to-use interface.
The SIMA dashboard is the primary user-interface that enables users to: (i) summarise data delivered from these data services at various spatial and temporal scales and (ii) to investigate patterns and detail in the data to help identify causes of specific events, plan responses and predict future events. The SIMA dashboard allows users to build decision trees to group data into different alert categories which are then available for end-users at suitable spatial and temporal scales in the form of maps, charts and tables. This functionality allows for improved operational intelligence allowing SERNAPESCA to proactively identify and manage issues.
Risk-based tools for tactical decision-making
While outputs from the models described above can be accessed individually from the SIMA dashboard, they can also be used and combined within a hierarchical risk assessment framework to provide risk assessments that can be used for tactical decision-making at the farm to regional scale, or for incident response. Such risk assessments can be undertaken throughout the aquaculture production cycle and is becoming an increasing focus for the development of approaches and tools for impacts assessments (e.g. Hallerman and Kapuscinki Citation1995; Naylor and Burke Citation2005; Taranger et al. Citation2015).
The SIMA risk framework has three tiers ((a)): (i) qualitative rapid assessment of issues allowing for a range of rapid strategic assessments (risk Level 1); (ii) data-driven evaluations completed within or around the production cycle (risk Level 2); and (iii) detailed quantitative analyses and modelling (risk Level 3), as required at different points in the planning and operational management cycles.
The Level 1 strategic risk assessments use expert-based ranking of impact factors that contribute to (primarily) epidemiological, environmental and production risks (Bustamante et al. Citation2018). The impact factors were derived from the literature (e.g. Gustafson et al. Citation2005, Citation2014; Mardones et al. Citation2009; Tapia et al. Citation2013; Gelcich et al. Citation2017) and from in-house surveys of staff of SERNAPESCA, experts from industry, academia and consultants. These Level 1 assessments provide a rapid overview of the sector, either as a whole or at regional scales where the smallest spatial scale is the neighbourhood of farms, termed Barrios.
At the farm-scale an analysis of the sanitary and environmental risk parameters through the production and fallow cycle can be undertaken with the L2 Productivity-Susceptibility Analysis (PSA) tool (Bravo et al. Citation2018). The PSA aggregates variables (or attributes) into either a productivity (e.g. growth; mortality; vaccination; sediment anoxia; temperature; water velocity; connectivity; and marine traffic), or susceptibility (e.g. harmful algal blooms or HABs and sea lion incidence, water turnover, sea temperature and salinity, depth) score and represents these visually for each farm, or the overall risk distribution for all farms. The assessments are species-specific but are considered semi-quantitative as they do not eliminate the need for managers to decide upon the risk thresholds. Whereas farmers and regulators have little to no control – except by relocation – over the susceptibility attributes, the productivity variable can be used to identify feasible farming practices and management interventions that can reduce risk and include inter alia: changes to the stocking and harvest weight, fish density, smolt quality, and length of the fallow period.
The Level 3 risk assessment utilises the suite of SIMA models to provide risk support ranging from the operational farm-scale to regional long-term planning. For example, the epidemiological model can be used to explore how farm operations can be restructured to maximise growth and survival, while minimising disease loads and production costs. The whole-of-system model () can be used to evaluate (i) the efficacy of large scale changes to operating practices or management options (e.g. spatial arrangements, fallow periods, farm permit conditions); (ii) the interconnections within the system and the implications for social, economic and environmental carrying capacity; and (iii) the potential consequences of external shocks and scenarios (e.g. due to climate change, global market demand, growth of other local activities that may compete with aquaculture). This functionality can enable identification of future potential risks that are currently not typically considered by farm operators or regulators such as: declining social licence and increasing community tension around the role of aquaculture in the region’s economy and social cohesion, external economic or climate shocks, emerging diseases, changes in zoning or broader land use change and development of the coastal region and waterways.
SIMA applications
and summarise various use-cases of how SIMA can be used to address a range of issues associated with aquaculture. The following examples provide further detail around the application of SIMA for operational decision-making through to strategic planning.
Supporting strategic planning
Scenario analysis is an effective means of looking at potential system-level responses to changes in drivers, such as climate drivers or economic demand, as well as alternative operational practices or management options (Bueno and Soto Citation2017). As an example, scenario-based analyses for the Los Lagos region were defined by participants in a series of workshops held in May 2018 and are illustrative of how SIMA can be used to consider strategic or systemic risks.
Seven scenarios considered three that resulted in direct changes in salmon production from either a (i) single Harmful algal Bloom (HAB) event of 3 months duration, (ii) multiple (9) HAB events, or (iii) improvements in technology that reduced production costs. Another 3 considered shifts in local management that resulted from either (iv) stronger regulation of benthic habitats and resources, (v) protection of areas identified by Indigenous communities, or (vi) increased protection of marine resources and stricter environmental conditions. All were compared to (vii) the baseline Business as usual case (BAU) of 2017 production levels and management.
Each scenario was run by conditioning the model on the 2012–2017 period and projecting forward 20 years under the scenario conditions and run 100 times so that confidence intervals could be generated for each indicator. The final state of the system was judged on the final 10 years of the projection period relative to the BAU. Briefly, the results highlight a number of risks that face the aquaculture industry including:
Under the BAU the profitability of the industry will likely become marginal as disease rates and treatment costs likely rise, but prices likely don’t.
Improved technological capacity can help mitigate these disease and economic risks and maintain profits and can simultaneously raise the reputation and realised quality of the product by reducing treatment and handling costs and lowering the footprint on the surrounding environment.
Wild fish stocks are under pressure and will continue to decline (aggregate catch declining by 10-25%, as biomass declines by up to 30%) and this will in turn impacts upon aquaculture by: (i) increasing the likelihood of negative interactions between growers and large marine mammals such as sealions attracted to an ‘easy’ meal in the salmon pens; (ii) the depletion of wild mussel banks means that alternative livelihoods may not remain viable for many producers and (iii) increased tension among stakeholders in the region.
Harmful algal blooms are a growing and serious risk in the region. The model showed that while the system can relatively rapidly recover from a single event, there is a threshold point (around one major event every 2–3 years) where the system begins to waver and more frequent events overwhelm many aspects of the entire socioecological system.
Social tension is a significant risk to production under current system structure. Producers and regulators cannot afford to ignore this risk as it can undermine production (via blockage to ports or destruction of infrastructure) that can lead to economic losses. Circuit breakers around improving benthic stocks and opening up cultural tourism may help, but are unlikely to be a complete solution.
This price sensitivity means that external market pressure (and loss of external demand) remains a source of ongoing risk for the industry. Large foreign markets currently exist, but if they begin to enforce more stringent requirements on what is considered acceptable product then the Chilean industry would find itself in trouble.
The SIMA Level 1 and 2 risk tools can be useful in determining the location of future aquaculture leases, identify locations or farming practices that are high risk in terms of environmental footprint and feedback on production conditions and carrying capacity and can be used for planning of appropriate stocking densities. As an example, (b,c) depicts the results of farm-level Level 2 summary assessment undertaken at the end of 2017. In the PSA diagram ((b)) each point is a farm and the resulting risk is the Euclidian distance to the origin. Farms in the lower left corner of the diagram are low-risk, as they that have low susceptibility and high productivity (vice versa for the high-risk farms in the upper right). The overall risk distribution ((c)) shows that at the time of assessment, there was an almost normal distribution, where most farms are at an intermediate risk level (amber), while a few are low risk (green) and a smaller group are high risk (red). This assessment can be done quickly (5-9 days), and is best suited to risk minimisation during the production cycle and fallow period. It provides quantified estimates of background (fixed) risks – due to the location of leases, climate state and the like – as well as risk factors that can be actively modified – such as vaccination practices and stocking density. As these risks can include both direct risks (e.g. parasite loads) and indirect risks – such as benthic habitat status that can feed back on water quality and production conditions – the risk assessment addresses the multi-dimensional nature of risk (across environmental, operational and animal health aspects) but also their interconnection.
Supporting operational decision-making and incident response
SIMA can support both industry and regulators to make informed operational decisions relating to production, treatment and management actions. For example, the Environmental Model output of near real-time hydrodynamic and biogeochemical conditions ((d–f)) can identify whether prevailing oxygen, temperature and other environmental properties are suitable for production or whether any potential negative consequences may need to be mitigated by changed operational behaviours, such as changed feeding patterns or early harvest.
A number of the SIMA tools can be used to look at the different aspects of disease transmission and risk mitigation. The Environmental Model climatology can be used for regional planning, to look at the likelihood of transmission between locations (i.e. production centres) and in near real time for incident response. Likewise, CONNIE can be used in a more accessible and visual way by users to consider the likely footprint of potential transmission (or potential sources) for an outbreak and to define and run scenarios with minimal training (). This allows for the practical exploration of a range of practical applications, including risks of pathogen exchange between leases. Both the Environmental model and CONNIE can be used to address other issues including identifying impact zones around aquaculture leases associated with the dispersal of fish faeces and nutrients or for contaminant spills likely dispersal or source attribution (Condie et al. Citation2012).
Figure 9. (a) Example of output showing modelled dispersal of sea lice released from a central-eastern island of the Gulf of Ancud in the Los Lagos Region over the period October to December 2016. Dark red indicates more than 10% of the release passed through the grid cell, green 40-60% and dark blue less than 10%. (b) Computed flushing timescales for barrios in the Los Lagos Region. These equate to the average time for concentrations within a barrio to fall to e-1 = 0.368 of their starting value. Longer flushing times typically increase the risk of contaminant accumulation and associated deterioration in water quality.
A different form of modelling allows for consideration of dynamics within neighbourhoods. The statistical epidemiological ‘farm-scale’ model can be used to assess the risk of spread or intensification of infection given the current infection profile of a neighbourhood, the species mix and farming practices (Richards and Fulton Citation2018). Cumulative survival risks and levels of production can be forecast, combining multiple sources of mortality, and by linking with a simple economic model the implications for costs of production and expected returns can be assessed (). This in turn, allows for consideration of how modified mortality rates, disease risks and farming practices can influence industry economic profitability and efficiency.
Figure 10. Two examples of operational outputs of the Productivity-Susceptibility risk analysis (PSA) for individual salmon farms from Los Lagos region at week 45 of 2014. (a) Biplot of the PSA where each dot is a production farm. The pop-up shows the normalised contribution of productivity (P1-P5) and susceptibility (S1-S6) attributes to the overall risk. [Attributes legend: P1 = fish density; P2 = fish weight at harvesting; P3 = fish weight at stocking; P4 = mortality by discard; P5 = mortality due to diseases; S1 = hydrodynamic connectivity with regards to other farms; S2 = average current speed; S3 = mortality due to predation (birds and sea lions); S4 = residence time of the sanitary neighbourhood; S5 = salinity; and S6 = temperature]. (b) The overall risk distribution for all salmon farms from Los Lagos region.
![Figure 10. Two examples of operational outputs of the Productivity-Susceptibility risk analysis (PSA) for individual salmon farms from Los Lagos region at week 45 of 2014. (a) Biplot of the PSA where each dot is a production farm. The pop-up shows the normalised contribution of productivity (P1-P5) and susceptibility (S1-S6) attributes to the overall risk. [Attributes legend: P1 = fish density; P2 = fish weight at harvesting; P3 = fish weight at stocking; P4 = mortality by discard; P5 = mortality due to diseases; S1 = hydrodynamic connectivity with regards to other farms; S2 = average current speed; S3 = mortality due to predation (birds and sea lions); S4 = residence time of the sanitary neighbourhood; S5 = salinity; and S6 = temperature]. (b) The overall risk distribution for all salmon farms from Los Lagos region.](/cms/asset/51b00366-a852-4665-a630-e1b25c088477/tjoo_a_1636606_f0010_oc.jpg)
Discussion
Operating challenges and lessons learned
Traditionally regulation and operational management of salmonid aquaculture in Chile has principally focused only on control of disease and this reflects the fact many SERNAPESCA employees have a veterinarian background and, in some regions, outnumber the regional medical doctors (Barrett et al. Citation2002). The reality of aquaculture production in Chile and globally is changing, however. Through the 3-year development of SIMA, the topics considered in the joint collaboration between scientists and SERNAPESCA staff have evolved to consider a broader range of environmental, economic, social and cultural factors affecting the production system that can in turn affect the Industry and the decisions that need to be made at strategic and tactical levels of operation.
The approach to data has also evolved. Transitioning from a bottom-up desire to ‘integrate’ various data holdings (and simply make them more internally visible) to an appreciation that decision making requires a thoughtful process. In particular, starting with the decision to be made and working back to the data/information required to enable that decision. As a result, the data access needs have expanded to encompass a wider range of data, often held by other government agencies or by the Industry. In turn, this has required much greater collaboration between all the partners and across government, research agencies and Industry. This is an evolving process that has been a learning process for all involved; there have been both successes and mis-steps and much remains to be done. However, this shift does provide the potential for improved efficiency, economic potential and environmental outcomes by providing a means of moving away from reactive responsive management focus to forward looking planning and agile adaptive management.
The key issues now facing SIMA are the operational maintenance of SIMA, particularly ensuring a sustainable and harmonised observational infrastructure to support near real-time reporting and forecasting of environmental conditions.
Future development and application
The shift to the green narratives and the proactive use of a systems perspective and near real-time data delivery has (at least temporarily) provided countries such as Norway with a market advantage (Fløysand and Jakobsen Citation2017; Asche et al. Citation2018). As Australian producers struggle with environmental challenges, largely due to climate (Hobday et al. Citation2008) and increasing cumulative pressures on coastal systems (MacDonald Citation2000; Sanchez-Jerez et al. Citation2016), they too are looking to system-based decision support tools to assist their operational sustainability (Leith et al. Citation2014). Chile faces a more complex situation – where the industry is locked into a reactive model and needs to transform operations to a more proactive position.
The SIMA platform delivers the combination of short-term data needs and structured production and long-term planning tools. While the technological components are readily adaptable to new locations, further work will be needed to tailor the overall approach to the individual conditions in each new location. This is in part because of system-specific aspects of monitoring and indicator performance (a well-known issue within sustainable fisheries; Shannon et al. Citation2014; Shin et al. Citation2018), but also because there is a degree of co-development in the approach – without which it is likely that key contextual components (particularly issues associated with behaviour and social licence; Alexander et al. Citation2016) will be missed and that acceptance and uptake of the tool will not reach its full potential.
The Blue Economy is seeing a growing list of marine users, the majority of which have similar information needs (tactical and strategic) to aquaculture. It is relatively straightforward to adapt the SIMA platform to other industries within the Blue Economy – such as fisheries, mining, transport, and tourism. Indeed, the intellectual concepts underlying many of the structural components of the risk assessment framework in SIMA are inspired by previous work in fisheries (e.g. Hobday et al. Citation2011), or draw on the same model types and philosophies as used in fisheries (Fulton Citation2010; Plagányi et al. Citation2014) or integrated coastal management (Fulton et al. Citation2015). However, similarly to translating SIMA to a new aquaculture implementation, modifications would be needed to match the platform to the socioecological conditions and specific user needs in any new application, whether in a new location, or for a new user/industry type.
International significance
Internationally, the demand for better information to manage – operationally and strategically – the aquaculture industry is growing. The global momentum on SDG implementation has also framed some of this discourse on the future sustainability of aquaculture, as has the mainstreaming of the ecosystem approach to aquaculture (EAA), championed by the FAO and others. We believe that SIMA is a significant operational step towards the operationalisation of EAA and to supporting the achievement of many of the SDGs. In addition to SDG 14, aquaculture is also highly relevant to nine other SDGs and so governance of the industry should be broadened to include not only conservation of resources, biodiversity and the environment, but also recognition of the social agency, well-being and livelihoods of people working in the sector and the contributions to interconnected global agendas, such as for food security, nutrition and trade (FAO Citation2018b). In this regard there is also close alignment with GEO Planet which focuses on connecting stakeholders with available data and products, working with stakeholders to develop decision support tools and identifies sustainable aquaculture and fisheries as one of its key themes (Smail et al. Citation2019).
The growing magnitude of interactions of aquaculture with other aspects of coastal and marine systems means that the flow-on effects of its activities are drawing increasing attention. These effects are many-fold, going beyond the traditionally considered environmental effects there are also the perceived acceptability (or otherwise) by regional communities of aquaculture operations (i.e. social license). This means there is a growing need for well-informed decision making locally – to avoid undesirable socioecological outcomes, but also as a basis for informing decisions by international bodies (e.g. the Aquaculture Stewardship Council, Best Aquaculture Practices) and for assessing the effectiveness of policy interventions. SIMA has a role in this via reporting, risk assessments and planning support.
Similarly, the risk and modelling tools could be re-adapted for new locations. The system level tools can also be immediately turned to larger scale regional planning, as they already integrate the key ecological features and major land and seascape users of the region(s). The functionality of SIMA is particularly important for regions with impending expansion of the industry, such as the Magallanes region of southern Chile. Here, SIMA can potentially play a role in better planning the siting of aquaculture and defining its various carrying capacities, and ensuring this development is compatible with other uses in the region.
While many countries don’t have the capacity to implement a project of the scale of SIMA the modular and open source approach allows some components – particularly the informatics and visualisation architecture – to be transferable to other regional-scale aquaculture industries. SIMA has inherited some code libraries from the models, informatics and visualisation codes used in the Australian eReefs initiative (see Steven et al., Citationin review). It is pleasing to see that these inherited components have been expanded, refined and redirected in SIMA and that learnings gained from their use in SIMA can now be re-applied back in Australia; as the salmonid industry in Tasmania faces significant restructure and the development of a SIMA like information system may benefit the future management of the Industry there.
Conclusions
Development of scientifically robust information services, risk assessment and predictive operational and strategic planning tools at relevant spatial and temporal scales is critical for supporting evidence-based aquaculture production and sustainable management. Without such information environmental and other risks associated with ongoing production and any new proposed developments cannot be dealt with in a rigorous way. Timely, accessible information is an absolute necessity for supporting the regulatory agencies in ongoing management of existing and proposed aquaculture operations. The SIMA tools outlined here can be used to provide a detailed understanding of current status and trends, as well as likely and actual interactions between aquaculture production (primarily salmonid farming) and the surrounding system. This includes the receiving environment (biodiversity, abundance and biomass, water quality, sediment characteristics), but also the broader human system too. In turn, this information can be used to evaluate both how changes in the industry (such as expansions) may affect the system, including the Industry, but also to set and evaluate regionally appropriate production reference points, environmental thresholds and adaptive management practices.
Even with the best available information, success is still critically dependent on the capacity of the users. The correct governance must be in place for uptake, particularly as you step beyond single sector comparisons to cross departments (Smith et al. Citation2017). Boundary organisations are bodies that may have an increasing role to play as industries cut across increasing number of sectors and regulatory bodies.
Regardless of who takes on the role, the speed of change currently occurring as a result of climate change and the expansion of the blue economy means that management must move from reactive to proactive management for it to successfully implement effective adaptive management (Alderman and Hobday Citation2017). Combining such a shift in focus with effective information systems, such as SIMA, can support the kind of transformation in the industry that is needed to keep it healthy and productive in the context of a rapidly changing marine socioecological environment.
Supplemental Material
Download MS Word (27.9 KB)Acknowledgements
Our gratitude to the Ministry of Economy of Chile and Fondo de Inversion Estrategica FIE who fund/support the development of SIMA Austral. We would like to express our gratitude to the entire SERNAPESCA team who collaborated and co-develop, as well as provide access to their main information system, knowledge and experience throughout the full development and delivery. We also greatly appreciate the support and collaboration of SUBPESCA, IFOP, Intesal, and the many people from Chilean aquaculture industry and the community who participated in workshops, discussion and that greatly contribute with their knowledge to the many parts of SIMA Austral. Support from the University of Chile in the operational stages of the SIMA Austral platform thanks to their hi-computing systems. Special thanks to Orlando Jimenez, Jose Miguel Burgos, Alicia Gallado, Marcela Lara, Yenny Guerrero, Rolando Ibarra, R/V Khronos crew, Alicia, JM, Con, Andrea Bruna, Fabian Aviles, Stefan Gelcich and Rodrigo Estevez.
Disclosure statement
No potential conflict of interest was reported by the authors.
ORCID
Santosh Aryal http://orcid.org/0000-0003-2555-7481
Patricio Bernal http://orcid.org/0000-0002-6475-3429
Scott Condie http://orcid.org/0000-0002-5943-014X
Jonathan Hodge http://orcid.org/0000-0002-2699-2269
Erin Kenna http://orcid.org/0000-0003-0309-7808
Jennifer Skerratt http://orcid.org/0000-0001-9023-4692
Linda Thomas http://orcid.org/0000-0001-8989-8109
Notes
1 Sistema Integrado de Manejo para la Acuicultura Austral de Chile.
2 Access to best-practice epidemiology and sanitary procedures developed as part of SIMA are also available, but not discussed here.
3 A production cycle (typically 12–18 months duration for Atlantic salmon, shorter for other species, is dependent on the geographic region) and begins when the salmon smolt are transported to offshore pens and ends when they are harvested as adults.
4 Agrupación de Concesiones Sanitarias (ACS) or Barrios (neighbourhoods) http://ww2.sernapesca.cl/index.php?option=com_content&view=article&id=1220&Itemid=1009
5 Infraestructura de Datos Geoespaciales de Chile http://www.ide.cl/
8 Informacion Oficial Hidrometeorológica y de Calidad de Aguas en Línea http://snia.dga.cl/BNAConsultas/reportes
10 SiSS, Sistema de Información Territorial http://geo.siss.cl/geonodo30/index.php?r=site/start&geoprofileId=41
11 Sistema Nacional de Información Ambiental (SINIA) http://sinia.mma.gob.cl
Related Research Data
References
- [AFMA] Australian Fisheries Management Authority. 2017. Guide to AFMA’s ecological risk management. Available from the AFMA website https://www.afma.gov.au/.
- Alderman R, Hobday AJ. 2017. Developing a climate adaptation strategy for vulnerable seabirds based on prioritisation of intervention options. Deep Sea Res Part II. 140:290–297. doi: 10.1016/j.dsr2.2016.07.003
- Alexander KA, Freeman S, Potts T. 2016. Navigating uncertain waters: European public perceptions of integrated multi trophic aquaculture (IMTA). Environ Sci Policy. 61:230–237. doi: 10.1016/j.envsci.2016.04.020
- Alvarez-Garreton C, Mendoza PA, Boisier JP, Addor N, Galleguillos M, Zambrano-Bigiarini M, Lara A, Puelma C, Cortes G, Garreaud R, et al. 2018. The CAMELS-CL dataset: catchment attributes and meteorology for large sample studies – Chile dataset. Hydrol Earth Syst Sci Discuss. doi:10.5194/hess-2018-23, in review.
- Aryal S. 2018. Appendix M: biogeochemical modelling of surface water for the Los Lagos region, Chile. In: Steven ADL, et al., editor. SIMA-Austral FIE V008-integrated ecosystem-based sanitary and environmental management system for aquaculture. Final Report. Brisbane: CSIRO; p. 178.
- Aryal SK, Ashbolt S, McIntosh BS, Petrone KP, Maheepala S, Chowdhury RK, Gardener T, Gardiner R. 2016. Assessing and mitigating the hydrological impacts of urbanisation in semi-urban catchments using the storm water management model. Water Resour Manage. 30(14):5437–5454. doi: 10.1007/s11269-016-1499-z
- Asche F, Sikveland M, Zhang D. 2018. Profitability in Norwegian salmon farming: the impact of firm size and price variability. Aquacult Econ Manag. 1–12.
- Baird ME, Cherukuru N, Jones E, Margvelashvili N, Mongin M, Oubelkheir K, Ralph PJ, Rizwi F, Robson BJ, Schroeder T, et al. 2016. Remote-sensing reflectance and true colour produced by a coupled hydrodynamic, optical, sediment, biogeochemical model of the Great Barrier Reef, Australia: comparison with satellite data. Environ Model Softw. 78:79–96. doi: 10.1016/j.envsoft.2015.11.025
- Barrett G, Caniggia MI, Read L. 2002. “There are more Vets than doctors in Chiloé”: social and community impact of the Globalization of aquaculture in Chile. World Dev. 30(11):1951–1965. doi: 10.1016/S0305-750X(02)00112-2
- Bravo F, Bustamante RH, Fulton E. 2018. Appendix J: semi-qualitative risk assessment at marine salmon farm sites. In: Steven A, et al., editor. SIMA-Austral FIE V008-integrated ecosystem-based sanitary and environmental management system for aquaculture. Final Report. Brisbane: CSIRO; p. 178.
- Bueno PB, Soto D. 2017. Adaptation Strategies of the aquaculture sector to the impacts of climate change. FAO.
- Buschmann AH, Riquelme VA, Hernández-González MC, Varela D, Jiménez JE, Henríquez LA, Vergara PA, Guíñez R, Filún L. 2006. A review of the impacts of salmonid farming on marine coastal ecosystems in the southeast Pacific. ICES J Mar Sci. 63(7):1338–1345. doi: 10.1016/j.icesjms.2006.04.021
- Buschmann AH, Tomova A, Lopez A, Maldonado MA, Henriquez LA, Ivanova L, Moy F, Godfrey HP, Cabello FC. 2012. Salmon aquaculture and antimicrobial resistance in the marine environment. PLoS One. 7(8):e42724. doi: 10.1371/journal.pone.0042724
- Bustamante RH, Bravo F, Fulton E. 2018. Appendix I: Method developments for qualitative risk assessment at marine salmon farm sites. In: Steven A, et al., editor. SIMA-Austral FIE V008-integrated ecosystem-based sanitary and environmental management system for aquaculture. Final Report. Brisbane: CSIRO; p. 178.
- Chávez C, Dresdner J, Figueroa Y, Quiroga M. 2019. Main issues and challenges for sustainable development of salmon farming in Chile: a socio-economic perspective. Rev Aquacult. 11(2):403–421. doi: 10.1111/raq.12338
- Condie SA, Hepburn M, Mansbridge J. 2012. Modelling and visualisation of connectivity on the Great Barrier Reef. In: Proceedings of the 12th international coral reef symposium, Cairns, Australia, p. 9–13.
- Cortés E, Domingo A, Miller P, Forselledo R, Mas F, Arocha F, Campana S, Coelho R, Da Silva C, Hazin FHV, et al. 2015. Expanded ecological risk assessment of pelagic sharks caught in Atlantic pelagic longline fisheries. Collect Vol Sci Pap ICCAT. 71(6):2637–2688.
- Dambacher JM, Li HW, Rossignol PA. 2003. Qualitative predictions in model ecosystems. Ecol Model. 161:79–93. doi: 10.1016/S0304-3800(02)00295-8
- Engelen G, Uljee I, White R. 1997. Vulnerability assessment of low-lying coastal areas and small islands to climate change and sea level rise; Phase 2: Case study St. Lucia. Report & SIMLUCIA User Manual. Report to UNEP CAR/RCU, United Nations Environment Programme, Caribbean Regional Co-ordinating Unit, Kingston, Jamaica. Research Institute for Knowledge Systems: Maastricht. 90pp.
- FAO. 2018a. Fishery and Aquaculture Statistics. Global aquaculture production 1950-2016 (FishstatJ). In: FAO Fisheries and Aquaculture Department [online]. Rome. Updated 2018. www.fao.org/fishery/statistics/software/fishstatj/en.
- FAO. 2018b. The State of World Fisheries and Aquaculture. (2018). Meeting the sustainable development goals. Rome. Licence: CC BY-NC-SA 3.0 IGO.
- Fløysand A, Jakobsen SE. 2017. Industrial renewal: narratives in play in the development of green technologies in the Norwegian salmon farming industry. Geogr J. 183(2):140–151. doi: 10.1111/geoj.12194
- Fulton EA. 2010. Approaches to end-to-end ecosystem models. J Mar Sys. 81:171–183. doi: 10.1016/j.jmarsys.2009.12.012
- Fulton EA, et al. 2018. Appendix C Integrated system model content. In: Steven E, Bernal P., et al., editors. SIMA Austral. FIE V008-integrated ecosystem-based sanitary and environmental management system for aquaculture. Final Report. Brisbane, QLD: CSIRO; p. 178.
- Fulton EA, Boschetti F, Sporcic M, Jones T, Little LR, Dambacher JM, Gray R, Scott R, Gorton R. 2015. A multi-model approach to engaging stakeholder and modellers in complex environmental problems. Environ Sci Policy. 48:44–56. doi: 10.1016/j.envsci.2014.12.006
- Fulton EA, Hutton T, van Putten IE, Lozano-Montes H, Gorton R. 2017. Gladstone Atlantis model – implementation and Initial results. Report to the Gladstone healthy Harbour Partnership. Hobart: CSIRO; p. 167.
- Gaichas SK, DePiper GS, Seagraves RJ, Muffley BW, Sabo MG, Colburn LL, Loftus AJ. 2018. Implementing ecosystem approaches to fishery management: risk assessment in the US Mid-Atlantic. Front Mar Sci. 5:442. doi: 10.3389/fmars.2018.00442
- Gelcich S, Estevez R, Mardones F, Carey J. 2017. Identificación, validación y difusión sobre factores de riesgo para el desarrollo de brotes intensos de Septicemia Rickettsial Salmonídea (SRS) en salmón del Atlántico: una aproximación multi-sectorial. Informe Final SERNAPESCA. p. 131.
- Gorton B, Condie S. 2018. Appendix P: SIMA Austral dispersal and connectivity modelling for the Los Lagos Region, Chile. In: Steven ADL et al., editor. SIMA-Austral FIE V008-integrated ecosystem-based sanitary and environmental management system for aquaculture. Final Report. Brisbane: CSIRO; p. 178.
- Gustafson L, Antognoli M, Fica ML, Ibarra R, Mancilla J, Del VOS, Sais RE, Perez A, Aguilar D, Madrid E, et al. 2014. Risk factors perceived predictive of ISA spread in Chile: applications to decision support. Prev Vet Med. 117:276–285. doi: 10.1016/j.prevetmed.2014.08.017
- Gustafson L, Ellis S, Bartlett C. 2005. Using expert opinion to identify risk factors important to infectious salmon-anemia (ISA) outbreaks on salmon farms in Maine, USA and New Brunswick, Canada. Prev Vet Med. 70:17–28. doi: 10.1016/j.prevetmed.2005.02.012
- Hallerman EM, Kapuscinski AR. 1995. Incorporating risk assessment and risk management into public policies on genetically modified finfish and shellfish. Aquaculture. 137(1):9–17. doi: 10.1016/0044-8486(95)01089-0
- Herzfeld M. 2006. An alternative coordinate system for solving finite difference ocean models. Ocean Model. 14:174–196. doi: 10.1016/j.ocemod.2006.04.002
- Herzfeld M, Andrewartha J, Rizwi F, Santosh A. 2018. Appendix L: hydrodynamic model modelling for the Los Lagos region, Chile. In: Steven ADL et al., editor. SIMA-Austral FIE V008-integrated ecosystem-based sanitary and environmental management system for aquaculture. Final Report. Brisbane: CSIRO; p. 178.
- Hobday AJ, Poloczanska ES, Matear RJ, editors. 2008. Implications of climate change for Australian fisheries and aquaculture: a preliminary assessment. Report to the Department of Climate Change, Canberra, Australia. August 2008.
- Hobday A, Smith A, Stobutzki I, Bulman C, Daley R, Dambacher J, Deng R, Dowdney J, Fuller M, Furlani D, et al. 2011. Ecological risk assessment for the effects of fishing. Fish Res. 108:372–384. doi: 10.1016/j.fishres.2011.01.013
- Hodge J, Dowideit S, Kenna E, Ocampo D, Tickell S, Wild D. 2018. Appendix K: system architecture and the information platform of the management system of aquaculture SIMA Austral. In: Steven ADL et al., editor. SIMA-Austral FIE V008-integrated ecosystem-based sanitary and environmental management system for aquaculture. Final Report. Brisbane: CSIRO; p. 178.
- Hornborg S, Hobday AJ, Ziegler F, Smith AD, Green BS. Handling editor: Mark Gibbs. 2018. Shaping sustainability of seafood from capture fisheries integrating the perspectives of supply chain stakeholders through combining systems analysis tools. ICES J Mar Sci. 75(6):1965–1974. doi: 10.1093/icesjms/fsy081
- Iizuka M, Katz J. 2017. Natural resource industries, ‘tragedy of the commons’ and the case of Chilean salmon farming. Institutions and Economies. 106(2):140–153.
- Leith P, Ogier E, Haward M. 2014. Science and social license: defining environmental sustainability of Atlantic salmon aquaculture in South-eastern Tasmania, Australia. Social Epistemology. 28(3-4):277–296. doi: 10.1080/02691728.2014.922641
- MacDonald LH. 2000. Evaluating and managing cumulative effects: process and constraints. Environ Manag. 26:299–315. doi: 10.1007/s002670010088
- Mardones FO, Perez AM, Carpenter TE. 2009. Epidemiologic investigation of the re-emergence of infectious salmon anemia virus in Chile. Dis Aquat Organ. 84:105–114. doi: 10.3354/dao02040
- Margvelashvili N. 2009. Stretched Eulerian coordinate model of coastal sediment transport. Comput Geosci. 35(6):1167–1176. doi: 10.1016/j.cageo.2008.03.016
- Margvelashvili N. 2018. Appendix N SIMA Austral fine sediment transport modelling for the Los Lagos region, Chile. In: Steven ADL, et al., editor. SIMA-Austral FIE V008-integrated ecosystem-based sanitary and environmental management system for aquaculture. Final Report. Brisbane: CSIRO; p. 178.
- Martone MOR, Hannah L, Greig L, Boutillier J, Patton S. 2015. An ecological risk assessment framework (ERAF) for ecosystem-based oceans management in the pacific region. DFO Can. Sci. Advis. Sec. Res. Doc 2014/072.vii + 59 p.
- McKindsey C, Thetmeyer H, Landry T, Silver W. 2006. Review of recent carrying capacity models for bivalve culture and recommendations for research and management. Aquaculture. 261:451–462. doi: 10.1016/j.aquaculture.2006.06.044
- Miranda CD, Godoy FA, Lee MR. 2018. Current status of the use of antibiotics and the antimicrobial resistance in the Chilean salmon farms. Front Microbiol. 9:1284. doi:10.3389/fmicb.2018.01284.
- Naylor R, Burke M. 2005. Aquaculture and ocean resources: raising tigers of the sea. Annu Rev Environ Resour. 30(1):185–218. doi: 10.1146/annurev.energy.30.081804.121034
- Nepal S, Chen J, Penton DJ, Neumann LE, Zheng H, Wahid S. 2017. Spatial GR4J conceptualization of the Tamor glaciated alpine catchment in Eastern Nepal: evaluation of GR4JSG against streamflow and MODIS snow extent. Hydrol Processes. 31(1):51–68. doi:10.1002/hyp.10962.
- Oke PR, Brassington GB, Griffin DA, Schiller A. 2008. The Bluelink ocean data assimilation system (BODAS). Ocean Model. 21(1-2):46–70. doi: 10.1016/j.ocemod.2007.11.002
- Perrin C, Michel C, Andréassian V. 2003. Improvement of a parsimonious model for streamflow simulation. J Hydrol. 279(1–4):275–289. doi:10.1016/S0022-1694(03)00225-7.
- Piet GJ, Jongbloed RH, Knights AM, Tamis JE, Paijmans AJ, van der Sluis MT, de Vries P, Robinson LA. 2015. Evaluation of ecosystem-based marine management strategies based on risk assessment. Biol Conserv. 186:158–166. doi: 10.1016/j.biocon.2015.03.011
- Plagányi ÉE, Bell JD, Bustamante RH, Dambacher JM, Dennis DM, Dichmont CM, Dutra LX, Fulton EA, Hobday AJ, van Putten EI, Smith F. 2011. Modelling climate-change effects on Australian and Pacific aquatic ecosystems: a review of analytical tools and management implications. Mar Freshw Res. 62(9):1132–1147. doi: 10.1071/MF10279
- Plagányi ÉE, Punt A, Hillary R, Morello E, Thébaud O, Hutton T, Pillans R, Thorson J, Fulton EA, Smith ADM, et al. 2014. Multi-species fisheries management and conservation: tactical applications using models of intermediate complexity. Fish Fish. 15:1–22. doi: 10.1111/j.1467-2979.2012.00488.x
- Quiñones RA, Fuentes M, Montes RM, Soto D, León-Muñoz J. 2019. Environmental issues in Chilean salmon farming: a review. Rev Aquacult. 11(2):403–421. doi: 10.1111/raq.12337
- Richards S, Fulton E. 2018. Appendix E: Farm-scale epidemiological model for Chilean salmon and trout at marine farming sites. In: Steven ADL, et al., editor. SIMA-Austral FIE V008-integrated ecosystem-based sanitary and environmental management system for aquaculture. Final Report. Brisbane: CSIRO; p. 178.
- Ross LG, Telfer TC, Falconer L, Soto D, Aguilar-Manjarrez J, Asmah R, Bermúdez J, Beveridge MCM, Byron CJ, Clément A, Corner R. 2013. Carrying capacities and site selection within the ecosystem approach to aquaculture. Site selection and carrying capacities for inland and coastal aquaculture, p. 19.
- Sanchez-Jerez P, Karakassis I, Massa F, Fezzardi D, Aguilar-Manjarrez J, Soto D, Chapela R, Avila P, Macias JC, Tomassetti P, et al. 2016. Aquaculture’s struggle for space: the need for coastal spatial planning and the potential benefits of Allocated zones for aquaculture (AZAs) to avoid conflict and promote sustainability. Aquacult Env Interac. 8:41–54. doi: 10.3354/aei00161
- Sepúlveda M, Arismendi I, Soto D, Jara F, Farias F. 2013. Escaped farmed salmon and trout in Chile: incidence, impacts, and the need for an ecosystem view. Aquacult Env Interac. 4(3):273–283. doi: 10.3354/aei00089
- Shannon L, Coll M, Bundy A, Gascuel D, Heymans JJ, Kleisner K, Lynam CP, Piroddi C, Tam J, Travers-Trolet M, Shin Y. 2014. Trophic level-based indicators to track fishing impacts across marine ecosystems. Mar Ecol Prog Ser. 512:115–140. doi:10.3354/meps10821.
- Shin Y-J, Houle JE, Akoglu E, Blanchard JL, Bundy A, Coll M, Demarcq H, Fu C, Fulton EA, Heymans JJ, et al. 2018. The specificity of marine ecological indicators to fishing in the face of environmental change: a multi-model evaluation. Ecol Indic. 89:317–326. doi: 10.1016/j.ecolind.2018.01.010
- Smail EA, DiGiacomo PM, Seeyave S, Djavidnia S, Celliers L, Le Traon P-V, Gault J, Escobar-Briones E, Plag H-P, Pequignet C, et al. 2019. An introduction to the Oceans and society: blue Planet initiative. J Oper Oceanogr.
- Smith DC, Fulton EA, Apfel P, Cresswell ID, Gillanders BM, Haward M, Sainsbury KJ, Smith ADM, Vince J, Ward TM. 2017. Implementing marine ecosystem-based management: lessons from Australia. ICES J Mar Sci. 74:1990–2003. doi: 10.1093/icesjms/fsx113
- Steven ADL, Andrewartha JR, Bernal PA, Bravo F, Bustamante RH, Condie SA, Crane M, Dambacher JM, Dowideit S, Steven A, et al. 2018. SIMA-Austral FIE V008-integrated ecosystem-based sanitary and environmental management system for aquaculture. Final Report. Brisbane, QLD: CSIRO; p. 178.
- Steven ADL, Baird ME, Brinkman R, Car NJ, Cox SJ, Herzfeld M, Hodge J, Jones E, King E, Margvelashvili N, et al. in review. eReefs: an operational information system for managing the Great Barrier Reef. J Oper Oceanogr.
- Tapia C, Vargas Santander K, Muñoz Maluenda C, Zepeda Alcota C, Núñez Parraguez I, Inostroza Cortés F. 2013. Gestión de Recursos Financieros para Investigación, en base a Riesgo, para la Sustentabilidad de las Pesquerías y la Acuicultura Licitación ID N° 4728-6-LE13, INFORME FINAL, Centro de Estudios de Sistemas Sociales (CESSO), 104p.
- Taranger GL, Karlsen Ø, Bannister RJ, Glover KA, Husa V, Karlsbakk E, Kvamme BO, Boxaspen KK, Bjørn PA, Finstad B, Madhun AS. 2015. Risk assessment of the environmental impact of Norwegian Atlantic salmon farming. ICES J Mar Sci. 72(3):997–1021. doi: 10.1093/icesjms/fsu132
- United Nations. 2015. Draft outcome document of the United Nations summit for the adoption of the post-2015 development agenda. Draft resolution submitted by the President of the General Assembly, Sixty-ninth session, Agenda items 13 (a) and 115, A/69/L.85, New York, UN, August 12, 2015.
- van Putten I, Fulton E, Hoshino E, Richards S, Steven AH. 2018. Appendix F: Bio-economic disease control model for Chilean salmon and trout at marine farming sites. In: Steven ADL, et al., editor. SIMA-Austral FIE V008-integrated ecosystem-based sanitary and environmental management system for aquaculture. Final Report. Brisbane: CSIRO; p. 178.
- Waite R, Beveridge M, Brummett R, Castine S, Chaiyawannakarn N, Kaushik S, Mungkung R, Nawapakpilai S, Phillips M. 2014. Improving productivity and environmental performance of aquaculture. Washington, DC: WorldFish.
- Wild-Allen K, Margvelashvili N, Skerratt J. 2018. Appendix O: biogeochemical and optical modelling modelling for the Los Lagos Region, Chile. In: Steven ADL, et al., editor. SIMA-Austral FIE V008-integrated ecosystem-based sanitary and environmental management system for aquaculture. Final Report. Brisbane: CSIRO; p. 178.
- Williams A, Dowdney J, Smith ADM, Hobday AJ, Fuller M. 2011. Evaluating impacts of fishing on benthic habitats: a risk assessment framework applied to Australian fisheries. Fish Res. 112(3):154–167. doi: 10.1016/j.fishres.2011.01.028
- Wurmann CG. 2017. Regional Review on status and trends in aquaculture development in Latin America and the Caribbean – 2015. FAO Fisheries and Aquaculture Circular No. 1135/3, Rome, Italy. ISBN 978-92-5-109654-3.
- Zhou S, Hobday AJ, Dichmont CM, Smith AD. 2016. Ecological risk assessments for the effects of fishing: a comparison and validation of PSA and SAFE. Fish Res. 183:518–529. doi: 10.1016/j.fishres.2016.07.015