
 ?Mathematical formulae have been encoded as MathML and are displayed in this HTML version using MathJax in order to improve their display. Uncheck the box to turn MathJax off. This feature requires Javascript. Click on a formula to zoom.
ABSTRACT
An environmental isotope study was conducted to assess the cause for the freshening of seawater observed in the Mahim Bay, Mumbai, India after a storm event during the southwest monsoon period. Water samples were collected from the various locations of the coastal water and the suspected inland water sources such as rain, river and groundwater and analysed for major ion species and stable isotopes (δ18O and δ2H). Dissolved radon (222Rn) in the coastal water was monitored in-situ. Field monitoring survey in the coastal water indicated lower electrical conductivity (1,730 μS/cm) near Mahim Mosque compared to the surrounding shelf waters. Relatively high excess 222Rn activities (up to 55 Bq/m3) were observed in the Mahim Bay, even after 13 days of seawater freshening event. Based on the hydrochemical and isotope results, various prevailing hypotheses on the occurrence of low salinity water in the Mahim Bay were tested. It is inferred that the low salinity coastal water was associated with groundwater discharge occurring in the Mahim Bay and in the Mithi River and were unlikely due to the overflow of Vihar and Powai Lakes in the catchment of Mithi River and surface runoff because of the rain/storm events. Temporal variations of electrical conductivity and stable isotopic composition of coastal water in the Mahim Bay showed that the groundwater inputs were decreasing after the storm event. 222Rn was found to be a useful tracer for distinguishing the subsurface flow of water to the coastal system.
Introduction
Freshening of seawater is known to occur in the coastal regions of many parts of the World. It may be derived from the flood waters of rivers (Moore et al. Citation1986; Ortner et al. Citation1995; Simstich et al. Citation2005), large scale groundwater discharges after storms (Moore Citation1996; Gwak et al. Citation2014), or from heavy offshore rain events (Moore and Kjerfve Citation1998; Valiela et al. Citation2012). These hydrological sources can be an important pathways for nutrients and contaminants to many types of coastal ecosystems. However, understanding the freshening processes in the coastal water is extremely difficult because of the complexities inherent in identifying the source of freshwater.
A large freshwater plume was noticed in the coastal waters of Mahim Bay near a Mosque, Mumbai, India on 18 August 2006. Thousands of people visited the beach, many of them not only bathed in that water but also drank it with the faith that a miracle had happened. Analyses of water samples indicated that the low salinity coastal water was not potable as it was contaminated with high nitrate, phosphate and fecal coliforms (DNA Citation2006; NIO Citation2006). A similar freshening phenomenon of coastal water was reported in Teethal beach, Gujarat (about 200 km north of Mumbai) on the same day of occurrence in Mahim Bay (Wikipedia Citation2006). Not many scientific studies were carried out to understand this phenomenon except those of NIO (Citation2006) and Singhal et al. (Citation2007). An attempt was made in the present study to assess the cause for the freshening of seawater in the coastal areas of Mahim Bay using hydrochemical and environmental isotopes (δ18O, δ2H and 222Rn) techniques.
Environmental isotopes are useful tools for hydrological, coastal and oceanographic studies (Fritz and Fonts Citation1980). Radon (222Rn), a naturally occurring conservative radioactive noble gas in the U decay series (half-life: 3.83 days), is recognised as a reliable tracer to understand the surface water – groundwater interactions and identify areas of significant groundwater discharge in surface water bodies (Cable et al. Citation1996; Dulaiova et al. Citation2010). The natural 222Rn activity in groundwater is typically 2–3 orders of magnitude higher than surface waters, thus providing a means to quantify the relative contribution of surface flows and groundwater into the coastal zone. Stable isotopes such as 18O and 2H are widely used as tracers for studying groundwater – seawater interactions (Schiavo et al. Citation2009; Lin et al. Citation2011; Noble et al. Citation2015), as they are integral part of the water molecule.
Physical settings
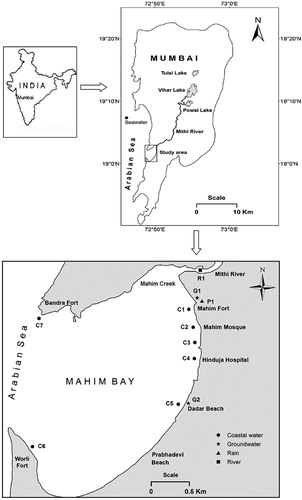
Differential weathering of the inter-layered soft tuffs and resistant basaltic flows (Deccan Traps) by seawater has created several bays and creeks around Mumbai; Mahim Creek is one of the prominent among them. The semi-enclosed Mahim Bay (Area = 6 km2; average depth = 4.6 m) is open to the Arabian Sea on the west and connected to the Mahim Creek on the north-east (). The northern shores of the Bay are predominantly rocky with mud patches in-between, while, the central and the southern zones are largely sandy with occasional rock outcrops. Mahim Creek, which is wide and shallow, is an inland extension of the Mahim Bay. The Mahim Creek receives overflow of the Vihar and the Powai Lakes, located 14 and 16 km, respectively, in the northeast direction, during monsoon (June-September) via the Mithi River. The runoff decreases considerably after the withdrawal of monsoon leading to stagnant conditions in the Mithi River and the Mahim Creek after September, and the system resembles an effluent drain (Zingde and Desai Citation1980; Sabnis Citation1984; Sabnis and Zingde Citation1989). The annual flushing caused by heavy rains during the monsoon period substantially improves the ecological quality of the Mithi River and the Mahim Creek. The average annual rainfall is about 2400 mm. The mean minimum temperature is 16.3°C and the mean maximum temperature is 32.2°C.
Figure 1. Location map of the Mahim Bay showing the sampling points.
The Mahim area and its surroundings are underlain by basaltic lava flows of upper Cretaceous to lower Eocene age. The rock consists of highly vesicular bottom layer having closely spaced horizontal joints but the thickness is generally less. The vesicular zones are weathered in most parts of the area, thus making them moderately permeable. But if, vesicles are not filled, they act as highly permeable aquifers. Thin soil cover overlies the fractured massif basalt, which forms the major geological unit and they are exposed in the coastal areas. The shallow alluvium formation of recent age also occurs as a narrow stretch along the river. The groundwater exists in fractures, joints, vesicles and in weathered zone of basalt. The occurrence and circulation of groundwater in this area is mainly through vesicular unit of lava flows and through secondary porosity and permeability of the basalt, which is developed due to weathering, jointing, fracturing etc. (CGWB Citation2009). Here, the groundwater generally occurs under phreatic condition.
Methods
Field monitoring surveys were carried out in the Mahim Bay after 1 day, 3 days and 13 days of appearance of low salinity water in the Bay and coastal water samples were collected for the measurement of hydrochemistry and stable isotopes (δ2H and δ18O). Mithi River, shallow groundwater (from tube wells of <10 m deep), seawater away from the coast and precipitation samples were also collected and analysed as a reference for comparison ().
Physical parameters such as electrical conductivity (EC) and pH were measured in-situ using portable conductivity and pH meters, respectively. For anion analyses, the collected water samples were filtered and stored in pre-washed polythene bottles. Another set was collected and acidified to pH < 2 by adding concentrated HNO3 for cation measurements. Alkalinity was measured by titrating 10 mL of water sample with 0.02 N H2SO4, using methyl orange as the indicator. Major ion chemistry (anions & cations) was measured using Ion Chromatograph (Dionex-500) following the standard procedures (Tirumalesh et al. Citation2010).
For stable isotope (2H and 18O) analysis, water samples were collected in 30 ml airtight polyethylene bottles and measured in the laboratory by isotope ratio mass spectrometer (Geo-2020, PDZ Europa) using the gas equilibration method. For δ2H analysis, 1 ml of the water sample was equilibrated with H2 at 50°C for 1 h with Pt catalyst and for δ18O analysis, 1 ml of the water sample was equilibrated with CO2 gas at 50°C for 8 h and the equilibrated gases were introduced into the mass spectrometer. The results are reported in δ-notation, as deviation relative to a standard, V-SMOW (Vienna – Standard Mean Ocean Water) and in units of parts per thousand (denoted as ‰). The δ values are calculated using (Coplen Citation1996):(1)
(1) where
denotes the ratio of heavy to light isotope (e.g.
or
) and
and
are these ratios in the sample and standard, respectively. The precision of measurement for δ2H is ±0.5 ‰ and for δ18O is ±0.1 ‰ (2σ).
222Rn activity in the coastal waters of Mahim Bay was measured 13 days after the appearance of the low salinity water. Since the 222Rn concentrations in surface waters are generally very low, large volumes of water are required for the measurement and hence in-situ monitoring is highly essential. A continuous radon monitoring system similar to those developed by Burnett et al. (Citation2001) using a radon-in-air monitor was used in the present study.
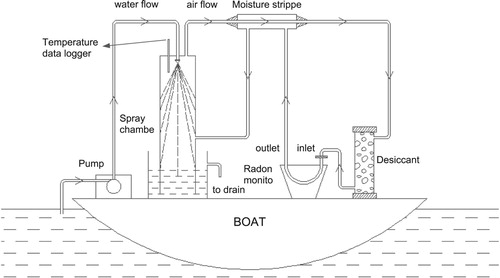
For the in-situ measurement of 222Rn in the Mahim Bay, seawater was continuously pumped from 1 m above the sea bed using a peristaltic pump placed in a boat and sprayed as a jet into an air–water exchanger (). The radon thus stripped out from the water was passed through a closed air-loop via a desiccant tube into a 222Rn counting system (RAD-7; Durridge make). The equilibrium of 222Rn between the liquid and gaseous phase was established within 30 min (Lane-Smith et al. Citation2002). The radon monitor uses a high electric field above a silicon semiconductor detector at ground potential to attract the positively charged polonium daughters, 218Po+ (t1/2 = 3.1 min; alpha energy = 6.00 MeV) and 214Po+ (t1/2 = 164 µs; alpha energy = 7.67 MeV), which are counted as a measure of 222Rn activity in air. The ions are collected in energy-specific windows that eliminate interference and maintain low background levels. 222Rn activities are expressed in Bq/m3 with 2σ uncertainties.
Figure 2. Layout of a continuous 222Rn monitoring system for the measurement of 222Rn in surface water bodies.
In order to get acceptable precision, 222Rn activity at each location was counted for two hours (3 cycles of counting) after reaching equilibrium. At room temperature, as there is about four times more radon in the air than in water at equilibrium, the measured radon concentration in air was corrected accordingly (Weigel Citation1978). The precision of 222Rn measurement by this method is ±5 Bq/m3.
For 222Rn measurement in groundwater, the sample was collected in airtight 250 ml glass bottle. In the laboratory, the dissolved radon in water is stripped out by bubbling air and circulated through a closed air-loop via a desiccant tube into the 222Rn measuring system. The system usually reaches equilibrium within 5 min. After attaining the equilibrium, the 222Rn activity is counted for 40 minutes (4 cycles of 10 minutes counting). The measured radon activities were also corrected for radioactive decay.
Results and discussion
During the first sampling campaign (i.e. 1 day after the appearance of low salinity water in the Mahim Bay), the Electrical Conductivity (EC) of the coastal water on the eastern flank of the Bay during the low tide varied from 1,730 µS/cm near the Mahim Mosque to 6,720 μS/cm near Worli, whereas it was 17,450 μS/cm in the western part of the Bay near Bandra (). The electrical conductivities of the Mithi River and the shallow groundwater were 489 and 320 μS/cm, respectively. The electrical conductivity of the seawater away from the coast was about 57,000 μS/cm. A freshwater spring was visually observed on the Mahim Beach near the Mosque during the first sampling period. pH of the coastal water indicated that it was neutral to alkaline in nature (pH varied from 7.5 to 8.1) while Mithi River, groundwater and seawater were alkaline (pH = ∼8.0).
Table 1. Results of the isotope analysis for samples collected from the Mahim area.
During the second sampling period (i.e. 3 days after the appearance of low salinity water in the Mahim Bay), the electrical conductivity of the coastal water remained more or less similar (6,470 ± 110 μS/cm) to that of the first sampling period, except near the Mahim Mosque, where EC was increased to 5,500 μS/cm. pH also remained more or less similar to that of the first sampling period. EC of the coastal water was further increased (varied from 14,270 to 21,000 μS/cm), 13 days after the occurrence of low salinity water in the Mahim Bay (during third sampling period).
The lower electrical conductivity seen in the eastern part of the Mahim Bay compared to the seawater could be due to the dilution of seawater with the freshwater discharges into the Bay. The possible sources of freshwater discharges include the surface runoff discharging into the Bay through numerous storm water drains after a rain event, the flood water in the Mithi River due to the overflow of Vihar and Powai lakes, and the submarine groundwater discharge occurring at the coastal areas.
Researchers of National Institute of Oceanography, Mumbai measured the salinity, dissolved oxygen, nutrients (,
,
-P etc.) and phytoplankton in the coastal waters, 1 day after the appearance of low salinity water in the Mahim Bay, and hypothesised that the discharge of Mithi River because of the overflow of Vihar and Powai lakes situated on the upstream of the catchment and the surface runoff from the nearby areas, were the causes for the occurrence of low salinity water in the Bay (NIO Citation2006). Singhal et al. (Citation2007) partially supported this hypothesis based on the measurement of radionuclides such as total uranium (U) and potassium-40 (40K) in coastal water. These measurements gave values similar to the rainwater, indicating that the discharge of freshwater dominated by rainwater as the cause for the freshening of seawater in Mahim Bay.
Based on the local hydrogeology of the area, the geologists at Indian Institute of Technology – Bombay, Mumbai opined that this phenomenon could be because of the submarine groundwater discharge in the coastal area (The Hindu Citation2006). The authors were of the opinion that the continuous rainfall occurred a few days prior to the event, might have fully recharged the aquifer and the aquifer would be discharging the groundwater through the fractures in the basaltic rocks. The above hypotheses were evaluated in the present study using hydrochemical parameters and environmental isotopes.
Hydrochemistry
From the hydrochemical facies of the water samples collected from the various suspected sources such as: rain, Mithi River and groundwater and the coastal water (, ), it is observed that, except the groundwater, Mithi River and rainwater samples, all other samples show Na–Cl type of water and fall on the saline zone of the Piper’s plot (Piper Citation1994). Mithi River and rainwater samples show Na–Ca–Cl–HCO3 type while the groundwater shows Na–Ca–HCO3 type. A similar water facies for groundwater of this region was reported by Tirumalesh et al. (Citation2010). Although, all the samples collected from the coastal region show lower ionic content, still they are Na–Cl dominant type, similar to the standard seawater.
Figure 3. Piper’s trilinear plot (Piper Citation1994) showing the water type of various sources suspected of contributing to the low salinity water in the Mahim Bay.
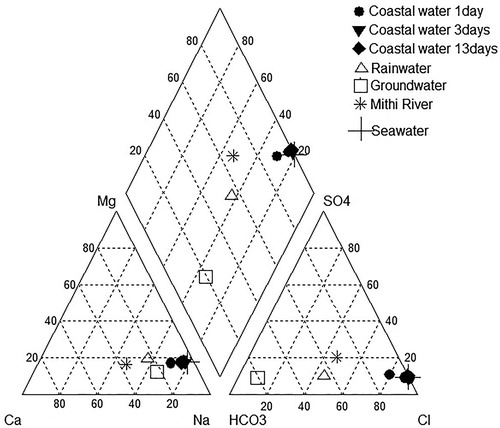
Table 2. Results of the hydrochemical analysis for samples collected from the Mahim area.
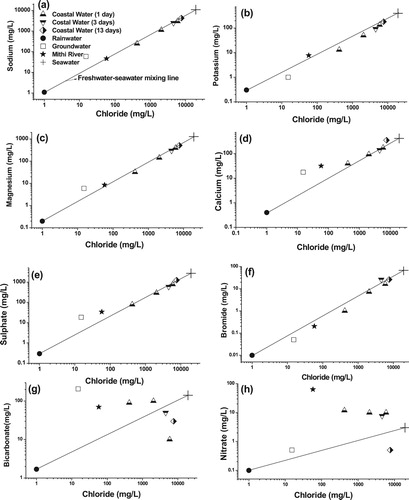
In order to evaluate the variation of ionic concentrations with respect to chloride, mixing plots are generally used. Chloride is a conservative ion and it does not react or enter into precipitation – dissolution processes except at brine concentrations and rarely enters into redox or adsorption reactions. Its conservative nature makes it suitable to compare with the relative loss or gain of other ions, which can constrain the possible seawater-freshwater mixing or water – rock interactions. It is observed that except in versus Cl–and
versus Cl– plots, major ion concentrations of low salinity coastal waters fall on the freshwater – seawater mixing line (). This indicates that additional sources or sinks contribute to
and
ions in coastal water. Samples from the coastal water and Mithi River fall above the mixing line in
versus Cl– plot ((h)) indicating anthropogenic contamination. High nitrate concentration is expected from different municipal wastes originating from various dumping grounds and untreated sewage in the city. Surface runoff from the rain dissolves nitrate ions from the municipal wastes and contributes to Mithi River. Nitrate concentration up to 160 mg/L was reported in Mithi River by Nagarsekar and Kakde (Citation2014), which was attributed to the contribution from untreated sewage. High nitrate in these low salinity coastal waters could be due to mixing of river water with seawater and/or by the discharge of untreated sewage directly into the coastal water. However, low salinity coastal water sample (after 13 days) show similar value that of groundwater and fall below the mixing line in the NO3- versus Cl– plot ((h)). This shows that low salinity coastal water is a mixture of river water, groundwater and seawater. In
versus Cl– plot ((g)), it is observed that groundwater, river water and low salinity coastal water fall above the freshwater – seawater mixing line with groundwater having the highest
concentration. Groundwater in this region contains relatively high bicarbonate due to rock – water interactions (Tirumalesh et al. Citation2010). River water and low salinity coastal water samples fall in between the groundwater and seawater end members ((g)). This indicates that the low salinity coastal waters have a significant component of groundwater. Even in this case, one low salinity coastal water sample (after 13 days) shows low bicarbonate concentration and fall below the mixing line, indicating comparatively lower contribution of groundwater to the coastal water after 13 days.
Figure 4. (a–h) Mixing plots showing the variation of different ions with respect to chloride concentration.
Characteristic ionic ratios are very useful in interpreting the relative contribution of marine and freshwater components (). These ratios were used to compare the chemical nature of the low salinity coastal water with other suspected sources such as groundwater, rain water and Mithi River water. From the ionic ratios, it is inferred that the low salinity coastal water observed near the Mahim Mosque, 1 day after the seawater freshening event (C2X), has all the characteristic ratios higher than that of seawater. Higher values of these characteristic ratios are typical of freshwater like groundwater. These ratios are not very high as in the case of groundwater; it probably means some contribution of river water to the low salinity coastal water near the Mahim Mosque. Hence, these ionic ratios of low salinity coastal waters indicate the contribution from river as well as groundwater components. It is also possible that the groundwater contributes to both river and coastal water. Coastal water samples collected after 3 and 13 days of the seawater freshening event show decreased values for characteristic ionic ratios, which could be due to decreased contribution of freshwater.
Table 3. Ionic ratios of samples collected from the Mahim area.
Stable isotopes (δ18O and δ2H)
The stable 18O and 2H isotopes of water are generally considered to behave conservatively in the absence of significant evaporation and mixing with other water of different isotopic signatures. However, physical processes, such as evaporation and condensation, during which the associated waters, depending on their geographical locations, get labelled naturally with distinct isotopic signatures. By tracing the naturally labelled isotopic signatures, it is possible to obtain several information related to surface water groundwater interactions and associated hydrological processes.
The δ18O and δ2H values of coastal water varied from −1.2 to −0.3 ‰ and −4.0 to −0.1 ‰, respectively, with more depleted values during the first sampling period (1 day after the appearance of low salinity water) (). The δ18O and δ2H in Mithi River were −1.3 ‰ and −4.8 ‰ while in groundwater, the average values were −1.5 ‰ and −4.7 ‰, respectively. The rainwater had δ18O and δ2H values −2.1 ‰ and −7.2 ‰, respectively, which was isotopically different when compared to Mithi River or groundwater. The similarity in stable isotopic composition of Mithi River and groundwater shows that there was substantial contribution of groundwater to the Mithi River. Although, Mithi River and groundwater were derived from the local rainfall, their stable isotopic compositions were found to be slightly enriched compared to the rainwater.
Figure 5. δ18O versus δ2H plot for water samples collected from the Mahim area. The Global Meteoric Water Line (GMWL) is also plotted for comparison, using the equation of Craig (Citation1961), δ2H = 8δ18O + 10.
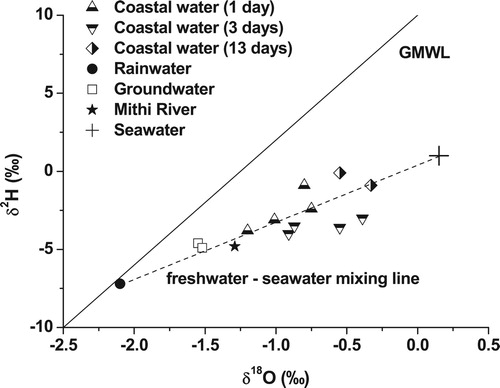
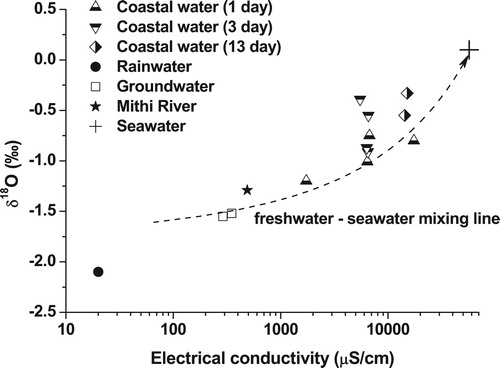
The rainwater samples lies near the Global Meteoric Water Line (GMWL), while samples from Mithi River and groundwater fall slightly on the right-hand side of the line indicating evaporation effect (). The low salinity coastal water lies in a mixing line between freshwater sources (Mithi River and groundwater) and seawater. This indicates that the coastal water received varying amounts of fresh groundwater through the coastal areas and the Mithi River. A similar trend was also seen in electrical conductivity versus δ18O plot (). The freshwater sources such Mithi River and groundwater are characterised by comparatively lower electrical conductivities and depleted stable isotopic composition while seawater is characterised by higher electrical conductivity and enriched stable isotopic composition. The low salinity coastal water samples falls in a mixing line between freshwater sources and seawater signifying freshwater input through Mithi River and groundwater.
Figure 6. Plot of electrical conductivity versus δ18O for water samples collected from Mahim area.
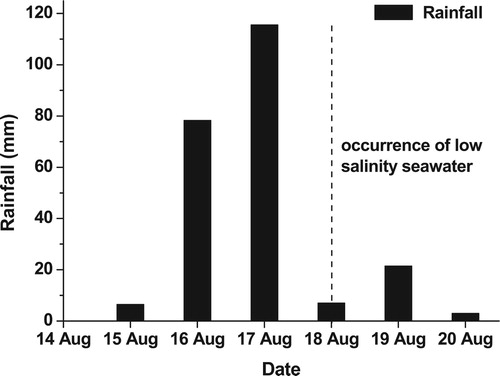
The lowest electrical conductivity and depleted δ18O in coastal water was observed 1 day after the appearance of low salinity water (). The electrical conductivity of coastal water near Mahim Mosque increased from 1,730 μS/cm on the first day after the appearance of low salinity water to 14,270 μS/cm, after 13 days. The δ18O of the coastal water got enriched from −1.2 ‰ on the first day to −0.6 ‰ after 13 days. The gradual increase in electrical conductivity and enrichment in δ18O with time implies that the freshwater discharge was decreasing with time elapsed since the event. It was seen that relatively high rainfall occurred a few days before the seawater freshening event (). Since, it was towards the end of the monsoon season, the aquifers might be fully recharged and it would have released excess water available due to high rainfall, in the form of submarine groundwater discharge through the fractures in the coastal areas and the alluvium present along the Mithi River. In order to confirm this hypothesis, in-situ radon monitoring study was also conducted in the Mahim Bay.
Figure 7. Temporal variation of δ18O and electrical conductivity in coastal water near Mahim Mosque.
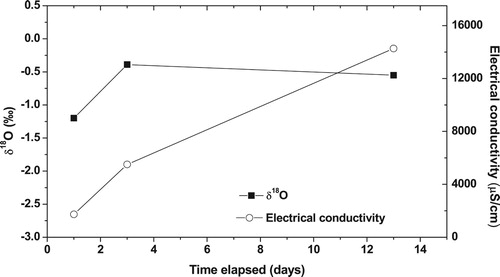
Figure 8. Distribution of daily rainfall at Trombay (∼15 km east of Mahim), a few days prior to the seawater freshening event in Mahim Bay (modified from Singhal et al. Citation2007).
Radon (222Rn)
Radon is recognised as a potential natural tracer for studying the hydraulic interaction between groundwater and surface water (Zhang et al. Citation2017; Yi et al. Citation2018), mapping the groundwater flow (Tallini et al. Citation2013), estimating the groundwater velocity and residence time (Schubert et al. Citation2011) etc. The processes such as: rock weathering, radioactive decay of 226Ra to 222Rn, and restricted atmospheric interaction, leads to high activities (3–4 orders of magnitude) of unsupported 222Rn in groundwater (Kraemer and Genereux Citation1998). Conversely, surface waters typically have low 222Rn activities due to the negligible 222Rn content in rain. After groundwater containing 222Rn discharges to surface water bodies, 222Rn activities tend to decrease because of dilution due to mixing with surface water, gas exchange with atmosphere and inherent radioactive decay. As a result, groundwater discharges into surface waters can often be easily detected by their characteristic 222Rn enrichment in surface waters and thus helps as an indirect tracer of groundwater discharge into lake, river, sea etc. (Luo et al. Citation2016; Zhang et al. Citation2018; Peterson et al. Citation2019).
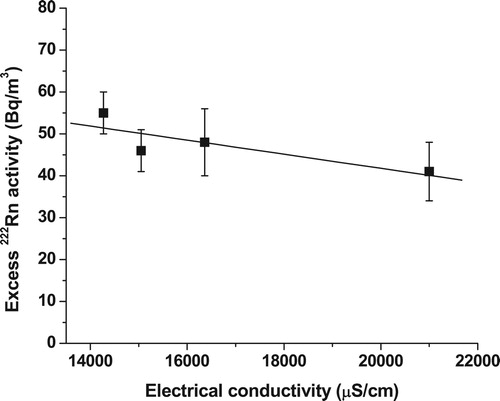
In order to verify the groundwater discharge into the coastal area, it is essential to measure the 222Rn activities in the end members i.e. in the groundwater and seawater away from the coast (Jacob et al. Citation2009). The groundwater in the Mahim area had a 222Rn activity of 2100 ± 250 Bq/m3 (). The seawater away from the coast showed an average 222Rn activity of 5 ± 5 Bq/m3, which is taken as the background 222Rn activity in the coastal water. The background 222Rn activity in the seawater away from the coast can be assumed as the radon flux emanating as a result of the diffusion from the sediments (Burnett et al. Citation2001). Excess 222Rn activities were calculated by subtracting the background 222Rn activity from the measured activities at various locations in the coastal water. Excess 222Rn activities in the Mahim Bay, 13 days after the seawater freshening event varied from 41 to 55 Bq/m3. The relatively high 222Rn activities in the Mahim Bay could be due to the direct inputs of 222Rn rich groundwater into the Bay or groundwater inflow to the Mithi River, which was eventually discharged into the Bay. It also implies that groundwater discharge to the coastal areas existed even after 13 days of seawater freshening event. A negative linear correlation was observed, with areas of lower electrical conductivities in the Bay, which were associated with higher amount of excess 222Rn activities, while areas of higher electrical conductivities are associated with lower amount of excess 222Rn activities (). Spatial distribution of 222Rn activities in the coastal water of Mahim Bay indicated that the area close to Mahim Mosque received relatively high groundwater discharge compared to other shelf waters.
Figure 9. Variation of excess 222Rn activity with electrical conductivity in the Mahim Bay, 13 days after the seawater freshening event. The regression line is given by: A = −0.002EC + 75 (r2 = 0.61, n = 4), where A is the excess 222Rn activity and EC is the electrical conductivity. The error bars represent the precision of 222Rn measurements. The intersection of x- and y-axis is not at (0,0).
Like 222Rn, various other uranium series isotopes such as radium (eg. 226Ra), uranium (eg. 234U/238U ratio) could also be used as tracers of groundwater discharge (Moore Citation1996, Citation1997). Singhal et al. (Citation2007) measured the total uranium and 40K in the Mahim Bay following the seawater freshening event. However, they could not find a characteristic groundwater signature of these radionuclides in the coastal water. This could be due to a lower solubility of uranium and 40K to the shallow groundwater from the aquifer matrix (i.e. less rock-water interaction) and because of the short residence time of groundwater (may be a few days) in the aquifer. In contrast, 222Rn being a soluble gas, readily dissolves in groundwater and show appreciable activity in groundwater.
Conclusion
Based on the hydrochemical and environmental isotope (δ18O, δ2H and 222Rn) studies, it is concluded that the subsurface groundwater discharge was most likely responsible for the occurrence of low salinity water in the Mahim Bay. It appears that, the overflow of Vihar and Powai Lakes in the catchment of Mithi River and surface runoff due to rain were unlikely to be the causes for the freshening event. It was also found that these groundwater inputs decreased after the storm event.
Thus, the study highlights the usefulness of 222Rn as a tracer to distinguish the subsurface flow of water to the coastal system.
Acknowledgements
This study was initiated with the help and support of Dr Rakesh Kumar, then Head, Regional Centre, National Environmental Engineering Research Institute, Mumbai. We are thankful to him. We extent our sincere thanks to our colleagues, G. N. Mendhekar, for his help during the field monitoring programme and Md. Arzoo Ansari, for preparing the maps. We are also thankful to Ms Archana Deodhar, Group Leader, Isotope Hydrology Section, IRAD and Dr P. K. Pujari, Director, RC & IG, BARC for their encouragement and support.
Disclosure statement
No potential conflict of interest was reported by the author(s).
References
- Burnett WC, Kim G, Lane-Smith DR. 2001. A continuous radon monitor for assessment of radon in coastal ocean waters. J Radioanal Nucl Chem. 249:167–172. doi: 10.1023/A:1013217821419
- Cable JE, Burnett WC, Chanton JP, Weatherly GL. 1996. Modelling groundwater flow into the ocean based on 222Rn. Earth Planet Sci Lett. 144:591–604. doi: 10.1016/S0012-821X(96)00173-2
- CGWB. 2009. Groundwater information, greater Mumbai district, Maharashtra. A report. Central Ground Water Board [accessed 2016 Jan 26]. http://cgwb.gov.in/District_Profile/Maharashtra/Greater%20Mumbai.pdf.
- Coplen TB. 1996. New guidelines for reporting stable hydrogen, carbon and oxygen isotope-ratio data. Geochem Cosmochem Acta. 60:3359–3360. doi: 10.1016/0016-7037(96)00263-3
- Craig H. 1961. Isotopic variation in meteoric waters. Science. 133:1702–1703. doi: 10.1126/science.133.3465.1702
- DNA. 2006. People defy health warning, continue to taste ‘sweet’ water. DNA. [accessed 2016 Jan 26]. http://www.dnaindia.com/mumbai/report-people-defy-health-warning-continue-to-taste-sweet-water-1048386.
- Dulaiova H, Camilli R, Henderson PB, Charette MA. 2010. Coupled radon, methane and nitrate sensors for large-scale assessment of groundwater discharge and non-point source pollution to coastal waters. J Environ Radioact. 101:553–563. doi: 10.1016/j.jenvrad.2009.12.004
- Fritz P, Fonts JC. 1980. Handbook of environmental isotope geochemistry. Vol. 1. New York (NY): Elsevier.
- Goldberg ED. 1963. Chemistry – the ocean as a chemical system. In: Hill MN, editor. Composition of seawater, comparative and descriptive oceanography . Vol. 2. New York (NY): Interscience; p. 3–25.
- Gwak YS, Kim SH, Lee YW, Khim BK, Hamm SY, Kim SW. 2014. Estimation of submarine groundwater discharge in the Il-Gwang watershed using water budget analysis and 222Rn mass balance. Hydrol Process. 28:3761–3775. doi: 10.1002/hyp.9927
- The Hindu. 2006. IIT geologists say Mahim miracle a natural phenomenon. The Hindu. [accessed 2016 Jan 26]. http://www.thehindu.com/holnus/008200608200340.htm.
- Jacob N, Babu DSS, Shivanna K. 2009. Radon as an indicator of submarine groundwater discharge in coastal regions. Curr Sci. 97:1313–1320.
- Kraemer TF, Genereux DP. 1998. Applications of uranium and thorium series radionuclides in catchment hydrology studies. In: Kendall C, McDonnell JJ, editors. Isotope tracers in catchment hydrology. Amsterdam: Elsevier; p. 241–249.
- Lane-Smith DR, Burnett WC, Dulaiova H. 2002. Continuous radon-222 measurements in the coastal zone. Sea Tech. 43:37–45.
- Lin I, Wang C, Lin S, Chen Y. 2011. Groundwater-seawater interactions off the coast of southern Taiwan: Evidence from environmental isotopes. J Asian Ear Sci. 41:250–262. doi: 10.1016/j.jseaes.2011.03.001
- Luo X, Jiao JJ, Wang X, Liu K. 2016. Temporal 222Rn distributions to reveal groundwater discharge into desert lakes: implication of water balance in the Badain Jaran Desert, China. J Hydrol. 534:87–103. doi: 10.1016/j.jhydrol.2015.12.051
- Moore WS. 1996. Large groundwater inputs to coastal waters revealed by 226Ra enrichments. Nature. 380:612–614. doi: 10.1038/380612a0
- Moore WS. 1997. The effects of groundwater input at the mouth of the Ganges-Brahmaputra Rivers on barium fluxes to the Bay of Bengal. Earth Planet Sci Lett. 150:141–150. doi: 10.1016/S0012-821X(97)00083-6
- Moore WS, Kjerfve B. 1998. Identification of rain-freshened plumes in the coastalocean using Ra isotopes and Si. J Geophys Res. 103:7709–7717. doi: 10.1029/98JC00246
- Moore WS, Sanniento JL, Key RM. 1986. Tracing the Amazon component of surface Atlantic water using 228Ra, salinity and silica. J Geophys Res. 91:2574–2580. doi: 10.1029/JC091iC02p02574
- Nagarsekar AS, Kakde UB. 2014. A study of physico-chemical parameters of Mithi River water in Mumbai metropolis. Int Res J Chem. 5:24–42.
- NIO. 2006. Occurrence of low salinity water in the Mahim Bay: a scientific assessment. A report. Mumbai: National Institute of Oceanography. [accessed 2016 Jan 26]. http://www.nio.org/userfiles/file/tr_mumbai_06.pdf.
- Noble J, Ansari A, Revichandran C. 2015. Environmental isotopes to test hypotheses for fluid mud (mud bank) generation mechanisms along the southwest coast of India. Estuar Coast Shelf Sci. 164:115–123. doi: 10.1016/j.ecss.2015.07.018
- Ortner PB, Lee TN, Milne PJ, Zika RG, Clarke E, Podesta GP, Swart PK, Tester PA, Atkinson LP, Johnson WR. 1995. Mississippi River flood waters that reached the Gulf Stream. J Geophys Res. 100:13595–13602. doi: 10.1029/95JC01039
- Peterson RN, Meile C, Peterson LE, Carter M, Miklesh D. 2019. Groundwater discharge dynamics into salt marsh tidal river. Estuar Coast Shelf Sci. 218:324–333. doi: 10.1016/j.ecss.2019.01.007
- Piper AMA. 1994. Graphical procedure in the geochemical interpretation of water analysis. EOS Trans Am Geophys Union. 25:914–928. doi: 10.1029/TR025i006p00914
- Sabnis MM. 1984. Studies of some major and minor elements in the polluted Mahim River estuary [PhD thesis]. University of Bombay. p. 1–288.
- Sabnis MM, Zingde MD. 1989. Flushing characteristics of Mahim River estuary. Adv Biosci. 8:1–7.
- Schiavo MA, Hauser S, Povinec PP. 2009. Stable isotopes of water as a tool to study groundwater – seawater interactions in coastal south-eastern Sicily. J Hydrol. 364:40–49. doi: 10.1016/j.jhydrol.2008.10.005
- Schubert M, Brueggemann L, Knoeller K, Schirmer M. 2011. Using radon as an environmental tracer for estimating groundwater flow velocities in single well tests. Water Resour Res. 47:W03512. doi: 10.1029/2010WR009572
- Simstich J, Harms I, Karcher MJ, Erlenkeuser H, Stanovoy V, Kodina L, Bauch D, Spielhagen RF. 2005. Recent freshening in the Kara Sea (Siberia) recorded by stableisotopes in Arctic bivalve shells. J Geophys Res. 110:C08006. DOI:10.1029/2004JC002722.
- Singhal RK, Karpe R, Kumar A, Jayaprakash P, Joshi VM. 2007. Geochemical studies for occurrence of low salinity water in Mahim Bay on August 19, 2006. Proceedings of 15th National Symposium on Environment; 2007 June 5; Coimbatore, India. p. 597–602.
- Tallini M, Parisse B, Petitta M, Spizzico M. 2013. Long-term spatio-temporal hydrochemical and 222Rn tracing to investigate groundwater flow and water–rock interaction in the Gran Sasso (central Italy) carbonate aquifer. Hydrogeol J. 21:1447–1467. doi: 10.1007/s10040-013-1023-y
- Tirumalesh K, Shivanna K, Sriraman AK, Tyagi AK. 2010. Assessment of quality and geochemical processes occurring in groundwaters near central air conditioning plant site in Trombay, Maharashtra, India. Environ Monit Assess. 163:171–184. doi: 10.1007/s10661-009-0825-9
- Valiela I, Camilli L, Stone T, Giblin A, Crusius J, Fox S, Barth-Jensen C, Monteiro RO, Tucker J, Martinetto P, Harris C. 2012. Increased rainfall remarkably freshens estuarine and coastal waters on the Pacificcoast of Panama: magnitude and likely effects on upwelling and nutrient supply. Glob Planet Change. 92–93:130–137. doi: 10.1016/j.gloplacha.2012.05.006
- Weigel F. 1978. Radon. ChemikerZeitung. 102:287–299.
- Wikipedia. 2006. 2006 Mumbai sweet seawater incident. [updated 2016 Jan 16;accessed 2016 Jan 26]. https://en.wikipedia.org/wiki/2006_Mumbai_sweet_seawater_incident.
- Yi P, Luo H, Chen L, Yu Z, Jin H, Chen X, Chengwei W, Aldahan A, Zheng M, Hu Q. 2018. Evaluation of groundwater discharge into surface water by using radon-222 in the source area of the Yellow River, Qinghai-Tibet Plateau. J Environ Radioact. 192:257–266. doi: 10.1016/j.jenvrad.2018.07.003
- Zhang Y, Li H, Wang X, Wang C, Xiao K, Qu W. 2018. Submarine groundwater discharge and chemical behavior of tracers in Laizhou Bay, China. J Environ Radioact. 189:182–190. doi: 10.1016/j.jenvrad.2018.04.002
- Zhang Y, Li H, Xiao K, Wang X, Lu X, Zhang M, An A, Qu A, Wan L, Zheng C, Wang X. 2017. Improving estimation of submarine groundwater discharge using radium and radon tracers: application in Jiaozhou Bay, China. J Geophy Res Oceans. 122:8263–8277. doi: 10.1002/2017JC013237
- Zingde MD, Desai BN. 1980. Wastewater discharge and its effects on the quality of water of Mahim Creek and Bay. Mahasagar – Bulletin of National Institute of Oceanography. 13:205–213.