
ABSTRACT
Based on the subsurface mooring observations at 159°59′E, 14°40′N from July 2014 to May 2016, the vertical structure and variability of the North Equatorial Current/Undercurrent (NEC/NEUC) are investigated. The NEC flows westward stably from the sea surface down to 500 m and is strongest with the magnitude of approximately 40 cm/s in January 2016, while in several months, the eastward current occurs and attains the maximum of nearly 15 cm/s in April and September 2015. Beneath the NEC, the eastward NEUC is observed and its depth could reach at least 860 m. The Power Spectral Density function reveals surface-intensified signals of the currents at mooring site, and the period in the upper layer is around 30–155 days. AVISO products accurately describe the variability of the NEC and are consistent with the mooring observations. Further analysis with sea level anomaly data suggests that the mesoscale eddies, which move westward, may influence the intraseasonal variability measured by the mooring. A comparison of the results with other mooring observations at 130°E implies the phenomenon of western intensification and the existence of NEUC jets at different longitudes that they are not observed at 130°E, 15.5°N.
1 Introduction
The North Equatorial Current (NEC) which is driven by the trade wind flows westward stably and connects subtropical with tropical gyres in the North Pacific Ocean. It transports water into the western tropical Pacific and contributes to the establishment of tropical warm pools and the Northern Hemisphere climate (Dunxin and Maochang Citation1991; Clement et al. Citation2005; Hu et al. Citation2015; Omrani et al. Citation2019; Park et al. Citation2019). Many oceanographers have investigated the NEC’s characteristics and variability at intraseasonal, seasonal, interannual and decadal time scales based on in situ observations (Wang and Hu Citation2006; Kashino et al. Citation2009; Wang et al. Citation2009; Zhai and Hu Citation2012; Zhai et al. Citation2013; Hu and Hu Citation2014; Schönau and Rudnick Citation2015; Zhang et al. Citation2017; Wang et al. Citation2019), numerical model simulations (Qiu and Lukas Citation1996; Chen and Wu Citation2011; Jensen Citation2011; Ju et al. Citation2013; Zhai et al. Citation2014a; Zhai et al. Citation2014b) and ocean reanalyzes (Meng et al. Citation2011; Chen and Wu Citation2012; Zhai and Hu Citation2013; Yan et al. Citation2014, Zhai et al. Citation2014a, Zhao et al. Citation2015; Wu et al. Citation2016; Zhai et al. Citation2018). Beneath the NEC, the intermittent North Equatorial Undercurrents (NEUC) which originates in annual baroclinic Rossby waves driven by the large-scale surface wind stress forcing flows in reverse (Qiu, Chen et al. Citation2013). Using in situ measurements (Toole et al. Citation1988; Dutrieux Citation2009; Qiu, Chen et al. Citation2013; Zhang et al. Citation2017; Ishizaki et al. Citation2019) and model simulations (Qiu, Rudnick et al. Citation2013; Li et al. Citation2018), oceanographers investigate the NEUC.
Studies of the NEC/NEUC mainly focus on the western region of the NEC/NEUC between 130°E and 137°E, and have demonstrated that the main body of the western NEC is in the upper layer at depths shallower than 26.5–26.8 σθ or in depths of 400–500 m between 7°N and 21°N (Kawae et al. Citation1998; Kashino et al. Citation2009; Zhai and Hu Citation2013; Hu and Hu Citation2014; Schönau and Rudnick Citation2015; Zhang et al. Citation2017; Wang et al. Citation2019); furthermore, there are several quasi-steady eastward jets known as NEUC beneath the thermocline at certain latitudes such as 15.5°N and 18°N, 130°E (Dunxin and Maochang Citation1991; Kashino et al. Citation2009; Zhang et al. Citation2017; Ishizaki et al. Citation2019). At the intraseasonal time scale, the NEC/NEUC has a strong variability with periods of approximately 70–120 days. The source of this variability is mesoscale eddies caused by the baroclinic instability of currents (Qiu Citation1999; Chiang et al. Citation2015; Zhang et al. Citation2017). At the seasonal time scale, the NEC’s variability arises from wind to a large degree, via local Ekman pumping and westward-propagating Rossby waves (Yan et al. Citation2014; Wang et al. Citation2019). Few scholars have researched the other regions of the NEC/NEUC. Yan et al. (Citation2014) and Zhai et al. (Citation2018) used ECMWF Ocean Analysis/Reanalysis System 3 (ORA-S3) data to investigate the NEC between 130°E and 180°E. Zhai and Hu (Citation2012, Citation2013) and Wu et al. (Citation2016) used the same data to study the whole NEC. Dutrieux (Citation2009) studied the NEUC along 130°E, 137°E, 145°E, and 156°E by shipboard acoustic Doppler current profiler (SADCP) data. Qiu, Rudnick et al. (Citation2013) used profiling float data and Qiu, Chen et al. (Citation2013) and Li et al. (Citation2018) used an eddy-resolving model to study the NEUC in several regions. However, most studies based on indirect observations or model simulation, and lacked direct continuous observations to observe time series of the velocity profile of currents.
Lacking enough direct current measurements to characterise the NEC/NEUC east of the longitude 137°E, the NEC/NEUC’s characteristics and variability were imprecise formerly. To improve our understanding of these features, a subsurface mooring was deployed at approximately 160°E, 15°N to measure the NEC/NEUC far from the western boundary during July 2014 to May 2016 (). The mooring was equipped with an upward-looking 300 k-Hz Teledyne RD Instruments (TRDI) ADCP and a downward-looking 75 k-Hz TRDI ADCP at 150 m depth, as well as a single-point seaguard Recording Current Metre (RCM) Doppler current sensor at each depth of approximately 800 m and 1800m (). Based on these velocity records, we investigate the vertical structure and variability of the NEC/NEUC in this work.
Figure 1. Location of the subsurface mooring (white star). Colour shows the bathymetry of the western Pacific Ocean.
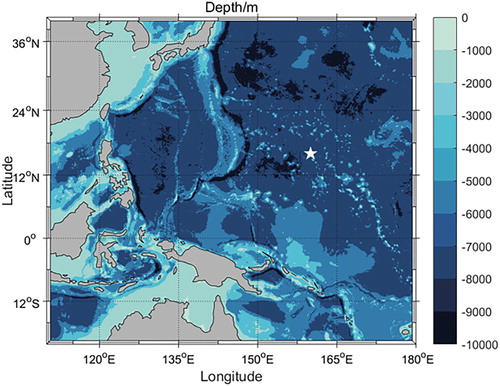
Table 1. Current meters in the subsurface mooring, deployed depths and operating frequencies of the current meters, data periods, number of days of observations, and depth range.
2 Data and methods
2.1 Acoustic doppler current profilers (ADCPs) and recording current meters (RCMs)
The subsurface mooring was deployed in July 2014 and recovered in May 2016 at approximately 160°E, 15°N (precisely 159°59′E, 14°40′N), where the water depth is 5446 m in the North Pacific Ocean (). The details of the mooring are listed in . Two ADCPs collected current data every hour in the upper layer and two RCMs collected current data every 10 minutes in the middle and deep layers, therefore, we were able to obtain information of both the NEC and deeper current. However, due to the limitation of devices themselves and in situ environment, the ADCP data deeper than 641 m had many missing values. Thus, the data from 641 m to 737 m depth were left out. Besides, the 75 k-Hz ADCP worked for only 82 days and the seaguard RCM at 1860 m worked for 281 days, which limited our study as well.
The measured current data were first processed with standard quality control procedures. Specifically, pitch and roll of mooring of less than 10° was adopted. The collected zonal velocities were not greater than triple standard deviations of every one-day/half-day zonal velocities for the ADCP/RCM data, so did the meridional velocities. Then the ADCP data were interpolated to depths of 30–126 m/161–641 m with 8 m/16 m intervals. Finally, considering the length of data, the 300 k-Hz ADCP and RCM data were averaged daily and the 75 k-Hz ADCP data were low-pass filtered with a cutoff period of 3 days to remove the tidal signal. Additionally, eastward and northward velocities are set positive, as well as westward and southward velocities are set negative in this study.
2.2 AVISO products, eddy detection and tracking algorithm
The altimeter products including sea level anomaly (SLA) data and sea surface geostrophic velocities were also used in the study. These products were distributed by Archiving, Validation, and Interpretation of Satellite Oceanographic (AVISO) from the website at http://www.aviso.oceanobs.com/. We downloaded the daily dataset during the observation period of the subsurface mooring with 0.25° × 0.25° resolution.
Daily SLA maps were used to automatically identify and characterise mesoscale eddies in the study region (155°E–165°E, 7°N–21°N). The modified algorithm was based on the studies of Chaigneau et al. (Citation2009) and Chelton et al. (Citation2011) (see the thesis of Ni (Citation2014) for a detailed review, which will not be repeated here). In this study, the mesoscale eddies had amplitudes/lifespans greater than 3 cm/18 days.
3 Results
3.1 Observations and mean structure at the mooring site
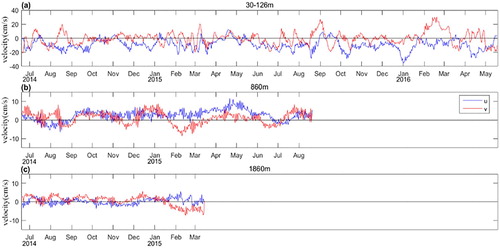
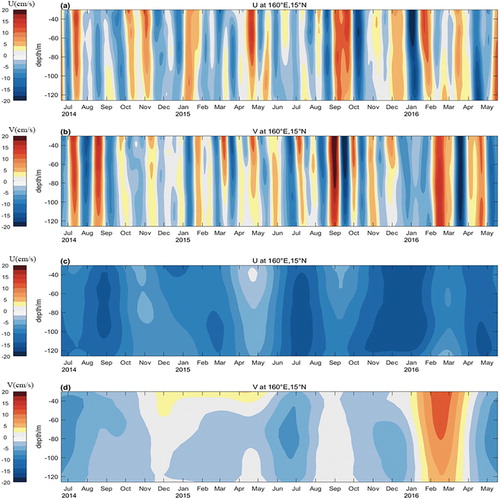
The daily averaged horizontal currents measured by the subsurface mooring are shown in (left), (left) and . During the observation period, the NEC flowed westward stably above 500 m, and was strongest with the velocity of nearly −40 cm/s in January 2016. But in several months, such as July and November 2014, January, April, and September 2015, the eastward flow occurred above 120 m, and reached the maximum of 15 cm/s in April and September 2015. Between 500 and 641 m, the eastward NEUC was observed during late June to early July in 2014 and could reach about 5 cm/s. But in August, it disappeared. At 860 m depths, zonal velocities were chiefly eastward and reached a maximum of nearly 10 cm/s in April 2015 when the eastward current was also strong in the upper layer. This may be linked with a mesoscale eddy, which will be discussed in section 3.3. At 1860 m, the small westward and eastward velocities appeared alternately. In the meridional direction, the current seemed to have stronger variability in the upper layer. And it flowed northward mainly in the layer deeper than 300 m.
Figure 2. Daily averaged zonal (a, left) and meridional (b, left) velocities with mean values (red line) and standard deviations (blue curve) measured by the 300 k-Hz ADCP at 160°E, 15°N from June 2014 to May 2016.
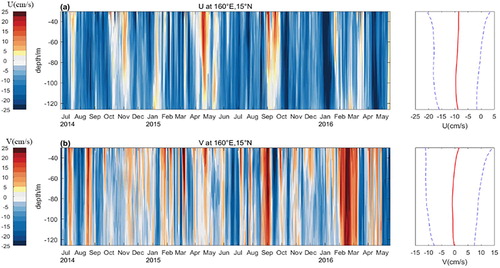
Figure 3. Daily averaged zonal (a, left) and meridional (b, left) velocities with mean values (red line) and standard deviations (blue curves) measured by the 75 k-Hz ADCP at 160°E, 15°N from June 2014 to September 2014.
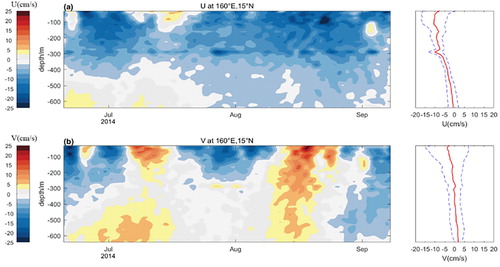
Figure 4. The zonal (blue line) and meridional (red line) velocities averaged from 30 m to 126 m depth (measured by the 300 k-Hz ADCP) and at depths of 860 and 1860 m (measured by the RCMs).
We calculated the mean velocity and standard deviation of the NEC and NEUC at different depths, as shown in (right), (right). The mean zonal velocity of the NEC was approximately −9 cm/s above 126 m and increased gradually with depth from 161 m to 641 m. It was −0.60 cm/s at 641 m. We calculated the vertically averaged mean velocity and standard deviation as well. In the zonal direction, the mean value/standard deviation averaged from 30 m to 126 m depth was −9.09/7.76 cm/s and averaged from 126 m to 500 m depth was −5.81/2.09 cm/s. Therefore, the standard deviation was smaller than the mean value of the current above 500 m, which means the NEC was steady. The mean value/standard deviation averaged from 500 m to 641 m depth was −1.23/2.41 cm/s, at 860 m depth was 2.53/2.99 cm/s and at 1860 m was 0.29/1.69 cm/s. Thus, the NEUC existed below the NEC at this place, but it was relatively weak. Mean current at 1860 m depth was negligible, and much smaller than the standard deviation, suggesting that the NEUC did not reach 1860 m depth. The mean meridional velocity of the NEC was approximately zero above 500 m and much less than the zonal velocity. The mean value/standard deviation averaged from 30 m to 126 m depth was −0.33/8.99 cm/s, averaged from 126 m to 500 m depth was −0.18/3.62 cm/s, averaged from 500 m to 641 m depth was 1.55/2.93 cm/s, at 860 m depth was 0.95/3.40 cm/s and at 1860 m was 0.59/2.70 cm/s. Since the mean current at the mooring site was dominated by the zonal component, and the mean meridional current was nearly zero, we focused on the zonal current.
3.2 Variability of the NEC/NEUC from mooring measurements
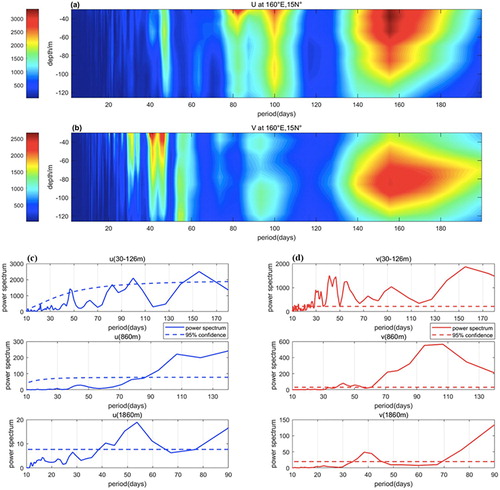
As discussed above, the standard deviations of the NEC and NEUC were comparable or larger than the respective mean values, suggesting considerable variability. In order to better analyze their variability, the time series measured by the 300 k-Hz ADCP above 126 m and data collected by the RCMs at 860 and 1860 m were processed under a Power Spectral Density (PSD) function, as shown in . The PSD for ADCP data illustrates the NEC had multiple cycles ranging from 30 to 155 days. Specifically, between 30 and 126 m, the zonal current had periods of nearly 50, 80, 100, and 155 days as well as the meridional current had periods of 30-60, 95, and 155 days. The PSD for RCM data shows that the NEUC had signals of 100–110 days in both the zonal and meridional directions at 860 m, which means the NEUC variability was predominantly presented with seasonal signals longer than 90 days. However, the power spectrum at 860 m was much smaller than that in the upper layer. At 1860 m, although the PSD shows the peaks around 1–2 months, the power spectrum was also very small and the flow here was likely very weak, so the period was ambiguity. As mentioned above, the dominant feature of the PSD was multiple surface-intensified peaks with period ranging from 30 to 155 days, indicating influences from traditional surface-intensified mesoscale processes. In the following text, we will focus on the major signals in the upper layer.
Figure 5. Power spectral density (PSD) of the zonal (a,c) and meridional (b,d) velocity time series at different depths including 30–126 m, 30–126 m depth-averaged, 860 and 1860 m.
To well clarify the intraseasonal and seasonal variability of the NEC, respectively, the 300 k-Hz ADCP data were processed using a 20–120-day band-pass filter and a 120-day low-pass filter, as shown in . The total variations of the velocities for the NEC in the upper layer are shown in (right, blue curve), about 66% and 34%, respectively, were induced by the intraseasonal and seasonal variability (estimated by dividing the standard deviations of 20–120-day band-pass filtered velocities and 120-day low-pass filtered velocities by those of the unfiltered velocities, respectively). (a,b) shows strong intraseasonal signals appeared from 30 to 126 m depth, and the amplitude of these signals reached 20 cm/s both in the zonal and meridional direction. Additionally, the meridional velocity varied more frequently than the zonal velocity. Moreover, the intraseasonal variability appeared to vary in different years, for example, zonal velocities with large fluctuations from August 2015 to January 2016 and with weak fluctuations from August 2014 to January 2015. Reason for this distinct interannual change will be explored in further studies. The result in (c,d) indicates that the NEC had a seasonal phase, in which the weakest westward current occurred in late spring 2015, whereas the strongest occurred in the winter of 2015. Notably, the eastward current disappeared, suggesting that the occurrence of eastward current was associated with mesoscale eddies in an intraseasonal time scale.
Figure 6. Time series of zonal and meridional velocities under a 20–120-day band-pass filter (a,b) and a 120-day low-pass filter (c,d) from 30 m to 126 m depth.
3.3 Variabilities in the sea surface from satellite measurements
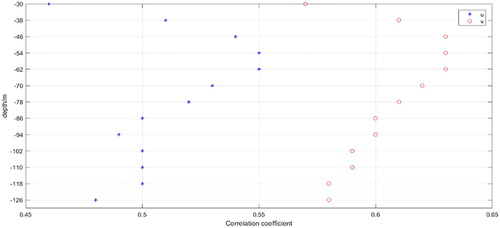
Due to the high strength of intraseasonal signals in the upper layer, satellite altimeters may capture these signals. We compared the geostrophic currents from AVISO products with the currents measured by mooring observations averaged in the 30–126 m depth range (). Time series present similar characteristics: sea surface currents flowed westward stably; in several months, eastward velocities occurred; the currents changed more frequently in the meridional direction. The correlation coefficient was 0.59 in the zonal direction and 0.67 in the meridional direction. We also calculated the correlation coefficient between the surface geostrophic currents and the currents at different depths measured by the 300 k-Hz ADCP (). The high correlation coefficients indicate that the sea surface geostrophic current from satellite altimetry data corresponds well with the currents measured by the subsurface mooring. Thus, AVISO products could accurately describe the NEC variability in the upper layer at the mooring site.
Figure 7. The zonal (a) and meridional (b) velocities averaged from depths of 30–126 m measured by mooring observations compared with the geostrophic currents from AVISO products.
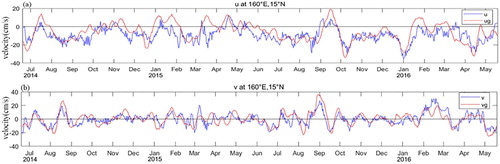
Figure 8. Correlation coefficient (above the 95% confidence level) between the velocities measured by mooring observations and the geostrophic currents from AVISO products.
We used SLA data from AVISO products to count the mesoscale eddies whose amplitudes were greater than 3 cm and lifespans were greater than 18 days of the area near the mooring site (155°E–165°E, 7°N–21°N). We found six mesoscale eddies might influence current variability measured by the mooring during the observation period ( and ). These eddies were five cyclonic eddies (CE) and an anticyclonic eddy (AE). They all moved westward. displays the process of CE1 transiting the mooring site (other eddies are not shown). shows that in August 2014, April, August, September 2015, and January, February 2016, CE1–CE5 transited the mooring site, and in July 2014, AE1 transited the mooring site. As discussed above, the eastward current was very strong in April and September 2015, and the westward currents reached a maximum in January 2016. Time of the strong variability of currents measured by mooring matched well with that of the eddies transiting mooring site. Therefore, these mesoscale eddies played an important role in the current variability at the mooring site.
Figure 9. Process of CE1 transiting the mooring site. The black stars denote the mooring site. The black dots denote the centres of CE1, and the black lines denote the edges of CE1. CE2-5 are similar (not shown).
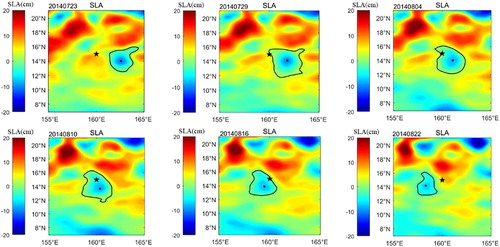
Table 2. Statistics of the mesoscale eddies that transited the mooring site during the observation period. CE means cyclonic eddy. AE means anticyclonic eddy.
4 Summary and discussion
Based on the subsurface mooring observations deployed at approximately 160°E, 15°N and AVISO products, the vertical structure and variability of the NEC/NEUC are investigated. The NEC flowed westward stably from sea surface down to 500 m. Beneath it, the eastward NEUC jets could reach a depth between 860 and 1860 m. The PSD function showed the current had multiple surface-intensified peaks, and the period in the upper layer ranging from 30 to 155 days. The mooring observations revealed the NEC had strong intraseasonal variability and relative weak seasonal variability as well. AVISO products accurately described the variability of the NEC and that they were consistent with the mooring observations. SLA data illustrated that six mesoscale eddies transited the mooring site during the observation period and might cause the intraseasonal variability of current measured by the mooring.
A comparison of the results with other mooring observations at 130°E from September 2014 to September 2015 (obtained from previous studies (Zhang et al. Citation2017; Wang et al. Citation2019)) indicates that there are similarities and differences between 130°E and 160°E. The vertical structure of the NEC was similar, with a stable westward current, but the mean zonal velocity at 160°E, 15°N was much smaller than that at 130°E, 15.5°N, which reflected the phenomenon of western intensification. In addition, we found the NEUC below the NEC at 160°E,15°N, but the NEUC does not exist at 130°E, 15.5°N, which implied the NEUC varied with longitudes. Moreover, the observations at 130°E, 15.5°N and 160°E, 15°N both illuminated the NEC had strong intraseasonal variability with multiple periods, but the former were 15–120 days and the latter were 30–150 days. Their investigations also showed that the NEC had varying strength with latitude, so did the NEUC. However, in this study, we just discuss the NEC and NEUC at a single point in space and unable to capture the whole picture of them at 160°E due to the limitation of data. For further studies on NEC/NEUC, mooring arrays deployed at different latitudes and longitudes are really needed.
Nowadays, numerical ocean current models are common tools to study the real ocean. But the validation of models depends on measured data. We used the 300 k-Hz ADCP data to assess hindcast data of HYCOM + NCODA Global 1/12° Analysis (GLBu0.08/expt_91.1) dataset. We calculated the correlation coefficient between the zonal/meridional velocities averaged at a depth of 30–126 m from the ADCP and those averaged at a depth of 30–125 m from the numerical simulation. It was 0.28 in zonal direction and −0.05 in meridional direction, respectively. The low correlation coefficient implied the model does not depict the NEC at the mooring site well and it may be more suitable for studying large-scale circulation.
Acknowledgements
The mooring data were sourced from author Xi Chen. The data for sea level anomaly and sea surface geostrophic velocities distributed by AVISO are available at the website: http://www.aviso.oceanobs.com/. The hindcast velocities data of HYCOM + NCODA Global 1/12° Analysis (GLBu0.08/expt_91.1) dataset are available at the website: http://tds.hycom.org/thredds/catalogs/GLBu0.08/expt_91.2.html.
Disclosure statement
No potential conflict of interest was reported by the author(s).
References
- Chaigneau A, Eldin G, Dewitte B. 2009. Eddy activity in the four major upwelling systems from satellite altimetry (1992-2007). Prog Oceanogr. 83(1):117–123. doi: 10.1016/j.pocean.2009.07.012
- Chelton DB, Schlax MG, Samelson RM. 2011. Global observations of nonlinear mesoscale eddies. Prog Oceanogr. 91(2):167–216. doi: 10.1016/j.pocean.2011.01.002
- Chen Z, Wu L. 2011. Dynamics of the seasonal variation of the North Equatorial Current bifurcation. J Geophys Res Oceans. 116. doi: 10.1029/2011JD016244
- Chen Z, Wu L. 2012. Long-term change of the Pacific North Equatorial Current bifurcation in SODA. J Geophys Res Oceans. 117.
- Chiang T, Wu C, Qu T, Hsin Y. 2015. Activities of 50–80 d subthermocline eddies near the Philippine coast. J Geophys Res Oceans. 120:3606–3623. doi: 10.1002/2013JC009626
- Clement AC, Seager R, Murtugudde R. 2005. Why are there tropical warm pools? J Clim. 18(24):5294–5311. doi: 10.1175/JCLI3582.1
- Dunxin H, Maochang C. 1991. The Western Boundary Current of the pacific and its role in the climate. Chin J Oceanol. 9(1):1–14. doi: 10.1007/BF02849784
- Dutrieux P. 2009. Tropical Western Pacific currents and the origin of intraseasonal variability below the thermocline [dissertation]. Manoa: University of Hawaii.
- Hu S, Hu D. 2014. Variability of the Pacific North Equatorial Current from repeated shipboard acoustic Doppler current profiler measurements. J Oceanogr. 70(6):559–571. doi: 10.1007/s10872-014-0253-5
- Hu D, Wu L, Cai W, Gupta AS, Ganachaud A, Qiu B, Gordon AL, Lin X, Chen Z, Hu S, et al. 2015. Pacific western boundary currents and their roles in climate. Nature. 522(7556):299–308. doi: 10.1038/nature14504
- Ishizaki H, Nakano T, Nakano H, Yamanaka G. 2019. Interdecadal variability of the North Equatorial Undercurrent (NEUC) found in the long-term hydrographic observations along 137°E. J Oceanogr.
- Jensen TG. 2011. Bifurcation of the Pacific North Equatorial Current in a wind-driven model: response to climatological winds. Ocean Dyn. 61(9):1329–1344. doi: 10.1007/s10236-011-0427-2
- Ju Q-c, Jiang S, Tian J-w, Kong L-h, Ni G-x. 2013. Seasonal variability of the bifurcation of the North Equatorial Current. J Hydrodyn. 25(4):550–555. doi: 10.1016/S1001-6058(11)60395-9
- Kashino Y, España N, Syamsudin F, Richards KJ, Jensen T, Dutrieux P, Ishida A. 2009. Observations of the North Equatorial Current, Mindanao Current, and Kuroshio Current system during the 2006/07 El Niño and 2007/08 La Niña. J Oceanogr. 65(3):325–333. doi: 10.1007/s10872-009-0030-z
- Kawae S, Kamiya H, Takatsuki Y, Kaneko I. 1998. Water property and current distributions along the WHP-P9 section (137°–142°) in the western North Pacific. J Geophys Res Oceans. 103(C6):12959–12984. doi: 10.1029/97JC03761
- Li Y, Liu H, Lin P. 2018. Interannual and decadal variability of the North Equatorial Undercurrents in an eddy-resolving ocean model. Sci Rep. 8(1):17112. doi: 10.1038/s41598-018-35469-2
- Meng Q, Wang F, Liu N. 2011. Low-frequency variability of the North Equatorial Current bifurcation in the past 40 years from SODA. Acta Oceanol Sin. 30(3):14–19. doi: 10.1007/s13131-011-0114-7
- Ni Q. 2014. Statistical Characteristics and Composite Three-dimensional Structures of Mesoscale Eddies near the Luzon Strait [master's thesis]. Xiamen University.
- Omrani N-E, Ogawa F, Nakamura H, Keenlyside N, Lubis SW, Matthes K. 2019. Key Role of the Ocean Western Boundary currents in shaping the Northern Hemisphere climate. Sci Rep. 9(1):3014. doi: 10.1038/s41598-019-39392-y
- Park J-H, Kug J-S, An S-I, Li T. 2019. Role of the western hemisphere warm pool in climate variability over the western North Pacific. Clim Dyn. 53:2743–2755. doi: 10.1007/s00382-019-04652-0
- Qiu B. 1999. Seasonal eddy field modulation of the North Pacific Subtropical Countercurrent: TOPEX/Poseidon observations and theory. J Phys Oceanogr. 29:2471–2486. doi: 10.1175/1520-0485(1999)029<2471:SEFMOT>2.0.CO;2
- Qiu B, Chen S, Sasaki H. 2013. Generation of the North Equatorial Undercurrent Jets by triad baroclinic Rossby wave interactions. J Phys Oceanogr. 43(12):2682–2698. doi: 10.1175/JPO-D-13-099.1
- Qiu B, Lukas R. 1996. Seasonal and interannual variability of the North Equatorial Current, the Mindanao Current, and the Kuroshio along the Pacific western boundary. J Geophys Res Oceans. 101(C5):12315–12330. doi: 10.1029/95JC03204
- Qiu B, Rudnick DL, Chen S, Kashino Y. 2013. Quasi-stationary North Equatorial Undercurrent jets across the tropical North Pacific Ocean. Geophys Res Lett. 40(10):2183–2187. doi: 10.1002/grl.50394
- Schönau MC, Rudnick DL. 2015. Glider observations of the North Equatorial Current in the western tropical Pacific. J Geophys Res-Oceans. 120(5):3586–3605. doi: 10.1002/2014JC010595
- Toole JM, Zou E, Millard RC. 1988. On the circulation of the upper waters in the western equatorial Pacific Ocean. Deep Sea Res. Part I: Oceanogr Res Papers. 35:1451–1482. doi: 10.1016/0198-0149(88)90097-0
- Wang Q, Cao R, Zhang S, Hu D. 2009. Bifurcation of Pacific North Equatorial Current at the surface. Sci China Series D-Earth Sci. 52(2):227–231. doi: 10.1007/s11430-009-0020-4
- Wang Q-y, Hu D-x. 2006. Bifurcation of the north equatorial current derived from altimetry in the Pacific Ocean. J Hydrodyn. 18(5):620–626. doi: 10.1016/S1001-6058(06)60144-3
- Wang F, Wang Q, Zhang L, Hu D, Hu S, Feng J. 2019. Spatial distribution of the seasonal variability of the North Equatorial Current. Deep-Sea Res Part I-Oceanogr Res Papers. 144:63–74. doi: 10.1016/j.dsr.2019.01.001
- Wu G, Zhai F, Hu D. 2016. Interannual variations of North Equatorial Current transport in the Pacific Ocean during two types of El Nino. Chin J Oceanol. 34(3):585–596. doi: 10.1007/s00343-015-4352-y
- Yan Q, Hu D, Zhai F. 2014. Seasonal variability of the North Equatorial Current transport in the western Pacific Ocean. Chin J Oceanol. 32(1):223–237. doi: 10.1007/s00343-014-3052-3
- Zhai F, Hu D. 2012. Interannual variability of transport and bifurcation of the North Equatorial Current in the tropical North Pacific Ocean. Chin J Oceanol. 30(1):177–185. doi: 10.1007/s00343-012-1194-8
- Zhai F, Hu D. 2013. Revisit the interannual variability of the North Equatorial Current transport with ECMWF ORA-S3. J Geophys Res-Oceans. 118(3):1349–1366. doi: 10.1002/jgrc.20093
- Zhai F, Hu D, Li P. 2018. Decadal variations of the transport and bifurcation of the Pacific North Equatorial Current. J Oceanogr. 74(1):65–80. doi: 10.1007/s10872-017-0441-1
- Zhai F, Hu D, Qu T. 2013. Decadal variations of the North Equatorial Current in the Pacific at 137 degrees E. J Geophys Res-Oceans. 118(10):4989–5006. doi: 10.1002/jgrc.20391
- Zhai F, Wang Q, Wang F, Hu D. 2014a. Decadal variations of Pacific North Equatorial Current bifurcation from multiple ocean products. J Geophys Res-Oceans. 119(2):1237–1256. doi: 10.1002/2013JC009692
- Zhai F, Wang Q, Wang F, Hu D. 2014b. Variation of the North Equatorial Current, Mindanao Current, and Kuroshio Current in a high-resolution data assimilation during 2008-2012. Adv Atmos Sci. 31(6):1445–1459. doi: 10.1007/s00376-014-3241-1
- Zhang L, Wang FJ, Wang Q, Hu S, Wang F, Hu D. 2017. Structure and Variability of the North Equatorial Current/Undercurrent from Mooring Measurements at 130°E in the Western Pacific. Sci Rep. 7(1):46310. doi: 10.1038/srep46310
- Zhao Y, Wei Z, Wang Y, Xu T, Feng Y. 2015. Correlation analysis of the North Equatorial Current bifurcation and the Indonesian Throughflow. Acta Oceanol Sin. 34(9):1–11. doi: 10.1007/s13131-015-0736-2