
Abstract
This paper explores vulnerability and adaptive capacity of rural communities in Southern Laos, where households are highly dependent on climate-sensitive natural resources and vulnerable to seasonal weather fluctuations. The speed and magnitude of climate-induced changes may seriously challenge their ability to adapt. Participatory group discussions and 271 household surveys in three villages highlight the current level of vulnerability and adaptive capacity towards climatic variability and risks. This paper visualizes three dimensions of the vulnerability framework at two levels using the Community Climate Vulnerability Index and household climate vulnerability cube. Results show that not only poor households are most at risk from climate change challenges, but also those better-off households highly dependent on specialized agricultural production are locally exposed to climate change risks. The majority of vulnerable households are characterized by low adaptive capacity. Floods and drought regularly put the poor under stress, which has led to various coping mechanisms; but capability of applying long-term adaptive strategies remains low among all households. The outcome of the participatory consultation underlines local community preference for an integrated approach to mainstream climate change adaptation into community natural resource management and livelihood improvement that may lead to better adaptive capacity building.
1. Introduction
Rural households are often described as highly dependent on natural resources and having low adaptive capacity in terms of anticipating, coping, resisting, or recovering from shocks and negative impacts that epitomize their vulnerability to shocks including those induced by climate change (Ellis, Citation2000; Heltberg, Siegel, & Jorgensen, Citation2009; Oluoko-Odingo, Citation2011). While rural livelihood strategies are seen to be dynamic and able to respond to changing pressures and opportunities (Barrett, Bezuneh, Clay, & Reardon, Citation2005; Dorward, Anderson, Clark, Keane, & Moguel, Citation2001; Intergovernmental Panel on Climate Change [IPCC], Citation2001), the speed and magnitude of climate-induced changes are expected to seriously challenge the adaptive capacity of most traditionally practised livelihood strategies (Brown, Stephens, Ouma, Murithi, & Barrett, Citation2006; Smit & Wandel, Citation2006). Projected climate change may have severe impact on food security affecting large segments of rural populations; this may be further aggravated through impacts on access to employment, water, health, and other services (Dasgupta & Baschieri, Citation2010; IPCC, Citation2001; Oluoko-Odingo, Citation2011).
The long history of vulnerability assessment is well acknowledged in political ecology and natural disasters and risk management with conceptual models of vulnerability and its assessment emerging in climate-change-related literature (Adger, Citation2006; Downing, Citation2001; Füssel & Klein, Citation2006; Kelly & Adger, Citation2000; Yohe, Strzepek, Pau, & Yohe, Citation2003). However, the area little explored so far is the practice-relevant research on human dimensions of climate change (Heltberg et al., Citation2009; IPCC, Citation2007; Moser, Citation2010; Stern, Citation2006). There is an increasing demand for policy relevant and decision support information at micro levels derived from evidence-based assessment of vulnerability to climate change (Hahn, Riederer, & Foster, Citation2009). Academically, knowledge related to vulnerability of community and rural households and their adaptive capacity to climate change is still limited (Christiaensen & Subbarao, Citation2001; Sullivan & Meigh, Citation2005), and endeavours aimed at assessing vulnerability or adaptive capacity of socio-ecological systems through various indicators and indices are often criticized (Below et al., Citation2012; Eriksen & Kelly, Citation2006; Hinkel, Citation2011). First, numerous definitions of vulnerability and related concepts abound, highlighting differing views and disciplines, thus making integration and synthesis difficult (see Adger, Citation2006; Füssel, Citation2007; Moser, Citation2010). Second, macro-level indicators are frequently selected to assess national or sub-national vulnerability, and it is much more difficult to identify and collect locally appropriate indicators especially at community and household levels (Hinkel, Citation2011; O'Brien et al., Citation2004; Sullivan & Meigh, Citation2005). Third, downscaling climate models at high resolutions remains a huge challenge, and available meteorological data and climate risks exposure may not reflect variation at the micro level within the same geographical location (Hahn et al., Citation2009; Patz, Campbell-Lendrum, Holloway, & Foley, Citation2005). However, the degree of exposure to climate risks by local communities and households can vary dramatically due to differences in biophysical location and conditions of their agricultural land. This paper takes a localized analytic approach to explore vulnerability and adaptive capacity at community and household levels.
The most predominant conceptual framework of vulnerability in global and climate change research is based on the Intergovernmental Panel on Climate Change (IPCC) definition: “vulnerability, the degree to which a system is susceptible to, and unable to cope with, adverse effects of climate change, including climate variability and extremes”, considering vulnerability as a function of three dimensions: exposure, sensitivity, and adaptive capacity. Vulnerability is not only associated with the risks and impacts from anticipated crises but, more importantly, it depends on whether the households are capable of coping and adapting to the risk situation through other means (Füssel & Klein, Citation2006; O'Brien et al., Citation2004). Exposure refers to the external climate stresses a system is or will be exposed to; sensitivity is the degree to which a system is affected by climate stimuli; and adaptive capacity is related to the ability of a system to adjust to the actual or anticipated climate stresses, and/or cope with the adverse consequence (Below et al., Citation2012; IPCC, Citation2001).
This paper operationalizes and visualizes three dimensions of the IPCC definition to examine a two-tier local-level climate vulnerability using the Community Climate Vulnerability Index (CCVI) adapted from the Livelihood Vulnerability Index (LVI) developed by Hahn et al. (Citation2009), and the household climate vulnerability cube (HCVC) conceptualized from previous vulnerability studies (Fraser, Citation2007; Lin & Morefield, Citation2011; Snidvongs, Citation2006), providing a new angle to assess vulnerability at the household level. It further explores micro-level adaptive behaviours as local people are constantly attempting to reduce exposure of their household to high vulnerability by moving towards a lower vulnerability level. This can be evidenced from individual households searching for substitute, non-farm income sources, building housing on higher ground or on stilts, if possible, and contributing labour to community protection measures. Adaptation is here differentiated from coping mechanisms, which are defined as short-term responses to crises or shocks as ex post measures. In contrast, adaptation strategies are relatively long-term and ex ante prevention and/or mitigation measures to risks, cycles, and trends (Ellis, Citation2000; Heltberg et al., Citation2009).
In the Greater Mekong Subregion (GMS), which is one of the high economic growth areas in the world, significant economic and social changes are transforming economies and natural landscapes. Some 70 million indigenous and ethnic peoples live in remote areas of the GMS, who may be vulnerable to climate change impacts. Climate change scenario simulations under future climate condition at a CO2 concentration of 540 ppm and 720 ppm show a variation in temperature and the likelihood of a precipitation increase by 10–30%, especially in the eastern and southern part of Laos (Snidvongs, Citation2006). High dependence on agriculture and lack of irrigation facilities make local communities vulnerable to drought, flood, and precipitation irregularities. Empirical studies covering household-level vulnerability to climate change risks in Southern Laos are rare. This research can contribute towards a better understanding of local level vulnerability and adaptive behaviour and perceptions, moving towards adaptation strategies emanating from an appropriate and systematic method of micro-level vulnerability assessment in the developing country context of Southern Laos.
2. Climate Vulnerability Index and cube
2.1. Community Climate Vulnerability Index
From a more impact-oriented, risk-hazard framework emphasizing the biophysical relationship between exposure and sensitivity (Füssel & Klein, Citation2006), vulnerability assessment has evolved into an integrated framework comprising three dimensions: exposure, sensitivity, and adaptive capacity. Internal adaptive capacity of a system may significantly influence its sensitivity towards external climate stress, while the magnitude of exposure and degree of sensitivity could also potentially shape the adaptive capacity of a system. Researchers have tried to operationalize the key concepts and address the need to quantify vulnerability by applying various methods to calculate and display vulnerability at different scales (Hahn et al., Citation2009; O'Brien et al., Citation2004; Shah, Dulal, Johnson, & Baptiste, Citation2013; Sullivan & Meigh, Citation2005). Using indicators combined into a composite index is the most common approach well suited to integration of multidimensional aspects of vulnerability.
This study constructs a CCVI to explore and understand climate vulnerability at village level in Southern Laos, using a similar approach to the LVI developed by Hahn et al. (Citation2009) as applied by Urothody and Larsen (Citation2010) and Shah et al. (Citation2013). The CCVI is built upon a localized analytical framework in a climate change context based on results from participatory focus group discussions, consisting of 6 main components and 21 sub-components prioritized from local experience of extreme climate events impacting on rural livelihoods (). In the study area, household livelihoods are highly dependent on agricultural production and prone to flood and drought risks. The CCVI uses two major components to assess exposure dimension: past experience with climate-related events and the biophysical conditions of agricultural land underlining the likelihood of household exposure to climate stresses. Those stresses can cause direct loss of agricultural productivity and indirect impacts on other aspects of household livelihoods; thus sensitivity relates to agricultural sensitivity (e.g. direct loss of crop yield due to flood or drought) and livelihood sensitivity related to food, water, and accessibility to services. Adaptive capacity includes existing, short-term coping and long-term adaptive strategies, and assets available for combating climate stresses or its consequences. Each major component further comprises several sub-components. Sub-component and indicator selection takes into account a variety of factors regarding relevance, confidence, and suitability of the local context. One example of the sensitivity dimension, the ratio of paddy rice yield loss in a flooding year compared with rice yield in a normal year, is selected as a sub-component indicator for “main crop yield loss in flooding year”. The high ratio reflects the higher sensitivity of agricultural production to flooding (Tubiello & Rosenzweig, Citation2008). The percentage of total income derived from agricultural production is used as an indicator for “reliance on agricultural income” as part of livelihood sensitivity. A high share indicates increased sensitivity of local livelihood reliance on agriculture, which might be affected by climate change risks (Dasgupta & Baschieri, Citation2010).
Table 1. Major components and sub-components of CCVI developed for three villages of Laos.
2.2. Household climate vulnerability cube
The vulnerability cube is an assessment approach for visualizing and analysing the multidimensional nature of vulnerability. The three-dimensional cube framework has been employed as an effective communication and decision-making tool in vulnerability studies (e.g. Fraser, Citation2007; Lin & Morefield, Citation2011; Snidvongs, Citation2006) as well as in various fields of research, such as watershed governance, education communication, knowledge management, and innovation studies (e.g. Luggar & Kraus, Citation2001; Parkes et al., Citation2010). This paper applies principal component analysis (PCA) of locally appropriate indicators to build a three-dimensional vulnerability cube based on the IPCC definition of vulnerability (IPCC, Citation2001).
In this study, the three-dimensional vulnerability cube is used in organizing and analysing exposure, sensitivity, and adaptive capacity to better understand household vulnerability and its distribution (). Changes in each dimension will lead to alteration in vulnerability; the higher the exposure and sensitivity, the lower is adaptive capacity leading to increased vulnerability. The cube was further divided into sub-cubes (e.g. A–H) to represent different groups of household vulnerability characteristics. The most vulnerable group can be identified as sub-cube A consisting of households with high exposure and sensitivity to climate risks and low adaptive capacity, while sub-cube H represents the least vulnerable households with high adaptive capacity but lower exposure and sensitivity levels. This tool allows comparison of households with the overall goal of moving households towards a lower vulnerability position as indicated by the arrow in .
Figure 1. Three-dimensional Climate Change Vulnerability Cube is a system of visualizing and plotting households within the cube in order to understand their level of vulnerability judged by their position. The cube is split into eight sub-cubes (i.e. A–G) to cluster households with similar characteristics. The goal is to move households towards a lower vulnerability position – see direction of arrow. Source: Adapted from Lin and Morefield (Citation2011).
3. Materials and methods
3.1. Study site
The study was conducted in a “biodiversity corridor site” in Pathoumphone District of Champasak province, southern Laos covering an area of 11,000 ha. The area enjoys a tropical climate with a cold dry season from November through February, a hot dry period from March to April, and a wet season lasting between May and October with heavy and frequent rains from August to September. The average annual precipitation is at 1908 mm in Champasak province (Moinuddin et al., Citation2011).
The study area is home to three ethnic groups: Lao Loum (majority), Youane, and Brao, a population of 5888 with a total number of 1040 households (Moinuddin et al., Citation2011). Some of these villages exist since centuries, while others have emerged more recently as people moved into new areas due to outbreak of diseases and in search of better agricultural land. In several villages much of the area is flooded during the rainy season and droughts occur in some years. In order to provide a representational selection, villages for in-depth, participatory surveys and analysis were selected according to the following criteria: (i) size and types of agricultural production, (ii) socio-economic conditions, and (iii) climate risk characteristics. Field surveys, participatory group consultations, key informant interviews, and household questionnaire surveys were conducted in 3 selected villages out of 11 on recommendation by local stakeholders, namely Ban Houayko, Ban Kiet Ngong, and Ban Nakok (see ). These three villages largely represent the diversity of the corridor area regarding the selection criteria. Ban Houayko is a relatively small, conservative, ethnic minority village; average paddy land holdings per household are low with frequent flooding risks; most households in Ban Houayko continue practising upland rice cultivation, facing risks of drought and dry spells. Ban Kiet Ngong enjoys a wetland landscape with large area of paddy land; villagers also take advantage of the wetland resources to practise dry season paddy on a small scale; however, proximity to wetland implies higher risks of flooding. Ban Nakok has a medium sized paddy land area, partially with irrigation services; dry season paddy rice might face water shortage due to low inflows in the irrigation channel.
Figure 2. Study sites, Lao PDR.
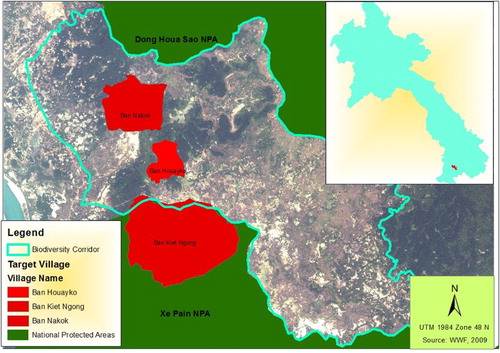
Village livelihoods are a combination of subsistence and income-oriented activities with transition to a market-reliant economy well on its way. Agricultural production has been and remains the most important component of village livelihood. Villagers place a very high importance on rice production, and consider availability of rice throughout the year to be the critical indicator of wealth status among households. The area is characterized by flat land, which floods as soon as the wet season arrives; lack of irrigation infrastructure restricts rice production in the dry season. Major climate risks in the study area are floods and droughts, which have direct impacts on rice and other crop productivity. In general, paddy land in flat area and close to the wetland is highly prone to floods, while upland fields and paddy land located at higher elevation face increased risk of droughts.
3.2. Data collection
In this study, both quantitative and qualitative methods have been used. Structured household surveys and participatory focus group discussions were the primary data collection methods. Field surveys were conducted during May–July 2011. A first round of participatory consultation workshops were conducted initially to generate stakeholder interest and collaboration, gather contextual information at the village level, and adjust the survey design. Secondary statistical data and reports from local government offices helped identify socio-economic and institutional factors and constraints further influencing design and structure of the household questionnaire.
In total, 271 households were randomly selected to participate in the questionnaire survey covering 80% of the households in each of the three selected villages, of which 269 valid questionnaires were used for data analysis. The high rate of response could only be achieved by highly engaged village organizations and active participation of local households. The structured questionnaire focused on socio-economic profiles, livelihood strategies and income sources, observation of climate variability and extreme events, past experience of livelihood risks/shocks (especially, climate risks and impacts on livelihood strategies), existing ex post coping and ex ante adaptation behaviour, and social, financial, and physical assets. The household survey data were used to build the CCVI and HCVC. Recall questions regarding shocks during the past five years and hypothetical questions were formulated to assess existing coping and adaptation behaviours. Experienced enumerators participated in pretesting of the questionnaire and the survey process.
Participatory resource and hazard mapping involved village heads, village appointed land use officers, and knowledgeable village elders, incorporating historical data on temperature, precipitation, floods and droughts, and data on land use and slope of the village area to identify high-risk hotspots and dominant hazards. Focus groups representing different genders and age groups and a diversity of livelihood strategies discussed the vulnerability matrix, seasonal calendar, and historical timelines in each village using interactive flip-chart tables and drawings facilitated by local research assistants.
3.3. Data analysis
Three main sets of analyses were undertaken in this study: (1) calculation of a balanced weighted average village-level climate vulnerability index (referred to as CCVI) and comparison among the three villages; (2) construction of a three-dimensional climate vulnerability cube at the household level (HCVC), to explore the relationship between vulnerability and income levels; and (3) qualitative analysis of ex post and ex ante adaptive behaviour across income groups to link coping and adaptive behaviour and perceptions.
3.3.1. Calculating CCVI
Following the approach of Hahn et al. (Citation2009), the CCVI was constructed with a balanced, weighted average approach where each sub-component contributes equally to the overall index (Shah et al., Citation2013; Urothody & Larsen, Citation2010). Since each indicator may be measured in different units and scales, normalization of all the indicators to the same scale becomes necessarily the first step in order to combine all the variables into a single index. The conversion equation (Equations (1(a)) and (1(b)) is adapted from UNDP's Human Development Index, which allows standardizing values free from the units and they all range between 0 and 1 (Hahn et al., Citation2009).(1a)
or
(1b)
where
is the original sub-component or indicator for village
, and
and
are the minimal and maximum values, respectively, determined by data of each indicator from the total sample calculated in all three villages. Equation (1(a)) is applied when the indicator has a positive functional relationship with the three-dimensional factors of vulnerability, while Equation (1(b)) is used for a negative relationship.
Then, the average of all standardized scores of each main component is calculated as a final score for the major component, using Equation (2):(2)
where
is one of the six major components for village
,
refers to the normalized score of each sub-component indicator indexed by
, and
is the number of sub-components in each major component.
Next, each of the three IPCC dimensional factors is calculated as weighted average comprising major components, using Equation (3):(3)
where
is an IPCC dimensional factor (exposure, sensitivity, or adaptive capacity) for village
,
are the major components of each IPCC dimensional factor in village
indexed by
,
is the weight of each major component determined by the number of sub-component indicators, and m is the number of major components in each IPCC dimensional factor. Lastly, the final village level vulnerability index is calculated by the following equation (Hahn et al., Citation2009):
(4)
where
is the Community Climate Vulnerability Index for village
expressed using the IPCC vulnerability framework,
,
, and
are the calculated exposure, sensitivity, and adaptive capacity scores for village
. The
is scaled from −1 (least vulnerable) to 1 (most vulnerable).
3.3.2. Constructing HCVC
We applied PCA to create three IPCC dimensional axis scores for exposure, sensitivity, and adaptive capacity using the same set of sub-component indicators mentioned above for calculating the CCVI. PCA is a multivariate statistical dimension–reduction technique (Chatfield & Collins, Citation1980; Dasgupta & Baschieri, Citation2010), which is used to examine a set of correlated variables. In this case, it creates a single score that explains most of the characteristics in the original set of variables for each IPCC dimension factor, thus presenting the IPCC's vulnerability framework in a 3-D format.
The three-dimensional scores are standardized employing the same method (Equation (1(a))) to rescale the values from 0 to 1. The midpoint 0.5 is set as a reference benchmark for dividing each dimensional axis to construct the sub-cubes (sub-cube A–H) using the PCA scores for exposure, sensitivity, and adaptive capacity. For example, households with both exposure and sensitivity scoring higher than 0.5 and adaptive capacity scoring lower than 0.5 are positioned in sub-cube A, which represents the most vulnerable group. Similarly, other households are allocated to the rest of sub-cubes, respectively, using the same principle, which can be visualized with the illustration of the cube.
4. Results
4.1. CCVI and comparison
presents the indexed and standardized scores for major components, sub-components, and the composite CCVI for each village. The results show that Kiet Ngong (0.377) and Houay Ko (0.375) are more exposed to climate change impacts than Nakok (0.308). However, in terms of agricultural and livelihood sensitivity, Houay Ko (0.282) is less sensitive to climate change impacts than Kiet Ngong (0.579) and Nakok (0.441). The adaptive capacity index scores imply a relatively low capacity of all three villages, with Houay Ko (0.156) being the lowest. The overall CCVI scores indicate that Kiet Ngong (0.104) is most vulnerable to climate change impacts among the three villages compared to Houay Ko (0.062) and Nakok (0.054).
Table 2. Indexed and standardized sub-components, major components, and overall CCVI for three villages, Laos.
On the exposure dimension, Houay Ko shows a much higher percentage of households (0.781) experiencing crop failure due to climate change impacts, while a relatively lower percentage experience loss in paddy rice yield due to flood or drought compared to the other two villages. Notably, households cultivate more diversified crops (i.e. upland rice, cassava, and coffee) in Houay Ko, and paddy rice productivity in Houay Ko is relatively lower (1.5–2 tonne/ha) than in other villages (2.5–3 tonne/ha) due to low soil fertility, being prone to flooding, and lack of skills of Brao people in paddy rice cultivation. Instead, villagers keep livestock and sell wage labour to other villages. Overall, however, households in Kiet Ngong (0.522) and Nakok (0.528) experienced more climate change impacts than Houay Ko (0.500). In terms of vulnerability in biophysical condition of agricultural land, Nakok (0.144) has a lower index score than Houay Ko (0.281) and Kiet Ngong (0.268), featuring better soil fertility, moderate water availability, and being less prone to flood and drought.
Kiet Ngong shows higher scores on both agricultural sensitivity (Kiet Ngong 0.556, Houay Ko 0.326, and Nakok 0.370) and livelihood sensitivity (Kiet Ngong 0.596, Houay Ko 0.250, and Nakok 0.494). The agricultural sensitivity indicator shows that a high proportion of households in Kiet Ngong are dependent on rainwater for agriculture, and the average ratio of paddy rice yield loss is higher than the other two villages. Moreover, high reliance on agricultural production for subsistence and income, and poor accessibility to services during rainy season leads to the highest livelihood sensitivity for Kiet Ngong.
In terms of adaptive capacity, Kiet Ngong has the highest score on coping and adaptive strategies (Kiet Ngong 0.180, Houay Ko 0.154, and Nakok 0.162), with higher average numbers for both ex post short-term coping and ex ante long-term adaptation strategies. There is an extremely low score for Houay Ko on long-term adaptive strategies, which may imply Brao ethnic people being conservative to change traditional practices. In addition, households in Houay Ko own less assets for combating climate risks (Houay Ko 0.154, Nakok 0.229, and Kiet Ngong 0.227), except for livestock holdings. (Descriptive statistics of sub-component variables are presented in Appendix.)
4.2. HCVC and household distribution
presents descriptive statistics of three-dimensional standardized scores for exposure, sensitivity, and adaptive capacity for each sub-cube of the HCVC derived from the first principal component. The PCA factor loadings were examined, and the direction and strength of all variables towards the three-dimensional scores work well in the expected direction. The most vulnerable group (sub-cube A) is featured with high exposure (M = 0.79, SD = 0.14) and sensitivity (M = 0.74, SD = 0.14) scores, and low adaptive capacity (M = 0.34, SD = 0.08).
Table 3. Descriptive statistics of exposure, sensitivity, and adaptive capacity across sub-cubes.
shows number of households and proportion in each income quartile group located in different vulnerability sub-cubes. The most and least vulnerable groups account for 27.5% and 8.2% of the households, respectively, and the remaining 64.3% of households are positioned in a less vulnerable group. Most notably, the majority of households are located in the lower sub-cubes A-D that are featured with low adaptive capacity. The most vulnerable households (in sub-cube A) are spread over different income quartiles, which is further confirmed by a chi-square test (χ2 (3, N = 74) = 3.62, p = .31) showing there is no significant statistical difference across income quartile groups, implying that vulnerable households may not necessarily be the poor households only; better-off households may also face high level of vulnerability.
Table 4. Distribution of households in vulnerability sub-cubes by income quartile groups.
4.3. Coping and adaptive behaviours and perception
presents the percentage of households that have taken measures to cope with difficult situations with productivity and/or income loss across income quartiles due to floods or drought. The majority of households tried to find alternative livelihood measures by doing “extra labour work” and “catching more fish” being the most popular options for all income groups. The poorest households tend to harvest products prematurely. Clear trends can be observed in “spending savings” and “selling livestock” that higher income households are able to accumulate as savings to cope with shortage of food and income compared to poorer ones. Selling assets remains a rare option for households in these communities. In general, households prefer to reduce non-food spending rather than reducing food consumption. However, a relatively low percentage of “assistance from relatives or friends” and “assistance from community/non-governmental organizations (NGOs)” may indicate weak institutional support in these communities.
Table 5. Household coping strategies in response to loss in productivity and/or income.
Current trends and climate variability were observed and future trends perceived by local communities, which have led to certain long-term adaptive measures being practised: (a) change in rice variety to grow mid-term (four months maturity) and long-term (five months maturity) varieties replacing the short-term variety (three months maturity); (b) experimenting with flood-tolerant rice variety called “Kao Niao Loy” (swimming sticky rice), but this was not deemed successful; (c) change in livelihood strategy from paddy rice cultivation to other activities such as livestock raising, selling wage labour in neighbouring villages, long-term migration, cassava (cash crop) plantation, etc.; (d) in Ban Kiet Ngong, a channel was constructed using collective efforts to divert water to a nearby stream, which effectively prevented certain flood risks and enabled paddy land expansion; however, potential negative impacts on the wetland ecosystem need to be studied and factored in; and (e) in Ban Nakok, construction and upgrading of the irrigation scheme enabled farmers to grow irrigated dry season rice, thus improving resilience to flood and drought risks in that village. Survey results show over 85% of households are less responsive to long-term adaptive measures (except for crop variety choices) for hazard prevention and livelihoods improvement than immediate ex post coping measures. Moreover, there was not much of a difference in their response when households were asked whether such measures can be a possible future option even if these have not been undertaken in these communities.
Potential adaptation options identified through a participatory consultation process included: (1) small-scale irrigation scheme; (2) resistant varieties; (3) water harvesting; (4) commercial plantation; (5) short-term cash crops; (6) reforestation; (7) wetland ecosystem protection; (8) Village Development (revolving, self-help, microcredit) Fund; (9) Early Warning Systems; (10) upgrading/expansion of existing irrigation scheme. The villagers also felt that more information should be gathered about additional flood control systems and on natural ecosystem services, which might help them adapt. While immediate measures in response to climate risks were proposed, local communities also requested integrated livelihood improvement options, which could potentially reduce their vulnerability and provide alternatives to maintain livelihoods under anticipated future risks and changes.
5. Discussion and conclusion
The major and sub-components of CCVI presented in show how household characteristics shape climate change vulnerability in each village. The factors that make households vulnerable to climate shocks should be addressed in the wider socio-economic and developmental context of each village in order to reduce climate change vulnerability (Füssel & Klein, Citation2006). These analyses provide practical implications for formulating a well-targeted community development strategy (Hahn et al., Citation2009). For example, many households in Kiet Ngong may be better off (i.e. housing, land holdings, and total income) with higher adaptive capacity than Houay Ko. However, they are also highly specialized and dependent on crop production for own food consumption and income with agricultural land prone to flood and drought, making Kiet Ngong more vulnerable to climate change. Thus, for communities relying more on agricultural land with higher risks of climatic impacts, improvement in crop resilience, water and flood management should be taken into account and enhanced to prevent damages from anticipated climate shocks. On the other hand, lower scores on exposure and sensitivity of Houay Ko does not mean households there have less vulnerable agricultural land; they had to shift to other livelihood strategies due to unfavourable biophysical conditions. Households in Houay Ko have extremely low asset holdings and are weak in long-term adaptive strategies. It is advisable to support such communities in developing suitable livelihood activities (e.g. livestock raising, forest product collection and processing, mushroom production, etc.) leading to diversified livelihood strategies and encouraging asset accumulation with long-term adaptive preparedness (Reardon, Delgado, & Matlon, Citation1992; Van den Berg, Citation2009).
Results from the household vulnerability cube show that the association between poverty and vulnerability is not as significantly correlated as assumed (IPCC, Citation2001), implying that not only poor households are most at risk when facing climate change challenges, but also those highly dependent and specialized in agricultural production and locally exposed to climate change risks (i.e. flood and drought). It is not sufficient to take poverty as the only factor in identifying vulnerability to climate change; climatic shocks pose additional risks to their well-being (Dasgupta & Baschieri, Citation2010). In this study, 77% of households are located in the lower part of the vulnerability cube, as well as the low scores of adaptive capacity component in CCVI, all implying low adaptive capacity, which is a key factor contributing to increased vulnerability of those households to climate change risks. It is essential to enhance the adaptive capacity of households facing climate risks. This will require improving household access to resources, assets, and diversifying their economic activities; it is a widely acknowledged lesson that local level climate change adaptation is more effective if incorporated with other strategies such as livelihood enhancement, water and other resource management, land use planning and entitlement, etc. (Kelly & Adger, Citation2000; Smit & Wandel, Citation2006).
Moreover, households are less active in taking long-term adaptive measures as ex ante prevention to future climate change risks; instead, they get used to a set of short-term ex post measures in response to given crises or shocks, which are often unproductive and asset-degrading (Heltberg et al., Citation2009). Most of the time, they do not regard measures taken as “coping mechanisms”. In general, households tend to support their immediate livelihood needs by undertaking additional cash-based labour and collecting products from surrounding ecosystems. Natural resources and ecosystem services (i.e. fish and forest products) play an important role during hardships and crises. Better-off households are able to accumulate savings in the form of cash, livestock, etc. and use these in response to a crisis. However, reducing food consumption and selling assets are not preferable measures for households in the study area. Assistance and support from social network or community are also weak in some places. Hence, lack of long-term adaptive strategies is common among all households, indicating the necessity to improve information sharing and awareness-raising for disaster preparedness among local communities.
The outcome of the participatory adaptation consultation shows that it is not only important to improve climate resilient agricultural practice (i.e. small-scale irrigation scheme, resistant varieties, and water control and harvesting technology, etc.) to better adapt to evolving climate variability and risks; local communities also have an interest in changing their natural resource management (i.e. reforestation, wetland ecosystem protection, and surveys) practices and develop other alternative livelihood strategies (i.e. commercial plantation, short-term cash crops). Meanwhile, early warning systems and village development (revolving, self-help, and microcredit) funds were also in high demand as safeguards and safety nets in reducing vulnerability to climate change. This highlights the importance of integrating climate adaptation strategies into ongoing programmes (poverty alleviation and biodiversity conservation), as many good examples of practice and experience show from around the world (Boyd et al., Citation2008; Dasgupta & Baschieri, Citation2010; Tompkins & Adger, Citation2003).
Three-dimensional visualization through the vulnerability index and cube provides a possibility to integrate and assess all three aspects, exposure, sensitivity, and adaptive capacity, at the same time. Our approach builds upon previous studies (Fraser, Citation2007; Hahn et al., Citation2009; Lin & Morefield, Citation2011; Shah et al., Citation2013; Snidvongs, Citation2006) and pays more attention on the functional relationship between selected indicators and three-dimensional factors of vulnerability. It also differs in the conceptual analytical framework, which is more directly linked to the local livelihood and climate change context. Site-specific, appropriate index components and indicators originated from a thorough qualitative site-specific assessment. This localized analytical pathway can be crucial for development of practice-relevant adaptation strategies and planning at the micro level. The study fulfils the essential qualities required for a vulnerability assessment tool (Shah et al., Citation2013), the set of major and sub-components and indicators are adjustable and applicable to other field settings, allowing incorporation of local and contextual factors affecting vulnerability to climate change, and it is useful to inform policy for adaptation planning within communities. However, many methodological limitations and caveats of the model and selection of indicators remain (Hahn et al., Citation2009; Hinkel, Citation2011; Lin & Morefield, Citation2011; Shah et al., Citation2013). While, the method may appear oversimplified due to the use of a balance weighted average approach which may not reflect the full complexity of vulnerability, it is accessible to wider future users with the possibility of adjusting the weighting scheme and selection of components/indicators to fit different local contexts (Lin & Morefield, Citation2011; Shah et al., Citation2013). Another limitation is that the analysis was not able to explore the dynamics of long-term vulnerability but was only based on an analysis of the current situation. Panel data and more complex simulation models may enable future research. Caution is also required as the detailed characteristics of vulnerability may not be directly transferred to other contexts, and “most vulnerable”, “least vulnerable”, and “less vulnerable” are all relative terms (Lin & Morefield, Citation2011). Lastly, adaptation behaviours were merely examined qualitatively with some basic descriptive statistics, leaving opportunities to fill in the gap in exploring adaptation and its determinant quantitatively in future research (Vincent, Citation2007; Yohe & Tol, Citation2002).
This paper provides a micro-level vulnerability assessment applying vulnerability index and cube in exploring and visualizing local vulnerability and adaptive capacity in Southern Laos. Local communities in the region are generally vulnerable to climate risks featured with majority of households characterized by low adaptive capacity and lack of long-term adaptive strategies. Poverty should not be taken as the only factor to identify climate vulnerability; better-off households highly exposed and sensitive to climate risks are also less prepared. These strongly suggest an urgent need to mainstream climate resilience into current community development strategies and ongoing natural resource management and poverty alleviation programmes in Southern Laos and broadly in the low-income countries. Efforts should be focusing on those “no-regrets” interventions to enhance adaptive capacity and benefit local communities regardless of future trends of climate change, such as providing technical assistance in promoting climate resilient agricultural practices, alternative livelihoods and diversification, and community development funds.
Acknowledgement
The Asian Development Bank's GMS Core Environment Program and Biodiversity Conservation Corridors Initiative supported by the Governments of Sweden, Finland, the Netherlands and the PR China's Poverty Reduction Fund must be thanked for the financial assistance in carrying out this study as part of its Activity on: “Climate Change Impacts, Vulnerability, and Adaptation in Agriculture Areas in BCI Pilot Sites”. The authors also appreciate assistance provided by Madame Keobang A of the Ministry of Natural Resources and Environment (MONRE) in Lao PDR, Mr Sodxay of the Provincial Natural Resources Office in Pakse, Ms Sayfah and Mr Thanongkham of MONRE, Mr Anouxay and Mr Saykham from the National University of Laos. Above all, the villagers and district officials in Pathoumphone must be thanked, who generously gave their time for participatory consultations and household surveys. We would also like to thank Anja Byg, Carsten Smith-Hall, Edmond Dounias, Han van Dijk and two anonymous reviewers for their valuable and insightful comments and suggestions on earlier drafts, and the European Commission for the generous support under the Erasmus Mundus Joint Doctorate (EMJD) Programme Forest and Nature for Society (FONASO).
Disclosure statement
No potential conflict of interest was reported by the authors.
References
- Adger, W.N. (2006). Vulnerability. Global Environmental Change, 16(3), 268–281. doi: 10.1016/j.gloenvcha.2006.02.006
- Barrett, C.B., Bezuneh, M., Clay, D., & Reardon, T. (2005). Heterogeneous constraints, incentives and income diversification strategies in rural Africa. Quarterly Journal of International Agriculture, 44(1), 37–60.
- Below, T.B., Mutabazi, K.D., Kirschke, D., Franke, C., Sieber, S., Siebert, R., & Tscherning, K. (2012). Can farmerś adaptation to climate change be explained by socio-economic household-level variables? Global Environmental Change, 22, 223–235. doi: 10.1016/j.gloenvcha.2011.11.012
- Boyd, E., Osbahr, H., Ericksen, P.J., Tompkins, E., Lemos, M.C., & Miller, F. (2008). Resilience and ‘climatizing’ development: Examples and policy implications. Development, 51, 390–396. doi: 10.1057/dev.2008.32
- Brown, D.R., Stephens, E.C., Ouma, J.O., Murithi, F.M., & Barrett, C.B. (2006). Livelihood strategies in the rural Kenyan highlands. African Journal of Agricultural and Resource Economics, 1(1), 21–36.
- Chatfield, C., & Collins, A.J. (1980). Introduction to multivariate data analysis. London: Chapman and Hall.
- Christiaensen, L.J., & Subbarao, K. (2001). Towards an understanding of vulnerability in rural Kenya. Journal of African Economics, 14(4), 520–558. doi: 10.1093/jae/eji008
- Dasgupta, A., & Baschieri, A. (2010). Vulnerability to climate change in rural Ghana: Mainstreaming climate change in poverty-reduction strategies. Journal of International Development, 22, 803–820. doi: 10.1002/jid.1666
- Dorward, A., Anderson, S., Clark, S.S., Keane, B., & Moguel, J. (2001). Asset functions and livelihood strategies: A framework for pro-poor analysis, policy and practice (ADU Working Papers 10918, Working Paper No. 01/01). Department of Agricultural Sciences, Imperial College at Wye.
- Downing, T.E. (2001). Climate change vulnerability: Linking impacts and adaptation. Report to the Governing Council of the United Nations Environment Programme. Oxford: Environmental Change Institute.
- Ellis, F. (2000). Rural livelihoods and diversity in developing countries. London: Oxford Press.
- Eriksen, S.H., & Kelly, P.M. (2006). Developing credible vulnerability indicators for climate adaptation policy assessment. Mitigation and Adaptation Strategies for Global Change, 12(4), 495–524. doi: 10.1007/s11027-006-3460-6
- Fraser, E.D.G. (2007). Travelling in antique lands: Using past famines to develop an adaptability/resilience framework to identify food system vulnerable to climate change. Climatic Change, 83, 495–514. doi: 10.1007/s10584-007-9240-9
- Füssel, H.M. (2007). Vulnerability: A generally applicable conceptual framework for climate change research. Global Environmental Change, 17, 155–167. doi: 10.1016/j.gloenvcha.2006.05.002
- Füssel, H.M., & Klein, R.J.Y. (2006). Climate change vulnerability assessments: An evolution of conceptual thinking. Climatic Change, 75(3), 301–329. doi: 10.1007/s10584-006-0329-3
- Hahn, M.B., Riederer, A.M., & Foster, S.O. (2009). The livelihood vulnerability index: A pragmatic approach to assessing risks from climate variability and change – a case study in Mozambique. Global Environmental Change, 19(1), 74–88. doi: 10.1016/j.gloenvcha.2008.11.002
- Heltberg, R., Siegel, P.B., & Jorgensen, S.L. (2009). Addressing human vulnerability to climate change: Towards a ‘no-regrets’ approach. Global Environmental Change, 19, 89–99. doi: 10.1016/j.gloenvcha.2008.11.003
- Hinkel, J. (2011). Indicators of vulnerability and adaptive capacity: Towards a clarification of the science–policy interface. Global Environment Change, 21, 198–208. doi: 10.1016/j.gloenvcha.2010.08.002
- Intergovernmental Panel on Climate Change. (2001). Climate Change 2001: Climate Change Impacts, Adaptation and Vulnerability. IPCC Working Group II Report. Retrieved from http://www.grida.no/publications/other/ipcc_tar/
- Intergovernmental Panel on Climate Change. (2007). Climate Change 2007: Climate Change Impacts, Adaptation and Vulnerability. IPCC Working Group II Report. Retrieved from http://www.ipcc.ch/publications_and_data/ar4/wg2/en/contents.html
- Kelly, P.M., & Adger, W.N. (2000). Theory and practice in assessing vulnerability to climate change and facilitating adaptation. Climate Change, 47, 325–352. doi: 10.1023/A:1005627828199
- Lin, B.B., & Morefield, P.E. (2011). The vulnerability cube: A multi-dimensional framework for assessing relative vulnerability. Environmental Management, 48, 631–643. doi: 10.1007/s00267-011-9690-8
- Luggar, K.M., & Kraus, H. (2001). Mastering the human barriers in knowledge management. Journal of Universal Computer Science, 7, 488–497.
- Moinuddin, H., Pokhrel, S., Jiao, X., Linde, L., Fraser, A., & Botengan, M.A. (2011). Biodiversity Conservation Corridors Initiative (BCI) report 2006–2011. Bangkok: Greater Mekong Subregion Core Environment Program, Asian Development Bank.
- Moser, S.C. (2010). Now more than ever: The need for more societally relevant research on vulnerability and adaptation to climate change. Applied Geography, 30(2010), 464–474. doi: 10.1016/j.apgeog.2009.09.003
- O'Brien, K.L., Leichenko, R., Kelkarc, U., Venemad, H., Aandahl, G., Tompkins, H., … West, J. (2004). Mapping vulnerability to multiple stressors: Climate change and globalization in India. Global Environmental Change, 14, 303–313. doi: 10.1016/j.gloenvcha.2004.01.001
- Oluoko-Odingo, A.A. (2011). Vulnerability and adaptation to food insecurity and poverty in Kenya. Annals of the Association of American Geographers, 101(1), 1–20. doi: 10.1080/00045608.2010.532739
- Parkes, M.W., Morrison, K.E., Bunch, M.J., Hallstrom, L.K., Neudoerffer, R.C., Venema, H.D., & Waltner-Toews, D. (2010). Towards integrated governance for water, health, and social-ecological systems: The watershed governance prism. Global Environmental Change, 20, 693–704. doi: 10.1016/j.gloenvcha.2010.06.001
- Patz, J.A., Campbell-Lendrum, D., Holloway, T., & Foley, J.A. (2005). Impact of regional climate change on human health. Nature, 438, 310–317. doi: 10.1038/nature04188
- Reardon, T., Delgado, C., & Matlon, P. (1992). Determinants and effects of income diversification amongst farm households in Burkina Faso. Journal of Development Studies, 28(2), 264–296. doi: 10.1080/00220389208422232
- Shah, K.U., Dulal, H.B., Johnson, C., & Baptiste, A. (2013). Understanding livelihood vulnerability to climate change: Applying the livelihood vulnerability index in Trinidad and Tobago. Geoforum, 47, 125–137. doi: 10.1016/j.geoforum.2013.04.004
- Smit, B., & Wandel, J. (2006). Adaptation, adaptive capacity and vulnerability. Global Environmental Change, 16, 282–292. doi: 10.1016/j.gloenvcha.2006.03.008
- Snidvongs, A. (2006). Vulnerability to climate change related water resource changes and extreme hydrological events in Southeast Asia (Project No. AS 07). Final report submitted to assessments of impacts and adaptations to climate change (AIACC), Washington, DC.
- Stern, N. (2006). Stern review on the economics of climate change. London: HM Treasury.
- Sullivan, C.A., & Meigh, J.R. (2005). Targeting attention on local vulnerabilities using an integrated index approach: The example of the Climate Vulnerability Index. Water Science and Technology, 51(5), 69–78.
- Tompkins, E.L., & Adger, W.N. (2003). Building resilience to climate change through adaptive management of natural resources (Working Paper 27). Tyndall Centre for Climate Change Research.
- Tubiello, F., & Rosenzweig, C. (2008). Developing climate change impact metrics for agriculture. The Integrated Assessment Journal, 8(1), 165–184.
- Urothody, A.A., & Larsen, H.O. (2010). Measuring climate change vulnerability: A comparison of two indexes. Banko Janakari, 20(1), 9–16. doi: 10.3126/banko.v20i1.3503
- Van den Berg, M. (2009). Household income strategies and natural disasters: Dynamic livelihoods in rural Nicaragua. Ecological Economics, 69(3), 592–602. doi: 10.1016/j.ecolecon.2009.09.006
- Vincent, K. (2007). Uncertainty in adaptive capacity and the importance of scale. Global Environmental Change, 17, 12–24. doi: 10.1016/j.gloenvcha.2006.11.009
- Yohe, G., Strzepek, K., Pau, T., & Yohe, C. (2003). Assessing vulnerability in the context of changing socioeconomic conditions: A study of Egypt. In J.B. Smith, R.J.T. Klein, & S. Huq (Eds.), Climate change, adaptive capacity and development (pp. 101–135). London: Imperial College Press.
- Yohe, G., & Tol, R.S.J. (2002). Indicators for social and economic coping capacity – moving toward a working definition of adaptive capacity. Global Environmental Change, 12, 25–40. doi: 10.1016/S0959-3780(01)00026-7