
 ?Mathematical formulae have been encoded as MathML and are displayed in this HTML version using MathJax in order to improve their display. Uncheck the box to turn MathJax off. This feature requires Javascript. Click on a formula to zoom.
Abstract
The objective of the study is to assess the linkages between climate-related measures and Sustainable Development Goals (SDGs) in Ethiopia, Kenya and the Democratic Republic of Congo (DRC) within the scope of submitted Intended Nationally Determined Contributions (INDC). Given the under-reporting of least developed countries’ and emerging economies’ issues with regards to climate change mitigation and adaptation, this study is important in studying how these three countries are integrating electrification goals (SDG7) with their INDC. The analysis explores the electricity mix, the expected greenhouse gas emissions from electricity generation until 2030, and electrification and related metrics. The INDCs provide a platform to achieve universalization of electrification, catalysing climate finance. Given the bottom-up process inherent to the current climate agreement mechanism, the paper gives insights on how these countries have used the INDC to prioritize sustainable electricity access. The results show that the countries have different storylines as to their electricity access targets and INDC. Ethiopia aims at nearly 100% renewables for power, while Kenya only generates 54% of the total electricity with renewables in 2030. In the DRC, the percentage of renewables is very high, but the per capita electricity consumption remains low while the country becomes a power exporter. The three countries have set a target of 75% electricity access in 2030, but only Kenya comes halfway to the minimum of 2000 kWh/capita of economy-wide electricity generation, which is required for a reasonable level of welfare.
1. Introduction
Partners to the United Nations Framework Convention on Climate Change (UNFCCC) were requested to submit their Intended Nationally Determined Contributions (INDC) to the Secretariat of the UNFCCC as part of the preparations for the Paris Climate Agreement achieved in December 2015 at Conference of Parties 21 of the UNFCCC (Levin, Rich, Bonduki, Comstock, & Tirpak, Citation2015). The INDC provides information on how each country wants to address climate change, including quantifiable information on emissions reductions, among others. The impetus behind the INDC is that it is nationally determined and hence may be suited to each country and its developmental objectives and priorities. The INDC design and formulation process are meant to be transparent and the submission process was deemed to create accountability, engaging countries to think climate action in relation to their development strategies (Levin, Rich, Finnegan, & Dagnet, Citation2014; World Resources Institute, Citation2017). Despite this, it should be stressed that the INDCs submitted and the analysis which ensues in this paper are ex-ante in nature, and the targets by themselves are prone to variability and uncertainty.
Meanwhile, the global sustainable development agenda has been approved, including energy and climate related goals (United Nations Special Group for Economic and Social Affairs, Citation2015). The Sustainable Development Goals (SDGs) cover 17 areas and serve as a framework to help countries achieve sustainable development. The SDGs are considered a “set of universal and transformative goals for the people” (United Nations General Assembly, Citation2015). Energy is addressed specifically under Goal 7, having affordable universal electricity access as one of the major targets for 2030. It is the first time that a global agreement features specific objectives related to energy access. Given the large investments needed to provide energy access and eradicate poverty, it is essential that climate funds be leveraged upon to help catalyse sustainable development and contribute to the achievement of the SDGs. In other words, we would expect that INDCs explore the synergies between climate and sustainable development agendas.
This paper looks at how Ethiopia, Kenya and the Democratic Republic of Congo (DRC) have incorporated electrification targets into their INDCs, thus linking climate change mitigation with electricity access goals. The Sub-Saharan African (SSA) region has the largest population without access to electricity, and is lagging behind in the electrification process (International Renewable Energy Agency, Citation2015). Ethiopia, Kenya and the DRC had very low electricity access levels in 2012, namely 27%, 23% and 18% respectively (International Energy Agency, Citation2014). This correlates with populations of 70 million, 35 million and 60 million with no access to electricity. The three countries have set a target of 75% electricity access in 2030 which has been communicated in their INDCs and supporting development plans. Thus, the three countries are not aiming at 100% electrification in 2030 as suggested in the SDGs. Additionally, the scientific reporting of least developed countries and smaller emerging economies for the efficacy of their climate mitigation and adaptation have a record of being understated (Stott, Citation2014). Hence, Ethiopia and the DRC were selected along with Kenya.
Ethiopia, Kenya and the DRC have good renewable energy potential, ideal for medium to large scale power generation, which enables them to leverage climate financing for new investments. All three countries aim to take part in the power generation and trade pool that is being planned across the continent, and for which they are already attracting significant investments (International Renewable Energy Agency, Citation2015; Taliotis et al., Citation2016). Given all these factors, the question of how electricity targets are integrated within the INDC mitigation framework is important. Is the opportunity to ambitiously address sustainable electrification being properly explored in the climate-related actions proposed by the three countries?
The objective of this paper is to analyse how Ethiopia, Kenya and the DRC aim at improving electricity access in a context of climate change mitigation, thus matching electricity access with climate friendly technologies for power generation. The analysis explores (i) the electricity mix aimed for and its relation to the identified energy potential in the country, (ii) the expected annual greenhouse gas (GHG) emissions from electricity generation until 2030, and (iii) the rates of electrification, electricity intensity and emission intensity of electricity being aimed at. Even though sustainable energy development includes both electricity access and access to clean fuels, this paper focuses on electricity access and climate change mitigation from electricity generation only. Since the time frame of analysis is until the year 2030, the potential impact of climate change on renewable energy systems (e.g. water scarcity and its impact on hydropower) is not considered in the study.
The ultimate aim therefore is a better understanding of what the climate and development strategies of the three countries encompass in terms of emissions reductions as well as electrification goals, as reflected in their INDCs. Given the bottom-up process inherent to the INDC and the climate agreement mechanism, the paper gives insights into how the three countries have used the INDC to prioritize sustainable electricity access. It is presumed that the electrification goals are achieved by (i) increasing generation for domestic use and (ii) enabling access to electricity. The INDC can provide a platform to achieve universalization of electricity access, catalysing climate finance and climate-appropriate technologies. The question is, then, whether it is being explored that way and, if so, how.
Following this introduction, Section 2 lays out the conceptual basis for the analysis. Section 3 provides a review of the INDCs and development objectives for the countries in question, and describes the methods and definitions used to assess the information in the INDCs and the electricity goals of each country. Section 4 presents the results and discussions pertaining to the work carried out. Section 5 concludes the study.
2. Methods and conceptual analysis
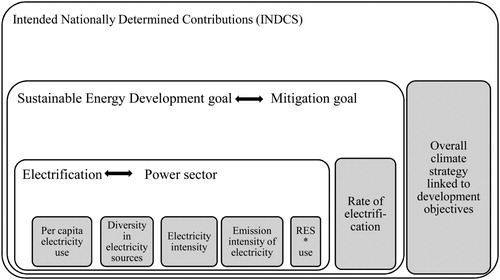
gives the overall framework of the study. The overarching ambition is bounded by the INDCs presented by the three countries, which are also linked to their overall development objectives (the shaded boxes give the influencing parameters). Our focus is on the sustainable electrification development goal (SDG 7) and its interaction and complementarity with the climate mitigation goal (SDG 13). For that matter, we are interested in metrics such as per capita electricity consumption, diversity of energy mix, electricity intensity of the economy, emission intensity of the economy and the role of renewable energy sources (RES).
Figure 1. Overall framework of research focus for Ethiopia, Kenya and the DRC.
Note: * RES = Renewable energy sources
The energy policy discourse on developing countries in the SSA is generally centred around access to clean fuels and electricity (Deichmann, Meisner, Murray, & Wheeler, Citation2011; Hailu, Citation2012; Onyeji, Bazilian, & Nussbaumer, Citation2012). The SDGs are expected to strengthen the links between energy goals and other goals, for example poverty alleviation, mitigation and adaptation to climate change and sustainable development at large (Nussbaumer, Bazilian, & Patt, Citation2013). In a region with less than 92.3 MW installed capacity per million people, where traditional and modern energy systems co-exist and wealth is unevenly distributed, energy access needs to consider resource availability and new technological pathways for providing modern energy services (Mapfumo et al., Citation2017). This means framing the process within a context of energy transition, which in turn requires dealing with the development of productive activities to orchestrate both social transformation and shift to new energy carriers (Sokona, Mulugetta, & Gujba, Citation2012).
The global sustainable development agenda requires the energy challenges to be understood and dealt with within environmental constraints such as climate change (Winkler & Marquand, Citation2009). However, while environmental constraints are important when considering the energy transition required in SSA, the merits of renewable energy in the region go beyond environmental benefits. The use of decentralized RES is an excellent way to provide electricity in rural areas, where poverty is more wide-spread and grid extension may not be a cost effective option (Karekezi, Citation2002). There is an intrinsic link between development and the energy and climate goals which can be systematically explored (Gujba, Thorne, Mulugetta, Rai, & Sokona, Citation2012). In this context, the INDC serves as an instrument to convey country strategies to address climate change and development, and attract resources from climate funds.
Many studies have previously analysed the relationship between electricity access and quality of life (Gómez & Silveira, Citation2010; Gómez, Sanches-Pereira, & Silveira, Citation2013; Silveira, Mainali, & Khatiwada, Citation2011). Goldemberg, Johansson, Reddy, and Williams (Citation1985) point to the historical correlation between energy use and the development of the gross national product. Approximately 210 W/capita of installed capacity is needed for high human development, which translates into approximately 1840 kWh/capita per year in terms of electric energy (it is assumed that there are 8760 hours in a year). The Human Development Report (Gaye, Citation2008) published in 2008 suggests that “a threshold of annual electricity consumption of 4000 kWh per capita is required to achieve an Human Development Indicator (HDI) value of 0.9 or greater”. The report also points out that increases above 4000 kWh/capita electricity consumption do not have a discernible effect on the increase of HDI values. It can also be noted that countries with HDI below 0.6 all had an electricity consumption below 1000 kWh/capita.
Wolde-Rufael (Citation2006) noted that some countries exhibit bi-directional causal relationship between GDP and electricity consumption. Although the GDP is not a perfect substitute for sustainable development, the causality between enhanced prosperity and electricity consumption cannot be ignored. Alstone, Gershenson, and Kammen (Citation2015) conclude that access to electricity is a first order linear predictor of HDI. This work also shows that there are steep gains in HDI for electricity consumption varying between 2000 and 4000 kWh/capita.
Thus, achieving a certain minimum level of electricity coverage and consumption per capita is important. For this study, and in line with findings in the literature, the minimum is set at 2000 kWh/capita electricity consumption. Most SSA countries have low electrification rates compared to the rest of the world, and this needs to be rectified as per the SDGs. In this context, it is natural to explore the complementary synergies between the INDCs and sustainable electricity access goals. To what extent are these synergies explored in the INDCs submitted by Ethiopia, Kenya and the DRC?
3. The INDCs of three countries in the sub-Saharan Africa
This paper analyses the INDCs of Ethiopia, Kenya and the DRC exploring synergies with the electrification goals. gives the context of the proposed mitigation in 2030, when compared to 1990, 2000, 2010 and 2012 for the three countries. The three countries have submitted their INDCs based on a Business As Usual (BAU) scenario, with varying reference years. The target indicated in the INDC is a reduction of emissions in comparison to the BAU emissions in 2030. The INDC targets indicated are the overall mitigation targets and not specific to the power sector, but they still hold relevant to understanding mitigation related to energy access given the importance of emissions in the energy sector.
Table 1. Emissions mitigation targets, emission intensity in the economy and emissions per capita 1990–2030 – Ethiopia, Kenya and the DRC.
In , the column titled BAU 2030 gives the GHG emissions that each country has stated as its BAU emissions. The column INDC target for 2030 gives the targets proposed in the INDC scenarios. The subsequent columns give the actual GHG emissions of the past years (for 1990, 2000, 2010 and 2012) and the reduction targets aimed at, as per the INDC. The GHG emissions, the GHG emissions intensity and the GHG emissions per capita are computed for the three countries for the past years and for the 2030 INDC targets (see ). Adjacent to the values for past years (1990, 2000, 2010 and 2012), there are columns indicating the difference between those years and the 2030 INDC scenario values, which can be used to better understand the pathway of each country.
The INDC for Ethiopia (Federal Democratic Republic of Ethiopia, Citation2015) covers economy-wide emissions of GHG gases from 2010 to 2030. The overarching ambition for the period is to become a middle-income country with a GDP of at least 1000 USD/capita. In quantitative terms, the BAU emissions are forecast to be 400 Mt-CO2eq in 2030 and the country proposes to reduce this to 145 Mt-CO2eq in 2030. This implies a 64% reduction in emissions in 2030 compared to the BAU projections, and a decrease of 39% in GHG emissions per capita when compared to 2010. This translates into a reduction of 89% in GHG emissions intensity between 2010 and 2030. The INDC provides a sectoral breakdown of where the reduction in GHG emissions are to be achieved. The INDC is based on the Ethiopian strategy and planning process called “Climate Resilient Green Economy Vision and Strategy” (Government of Ethiopia, Citation2011).
The highlight of the Ethiopian INDC is the high ambition in terms of GHG mitigation for 2030 which indicates lower emissions in 2030 under the INDC scenario than the emissions in 2010. As seen in , the Ethiopian GHG emissions were 149 Mt-CO2eq in 2010, and Ethiopia is aiming at 145 Mt-CO2eq in 2030. Thus, Ethiopia is effectively aiming at a low-carbon development, with emissions reductions from 2010 to 2030, even though it belongs to the Least Developed Country category, has 70 million people without access to electricity, and aspires to reach 75% electrification coverage by 2030. In most countries, moving from low-income to middle or high-income status has implied increased emissions (e.g. China, Western Europe). But Ethiopia hopes to avoid carbon-intensive development. One of the main strategies for achieving this is tied to the power sector, although the INDC does not provide a detailed plan for the power sector, nor gives the specific emission reductions from each power generation technology. The Ethiopian INDC explicitly states that climate finance is expected to support the implementation of some strategies. The total expenditure for the full implementation of the “Green Economy Strategy” is estimated at USD 150 billion by 2030.
The INDC for Kenya is based on the National Climate Change Action Plan (NCCAP) (Stiebert, Citation2012) and covers economy-wide emissions of CO2, CH4 and N2O. The Kenyan mitigation INDC is based on emission reductions from a BAU level (143 Mt-CO2eq), implying a 30% reduction by 2030. This translates into a reduction of 48% in terms of GHG emissions intensity from 2010, and a reduction of 5% in GHG emissions per capita from 2010 (see ). Total emissions are expected to increase between 2010 and 2030. The overarching ambition of Kenya is to become an industrialized middle-income country by 2030. Also, Kenya wants to achieve 75% electrification coverage by 2030. The INDC does not provide a breakdown of the GHG emissions of different sectors nor the reduction expected from each sector. The methodological basis for calculating the BAU GHG emissions is given by Cameron, Wurtenberger, and Stiebert (Citation2012) and Stiebert (Citation2012), which also highlights the electricity generation plan for Kenya. Kenya explicitly states that international climate finance and capacity-building of the order of USD 40 billion are required for both mitigation and adaptation activities across all sectors until 2030.
The INDC submitted by the DRC contains an economy-wide mitigation component. The DRC hopes to become an industrialized nation by 2030, this being the country’s broader development objective to be aligned with the INDC. The mitigation target is 17% emissions reduction by 2030 compared to the BAU emissions, or 430 Mt-CO2eq. This equates to an increase of 4% in the emissions per capita in 2030 compared to 2010 values, and a 74% decrease in emissions intensity in the same period (see ). In the case of the energy sector, there are no specific mitigation objectives or actions specified in the INDC. The total climate investment needed is estimated at USD 22 billion, of which USD 13 billion are required for mitigation, and USD 7 billion for development of the energy and transport sectors.
3.1. Development features of Ethiopia, Kenya and the DRC and congruence with mitigation goals
Following the overview of the INDCs, this section further analyses the development futures of the three countries. synthesizes key elements of the INDCs for Ethiopia, Kenya and the DRC along with the broader development objectives of the three countries. The latter are given as GDP growth rates and expected electrification rate for 2030. While the SDGs are defined in 17 different areas, these are intersecting goals (Sustainable Development Solutions Network (SDSN), Citation2015). As such, sustainable electricity access cannot be considered in isolation from the overall development in the country, which is also influenced by socio-economic factors such as population growth.
Table 2. Mitigation goals and development futures proposed by Ethiopia, Kenya and the DRC, selected parameters for comparison.
All three countries expect rapid GDP growth in the coming decade (Ethiopia 11%, Kenya 8% and the DRC 9%), following from on-going development initiatives towards industrialization, and in line with the countries’ competitive advantages (International Monetary Fund, Citation2015). Ethiopia hopes to achieve drastic reduction in emissions in the economy while Kenya and the DRC are less ambitious when it comes to mitigation goals. All three countries have comparable overall electrification rates and the same ambitions for 2030 (75%). There are some differences in their socio-economic statuses, with Ethiopia being the most populous, but having already reached the highest level of urban electrification among the three. Ethiopia has ambitious plans for increasing its GDP/capita to approximately 1500 USD/capita, from the current level of 311 USD/capita.
The INDCs and the mitigation of emissions expected should be assessed and understood in combination with the expected GDP growth of the country. a, b and c give the GHG emissions forecast in the BAU scenario presented for Ethiopia, Kenya and the DRC, respectively. The emissions are given in the primary vertical axes and the GDP is given in the secondary vertical axes (right axes). The figures show that the GDP growth trajectory aimed at is similar in the three countries, but the emission trajectories shall follow different paths per the INDCs.
Figure 2 (a). Ethiopia – GDP and BAU scenario for emissions, and emissions reduction proposed in the INDC, 2005–2030. (b). Kenya – GDP and BAU scenario for emissions, and emissions reduction proposed in the INDC, 2005–2030. (c). DRC – GDP and BAU scenario for emissions, and emissions reduction proposed in the INDC, 2005–2030.
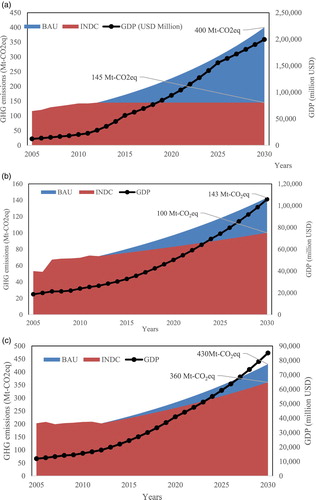
Ethiopia expects almost constant levels of emissions from 2012 to 2030, and a drastic reduction compared to its BAU projections. In the case of Kenya, the emission reductions are lower than in Ethiopia, and the INDC indicates that emissions will continue growing, albeit at a slower pace than in the BAU scenario. The lowest ambitions in terms of GHG reductions is exhibited by the DRC. In the case of Ethiopia, there is decoupling of GHG emissions from economic growth as per targets presented in the INDC, which is not the case for Kenya and the DRC.
3.2. Framing the power sector in the context of electrification
This paper looks at how Ethiopia, Kenya and the DRC have incorporated electrification targets into their INDCs. In this context, the emissions of the power sector are of primary importance. To reduce GHG emissions in the power sector while aiming for higher electricity access, countries must consider measures beyond the BAU. In this study, electricity access is represented by per capita economy-wide electricity generation. The rationale is that, in countries with severely constrained electricity availability, economy-wide electricity generation and use should be an overarching goal to achieve development at large (Gómez & Silveira, Citation2010; Goldemberg et al., Citation1985; Sokona et al., Citation2012; Wolde-Rufael, Citation2006). Thus, the causal linkage between GHG emissions and economy-wide electricity generation per capita is more relevant than simply emissions in relation to household electricity access.
Future economy-wide electricity generation for 2030 has been projected for the three countries focused in this study. These projections are compared to a BAU case forecast, which is estimated using a simple regression model to observe how the electricity generation and capacity targets of the three countries match past trends. We consider that electricity generation is directly linked to the development of the GDP per capita as per observed in the past years. This is compared with the targets given by the countries or multilateral organizations on behalf of the countries. The regression model’s independent variable is the GDP/capita for each individual country. The per capita electricity generation is the dependent variable. These GDP/capita forecasts are an underpinning assumption of the submitted INDCs, which makes their use in the regression model to forecast electricity generation reasonable. The regression equation can be given as follows:(1)
(1) where, Ecap = electricity supply per capita (in kWh per capita); GDPcap,GDP per capita (in USD per capita); A, regression coefficient for GDPcap; B, Residual component
The results of the regression show considerable growth in total electricity consumption (economy-wide) in the three countries (see ). The application of the regression model results in the expected per capita electricity use in 2030 (as shown in the equation above). This can be multiplied by the projected population in 2030 to derive the total electricity use in 2030. In all three countries, the electricity use per capita shows a lower growth rate from 2012 to 2030, compared to the total electricity use for the same period. The reason for this is that all three countries experience quite high population growth rates.
Table 3. The regression details of the Ethiopian, Kenyan and Congolese electricity generation.
The total electricity generation in 2030 is approximately 55 TWh in Ethiopia. This represents a growth rate of 12.4% per annum from 2012 to 2030. The annual growth rate is 8.5% for Kenya and 6.9% for the DRC in the same period. Even though these growth rates are higher than the historical growth rates of these countries, the growth rate of per capita electricity consumption is lower than the growth rate of the total electricity generation in each country between 2012 and 2030. This implies that the overall increase in electricity generation and availability of electricity in the country is not followed by a similar increase in the per capita electricity use. Among the three countries, the DRC has the lowest growth rate for per capita electricity consumption, which mirrors the past trends of electricity access in the country.
It is also important to understand that the power sector expansion as envisioned in these countries does not happen in a financial vacuum. As such, a cost calculation has been carried out for the investment needed in the power sector from 2012 to 2030 for generation in the three countries using investment costs presented for African countries in bona fide research publications (Miketa & Merven, Citation2012; Ndhlukula, Radojičić, & Mangwengwende, Citation2015). In the case of the DRC, the investment cost for the power system expansion using the major hydro resources are given in (Miketa & Merven, Citation2012), whereas for the cases of Ethiopia and Kenya, the costs of investment are taken from (Ndhlukula et al., Citation2015)
The cost calculation for the investment needed for the generation capacity expansion can be given by the equation:(2)
(2) where i is each different technology, t is the final year (2030), t0 is the initial year/current year (2012) and Ci is the investment cost of each type of generation technology and Cap is the capacities of that technology in the initial and final years.
This is a simple cost calculation since it does not consider the time value of money in the investment or construction stage, but rather considers the overnight investment costs. The overnight investment costs have been used to calculate the cumulative cost of the power sector expansion needed to achieve the electricity generation. Overnight cost is defined as the cost of a project with no interest incurred during construction, as if the project was completed “overnight.” (International Renewable Energy Agency (IRENA), Citation2014). The overnight cost is frequently used when describing power plants and provide an overall picture of the total investments needed. The unit of measure typically used when citing the overnight cost of a power plant is “$/kW”. The costs used for this study are given below in .
Table 4. The investment costs of the planned power generation technologies (Miketa & Merven, Citation2012; Ndhlukula et al., Citation2015).
3.3. Assessing if and how INDCs prioritize electricity access
Following the framing of the power sector in terms of electricity access, this section presents the definitions of the metrics used to assess if and how electricity access has been prioritized in the INDCs of the three countries in question. The parameters used for this assessment are (i) diversity of the electricity generation sources, (ii) electricity intensity, (iii) emission intensity of electricity, RES use and per capita electricity use (Vera & Langlois, Citation2007).
3.3.1. Diversity of electricity generation
The electricity mix of the three countries in 2030 has been analysed in terms of the fuel/generation mix. The diversity of both the generation mix and the capacity mix has been calculated for 2030 by using the modified Shannon-Weiner Index (SWI). The equation governing the modified SWI is given as follows (Stirling, Citation1998):(3)
(3) where
(4)
(4) and; n is the total number of different energy types and; pi is the fraction of each energy type as a ratio of the total primary energy supply.
The original SWI for diversity only consists of(5)
(5) where the same definitions for p and n hold.
The diversity equation measures how diverse the electricity supply sources are, in the case of the country’s electricity supply mix. This parameter has been extensively used by energy economists to calculate energy diversity. It is also taken as an indicator to calculate energy security and sustainability in multiple research studies (Jansen, Citation2009; Kruyt, van Vuuren, de Vries, & Groenenberg, Citation2009; Selvakkumaran & Limmeechokchai, Citation2013). The equation works under the assumption that, given a fixed number of alternatives for electricity generation, the more evenly spread they are, the better for the sustainability of the power mix. The underlying mathematical expression is that more evenly spread sources of electricity are better than more converged methods of electricity generation.
The diversity is normalized as a percentage, and a higher percentage indicates higher diversity. This normalization has been done in a multi-country study for the Asian region (Asia Pacific Energy Research Consortium, Citation2007), and is a convenient way of expressing the diversity. Hence, an increase in the diversity values of the generation mix and the capacity mix is considered beneficial to the electricity sector. This implies that the country has more options to consider when supplying electricity, and is less vulnerable to disruptions.
3.3.2. Electricity intensity
Electricity intensity of the economy is given as the ratio between electric energy use in kWh and the GDP of the economy in USD. This metric is thought to represent the effect of electricity provision and use on the overall economy. While this does not capture all the facets of changes and improvements in the economy, it provides an indication of how the countries are prioritizing electricity as a motor for the development of their economies.
3.3.3. Emission intensity of electricity
The GHG emissions linked to electricity generation are an integral part of intended measures to address climate change. The emissions need to be normalized with respect to the sources of the GHG emissions. In this case, the metric is the emissions generated per unit of electricity. The emission factor of the grid has been computed using a simple Tier 2 approach for GHG emissions, in which the fuel emission factor is used in conjunction with generation efficiency and generation quantity. The methodology used has been taken from the Intergovernmental Panel on Climate Change (IPCC) 2006 guidelines for GHG emissions inventories (Gómez et al., Citation2006). As per the guidelines, the emission factor for renewable generation technologies is zero, including major hydro power sources. The generation efficiency of the technologies have been obtained from studies conducted for SSA countries (Miketa & Merven, Citation2012). The efficiency of the diesel fuel powered electricity generators is assumed at 32%. The future coal power plants of Kenya are assumed to have plant efficiencies of approximately 39%, as per reported by their energy sector development plans (Cameron et al., Citation2012).
3.3.4. Electricity use per capita
The electricity use per capita is a metric defined to indicate how much electricity is available throughout the country. The electrification targets proposed have been translated into urban and rural electrification and electricity consumption per capita. The electricity consumption per capita is computed as a ratio of total electricity wide generation and total population of the country. The population projections have been obtained from the United Nations’ Population Division Report (United Nations Department of Economic and Social Affairs (Population Division), Citation2015).
3.3.5. Renewable energy use
The renewable potential available in the three countries have been obtained from time-relevant and updated publications from multilateral organizations and/or governmental communications. In the case of Ethiopia the renewable potential has been obtained from (International Renewable Energy Agency (IRENA), Citation2014) along with contributions from (Government of Ethiopia, Citation2011). The RES potential for Kenya has been obtained from a peer-reviewed study (Kiplagat, Wang, & Li, Citation2011). The renewable energy potential for the DRC has been obtained from a multilateral study which evaluates the clean power corridor of Africa (Ndhlukula et al., Citation2015). The renewable energy use has been given as a share of renewables used as a ratio of the total potential of renewable energy available in each country.
4. Results and discussion
4.1. Ethiopia
Ethiopia’s electricity generation target of 67 TWh for 2030 is 22% higher than the BAU case of 55 TWh. The total electricity generation target translates to 487 kWh/capita in per capita electricity use. This is 18% higher than the per capita electricity use of 398 kWh/capita in the BAU case. The capacity mix in 2030 is dominated by hydro power and geothermal generation.
4.1.1. Diversity of the generation and capacity mix and grid emission factor
The diversity of the capacity mix increases from around 21% in 2012 to approximately 39% in 2030, which increases the robustness of the power generation capacity. Concurrently, the diversity of the generation mix increases from 4% in 2012 to approximately 45% in 2030. This implies a significant increase in the diversity of the power generation capacity, which also implies less dependency on a single energy source, and increased sustainability for electricity supply. The increase in diversity is due to the introduction of geothermal, wind and solar power generation from 2012. The solar potential is high, thus the expected increase in solar power by 2030 is only a small portion of the available resource (See ).
Table 5. The renewable potential and installed capacity of Ethiopia (Government of Ethiopia, Citation2011).
The emission factor of the Ethiopian grid is almost zero, since hydro power and geothermal generation dominate the mix. This has also been the case historically. The highest emission factor was approximately 0.88 kt-CO2eq/ktoe-electricity in 1990, and the emission factor has been gradually declining since then. In 2012, the emission factor of electricity in Ethiopia was around 0.069 kt-CO2eq/ktoe-electricity. This declines further to approximately 0.01 kt-CO2eq/ktoe-electricity in 2030, which is almost negligible. Ethiopia is maintaining its low-carbon power sector portfolio with some addition of hydro power sources and considerably higher addition of other RES. This also enhances the diversity.
Ethiopia aims at developing mini-grid and off-grid options to increase electricity access in rural areas, which also features in the generation mix of 67 TWh in 2030. This partly contributes to the increase in diversity and robustness of the power sector as it helps reduce the load of the grid. The total grid capacity has been computed by considering the off-grid sources as a separate generation source. This information has been obtained from research reports of multilateral organization dealing with sustainable energy access expansion in Ethiopia (Tessama, Davis, Tella, & Lambe, Citation2013).
The Ethiopian INDC and the electrification goals have considerable synergies. Ethiopia has a climate-friendly expansion plan for the power sector mainly based on RES and increased diversity together with enhanced electricity access. The use of locally available renewable sources such as wind and geothermal RES helps increase reliability and sustainability of the generation. The total investment cost for the power supply expansion (2013–2030), without the cost of connections is approximately USD 25 billion. In relative terms, this is approximately equivalent to the total GDP of Ethiopia in 2012. Part of the funding for the achievement of the electrification goal could come from climate finance, not least considering that the study has shown that the electrification goal and climate goals are complementary.
4.1.2. Electrification and economy-wide electricity intensity
As the electricity access increases to 75% in 2030, urban and rural electrification rates reach 100% and 66%, respectively. The electricity consumption per capita is 486.7 kWh/capita in 2030. This translates to approximately 9 kWh/day for a family of five, which is barely enough to power four 20 W lightbulbs for four hours and run a powered freezer-less refrigerator along with kitchen equipment and some electronics. This gives an indication of the challenge ahead for a country like Ethiopia which, despite the positive development denoted in the electrification plans, still needs to do much more to promote meaningful electricity access.
The electricity intensity and electricity emissions intensity of the economy are given in . The emission intensity of electricity is given in the secondary vertical axis (right vertical axis). The electricity intensity of the economy increases from 2010 until 2030, to much higher levels than the pre-2010 period. This indicates that electricity is to play a larger role in the economy in general as the country develops. Not surprisingly, the electricity intensity increases, as the country industrializes and structural shifts occur in the economy and energy use patterns. The rapid rise of electricity intensity of the Ethiopian economy from 2012 to 2020 is partly a result of the aggressive growth in electricity generation which is planned. A small decrease in the electricity growth rate is expected from 2020 to 2025 while the robust growth rate in the GDP is expected to hold. This is reflected in the electricity intensity measured in kWh/USD showing a decrease from 2020 to 2025. This reduction in the electricity growth rate may be anticipated by the planning authorities due to the expectation of scaling and efficiency effects kicking in. But, it should be noted that a decrease in the growth rate of the electricity demand does not imply that there is a decrease in the electricity demand. On the contrary, the demand is expected to grow continuously.
Figure 3. Electricity intensity and emission intensity of electricity of Ethiopia, as proposed from the INDCs.
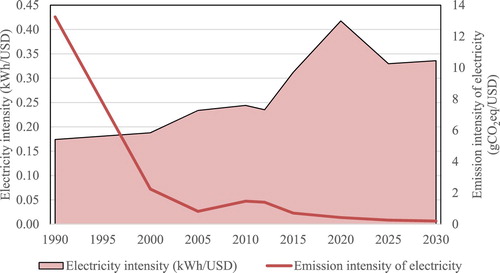
The emission intensity of electricity continues decreasing. Thus, Ethiopia is shifting gradually away from carbon intensive generation sources. In fact, electricity-related emissions have decreased sharply since 1990 and, obviously, the country has the ambition to continue in this track.
4.2. Kenya
Kenya’s electricity generation target of 60 TWh for 2030 is 41% higher than the BAU case electricity generation, which is 35 TWh. The total electricity generation target translates to a per capita electricity consumption of 899 kWh/capita. This is 40% higher than the BAU case per capita electricity consumption, which was computed as being 529 kWh/capita in 2030. The capacity mix in 2030 is dominated by geothermal and coal, but also other thermal power generation is considered.
4.2.1. Diversity of the generation and capacity mix and grid emission factor
Kenya’s power sector sees moderate growth in the use of renewables. The ambition is to have 30 TWh from renewables in 2030 which is approximately 84% of the BAU regression model electricity generation (36 TWh). This points to high ambition when it comes to increasing the availability of electricity, and thus high probability of achieving the electrification targets set.
Kenya is aiming at a diversified electricity generation mix in 2030, with geothermal, coal and conventional medium-speed diesel powered gas turbines, hydro and wind power technologies playing important parts. Thus, the diversity of generation increases drastically, from 52% in 2012 to approximately 80% in 2030. The increasing diversity is a positive development for Kenya, since it is a way of hedging against supply shortages due to climatic impacts, for example affecting hydro power generation. But this diversity comes at a cost to the environment. In 2030, only 54% of the total generation is expected to come from renewable sources. Kenya has plans for 2400 MW of coal generation by 2030. This is almost 17% of Kenya’s generation capacity and 21% of total generation in 2030. These plans are related to the discovery of domestic coal resources, and certainly impact upon climate change mitigation.
The emission factor of electricity generation increases over the years, due to the emergence of coal thermal power plants. From approximately 2.7 kt-CO2eq/ktoe-electricity in 2012, the emission factor of electricity increases to 3.4 kt-CO2eq/ktoe-electricity in 2030. The renewable energy potential, as estimated for 2015 and the percentage used in 2030 are given in . The RES-based installed capacity increases eight-fold from 1043 MW to 8226 MW between 2012 and 2030. Yet, compared to the total growth of the installed capacity, which is 14,261 MW in 2030, RES lags in Kenya.
Table 6. The renewable potential and installed capacity of Kenya (International Institute for Sustainable Development, Citation2013; Kiplagat et al., Citation2011).
While Kenya utilizes significant amounts of its geothermal and wind sources, the utilization of hydro power and solar power sources is more modest. Nevertheless, solar photovoltaic (PV) panels have been distributed in considerable numbers to support off-grid electricity access for both households and public buildings such as schools and hospitals (Kiplagat et al., Citation2011).
The INDC of Kenya and the supporting climate change and development oriented plans are strong documents, yet the synergy between the measures of the INDC and the electrification goals could be better aligned. The electrification goal is achieved along the generation expansion. Though the diversity of the generation mix and the capacity mix increase, also including significant amount of domestic RES, the large addition of coal power generation increases the emission factor of the grid. Thus, Kenya fares less effectively than Ethiopia in terms of climate mitigation. The total investment cost of the power plant expansion of Kenya from 2013 to 2030 is approximately USD 39 billion. This is approximately 1.5 times the total GDP in 2012. This gives an indication of the funds required for such ambitious electrification levels, and the challenges posed to Kenya.
4.2.2. Electrification and economy-wide electricity intensity
When the overall electrification increases to 75% in 2030 in Kenya, the urban and rural electrification increases to 90% to 68%, respectively. Kenya has also invested funds into mini-grid and off-grid electrification schemes which contribute to increased accessibility to electricity. The per capita electricity consumption increases from 193 kWh/capita in 2012 to about 899 kWh/capita in 2030. This is a significant increase in per capita electricity consumption (about 8.9% per annum), also in relation to the results obtained from the BAU regression model.
gives the electricity intensity of the economy and the emission intensity of electricity in Kenya. As in the case of Ethiopia, the electricity intensity of the Kenyan economy increases, indicating a shift to more electricity intensive economic activities. However, in Kenya, the emission intensity also increases due to the expansion of carbon intensive electricity generation.
Figure 4. Electricity intensity and emission intensity of electricity of Kenya, as proposed from the INDCs.
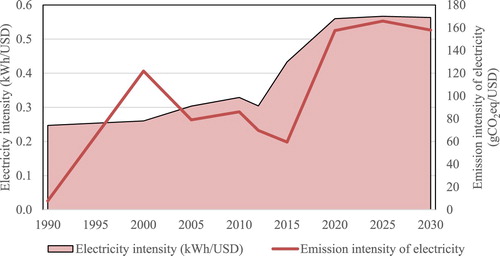
The shift to higher electricity intensity is in line with the ambition to industrialize the economy, for which electricity is needed. But, the increasing trajectory of emission intensity is not a welcome phenomenon from the point of view of climate change mitigation. The trend observed in indicates stabilization of the emissions intensity after 2020 but the analysis in this study does not allow us to conclude that this will be a long-term stabilization. For that, increased focus on renewable sources will be needed.
4.3. The DRC
4.3.1. Diversity of the generation and capacity mix and the emission factor
The electricity use in the BAU case for DRC 2030 is 27 TWh, which is higher than the use projected in the country’s own plans (21 TWh). This reflects the modest ambition of the DRC when it comes to electrification goals. But it is also a reflection of the many problems that the country has to address to promote sustainable development.
The diversity levels of the DRC generation capacity and mix have been historically low, since the DRC has depended mainly on hydropower generation sources in the past. In the coming years, both the generation and capacity mix diversity of the DRC increases from 2% and 6% in 2012 to 16% and 14% in 2020, respectively. This is due to the introduction of solar PV systems and small hydro power systems, which are mainly servicing off-grid localities. One of the main hurdles to be faced by the country is the geographical conditions and tough terrain which makes it costly to connect electricity generation to end users.
The DRC is home to a large hydropower potential, estimated at approximately 100 GW. Of this, only around 2.4 GW was being harnessed by 2012. Still, the actual operational capacity is estimated to be much lower. Despite the large potential, which can help meet electricity demand not only in DRC but in the whole region, the strong focus on developing the hydropower potential implies that other small scale yet affordable renewable potential is being largely neglected. The DRC has considerable wind power potential (approximately 77 GW) (Clean Energy Information Portal, Citation2016) yet there is minimal interest in developing this resource. Also, the DRC has good geothermal power prospects which are not being given enough attention. As mentioned in the diversity analysis, the strong focus on hydropower affects the energy mix and the levels of diversity. In 2030, apart from the hydropower generation source, very minimal amounts of solar and small hydro power plants are expected to be installed. The solar capacity is going to be less than 1% and the small hydro capacity is going to be approximately 2%.
4.3.2. Electrification and economy-wide electricity intensity
The electricity generation demand projected by the BAU regression model is approximately 21% higher than the amount projected by the DRC. Along with this, an ambitious electrification target of 75% in 2030 is to be achieved which would result in an electrification of 80% in urban areas and almost 70% in rural areas. This presents a big challenge, as the current electrification rates for the urban and rural areas stand at 36% and 6%, respectively.
If the ambitious 75% electrification target is to make any difference, it must be continuously addressed until a sustainable amount (which is about 2000 kWh/capita) is achieved. In 2030, with the current total generation planned, a per capita electricity consumption of 255.5 kWh/capita can be reached. In 2012, the per capita electricity consumption was 121.1 kWh/capita, which implies an annual growth rate of 4.2% from 2012 to 2030, or the lowest among the three countries assessed here. This implies very few hours of useful electricity access for a typical family of five. This is contradictory considering that the DRC is home to the largest hydro power resources in the world at current times, and hopes to be an active member in both the East African Power Pool (EAPP) and South African Power Pool (SAPP).
gives the electricity intensity and emission intensity of electricity in the DRC. Unlike Ethiopia and Kenya, the DRC has decreased electricity intensity and emission intensity in the years to come. This implies that the structure of the DRC economy is not going to shift towards electricity intensive activities, and neither does the generation of electricity keep up with the pace of economic growth expected. The emission intensity of the electricity generation is decreasing, like the Ethiopian case, with the emphasis being on major hydro power systems. This is positive from the climate change mitigation point of view.
Figure 5. Electricity intensity and emission intensity of electricity of the DRC, as proposed from the INDCs.

4.4. Country comparison for INDCs and electrification targets
The presents a comparison of the three countries analysed in terms of their power sector per capita GHG emissions. The Kenyan GHG emissions are given in a secondary vertical axis (right axis), to differentiate its scale from that of the Ethiopian and the Congolese emissions. The emissions of both Ethiopia and the DRC are almost stationary from 2020 to 2030, with very small increases (as seen with respect to the left vertical axis). This is possible as the two countries primarily use non-carbon RES in their power capacity expansion.
Figure 6. Comparison of GHG emissions from the power sector of the three countries, as per the INDCs.
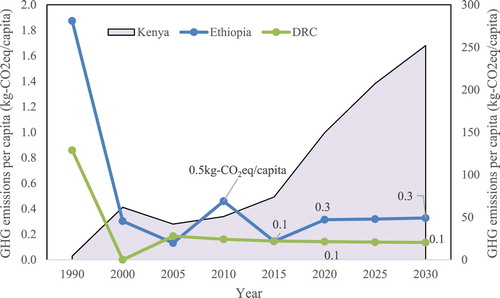
In contrast, the Kenyan power sector emissions increase from 60 kg-CO2eq/capita in 2012 to approximately 250 kg-CO2eq/capita in 2030. This is shown in the right vertical axis of . On a per capita basis, the Kenyan emissions are far higher when compared to the DRC and Ethiopia, due to a higher percentage of non-renewable electricity generation sources in Kenya.
gives the share of renewables and installed capacity per capita of the three countries in 2012 and 2030. The point to be noted is that all countries increase their per capita installed capacity from 2012 to 2030. Kenya has the highest growth percentage in terms of installed capacity per capita; double that of Ethiopia. Ethiopia plans for moderate growth, and achieves this while preserving the existing high share of RES in its power generation. While Kenya performs best in terms of increasing electricity access, this is not achieved with optimal synergy between electrification goals and de-carbonization of the electricity sector.
Table 7. Share of renewables and installed capacity per capita in the three countries, with 2030 values being projected amounts if the INDCs and plans are realized.
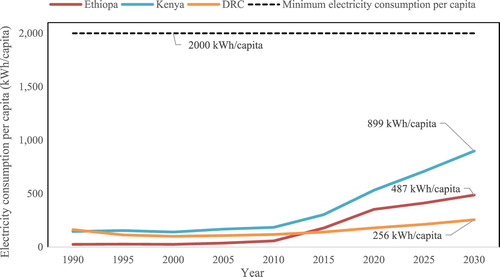
presents the per capita electricity consumption of the three countries up to the year 2030. Also, the dotted line is drawn at the level of 2000 kWh/per capita, which is considered as the minimum level of electricity consumption per capita for sustainable electricity access for the purposes of this study. The justification for the selection of this per capita electricity consumption has been described in Section 2. Overall, the three countries are struggling to meet the level of electricity consumption of 2000 kWh/capita. Kenya reaches almost half of that level at approximately 900 kWh/capita in 2030, but as shown previously, does so at the expense of GHG emissions. The per capita consumption of electricity has been historically higher in the DRC than in Ethiopia and Kenya. Yet, the growth rate has stagnated. There could be many reasons for this, including quality of the power generation and connections, and deepening inequality in service provision. These analyses are outside the scope of this paper but, either way, the DRC faces monumental obstacles, and support will be needed from the international community.
Figure 7. Electricity consumption per capita in Ethiopia, Kenya and DRC up to the year 2030.
An important thing to keep in mind is that the lower levels of electricity consumption or access is not just a matter of adversely affecting energy access. It also signifies the myriad structural inequalities in societies in the three countries, which negatively impacts different goals of the SDGs, such as good health and well-being (SDG3), decent work and strong economy (SDG8) and sustainable cities and communities (SDG11), to name a few examples. Sovacool (Sovacool, Citation2012) clearly articulates that non-availability of modern energy impacts upon most facets of life directly or indirectly, and leads to the vicious cycle of power inequality in the society. In addition, there is clear evidence that a lack of electricity or modern energy disproportionately affects females (United Nations Environment Programme, Citation2015). Thus, all three countries assessed in this study face stiff challenges in addressing the electrification and electricity access problem.
5. Conclusions
Global agendas such as the SDGs and the Paris Climate Agreement offer opportunities for countries in less developed parts of the world to promote development goals while also addressing climate change. In this paper, we have looked at how Ethiopia, Kenya and the DRC integrate electrification goals (SDG7) with their INDCs, and how that will help overcome the challenge to provide electricity to additional 165 million people in the three countries. Our analysis has explored (i) the electricity mix aimed for, (ii) the expected GHG emissions from electricity generation until 2030, and (iii) electrification goals.
Our findings show that Ethiopia has ambitious plans to increase electrification through the introduction of more hydropower sources, along with geothermal, solar and wind sources. This increases the diversity of the power sector until 2030 and gradually leads towards a zero-emission electricity sector. Additionally, the Kenyan power sector will also have higher diversity in the power sector in 2030 than in 2012, but this will come at a climate cost due to the increase in coal thermal generation capacity. The case of Kenya contrasts with those of Ethiopia and the DRC, the latter two with similar ambitions when it comes to electrification rates but aiming at a de-carbonized electricity sector. The increased use of coal also impacts the emission intensity of the power sector in Kenya, which increases from 2012 to 2030. The DRC has plans not only for increasing electrification in the country, but also becoming a regional electricity exporter. It has the highest potential of hydropower in the world and plans to use a considerable portion of it. But the expansion of the power sector is not tied to commitments with electricity access in the country, and thus the electricity consumption per capita of the DRC increases the least among the three countries analysed.
Our analysis shows that, despite having the same electrification goal for 2030 (75%), the three countries propose diverse ways of achieving that. While per capita installed capacity increases in the three countries, only Ethiopia achieves the increase by aggressively employing renewable power generation options. At the same time, only Kenya comes even close to the halfway mark of 2000 kWh/capita, which is considered as the minimum per capita electricity consumption as a proxy for electricity access. However, this comes at a cost, with the emission factor of electricity generation increasing almost five-fold. The amount of financial resources needed to reach these partial achievements indicate how crucial the support of the international community will be. Climate funds are important for the achievement of the SDGs and the Paris Agreement, but will also have to be leveraged upon so that welfare can be improved in poor countries.
Furthermore, while the three countries have the ambition to become industrialized countries by 2030, the analysis shows that these countries will have only modest growth in the electricity intensity from 2012 to 2030 and this raises questions about the welfare improvements that can actually be achieved with these modest rates of growth of electricity intensity.
The bottom-up process established for individual countries to submit their INDCs provide an opportunity for developing countries to connect their development goals with climate mitigation and adaptation measures. But, the findings lead us to conclude that while Ethiopia and to a certain extent the DRC are mindful of the climate component of the INDC with respect to electrification, none of the three countries have fully used this opportunity to showcase their development of electricity access as a tool to promote the SDGs at large. A second round of the INDC should therefore, not only focus on enhancing climate action, but also on further exploring the opportunities to address development needs.
Acknowledgements
The authors would like to thank the two anonymous reviewers for their valuable comments and suggestions.
Disclosure statement
No potential conflict of interest was reported by the authors.
ORCID
Sujeetha Selvakkumaran http://orcid.org/0000-0002-0237-7886
References
- Alstone, P., Gershenson, D., & Kammen, D. M. (2015). Decentralized energy systems for clean electricity access. Nature Climate Change, 5(2002), 305–314. Nature Publishing Group. doi: 10.1038/nclimate2512
- Asia Pacific Energy Research Consortium. (2007). A quest for energy security in the 21st century resources and constraints. Security. Retrieved from www.ieej.or.jp/aperc
- Cameron, L., Wurtenberger, L., & Stiebert, S. (2012). Kenya’s climate change action plan : Mitigation; Chapter 5 : Electricity Generation. Retrieved from http://www.ecn.nl/docs/library/report/2012/b12010.pdf
- Clean Energy Information Portal (reegle). (2016). Energy profile of Democratic Republic of Congo.
- Deichmann, U., Meisner, C., Murray, S., & Wheeler, D. (2011). The economics of renewable energy expansion in rural sub-Saharan Africa. Energy Policy, 39(1), 215–227. doi: 10.1016/j.enpol.2010.09.034
- Federal Democratic Republic of Ethiopia. (2015). Intended nationally determined contribution (INDC) of the federal Democratic Republic of Ethiopia.
- Gaye, A. (2008). Human development report 2007/2008: Access to energy and human development. Human Development Report Office.
- Goldemberg, J., Johansson, T. B., Reddy, A. K. N., & Williams, R. H. (1985). Basic needs and much more with one kilowatt per capita. AMBIO: A Journal of the Human Environment (Royal Swedish Academy of Science), 14(4/5), 190–200. doi: 10.2307/4313148
- Gómez, D. R., Watterson, J. D., Americanohia, B. B., Ha, C., Marland, G., Matsika, E., … Treanton, K. (2006). Chapter 2 stationary combustion in 2006 IPCC guidelines for national greenhouse gas inventories. In 2006 IPCC guidelines for national greenhouse gas inventories. doi:10.1016/S0166-526X(06)47021-5
- Gómez, M. F., Sanches-Pereira, A., & Silveira, S. (2013). Technology for social inclusion: The case of electricity access in the Brazilian amazon. Journal of Sustainable Development of Energy, Water and Environment Systems, 1(3), 237–259. doi: 10.13044/j.sdewes.2013.01.0018
- Gómez, M. F., & Silveira, S. (2010). Rural electrification of the Brazilian Amazon - achievements and lessons. Energy Policy, 38(10), 6251–6260. doi: 10.1016/j.enpol.2010.06.013
- Government of Ethiopia. (2011). The path to sustainable development, Ethiopia’s climate resilient green economy strategy. Retrieved from http://www.uncsd2012.org/content/documents/287CRGEEthiopiaGreenEconomy_Brochure.pdf
- Gujba, H., Thorne, S., Mulugetta, Y., Rai, K., & Sokona, Y. (2012). Financing low carbon energy access in Africa. Energy Policy, 47(Suppl.1), 71–78. doi: 10.1016/j.enpol.2012.03.071
- Hailu, Y. G. (2012). Measuring and monitoring energy access: Decision-support tools for policymakers in Africa. Energy Policy, 47, 56–63. doi: 10.1016/j.enpol.2012.03.065
- International Energy Agency. (2014). Africa energy outlook. A Focus on the Energy Prospects in Sub-Saharan Africa. World Energy Outlook Special Report, International Energy Agency Publication.
- International Institute for Sustainable Development. (2013). Low carbon climate resilient development pathway technical report.
- International Monetary Fund. (2015). World economic outlook database.
- International Renewable Energy Agency (IRENA). (2014). A renewable energy roadmap.
- International Renewable Energy Agency (IRENA). (2015). Prospects for the African power sector scenarios and strategies for Africa: Project 2.
- Jansen, J. C. (2009). Energy services security : Concepts and metrics. Expert Paper Submitted as Input to the Ongoing IAEA Project: Selecting and Defining Integrated Indicators for Nuclear Energy, 1–35.
- Karekezi, S. (2002). Poverty and energy in Africa—A brief review. Energy Policy, 30(11–12), 915–919. doi: 10.1016/S0301-4215(02)00047-2
- Kiplagat, J. K., Wang, R. Z., & Li, T. X. (2011). Renewable energy in Kenya: Resource potential and status of exploitation. Renewable and Sustainable Energy Reviews, 15(6), 2960–2973. doi: 10.1016/j.rser.2011.03.023
- Kruyt, B., van Vuuren, D. P., de Vries, H. J. M., & Groenenberg, H. (2009). Indicators for energy security. Energy Policy, 37(6), 2166–2181. doi: 10.1016/j.enpol.2009.02.006
- Levin, K., Rich, D., Bonduki, Y., Comstock, M., & Tirpak, D. (2015). Designing and preparing intended nationally determined contributions (INDCs).
- Levin, K., Rich, D., Finnegan, J., & Dagnet, Y. (2014). Ex-ante clarification, transparency, and understanding of intended nationally determined mitigation contributions. Retrieved from http://www.wri.org/publication/ex-ante-clarification-transparency-and-understanding-intended-nationally-determined
- Mapfumo, P., Onyango, M., Honkponou, S. K., El Mzouri, E. H., Githeko, A., Rabeharisoa, L., … Agrawal, A. (2017). Pathways to transformational change in the face of climate impacts: An analytical framework. Climate and Development, 9(January 2016), 439–451. doi: 10.1080/17565529.2015.1040365
- Miketa, A., & Merven, B. (2012). Southern African power pool: Planning and prospects for renewable energy.
- Ministry of Environment and Natural Resources. (2015). Kenya’s intended nationally determined contribution. doi:10.1007/s13398-014-0173-7.2
- Ndhlukula, K., Radojičić, T., & Mangwengwende, S. (2015). Africa clean energy corridor: Analysis of infrastructure for renewable power in eastern and Southern Africa. International Renewable Energy Agency (IRENA).
- Nussbaumer, P., Bazilian, M., & Patt, A. (2013). A statistical analysis of the link between energy and the millennium development goals. Climate and Development, 5(May 2013), 101–112. doi: 10.1080/17565529.2013.789787
- Onyeji, I., Bazilian, M., & Nussbaumer, P. (2012). Contextualizing electricity access in sub-Saharan Africa. Energy for Sustainable Development, 16(4), 520–527. doi: 10.1016/j.esd.2012.08.007
- REPUBLIQUE DEMOCRATIQUE DU CONGO. (2015). SOUMISSION DE LA CONTRIBUTION NATIONALE PREVUE DETERMINEE AU NIVEAU NATIONAL AU TITRE DE LA CONVENTION DES NATIONS UNIES SUR LES CHANGEMENTS CLIMATIQUES.
- Selvakkumaran, S., & Limmeechokchai, B. (2013). Energy security and co-benefits of energy efficiency improvement in three Asian countries. Renewable and Sustainable Energy Reviews, 20, 491–503. doi: 10.1016/j.rser.2012.12.004
- Silveira, S., Mainali, B., & Khatiwada, D. (2011). Green energy for development in Nepal. In The road to Rio + 20: For a development-led green economy, United Nations,UNCTAD (2nd ed., pp. 79–83). UNCTAD.
- Sokona, Y., Mulugetta, Y., & Gujba, H. (2012). Widening energy access in Africa: Towards energy transition. Energy Policy, 47(Suppl.1), 3–10. doi: 10.1016/j.enpol.2012.03.040
- Sovacool, B. K. (2012). The political economy of energy poverty: A review of key challenges. Energy for Sustainable Development, 16(3), 272–282. International Energy Initiative. Published by Elsevier Inc. All rights reserved. doi: 10.1016/j.esd.2012.05.006
- Stiebert, S. (2012). Kenya’s climate change action plan: Mitigation; Chapter 2 : Preliminary Greenhouse Gas Inventory.
- Stirling, A. (1998). On the economics and analysis of diversity. Science Policy Research Unit (SPRU), Electronic … .
- Stott, C. (2014). An examination of the least developed countries in the IPCC AR 5 WGII.
- Sustainable Development Solutions Network (SDSN). (2015). Indicators and a monitoring framework for sustainable development goals - Launching a data revolution for the SDGs.
- Taliotis, C., Shivakumar, A., Ramos, E., Howells, M., Mentis, D., Sridharan, V., … Mofor, L. (2016). An indicative analysis of investment opportunities in the African electricity supply sector — using TEMBA (The electricity model base for Africa). Energy for Sustainable Development, 31(April), 50–66. doi: 10.1016/j.esd.2015.12.001
- Tessama, Z., Davis, M., Tella, P., & Lambe, F. (2013). Mainstreaming sustainable energy access into national development planning: The case of Ethiopia (Stockholm Environment Institute, Working Paper). Retrieved from http://www.sei-international.org/mediamanager/documents/Publications/SEI-WP-2013-09-Ethiopia-energy-access.pdf
- United Nations Department of Economic and Social Affairs (Population Division). (2015). World population prospects. Population Databases.
- United Nations Environment Programme. (2015). Gender equality and the environment - Policy and strategy.
- United Nations General Assembly. (2015). Transforming our world: The 2030 agenda for sustainable development. New York. doi:10.1007/s13398-014-0173-7.2
- United Nations Special Group for Economic and Social Affairs. (2015). Global sustainable development. New York.
- Vera, I., & Langlois, L. (2007). Energy indicators for sustainable development. Energy, 32(6), 875–882. doi: 10.1016/j.energy.2006.08.006
- Winkler, H., & Marquand, A. (2009). Changing development paths: From an energy-intensive to low-carbon economy in South Africa. Climate and Development, 1(1), 47–65. doi: 10.3763/cdev.2009.0003
- Wolde-Rufael, Y. (2006). Electricity consumption and economic growth: A time series experience for 17 African countries. Energy Policy, 34(10), 1106–1114. doi: 10.1016/j.enpol.2004.10.008
- World Resources Institute. (2017). What is an INDC? Retrieved from http://www.wri.org/indc-definition