
 ?Mathematical formulae have been encoded as MathML and are displayed in this HTML version using MathJax in order to improve their display. Uncheck the box to turn MathJax off. This feature requires Javascript. Click on a formula to zoom.
ABSTRACT
Information and services delivered through mobile phones, ‘m-services', have transformative potential to provide rural African farmers with important agro-meteorological information. However, a greater understanding is needed regarding the types of m-services available to farmers, how farmers access that information, and possible factors affecting m-service use. With a study of smallholder farming communities in central Kenya, we examine factors affecting the likelihood of Kenyan farmers’ adoption of m-services specifically related to agriculture and livestock information, buying and selling products, and alerts about agricultural or livestock activities. According to a survey of 577 farming households, 98% of respondents own a mobile phone. Approximately 25% use it to access information about agriculture and livestock, 23% access information about buying and selling products, and 18% receive alerts. Personal smartphone ownership increases the likelihood of m-services use (p < .001), as does membership in farmer organizations (p < .001). We find that age and income are not significantly related to m-service use, and we discuss this result in terms of intersections between smartphone ownership, gender, and education. Consistent with prior qualitative research, our quantitative results further support the need for m-services providers to design for basic or feature phone users for improved dissemination of agro-meteorological information.
1. Introduction
Lack of access to information and knowledge transfer can hamper agricultural production in rural farming communities in sub-Saharan Africa (SSA). Agricultural, market, and weather information is critical to agricultural productivity, especially for reducing uncertainty and risk associated with extreme weather events and disease (Baumüller, Citation2013). The dissemination of agro-meteorological information can improve livelihoods by reducing uncertainty and enable improved inputs and technology adoption (Hansen et al., Citation2007). Access to information through mobile phones and mobile internet can also help agriculturalists manage risk and reduce vulnerabilities to a changing climate (Baumüller, Citation2013).
Information communication technologies (ICTs) such as mobile phones are touted as digital platforms with transformative potential to reach many farmers at once across rural settings (Santosham & Lindsey, Citation2015; World Bank Group, Citation2018). Large-scale investment in ICT infrastructure has led to growth in telecommunications connectivity of unprecedented scale across Africa (World Bank Group, Citation2018). As the cost of mobile phones have fallen and connectivity has spread, phone ownership and internet access have become possible for populations in the continent's lowest-income areas (Wyche & Olson, Citation2018). With this uptake of mobile phones, users can subscribe to receive mobile phone-enabled services or ‘m-services’ to access agro-meteorological (Baumüller, Citation2013) and market information (Wyche & Steinfield, Citation2016).
M-services deliver electronic media content through mobile technologies and is an umbrella term that includes m-agri, m-commerce, m-banking or m-payments. M-services come in varied forms, including Short Message Service (SMS), Unstructured Supplementary Service Data (USSD), mobile applications (apps) and helplines. The difference between SMS and USSD protocol is that SMS is a text messaging service, whereas USSD protocol are in the form of ‘Quick Codes’. Depending on the electronic media m-services contain, they can be accessed by phones with and without internet access. M-services can be used to connect buyers to sellers, disseminate general information about farming and livestock (such as market information on prices), and send alerts on pest and disease threats (Baumüller, Citation2018). Some m-services are free to use or may require a cost to use advanced features, while others are entirely proprietary. For example, Ujuzi Kilimo in Kenya offers actionable recommendations to farmers through subscription-based SMS and USSD services.Footnote1
Whether m-services can improve agricultural livelihoods is a question facing scholars and development programmes focused on addressing rural livelihood vulnerability. Qiang et al. (Citation2012) showed that increased access to climate, crop disease, and market information via m-services improved farmers' production and profitability in Kenya. However, wealthier, educated, and typically urban populations have greater access and therefore benefit from m-services in comparison to rural, poorer populations, especially rural women (David et al., Citation2005; Porter et al., Citation2012; Wyche & Olson, Citation2018; Wyche et al., Citation2019). As a result of this limited access to information for some populations, scholars have questioned whether mobile-based market information can improve circulation of market prices and reduce information asymmetries between farmers and buyers. Srinivasan and Burrell (Citation2013) and Wyche and Steinfield (Citation2016) have detailed the underlying barriers to using mobile phones for accessing Market Information Systems (MIS). These barriers include, but are not limited to, cost of airtime, challenges with charging faulty and low-quality batteries, language, and literacy (Srinivasan & Burrell, Citation2013; Wyche & Steinfield, Citation2016).
However, in the literature on ICT use in SSA, far less attention has been placed on understanding the different types of information communicated via m-services, how farmers access that information, and possible factors affecting the likelihood of m-service use. Our study addresses these knowledge gaps by drawing on a sample of more than 500 smallholder farmers in rural central Kenya. We first identify who uses m-services, the types of m-services that survey respondents use, and how the m-services are used. We then assess the factors that affect the likelihood of m-service use by modelling the associations between individual-level characteristics and three classes of agricultural information available via m-services: farming information, buying and selling farming products, and alerts on farming activities. The latter helps us understand the underlying factors impeding m-services adoption. We then discuss the interactions between education, income, and gender with smartphone ownership; the important role that farmer organizations play in m-services adoption; and how developers of m-services can use this information to target unreached individuals.
2. Literature review
2.1. ICTs, adaptive capacity, and vulnerability
ICTs are often cast as technologies that can increase access to information and resources and connect individuals. Information disseminated via m-services are therefore seen as important tools for helping farmers adapt and to address vulnerability (Eakin et al., Citation2017), where vulnerability, per the IPCC (Citation2007) is ‘the degree to which an environmental or social system is susceptible to, and unable to cope with, adverse effects of climate change, including climate variability and extremes’ (p. 883). Vulnerability is often conceptualized as including three interlinking elements: exposure, sensitivity, and adaptive capacity (Adger, Citation2006). While exposure relates to the degree and type of the perturbation, adaptive capacity relates to the capacity of individuals or groups to manage and influence their resources and risks in the face of a perturbation (Waters & Adger, Citation2017). Both the degree of exposure and adaptive capacity shape a system's sensitivity to that perturbation. Many determinants of household-level adaptive capacity have been identified, which can relate to access to assets and resources (Moser, Citation1998). At the local level, one such determinant has been access to information resources and the ability of decision-makers to marshall the information (Fawcett et al., Citation2017; Smit & Wandel, Citation2006). Within this context, ICTs provide an efficient means to reach a growing user base and build adaptive capacity through enabling access to critical information and facilitating a process of learning (Eakin et al., Citation2017).
There is, however, contradictory evidence about how useful ICTs are or can be for addressing vulnerability, with some studies finding positive effects and others no impact. In a review of climate change adaptation and ICTs in the Caribbean and Latin America, Eakin et al. (Citation2017) suggest that ICTs support adaptation through increasing social capital, improving access to critical information for decision-making, and coordinating actors. Marenya and Barrett (Citation2007) found that lack of access to information, land, and credit, constrained natural resource management efforts and thus rendered smallholder farmers in western Kenya more vulnerable to climate variability. Similarly, researchers contended that in Laikipia county, Kenya, limited access to agro-meteorological information hampers adaptive capacity (Ogalleh et al., Citation2012; Wiesmann, Citation1998). Bryan et al. (Citation2009) came to similar conclusions that lack of access to information is a main barrier to adaptation among Ethiopian farmers. Specific to the impact of DrumNet, a phone-based MIS, Ogutu et al. (Citation2014) found a positive influence on labor productivity, seeds, fertilizers and land in three Kenyan provinces.
A growing body of literature criticizes ICTs for development programmes and provides evidence for why they do not work. In the domain of distributing market price information through MIS, Camacho and Conover (Citation2011) and Fafchamps and Minten (Citation2012) showed poor adoption of MIS and their lack of impact on agricultural outcomes. Following this work, Burrell and Oreglia (Citation2015) sought to better understand Ugandan and Chinese agriculturalists' decision-making processes and need for market price information. They suggested that using mobile phones to collect and distribute market information through MIS is of limited relevance since information about price is only one of several factors that aids decision-making (Burrell & Oreglia, Citation2015). Similarly, Srinivasan and Burrell (Citation2013) suggest that mobile phones should not be given an over-privileged role in seeking market price information. Finally, although there are many apps for agriculture in Kenya and SSA, it is still unclear how many people actually use them after initially subscribing and/or downloading them.
2.2. Adoption and utilization of M-services in Kenya
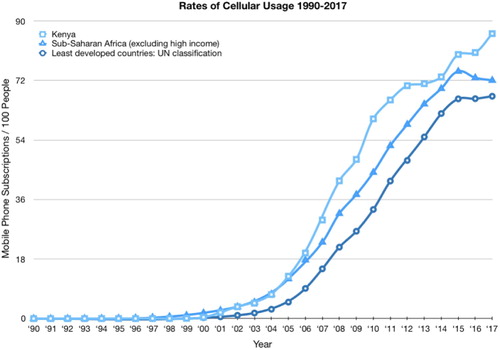
Adoption of mobile phones and m-services is attributed to several factors related to the local context. In Kenya, agriculture and livestock are key economic sectors and contribute to more than one-third of total gross domestic product (GDP) (Kenya Bureau of Statistics Economic Survey, Citation2017). The Communications Authority of Kenya (Citation2018) reports that as of March 2018, 95.1 % of the adult population had a mobile phone subscription and 42.9% percent had access to broadband internet. The growing affordability of internet access coincides with an impressive number of m-services available for Kenyan farmers to utilize. For instance, Twiga Foods connects horticultural farmers to buyers using a mobile-based buyer-to-buyer platform,Footnote2 and Mkulima Online, M-Farm, provides access to crop prices and connects buyers and sellers (Baumüller, Citation2013, Citation2015). The high adoption rates of mobile phones in Kenya compared to other sub-Saharan African countries, see , may be one factor for the multitude of m-services available.
Figure 1. Growth rate of cellular usage as defined by mobile phone subscriptions per 100 people between 1990–2017. Mobile phone subscriptions in Kenya appear higher than mobile phone subscriptions of least developed countries according to UN Classification and Sub-Saharan African countries excluding high income. Data accessed on 18 June 2019. Data source: World Bank. Source: International Telecommunication Union, World Telecommunication/ICT Development Report and database (Citation2018).
Given the ubiquity of mobile phone ownership in Kenya, ICTs may continue to have increased importance in the sphere of agricultural extension. The aim of agriculture extension is to provide services and advice to rural farmers and their families so they may maximize the resources made available to them (Katz & Barandun, Citation2002). Private extension services exist in Kenya in part due to the inefficiency of public extension, which was identified as a factor that impedes agricultural development and perhaps an explanation for low yields (Muyanga & Jayne, Citation2008). M-services can serve as a gap-filling mechanism for the agriculture extension system. While governments may provide their own m-services through websites and/or SMS or USSD services, partnerships with other sectors such as private companies, NGOs, and research institutions can help bolster farmer productivity and improve the limited capacity of government programmes (Caine et al., Citation2015; Donovan, Citation2017).
2.3. Factors that influence adoption and use of M-services
Factors that influence technology adoption and use are typically related to education level, age, and gender (Meso et al., Citation2005); however, cost may also pose a barrier to usage. Ogutu et al. (Citation2014) found a significant difference in average age between DrumNet participants and nonparticipants; however no difference in gender. Wyche and Steinfield (Citation2016) investigated factors that impede adoption of the m-service M-Farm in western Kenya. The majority of interviewees owned feature phones, and while participants could theoretically access M-Farm with those phones, they did not. Wyche and Steinfield (Citation2016) note a variety of barriers including limited amounts of phone credit which stifles SMS use, phone charging limits, phones with considerable wear and tear that prohibited use, as well as the perception that mobile phones are for voice communication rather than SMS-interaction.
After initial adoption of m-services, appropriate use of information requires having credible information and trusting in that information. Mittal et al. (Citation2010) found that farmers use mobile-enabled agricultural information when the information is timely, of good quality, and when they trust the information. For SMS information specifically, trust needs to be established: the recipient is unlikely to take SMS information coming from an unknown sender in the slurry of other spam SMS (Cheney, Citation2018; Crandall, Citation2012).
Research also suggests that individuals' perceptions are important determinants of individual technology use. Thiga and Ndungu (Citation2015), for example, identify lack of awareness as the primary reason why agriculture extension officers do not utilize ICTs in Kenya. Mobile applications in particular were the least utilized form of ICT among respondents (Thiga & Ndungu, Citation2015). Since agriculture extension officers provide outreach to farmer organizations such as agricultural and livestock cooperatives they are positioned to be agents of change and advancement within a community. However, in cases where the extension agents are not exhibiting high adoption or promotion of these useful services, farmers may benefit from information transfer through other routes such as mobile devices and their non-extension social networks.
3. Research methodology
3.1. Study area
Laikipia, Meru and Nyeri counties meet at the northern and western slopes of Mount Kenya in the semi-arid highlands of Kenya. We focus on 35 smallholder farming communities within the following sub-counties: Laikipia North and Laikipia East (Laikipia), Buuri, North and Central (Meru), and Kieni East (Nyeri). Many of the households are part of farmer organizations, which can be classified as farmer cooperatives, farmer groups, or local water resource governance groups called Community Water Projects (CWPs). In this study, we characterize farmer cooperatives and CWPs as formal organizations in comparison to farmer groups, which are informal organizations.
Farmer cooperatives are official, government-registered forms of collective action that are typically composed of smallholder farmers working together across a large area on agricultural production, sale of products, and opportunities to enter higher-value markets (Markelova et al., Citation2009; Narrod et al., Citation2009). They follow a formal structure of organization with written rules. One of the main benefits of farmer cooperative memberships is the reduction of transaction costs among smallholder agriculture producers who are often located in remote areas and have limited economic capacity to enter production systems (Markelova et al., Citation2009). In contrast to farmer cooperatives, farmer groups are informal and may not be officially registered with the government. Farmers either self-organize or are organized into groups by agricultural extension agents to facilitate trainings and knowledge exchange. Members in these informal organizations typically share information about best practices in agriculture. They may also collectively pool savings to help afford agricultural inputs or assist group members in times of need. Community Water Projects (CWPs) are a third type of farmer organization. CWPs use formal institutions where members officially meet and interact with each other on a weekly to monthly basis to attend meetings, maintain irrigation infrastructures, and access irrigation water resources. To become a CWP member, farmers typically pay a joining fee to connect to irrigation water via piped networks from rivers off Mount Kenya, as well as monthly maintenance fees.
3.2. Data collection
A team of eight Kenyan enumerators conducted the household survey using Qualtrics software between June and July 2018 (Qualtrics, Citation2019). The multilingual team of six women and two men conducted the survey in Kiswahili, Kikuyu, or Kimeru, depending on the respondent's background. We interviewed 605 respondents; however 577 responses were used for the study. We removed respondents who either did not indicate farming as their primary occupation, were flagged by enumerators as giving incomplete answers, or refused to answer or did not know their level of education attained. Respondents were not compensated for their participation in the study. See Supplementary Info (S.I.) for more information on survey methodology.
The households selected for the study are a representative sample of households that receive water from CWPs. Additionally, our sample is not representative of all Kenyan smallholders. These households were selected as part of a five-year multi-institutional research project conducted in the region (Lopus et al., Citation2017; McCord et al., Citation2017). The five-year study assesses agronomic decision-making of irrigated (CWPs) and non-irrigated households in Laikipia, Meru and Nyeri counties. At the start of the project, we used a randomized sampling approach of farmers within CWPs. As the project expanded, we gathered longitudinal data as well as data from non-CWP members because we could not get in contact with everyone who had previously been sampled. Thus, we augmented our dataset with the help of local guides and selected neighbouring households within the communities. Respondents were either the head of household or spouse of the household head.
The survey took 90 min on average and covered a range of topics including agricultural management, perceptions of rainfall and climate change, use of weather and climate services, use and barriers to use of ICTs, migration, and household socio-demographics. The ICT module was administered about halfway through the survey and took approximately 20 min. The ICT module followed the design of the U.S. Agency for International Development's (USAID) toolkit on gender and ICT (Highet et al., Citation2017) and comprised of three parts: demographics, access and use of ICTs, and mobile farming use.
The USAID practical toolkit offers quantitative and qualitative methods for data collection on access, usage, barriers and perceptions of ICTs such as mobile phones, radios and other internet-enabled devices. We selected and modified questions from the toolkit and we pre-tested the questions in three pilot interviews. Additionally, we used a four-day enumerator training session to refine the questionnaire; however, no major corrections were made. Our analysis focuses on use and non-use of three m-services, which was determined by the responses to the question: ‘During the last growing season, did you use your mobile phone to access any of the following services for your agricultural/livestock management? (e.g. includes Facebook, Mkulima Bora, WhatsApp, M-Farm through SMS, apps such as Mkulima Bora)’. Respondents then answered ‘yes’ or ‘no’ to the following m-services: Accessing farming (either livestock or agriculture) information, buying and selling agricultural or livestock products, and receiving important information or alerts on agriculture/livestock activities. We also asked respondents to provide the names of agricultural, livestock, or weather services apps accessed through their phones during the last growing season and included these summarized open-ended responses in the S.I.
4. Data analysis
4.1. Description of variables
We selected three m-services as our dependent variables: farming and livestock information, buying and selling products, and alerts on agricultural or livestock activities. For brevity we refer to these as farming, buying and selling, and alerts, respectively. The following explanatory variables were taken from the household survey and grouped into the following categories (). We note the theorized effect of the explanatory variables on the dependent variables in .
Table 1. Summary statistics of outcome variables and demographic characteristics of respondents.
Table 2. Hypothesized relationships with m-services adoption.
Personal Smartphone: We asked the farmer whether their mobile phone had access to the internet and the ability to download apps. If the farmer responded ‘yes’ to both of those attributes, we classified them as owning a ‘smartphone’ (i.e. a handset able to access the internet and download apps). We compared these to owners of non-smartphone phones which include basic and feature phones. ‘Basic’ phones (mulika mwizi in Kiswahili) cannot download apps or access the internet. ‘Feature’ phones are able to access the internet because they come pre-loaded with applications such as Facebook or Twitter but they do not have the ability to download apps. An example of a basic phone available for purchase in Kenya is Nokia 1110, whereas a feature phone pre-loaded with Facebook is Tecno T351. If respondents had more than one phone, we asked about their primary handset, i.e. the one used most often.
Membership in Farmer Organizations: We recorded membership in three types of farmer organizations (agricultural cooperatives, farmer groups, and Community Water Projects), and combined the responses to reflect the total number of farmer organization types (0–3) for which a farmer is a member.
Farm Size: Respondent provided the areas of their land under production and fallow, in acres, during the March–April–May 2018 growing season. We combined these two areas to get total farm size.
Livestock Assets: We asked the respondent to count the number of livestock owned by the household from a list of common animals including cattle, goats and sheep. We subsequently used a weighted formula to convert this livestock count to Tropical Livestock Units (TLU) (Jahnke, Citation1982).
Income: We asked the respondent to select household monthly income from a selection of ranges (none, 100–2000 ksh, 2001–6000 ksh, 6001–18,000 ksh, 18,001–36,000 ksh, 36,001–54,000 ksh, 54,001–72,000 ksh, or more than 72,000 ksh) from the following sources: casual labor, regular salary, small business, charcoal sales, horticulture, sale of forest products, livestock, remittances, rental income, pension, and savings group. We computed the income variables in multiple ways which produced similar results (see S.I.) and ultimately selected the median value from those ranges. We summed the median values of the various incomes to estimate monthly income in Kenya shillings. We reduced the number of income categories by computing quartile incomes: , 50% 55,000 ksh,
.
Assets: We used a simple index reflecting household ownership of a television, car, motorcycle, and/or computer (including tablets). We added the ownership values together and treated the sum as a continuous variable (0–4). However, because only four households owned all four assets, we combined those households with the households who owned three of the four assets (0–3).
Age: We asked for the respondent's year of birth and then calculated their age relative to the year 2018.
Education: Kenya follows the 8–4–4 educational system with eight years in primary school, four years in secondary, and four years of university or vocational training. We asked for the highest level of education completed by the respondent. The options were coded as follows: No formal education or some primary (level ; reference), Completed primary or some secondary (2), Completed secondary or some post-secondary (3), Completed post-secondary or vocational training (4).
County: Farmers were located in one of three counties: Laikipia, Meru, or Nyeri. We created dummy variables for Meru and Nyeri residents with Laikipia as the reference category.
Gender: Men were the reference category (coded as 0).
4.2. Logistic regression analysis to identify drivers of M-service adoption
We used a binary logistic Generalized Linear Model (GLM) to test the likelihood that a respondent adopts various m-services. We estimated the odds ratio (OR) for each dichotomous dependent variable: use or non-use of weather information, information about agriculture and livestock, or important alerts on agriculture and livestock activities.
Because several farmers were part of the same water governance groups or farmer organizations, household-level data were not fully independent. Therefore, we also ran the regressions using a Generalized Linear Mixed Effects Model (GLMM) to account for possible overdispersion and clustering by requiring a group factor. Random effects modelled the correlation between the groups using community subsets called Water Resource User Associations (WRUAs) as the group factor. For more information regarding the treatment of WRUAs and grouping variables in the GLMM, see our Methodological Appendix (S.I.). To test for the difference between the models with and without random effects, we used a nested ANOVA model comparison. We determined to proceed in using the GLM without random effects because the Aikake information criterion (AIC) values were lower for the GLMs compared to the GLMMs.
We cleaned data and developed the model specification using Python programming language (Python Software Foundation, Citation2019). The logistic regression analysis was completed using the lmer function in the lme4 library in R (Bates et al., Citation2015).
5. Results
5.1. Descriptive statistics
We begin by compiling the rates of phone ownership (smartphone, feature phone, basic phone) by gender to identify the extent to which lack of access to internet-enabled phones could underlie gender-based differences in the use of m-services in . Approximately 34 % of respondents own a smartphone: a greater proportion of men own smartphones compared to women. Basic phones are owned by 56% of women compared to 48% of men. Considering that access to a smartphone is meaningful for m-services access, we investigated differences in age, education, and membership in farmer organizations between smartphone owners and non-owners, as shown in . The average education and number of farmer organizations is greater for smartphone owners compared to non-owners. The variance of those statistics is similar between smartphone owners and non-owners.
Table 3. Types of handset owned by respondent.
Table 4. Descriptive statistics of smartphone non-owners and owners membership in farmer organizations, age, and education.
To help discern whether education, age, and membership in farmer organizations influences access to m-services we compare differences in these socioeconomic factors between men and women m-services users and non-users. As shown in , the average age and education level is lower for female m-services users than male. Similarly, women are on average members of fewer farmer organizations. The variances of those statistics are generally similar between men and women. We use these differences between men and women to contextualize the importance of these socioeconomic factors in governing m-service use, despite them not always being significant in the logistic regression models.
Table 5. Summary statistics of m-services users and non-users by gender.
5.2. Logistic regression results
5.2.1. Smartphone ownership
Personal smartphone ownership, defined as owning a handset with access to internet and ability to download apps, increases the likelihood of m-services use in all three models as shown in . Smartphone owners are between 1.83 and 2.72 times as likely as non-smartphone owners to use m-services (p < .05 for buying and selling and p < .001 for farming, and alerts).
Table 6. Predictors of use of farm/livestock information, to buy or sell agricultural produce or livestock, and alerts m-services.
5.2.2. Farmer organizations
We find that membership in farmer organizations positively influenced m-service use. As shown in , respondents in farmer organizations are 1.64–2.06 times more likely than non-members to use m-services across the three types of farmer organizations, which include farmer cooperatives, informal farmer groups, and Community Water Projects (). When disaggregating by farmer organization type in our results show that members of informal farmer groups are between 1.82 and 2.87 times more likely to use farming (p < .01), buying and selling (p < .01), and alerts (p < .001) m-services. However members of agricultural cooperatives are only more likely to use m-services for obtaining farming information (p < .01). Members of CWPs are only more likely to use m-services for accessing information about buying and selling (p < .001).
Table 7. Model results which separates farmer organizations into farmer groups, agricultural cooperatives, and Community Water Projects (CWPs).
5.2.3. Wealth, gender and socioeconomic factors
Household-level characteristics, such as household assets and livestock assets, and individual-level characteristics such as education are also associated with m-service use. After accounting for whether a respondent owns a smartphone, we do not find age or farm size to be significantly related with m-service use any model iterations (p>.1, Tables and ). Income is significantly related to one m-service use in Tables and in the highest income quartile only. Other measures of wealth are livestock assets (TLU), household assets, and the interaction between assets and TLU. Household and livestock assets are both significantly associated with likelihood of using m-services. Household assets are significantly associated with alerts m-services (p < .01) while livestock assets are significantly associated with all three models in and buying and selling and alerts m-services in . Although the coefficients on livestock assets and household assets were less than one, the interaction term was greater than one, pointing to a complex relationship between various forms of wealth and the adoption of m-services. As described in our Methodological Appendix (S.I.), the results presented here are largely consistent with results of other iterations of the models, which controlled for interactions between wealth variables, including smartphone ownership. Additionally, in one iteration of the model, we replaced farm size as a proxy for income. We did not find any statistical significance for farm size or income.
We find some levels of educational attainment to be significantly correlated with m-service use in . Compared with the reference educational level, respondents who completed primary school or some secondary school were 3.16 and 4.55 times as likely to use farming and alerts m-services (p < .01). Similarly, respondents who completed secondary or some post-secondary school were 3.46 and 3.53 times more likely than the reference group to use farming and alerts m-services (p < .01 and p < .05 , respectively). Respondents who completed post-secondary school or vocational training were 2.58 times more likely than the reference group to use farming m-services (p < .05). The results in are similar for those education levels.
The coefficient on being a male respondent is positive in all iterations of the models (Tables , ). In the models that do not distinguish between farmer organization types, , the association between gender and m-service use is significant for buying and selling m-services (p < .01) and alerts (p < .001). Men are 1.20 and 1.35 times more likely to use m-services for buying and selling and alerts.
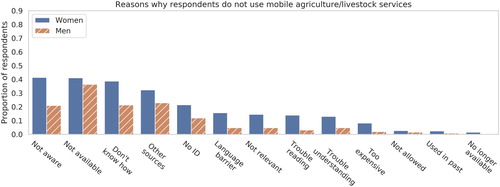
We asked respondents who did not select use of m-services for accessing farming and livestock information to respond to a list that describes barriers preventing their use of m-services as shown in . Compared to men, a greater proportion of women perceive barriers to mobile agriculture/livestock services across all of the categories. However, irrespective of gender, the foremost barriers limiting use of m-services are lack of awareness, lack of availability, and lack of understanding about how m-services work. Of these three categories, women are less aware and knowledgeable about how to use m-services compared to men.
Figure 2. Bar plot showing barriers to m-service use by gender. We elicited specific reasons for farmers' non-use of mobile service in response to the question: ‘What are the reasons why you don't access information about farming (either livestock or agriculture): I'm not aware of these services; These types of services are not available in my area/on my network; I don't know how to use these types of services; I get my information from other sources (e.g. my community); My phone has no internet; I do not have an ID or required documents; The content is not in a language I understand; The content isn't relevant to me; I have trouble reading the content; I have trouble understanding the content; They are too expensive; My family doesn't allow it; I've used it in the past but did not find it useful and/or did not like using it; I've used it in the past but it is no longer available.
6. Discussion
6.1. The role of smartphones in M-services use
We find smartphone ownership to be a significant factor in m-services use. However, smartphone ownership across our study site is far from ubiquitous with 31% ownership for women and 38% ownership for men (). GSMA (Citation2016) estimates 226 million smartphone connections exist in Africa, approximately a quarter of all connections, and is reflected most strongly in established mobile markets including Kenya, Egypt, Nigeria, and South Africa. Thus, compared to the rates of smartphone adoption in east Africa (17% of the population in 2015) (GSMA, Citation2016), smartphone ownership is relatively high among survey respondents. The prevalence of smartphone ownership as a predictor of m-service use may be due to the nature of how m-services tend to be designed: technology developers generally design for smartphones rather than basic or feature phones (Cheney, Citation2018; Wyche & Murphy, Citation2012). Our results indicate that m-services, created by developers and designers focused on smartphone applications, have indeed reached the segments of the population who own smartphones. Considering that the majority of respondents own basic or feature phones (as shown in ), m-services designed for smartphone-based applications may be failing low-income and basic phone-owning subscribers.
As suggested by several previous studies (e.g. Wyche & Murphy, Citation2012; Wyche et al., Citation2019; Wyche & Steinfield, Citation2016), designing m-services with the needs of basic phone users in mind is a clear way to expand accessibility of m-services beyond smartphone users. Developers need not only to design for basic phones but also the constraints commonly experienced in developing countries. After relating barriers of basic phone use to lack of airtime credit, exhausted batteries, difficulty charging and lack of capital to upgrade to a smartphone, Wyche and Murphy (Citation2012) provide an alternative design vision given the challenges faced by rural and often unconnected agriculturalists in Kenya. They suggest that mobile phone designers and developers assume off-grid use with unreliable electricity sources for agriculturalists in rural and peri-urban Kenya (Wyche & Murphy, Citation2012). Lastly, another consideration is to focus on USSD protocol and voice call services aimed for widely spread simple and cheap phones rather than power-intensive functionalities of smartphones which are not ubiquitously used (Wyche & Murphy, Citation2012). These intersections need to be addressed by ICT for development programmes – such as those described in the USAID toolkit used for survey collection – for proper information dissemination.
6.2. Membership in farmer organizations increases likelihood of M-service use
Membership in informal farmer groups increased the likelihood of m-services use across all types of m-service use in comparison to formal farmer organizations (e.g. farmer cooperatives and CWPs). Unlike formal farmer cooperatives or the CWPs, informal farmer organizations are free to join. Yet, one benefit of paying to join an agricultural cooperative or CWP is access to information services and networks provided by these organizations. In other words, these types of formal organizations provide a ‘club good’ version of agricultural information (i.e. information exclusively available to members of an organization) (McNutt, Citation1999). Members gain exclusive access to and benefit from agricultural information at the price of paying a monthly membership fee to belong to these organizations.
Contrary to formal agricultural information, members of informal farming groups may make greater use of publicly-available agricultural information, which is a ‘public good’ (i.e. where an individual's use of information available to the public does not diminish others’ use of the same information) (McNutt, Citation1999). Most m-services platforms do not require an explicit joining fee to access information and are therefore offering agriculture information as a publicly available good. Thus, we would expect that farmers in informal farming groups would have a greater incentive to use and seek out m-services agriculture information that they can freely access without having to pay the types of membership fees required of formal farmer organizations.
Farmers with membership in agricultural cooperatives or CWPs were significantly more likely to use only one type of m-service. Farmers in cooperatives already benefit from exclusive information and alerts that are embedded in their membership to a cooperative and the facilitated access to extension services. Thus, we would not expect these farmers to make substantive use of freely available m-services information. Rather than using the buying and selling function of m-services, farmers in formal cooperatives are likely already benefiting from their farmer cooperative membership with greater access to opportunities for marketing and buying and selling their products in higher-value markets (Markelova & Mwangi, Citation2010; Narrod et al., Citation2009). Similarly, farmers with CWP membership are likely to access agricultural information as an additional benefit to the primary benefit of obtaining water. In Kenyan CWPs, members interact on a weekly to monthly basis through labour activities for maintaining irrigation infrastructures and to attend meetings regarding irrigated water resources management. These activities would likely offer both informal and formal opportunities to obtain agricultural information. As with agricultural cooperatives, CWP membership likely provides access to exclusive agricultural information, and thereby reduces the incentive to access additional agricultural information via m-services.
By framing agricultural information access in the context of club and public goods, we can explain why farmers in informal farmer organizations are more likely to use m-services across all use types in comparison to those farmers belonging to agricultural cooperatives or CWPs. We conclude that membership in informal farmer groups is a strong predictor of m-services use due to their greater incentive to use publicly-available m-services compared to their agricultural cooperative and CWP counterparts, who inherently already have access to these types of services via cooperative or CWP membership. We discuss endogeneity challenges related to farmer organizations and related explanatatory variables in the S.I.
6.3. Wealth indicators and education
The non-significant results for income and farm size, along with the ubiquity of mobile phones among respondents, point to the maturity of phone ownership in the study area relative to income. In earlier phases of mobile phone adoptions, higher income levels were associated with phone ownership, but over time, mobile phones have become accessible to even low-income households, as indicated by the 98% ownership of mobile phones among survey participants. However this ubiquity in phone ownership of all types does not represent a ubiquity of smartphone ownership, which is associated with higher incomes.
Although mobile phone ownership and use have been expanding across communities and throughout Kenya irrespective of wealth, smartphone ownership is the factor that separates the wealthy from the poor in m-service use. Moreover, smartphones open access to potentially the most comprehensive and/or useful m-services which are applications and/or internet-based platforms. Since Kenya is on the forefront of ICT use and mobile phone ownership compared to other countries in the region (see ), our results can serve as a model for future trajectories of development regarding use of mobile phones for climate and agriculture information. While these wealth indicators are non-significant across our models, we recognize that cost is still a major barrier to farmers using phones as much as they would like (see S.I.). We cannot conclude that access to smartphones means that farmers are using the internet. However given that purchasing airtime credit and/or data bundles is the chief reason why respondents do not use their phones (of any type) as much as they would like, we can infer that across all phone types, cost is still the greatest inhibitor of mobile phones and m-services use.
Educational attainment is an important factor in determining m-service use. The differences in average education level and age in m-service use for women, and to a lesser extent, men () point at the importance of these socioeconomic factors in governing m-service use, despite them not always being significant in the models. While age does not significantly affect the likelihood of m-service use in our models, we do find that the average age of women using m-services is younger than those women who do not (), and the education level of those using m-services across both genders is higher than those who do not use m-services ().
6.4. Gendered barriers to M-service use
The previously described intersections between gender and wealth, smartphone ownership, and education affect m-service use in complex ways. At the household level, men's and women's roles on Kenyan farms are different, and therefore levels of agricultural decision-making may vary depending on gender roles when men are head of household. Braimok (Citation2017) found in some cases that in the presence of a male head, female Kenyan dairy farmers did not perceive themselves as making or finalizing choices.
A variety of reasons govern these gendered barriers in use. Santosham and Lindsey (Citation2015) concluded that cost is the greatest barrier to ownership and usage of mobile phones for women, due to their reduced financial independence compared to men. Although mobile phone use is nearly ubiquitous in our study site for both men and women, the increased costs associated with smartphone ownership and use present a potential barrier to women's ownership of smartphones, which may explain why women lag behind men in smartphone ownership (). Wyche and Olson (Citation2018) found that mobile use and therefore m-service access among rural women remains limited due to technical literacy, mobile phone conditions, perceptions of the Internet, time required to learn how to use the Internet, and seasonal income fluctuations.
7. Implications for future M-services in Kenya
Membership in farmer organizations, the relative cost to own a smartphone, and smartphone usability are important considerations of future access to mobile agricultural services in Kenya. Although smartphone ownership is a driver of m-service use and smartphones are more expensive and difficult to use (Wyche & Steinfield, Citation2016), Karlsson et al. (Citation2017) show that increasingly affordable smartphones are on the rise and commercially sound. African consumers can now purchase the affordable Mara X phone, which is designed in partnership with Google and fully manufactured in RwandaFootnote3 as well as Chinese designed smartphones that are expected to become more prevalent among African phone markets.Footnote4
Beyond affordability, however, and from a supply point of view, m-services are not typically designed for low income, rural, and less educated groups, such as women, who use basic phones (Santosham & Lindsey, Citation2015; Wyche & Olson, Citation2018). Our quantitative findings corroborate previous qualitative studies and show that women were less likely to use m-services in comparison to men and that m-service users had higher levels of income and educational attainment. Increasing m-service use involves addressing both smartphone affordability and designing m-services for audiences with lower technological literacies.
Our study introduces additional novel findings that demonstrate linkages between adoption rates and the role of informal and formal farmer groups. Membership in increased numbers of farmer organization – formal or informal – was a significant predictor of m-service use. However, farmers not part of formal agriculture groups, such as agricultural cooperatives and water governance groups were more likely to use m-services than farmers who were involved in informal farmer groups. Understanding that not all m-service users are embedded in formal agricultural groups is important for m-service design. Specifically, agricultural information shared amongst farmers in formal groups may be different than the m-services information accessed by farmers in informal groups. Overall, dissemination of meaningful and useful agro-meterological information via m-services requires consideration of the types of individuals that are currently accessing m-service information.
8. Conclusions
We investigated factors that influence farmer use of agriculture information from mobile phones, specifically m-services. While much of the literature in academic and government spheres stress the importance of age, location and education in defining the digital gender gap, our results highlight additional drivers of m-services use including participation in farmer organizations, higher-levels of education, and smartphone ownership. Each of these factors interacts with gender to highlight the disproportionate access of these services by women. Our results show that age and income are not significantly related to farmer use of mobile phone services; however smartphone ownership is a metric of individual wealth and assets that is significantly related to m-service use.
The prevalence of smartphone ownership across our models point to the trend that m-services are increasingly designed for advanced mobile phone features. Thus, we suggest that m-services providers design for the user, which is predominantly a basic or feature phone owner in the case of rural Kenyan farmers. Additionally, while rates of mobile phone ownership in Kenya are high, smartphone ownership is not as widespread. Although phones have been expanding through rural communities, smartphones are the item that separates the wealthier from the poorer. Smartphones can give farmers access to potentially the most useful of climate and agriculture related m-services. Mobile phones and other ICTs will continue to play important roles in managing risks and vulnerabilities associated with a changing climate (Eakin et al., Citation2017). Efforts in the climate adaptation policy space should address the general affordability of m-services and mobile phones, and better target under-served groups of users, particularly women and those not belonging to farmer organizations to improve efficient and targeted dissemination of agro-meteorological information services.
Supplemental Material
Download MS Word (1.6 MB)Acknowledgements
The authors are grateful for all the farmers who participated in our survey in Kenya, the Mpala Research Centre in Laikipia, Kenya for facilitating the implementation of the survey, and G. Githaiga for her initial feedback on the survey questions. The U.C. Santa Barbara Statistical Consulting Laboratory provided guidance on the logistic regression statistical analysis. The Institutional Review Board (IRB) at U.C. Santa Barbara granted ethical clearance for the study.
Disclosure statement
No potential conflict of interest was reported by the author(s).
Additional information
Funding
Notes on contributors
N. T. Krell
N. T. Krell is a PhD candidate in the Department of Geography at the University of California, Santa Barbara. Her research interests broadly cover impacts of climate variability on smallholder farmers in eastern and southern Africa. She couples social and biophysical datasets to address questions related to farmer decision-making and climate variability. She is interested in farmers’ access to agricultural information through mobile technology, and specifically investigates how women and disadvantaged farmers integrate technology in improving their livelihoods. She was awarded a U.S. Department of State Fulbright research fellowship to Kenya in 2017 to investigate farmers’ strategies for climate adaptation. For nine months in 2018 she conducted fieldwork in the Mount Kenya region to understand, in part, farmer use of mobile phones for agricultural management.
S. A. Giroux
S. A. Giroux is an associate research scientist at Indiana University, where she is part of an interdisciplinary research team focused on sustainable food systems dynamics. She has a wide range of experience developing and carrying out research projects that use both qualitative and quantitative methods. Current research projects include cross-cultural investigations of farmer adaptation to climate change, social networks and food provisioning, and urban food security in sub-Saharan Africa. She holds a PhD in anthropology from the University of Florida, with an emphasis in research methods.
Z. Guido
Z. Guido is a research scientist at the University of Arizona’s Institute of the Environment and School of Natural Resources and Environment. Zack’s research focuses on understanding the impacts of climate variability and change on environmental resources including water and food; understanding vulnerability and how people adapt to and cope with the climate; and the role of weather and climate services in decision-making. Zack has active research projects in the U.S. Southwest, Caribbean, and Africa.
C. Hannah
C. Hannah is a Postdoctoral Research Associate in the School of Geography and Development the University of Arizona, where she works on a suite of research topics related to food systems, environmental governance, impacts of climate change on small-scale land holders, household-level decision-making, and rural-urban food security in sub-Saharan Africa. She holds a PhD in Environmental Science and Policy from the Nicholas School of the Environment at Duke University, where her dissertation topic focused on the collective governance of irrigation systems in Tajikistan.
S. E. Lopus
S. E. Lopus is an assistant professor in Cal Poly’s Department of Social Sciences. A demographer by training, she studies factors that influence decisions across the life course such as when and whom to marry, whether to migrate, and how much to invest in co-residing children. In addition to her work as a family scholar, she also performs research at the intersection of population, environment, and agriculture. Sara has extensive experience conducting fieldwork in East Africa, particularly in rural Mozambique.
K. K. Caylor
K. K. Caylor is Director of the Earth Research Institute and a Full Professor with appointments in the Bren School of Environmental Science & Management and the Department of Geography at UCSB. He received his PhD in Environmental Sciences from the University of Virginia, in 2003. His research seeks to develop improved insight into the way that land use and climate change are interacting to affect the dynamics and resilience of global drylands. His primary research sites are in sub-Saharan Africa, where he is focused on understanding the vulnerability of pastoral and subsistence agricultural communities to current and future changes in hydrological dynamics. A major focus of his current research efforts is the dynamics of coupled natural-human smallholder agricultural systems and deployment of low-cost cellular-based environmental sensors for improved monitoring of agriculture and ecosystem function in the developing world.
T. P. Evans
T. P. Tom Evans is a professor in the School of Geography and Development at University of Arizona. His work focuses on climate impacts and adaptation in smallholder agroecosystems and urban food systems in Sub-Saharan Africa. Recent projects have investigated the spatial and temporal characteristics of drought events in Zambia and Kenya and the mechanisms utilized by farmers in rainfed and irrigated systems to mitigate those impacts. This work involves investigation of household level decision-making dynamics, institutional analysis/environmental governance, and integration of social-environmental data. Newer work is investigating the teleconnections between rural food production and urban food security through analysis of urban food systems.
Notes
References
- Adger, W. N. (2006). Vulnerability. Global Environmental Change, 16(3), 268–281. https://doi.org/10.1016/j.gloenvcha.2006.02.006
- Appelbaum, S. H. (1990). Computerphobia: Training managers to reduce the fears and love the machines. Industrial and Commercial Training, 22(6). https://doi.org/10.1108/00197859010143165
- Bates, D., Mächler, M., Bolker, B., & Walker, S. (2015). Fitting linear mixed-effects models using LME4. Journal of Statistical Software, 67(1), 1–48. https://doi.org/10.18637/jss.v067.i01
- Baumüller, H. (2013). Mobile technology trends and their potential for agricultural development (ZEF Working Paper 123).
- Baumüller, H. (2015). Assessing the role of mobile phones in offering price information and market linkages: The case of M-Farm in Kenya. The Electronic Journal of Information Systems in Developing Countries, 68(1), 1–16. https://doi.org/10.1002/(ISSN)1681-4835 doi: 10.1002/j.1681-4835.2015.tb00492.x
- Baumüller, H. (2018). The little we know: An exploratory literature review on the utility of mobile phone-enabled services for smallholder farmers. Journal of International Development, 30(1), 134–154. https://doi.org/10.1002/jid.v30.1 doi: 10.1002/jid.3314
- Braimok, T. (2017). Exploring the opportunities and challenges of ICTs for women farmers in Kenya [Unpublished master's thesis]. Swedish University of Agricultural Sciences.
- Bryan, E., Deressa, T. T., Gbetibouo, G. A., & Ringler, C. (2009). Adaptation to climate change in Ethiopia and South Africa: Options and constraints. Environmental Science & Policy, 12(4), 413–426. https://doi.org/10.1016/j.envsci.2008.11.002
- Burrell, J., & Oreglia, E. (2015). The myth of market price information: Mobile phones and the application of economic knowledge in ICTD. Economy and Society, 44(2), 271–292. https://doi.org/10.1080/03085147.2015.1013742
- Caine, A., Dorward, P., Clarkson, G., Evans, N., Canales, C., & Stern, D. (2015). Review of mbbile applications that involve the use of weather and climate information: Their use and potential for smallholder farmers. (CCAFS Working Paper no. 150, Tech. Rep.). CGIAR Reserch Program on Climate Change, Agriculture and Food Security (CCAFS). www.ccafs.cgiar.org.
- Camacho, A., & Conover, E. (2011). Manipulation of social program eligibility. American Economic Journal: Economic Policy, 3(2), 41–65. https://doi.org/10.1257/pol.3.2.41
- Cheney, C. (2018). Want to reach the world's poorest? design for dumb phones. https://www.devex.com/news/want-to-reach-the-world-s-poorest-design-for-dumb-phones-90993.
- Communications Authority of Kenya (2018). Third quarterly sector statistics report for the financial year 2017/2018 (1st January–31st March 2018) (Tech. Rep.). Communications Authority of Kenya.
- Crandall, A. (2012). Kenyan farmers' use of cell phones: Calling preferred over SMS. Proceedings of M4D 2012 28-29 February 2012 New Delhi, India 28 (29) 119.
- David, S., Nigel, S., Christopher, G., Jain, R., & Ophelia, M. (2005). The economic impact of telecommunications on rural livelihoods and poverty reduction: A study of rural communities in India (Gujarat), Mozambique and Tanzania (IIMA Working Papers WP2005-11-04).
- Donovan, K. (2017). Anytime, anywhere: Mobile devices and services and their impact on agriculture and rural development. In ICT in agriculture (Updated Edition): Connecting smallholders to knowledge, networks, and institutions (pp. 49–70). https://doi.org/10.1596/978-1-4648-1002-2_Module3.
- Eakin, H., Wightman, P. M., Hsu, D., Gil Ramón, V. R., Fuentes-Contreras, E., Cox, M. P., Hyman, T.-A. N., Pacas, C., Borraz, F., González-Brambila, C., Ponce de León Barido, D., & Kammen, D. M. (2015). Information and communication technologies and climate change adaptation in Latin America and the Caribbean: A framework for action. Climate and Development, 7(3), 208–222. https://doi.org/10.1080/17565529.2014.951021
- Fafchamps, M., & Minten, B. (2012). Impact of SMS-based agricultural information on Indian farmers. The World Bank Economic Review, 26(3), 383–414. https://doi.org/10.1093/wber/lhr056
- Fawcett, D., Pearce, T., Ford, J. D., & Archer, L. (2017). Operationalizing longitudinal approaches to climate change vulnerability assessment. Global Environmental Change, 45, 79–88. https://doi.org/10.1016/j.gloenvcha.2017.05.002
- Feder, G., Just, R. E., & Zilberman, D. (1985). Adoption of agricultural innovations in developing countries: A survey. Economic Development and Cultural Change, 33(2), 255–298. https://doi.org/10.1086/451461
- Feder, G., & Umali, D. L. (1993). The adoption of agricultural innovations: A review. Technological Forecasting and Social Change, 43(3–4), 215–239. https://doi.org/10.1016/0040-1625(93)90053-A
- Fischer, E., & Qaim, M. (2012). Linking smallholders to markets: Determinants and impacts of farmer collective action in Kenya. World Development, 40(6), 1255–1268. https://doi.org/10.1016/j.worlddev.2011.11.018
- Gefen, D., & Straub, D. W. (1997). Gender differences in the perception and use of e-mail: An extension to the technology acceptance model. MIS Quarterly, 21(4), 389–400. https://doi.org/10.2307/249720
- GSMA (2016). The mobile economy. Africa 2016 (Tech. Rep.).
- Hansen, J. W., Baethgen, W. E., Osgood, D. E., Ceccato, P. N., & Ngugi, R. K. (2007). Innovations in climate risk management: Protecting and building rural livelihoods in a variable and changing climate. Journal of Semi-Arid Tropical Agricultural Research, 4. https://doi.org/10.7916/D8ZW1S4C
- Highet, C., Skelly, H., & Tyers, A. (2017, October). Gender and information technology (ICT) survey toolkit (Tech. Rep.). USAID.
- IPCC (2007). Climate change 2007: Impacts, adaptation and vulnerability: Contribution of working group ii to the fourth assessment report of the IPCC (Vol. 4). Cambridge University Press.
- International Telecommunication Union, World Telecommunication/ICT Development Report and database (2018). Mobile cellular subscriptions (per 100 people) [Data file]. https://data.worldbank.org/indicator/IT.CEL.SETS.P2
- Jahnke, H. E. (1982). Livestock production systems and livestock development in tropical Africa (Vol. 35). Kieler Wissenschaftsverlag Vauk.
- Karlsson, M., Penteniari, G., & Croxson, H. (2017). Accelerating affordable smartphone ownership in emerging markets (Tech. Rep.). GSMA.
- Kassie, M., Jaleta, M., Shiferaw, B., Mmbando, F., & Mekuria, M. (2013). Adoption of interrelated sustainable agricultural practices in smallholder systems: Evidence from rural Tanzania. Technological Forecasting and Social Change, 80(3), 525–540. https://doi.org/10.1016/j.techfore.2012.08.007
- Katz, E., & Barandun, A. (2002). Innovative approaches to financing extension for agriculture and natural resource management. LBL, Swiss Center for Agricultural Extension.
- Kebede, Y. (1992). Risk taking behaviour and new technologies: The case of producers in the central highlands of Ethiopia. Quarterly Journal of International Agriculture, 31, 269–269.
- Kenya Bureau of Statistics Economic Survey (2017). Economic survey 2017 (Tech. Rep.). National Bureau of Statistics.
- Lopus, S., McCord, P., Gower, D., & Evans, T. (2017). Drivers of farmer satisfaction with small-scale irrigation systems. Applied Geography, 89, 77–86. https://doi.org/10.1016/j.apgeog.2017.10.004
- Marenya, P. P., & Barrett, C. B. (2007). Household-level determinants of adoption of improved natural resources management practices among smallholder farmers in western Kenya. Food Policy, 32(4), 515–536. https://doi.org/10.1016/j.foodpol.2006.10.002
- Markelova, H., Meinzen-Dick, R., Hellin, J., & Dohrn, S. (2009). Collective action for smallholder market access. Food Policy, 34(1), 1–7. https://doi.org/10.1016/j.foodpol.2008.10.001
- Markelova, H., & Mwangi, E. (2010). Collective action for smallholder market access: Evidence and implications for Africa. Review of Policy Research, 27(5), 621–640. https://doi.org/10.1111/ropr.2010.27.issue-5 doi: 10.1111/j.1541-1338.2010.00462.x
- McCord, P., Dell'angelo, J., Gower, D., Caylor, K., & Evans, T. (2017). Household-level heterogeneity of water resources within common-pool resource systems. Ecology and Society, 22(1). https://doi.org/10.5751/ES-09156-220148
- McNutt, P. (1999). Public goods and club goods. Encyclopedia of Law and Economics, 1, 927–951.
- Meso, P., Musa, P., & Mbarika, V. (2005). Towards a model of consumer use of mobile information and communication technology in LDCs: The case of sub-Saharan Africa. Information Systems Journal, 15(2), 119–146. https://doi.org/10.1111/isj.2005.15.issue-2 doi: 10.1111/j.1365-2575.2005.00190.x
- Mittal, S., Gandhi, S., & Tripathi, G. (2010). Socio-economic impact of mobile phones on Indian agriculture (Tech. Rep. Working paper, No. 246). Indian Council for Research on International Economic Relations (ICRIER).
- Mittal, S., & Mehar, M. (2016). Socio-economic factors affecting adoption of modern information and communication technology by farmers in India: Analysis using multivariate probit model. The Journal of Agricultural Education and Extension, 22(2), 199–212. https://doi.org/10.1080/1389224X.2014.997255
- Moser, C. O. (1998). The asset vulnerability framework: Reassessing urban poverty reduction strategies. World Development, 26(1), 1–19. https://doi.org/10.1016/S0305-750X(97)10015-8
- Muyanga, M., & Jayne, T. (2008). Private agricultural extension system in Kenya: Practice and policy lessons. The Journal of Agricultural Education and Extension, 14(2), 111–124. https://doi.org/10.1080/13892240802019063
- Mwesige, P. G. (2004). Cyber elites: A survey of internet café users in Uganda. Telematics and Informatics, 21(1), 83–101. https://doi.org/10.1016/S0736-5853(03)00024-8
- Naidoo, S., London, L., Burdorf, A., Naidoo, R. N., & Kromhout, H. (2008). Agricultural activities, pesticide use and occupational hazards among women working in small scale farming in Northern KwaZulu-Natal, South Africa. International Journal of Occupational and Environmental Health, 14(3), 218–224. https://doi.org/10.1179/oeh.2008.14.3.218
- Narrod, C., Roy, D., Okello, J., Avendaão, B., Rich, K., & Thorat, A. (2009). Public–private partnerships and collective action in high value fruit and vegetable supply chains. Food Policy, 34(1), 8–15. https://doi.org/10.1016/j.foodpol.2008.10.005
- Ogalleh, S., Vogl, C., Eitzinger, J., & Hauser, M. (2012). Local perceptions and responses to climate change and variability: The case of Laikipia district, Kenya. Sustainability, 4(12), 3302–3325. https://doi.org/10.3390/su4123302
- Ogutu, S. O., Okello, J. J., & Otieno, D. J. (2014). Impact of information and communication technology-based market information services on smallholder farm input use and productivity: The case of Kenya. World Development, 64, 311–321. https://doi.org/10.1016/j.worlddev.2014.06.011
- Piccoli, G., Ahmad, R., & Ives, B. (2001). Web-based virtual learning environments: A research framework and a preliminary assessment of effectiveness in basic IT skills training. MIS Quarterly, 25(4), 401–426. https://doi.org/10.2307/3250989
- Porter, G., Hampshire, K., Abane, A., Munthali, A., Robson, E., Mashiri, M., & Tanle, A. (2012). Youth, mobility and mobile phones in Africa: Findings from a three-country study. Information Technology for Development, 18(2), 145–162. https://doi.org/10.1080/02681102.2011.643210
- Python Software Foundation (2019). Python language reference. http://www.python.org.
- Qiang, C. Z., Kuek, S. C., Dymond, A., & Esselaar, S. (2012). Mobile applications for agriculture and rural development (Tech. Rep.). World Bank.
- Qualtrics (2019). Qualtrics. https://www.qualtrics.com.
- Santosham, S., & Lindsey, D. (2015). Bridging the gender gap: Mobile access and usage in low-and middle-income countries (Tech. Rep.). GSMA.
- Smit, B., & Wandel, J. (2006). Adaptation, adaptive capacity and vulnerability. Global Environmental Change, 16(3), 282–292. https://doi.org/10.1016/j.gloenvcha.2006.03.008
- Srinivasan, J., & Burrell, J. (2013, December). Revisiting the fishers of Kerala, India. ICTD 2013: International conference on information and communication technologies and development (pp. 56–66). Cape Town, South Africa.
- Thiga, M., & Ndungu, S. (2015, May 6–8). Utilization of ICT for agriculture: A case study of Kakamega county, Kenya. 2015 IST-Africa conference (pp. 1–9). Lilongwe, Malawi. https://doi.org/10.1109/ISTAFRICA.2015.7190569.
- Waters, J., & Adger, W. N. (2017). Spatial, network and temporal dimensions of the determinants of adaptive capacity in poor urban areas. Global Environmental Change, 46, 42–49. https://doi.org/10.1016/j.gloenvcha.2017.06.011
- Wiesmann, U. (1998). Sustainable regional development in rural africa: Conceptual framework and case studies from Kenya. University of Berne Switzerland, Institute of Geography.
- World Bank Group (2018, October). Information and communications for development: Data-driven development (Tech. Rep. No. 128301). World Bank.
- Wyche, S., & Murphy, L. L. (2012, June). Dead China-make phones off the grid: Investigating and designing for mobile phone use in rural Africa. Proceedings of the designing interactive systems conference (pp. 186–195). Newcastle Upon Tyne, United Kingdom.
- Wyche, S., & Olson, J. (2018). Gender, mobile, and mobile internet – Kenyan women's rural realities, mobile internet access, and “Africa rising”. Information Technologies & International Development, 14, 15.
- Wyche, S., Simiyu, N., & Othieno, M. E. (2019). Understanding women's mobile phone use in rural Kenya: An affordance-based approach. Mobile Media & Communication, 7(1), 94–110. https://doi.org/10.1177/2050157918776684
- Wyche, S., & Steinfield, C. (2016). Why Don't farmers use cell phones to access market prices? Technology affordances and barriers to market information services adoption in rural Kenya. Information Technology for Development, 22(2), 320–333. https://doi.org/10.1080/02681102.2015.1048184