
 ?Mathematical formulae have been encoded as MathML and are displayed in this HTML version using MathJax in order to improve their display. Uncheck the box to turn MathJax off. This feature requires Javascript. Click on a formula to zoom.
ABSTRACT
Semi-Arid Regions (SARs) of West Africa are considered climate change “hotspots” where strong ecological, economic and social impacts converge to make socio-ecological systems particularly vulnerable. While both climatic and non-climatic drivers interact across scales to influence vulnerability, traditionally, this inter-connectedness has received little attention in vulnerability assessments in the region. This study adopted the vulnerability patterns framework, operationalized using the Multidimensional Livelihood Vulnerability approach to include both climatic and non-climatic stressors to analyze differential household vulnerability in SARs of Mali. Findings showed that while drought was the most mentioned climate-related stressor, households were also exposed to a diversity of environmental and socio-economic stressors, including food scarcity, livestock disease, labour unavailability, crop damage, and erratic rainfall patterns. The typology revealed three vulnerability archetypes differentiated by adaptive capacity and sensitivity. Availability of productive household members, household resource endowments, livelihood diversification and social networks were the main discriminant factors of household adaptive capacity, while challenges relating to food and water security make households more sensitive to stressors. The analysis highlighted the heterogeneity in household vulnerability patterns within and across communities. Failing to account for this heterogeneity in adaptation planning might result in a mismatch between adaptation needs and interventions, and potentially in maladaptation.
1. Introduction
In Semi-Arid Regions (SARs), global warming is particularly enhanced, with local temperatures increasing faster than the global average (Huang et al., Citation2017). A global warming of 2°C rather than 1.5°C would mean a warming of 3.2–4.0°C over semi-arid drylands, with disastrous impacts including decreased crop yields and runoff, increases of more severe and longer drought, and more favourable conditions for malaria transmission (Hoegh-Guldberg et al., Citation2018; Huang et al., Citation2017).
The situation in SARs of West Africa presents significant and urgent challenges that call for rapid attention. These areas are not only climate change exposure hotspots (Bathiany et al., Citation2018; de Sherbinin, Citation2014; Turco et al., Citation2015), but also hotspots of climate change impacts because of the unique biological, environmental and socio-economic attributes of the region (de Sherbinin, Citation2014; Diffenbaugh & Giorgi, Citation2012; Müller et al., Citation2014). These increased climate change impacts will be persistent over time, independent of emissions pathways considered in the global arena (Bathiany et al., Citation2018; Diffenbaugh & Giorgi, Citation2012; Turco et al., Citation2015). This underscores the urgency of concerted efforts to reduce vulnerability and enhance the resilience of communities and ecosystems to increasing and potentially irreversible climatic challenges. Effectively achieving the aims of these efforts will require a better understanding of who, why and how human systems are vulnerable to inform effective adaptation planning.
There has been extensive empirical research conducted over the last few decades exploring who, where, how, and why human systems are vulnerable to the changing climate (Ford et al., Citation2018; McDowell et al., Citation2016; Räsänen et al., Citation2016; Tonmoy et al., Citation2014; Williams et al., Citation2018). Vulnerability assessment has gained importance for policy purposes and become a necessity for informing policy and decision making (Hinkel, Citation2011; McDowell et al., Citation2016; Tonmoy et al., Citation2014). In sub-Saharan Africa, the number of vulnerability assessments has increased over time, with the agricultural sector being the most common focus (McDowell et al., Citation2016; Williams et al., Citation2018). Recognition that early investigations privileged climatic factors over social ones has, over time, pushed vulnerability research beyond a sole focus on climate in vulnerability assessment, with vulnerability now being conceived as a condition or state embedded in socio-economic processes (Bohle et al., Citation1994; Cardona, Citation2004; Chambers, Citation1989; Ford et al., Citation2018; Räsänen et al., Citation2016). In SARs of West Africa, vulnerability of local communities is driven not only by climatic factors but also by a diversity of biophysical, socio-economic, cultural and political factors (Antwi-Agyei et al., Citation2017; Nyantakyi-Frimpong & Bezner-Kerr, Citation2015; Ouédraogo et al., Citation2016). The most common climatic stressors in the region include droughts, erratic rainfall, floods, and winds (Antwi-Agyei et al., Citation2017; Epule et al., Citation2018; Nyantakyi-Frimpong & Bezner-Kerr, Citation2015). Non-climatic biophysical and socio-economic stressors frequently reported include lack of money, high cost of farm inputs, cattle destruction of crops, livestock pest, limited access to markets and lack of agricultural equipment (Antwi-Agyei et al., Citation2017; Nyantakyi-Frimpong & Bezner-Kerr, Citation2015; Segnon, Citation2019). Inequality in decision making processes and access to resources resulting from patriarchal local culture and institutions also shape the differential vulnerability of social groups (Ahmed et al., Citation2016; Antwi-Agyei et al., Citation2017).
While climatic stressors and accompanying risks are a dominant driver of vulnerability in SARs of West Africa (Epule et al., Citation2018; Gautier et al., Citation2016), complex interconnections between multiple climatic and non-climatic stressors, operating across different scales, are also important influences (Antwi-Agyei et al., Citation2017; Nyantakyi-Frimpong & Bezner-Kerr, Citation2015; Ouédraogo et al., Citation2016; Räsänen et al., Citation2016). While there are increasing studies pointing at the multiple stressors (Antwi-Agyei et al., Citation2017; Nyantakyi-Frimpong & Bezner-Kerr, Citation2015; Räsänen et al., Citation2016) driving differential vulnerability, the way in which these multiple climatic and non-climatic stressors interact to shape vulnerability is not well documented in this region. Furthermore, conventional vulnerability assessments based on indicators typically use aggregation methods to compute a composite index at community level (Hahn et al., Citation2009; Hinkel, Citation2011; Tonmoy et al., Citation2014; Vincent & Cull, Citation2014), an approach that often fails at capturing intra-community heterogeneity and diversity. Indicator-based vulnerability assessment and mapping approaches are most often conducted at community, district or national scale, missing crucial details about variation at household level (Antwi-Agyei et al., Citation2017). Finding ways to capture these intra-community dynamics is crucial for effective targeting of adaptation interventions and adaptation planning. Capturing intra- or within community heterogeneity could also be vital to enhancing the relevance of vulnerability assessments (Antwi-Agyei et al., Citation2017).
To fill this gap, this study analysed the diversity of climatic and non-climatic stressors facing smallholder farmers in Koutiala, a SAR of Mali, and assessed household vulnerability to both climatic and non-climatic stressors. Specifically, the following questions were addressed: (i) what are the climatic and non-climatic stressors driving household vulnerability?, (ii) what additional factors shape household vulnerability?, (iii) are there patterns in household vulnerability?, and how similar are households in terms of vulnerability patterns?. The study adopted the Vulnerability Patterns framework (Kok et al., Citation2016; Sietz et al., Citation2011) to construct household vulnerability archetypes and explore intra-community heterogeneity and diversity in household vulnerability patterns. We hypothesized that households within community are not homogenous in terms of their vulnerability to climatic and non-climatic stressors and using a pattern or archetype analysis will reveal the differential vulnerability.
2. Conceptual framework
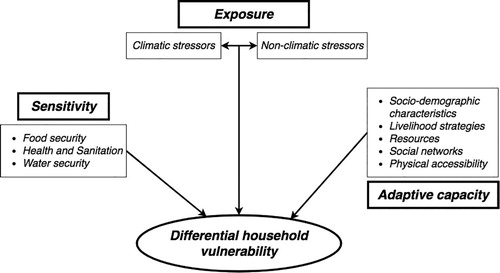
Rooted in natural hazard and poverty studies, the concept of vulnerability has gradually entered into research on adaptation of people to socio-ecological changes (Adger, Citation2006; Cutter, Citation1996; Füssel, Citation2007). Although there are diverse interpretations of vulnerability, according to different fields of study and traditions, vulnerability is most often conceptualized as the susceptibility of a system to perturbations or stresses shaped by its exposure and sensitivity to perturbations or stresses, and the capacity to adapt (Adger, Citation2006; Füssel, Citation2007; Nelson et al., Citation2007; Smit & Wandel, Citation2006; Tonmoy et al., Citation2014). Increasingly, vulnerability is conceptualized as a condition, including characteristics of exposure, sensitivity, and adaptive capacity, determined by social, economic, physical and environmental factors or processes, which increase the susceptibility of a system to the impact of hazards, rather than as a direct outcome of a perturbation or stress (Adger, Citation2006; Füssel & Klein, Citation2006; Miller et al., Citation2010; O'Brien et al., Citation2007). Exposure is the nature and degree to which a system experiences environmental or socio-political stress (Adger, Citation2006; Füssel & Klein, Citation2006). Sensitivity is the degree to which a system is modified or affected, either adversely or beneficially, by perturbations, such as climate-related stress (Adger, Citation2006; Füssel & Klein, Citation2006). Adaptive capacity is “the ability of a system to evolve in order to accommodate environmental hazards or policy change and to expand the range of variability with which it can cope” (Adger, Citation2006; Brooks et al., Citation2005; Engle, Citation2011; Smit & Wandel, Citation2006). It represents the preconditions necessary to enable adaptation, including physical and social resources, and the ability to mobilize these resources to respond to perceived or current stresses (Brooks et al., Citation2005; Engle, Citation2011; Nelson et al., Citation2007).
Measuring vulnerability is notoriously challenging as assessments suppose theoretically specified connections or linkages between often non-observable elements (Crane et al., Citation2017). These non-observable elements are assumed to constitute vulnerability, supported by theoretical models that are then measured through sets of proxy indicators (Crane et al., Citation2017; Hinkel, Citation2011; Tonmoy et al., Citation2014; Vincent & Cull, Citation2014). Assessing vulnerability entails the operationalization of the vulnerability frameworks selected (Crane et al., Citation2017; Hinkel, Citation2011). Indicators are commonly used to operationalize vulnerability, either deductively, based on theoretical frameworks, or inductively based on data used to build statistical models, or using a normative approach based on (individual or collective) value judgments (Crane et al., Citation2017; Hinkel, Citation2011; Tonmoy et al., Citation2014; Vincent & Cull, Citation2014). Indicator-based vulnerability assessments have been widely applied because they provide opportunities to incorporate socio-economic and biophysical components of vulnerability and are relatively easy to perform and simple to communicate to the policymakers and the general public (Tonmoy et al., Citation2014; Vincent & Cull, Citation2014).
This study adopted the Vulnerability Patterns framework (Kok et al., Citation2016; Sietz et al., Citation2011) to explore the diversity in household vulnerability patterns in SARs of Mali. The Vulnerability Patterns framework is similar to the IPCC framework, but provides a considerable elaboration of adaptive capacity, specifically on coping capacity to adjust to climate-related risks, manage loss and damage or explore alternative opportunities (Crane et al., Citation2017). This framework applies the cluster analysis methodology as a way to deliver useful insights into recurrent combinations of measurements based on similarities among systems of analysis, in cases where such a clustering exists (Crane et al., Citation2017; Kok et al., Citation2016; Sietz et al., Citation2011). The method helps identify specific constellations or groups of indicator values with recognizable patterns (Kok et al., Citation2016). To operationalize the framework, we adopted and modified the Multidimensional Livelihood Vulnerability Index (MLVI), developed by Gerlitz et al. (Citation2017). The MLVI assesses multidimensional livelihood vulnerability to environmental (including climatic) and socio-economic changes with household as unit of analysis (Gerlitz et al., Citation2017). The MLVI is an expansion and modification of the Livelihood Vulnerability Index (LVI) (Hahn et al., Citation2009) using multidimensional index construction approach (Gerlitz et al., Citation2017). Developed based on the Sustainable Livelihood (SL) framework, the LVI offers a pragmatic and flexible tool for vulnerability assessment and has been widely used in the literature (Gerlitz et al., Citation2017; Hahn et al., Citation2009). The SL framework has been widely used as a theoretical basis for deductively selecting indicators for vulnerability assessment. The SL framework relies on the understanding of how people access the social, human, financial, natural and physical capital assets (Reed et al., Citation2013) and has been shown to be relevant for assessing the capacity of households to withstand various socio-ecological shocks (Hahn et al., Citation2009). The SL framework is particularly pertinent to explore vulnerability to climate-related shocks since it offers a space for analysing not only key components that make up livelihoods but also contextual factors that affect livelihoods (Reed et al., Citation2013). These components are also intimately related to the elements that make a system or unit of analysis exposed or more sensitive to climate change impacts and influence their ability to cope with socio-ecological change (Hahn et al., Citation2009; Reed et al., Citation2013).
The MLVI modifies and extends the initial seven components of the LVI, resulting in twelve components so that it addresses factors that are relevant to the authors’ specific context () (Gerlitz et al., Citation2017). As in the initial LVI, each component is composed of several measurable and specific vulnerability indicators (Gerlitz et al., Citation2017; Hahn et al., Citation2009).
Figure 1. Conceptual framework of the study.
3. Materials and methods
3.1. Study area
This study was undertaken as part of a broader research programme “Adaptation at Scale in Semi-Arid Regions of Africa and Asia” (ASSAR). ASSAR’s overarching research objective is to use insights from multiple-scale, interdisciplinary work to improve the understanding of the barriers, enablers and limits to effective, sustained and widespread adaptation to climatic and non-climatic risks in semi-arid regions of Asia and Africa. The study was carried out in the Cercle of Koutiala, a semi-arid area in southeastern Mali (). The climate is typical of the Sudano-Sahelian region, with annual rainfall ranging from 400 to 800 mm, with high inter-annual and intra-seasonal variability. The rainy season starts in June and ends in October with rainfall peaking in August. The dry season is made up of a relatively cold period (November to February) and a hot period (March to May). Daily average temperatures range between 22°C (during cold period of November to February) and 35°C (hot period of March to June), with an average maximum temperature of 34°C during the rainy season and 40°C during the hot dry season. The natural vegetation is a tree and shrub savannah with an understory of annual and perennial grasses in a complex mosaic. Soils are poor, of sandy or sand–loamy texture and often gravelly.
Figure 2. Location of the study area.
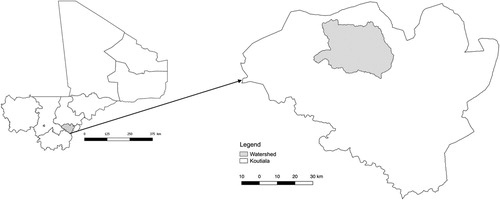
Koutiala belongs to the administrative region of Sikasso, and is 140 km north of Sikasso town. It covers an area of 8740 km2 (about 12.17% of the total area of Sikasso region and 0.7% of the country’s total area). According to the latest population census of 2009, Koutiala is home to 575,253 people, with an average density of 52.32 inhabitants per km2. Sikasso region is known to be Mali’s breadbasket and supplies a considerable amount of food to the rest of the country as well as incomes through cotton cultivation. Koutiala, in particular, is considered as “white gold” district because of the significant contribution of cotton production to agricultural systems and food production (Laris et al., Citation2015; Sidibé et al., Citation2018). Based on the latest population census, cotton production occupies 90% of Koutiala population (Laris et al., Citation2015; Laris & Foltz, Citation2014; Sidibé et al., Citation2018). In addition to cotton, Koutiala is also an important maize production area and rank second in terms of maize production in Sikasso region, contribution to about 14% (56,714 t) to the total maize output (Diallo et al., Citation2020). While a diversity of crops is cultivated, cotton, maize, sorghum, pearl millet and groundnut are the main crops in Koutiala (Segnon, Citation2019). After cotton and cereal cultivations, livestock production is the second main livelihood activity in Koutiala.
Over the last 50 years, a gradual and spatially variable increase in the annual mean temperature has been observed in West African region (Daron, Citation2014; Riede et al., Citation2016; Sylla, Nikiema, et al., Citation2016), with the highest (0.6–3.0°C) temperature increases observed in northern parts of the region, particularly in Mali (Daron, Citation2014). This increase has been faster in SARs of the region and faster than global warming (Klutse et al., Citation2018; Sarr, Citation2012). In Koutiala, minimum temperature has been increasing faster than maximum temperature (Segnon, Citation2019). There has been a substantial spatial and temporal (multi-decadal, annual and seasonal) variability in rainfall patterns over the past 50 years in the West Africa region, especially in the SARs, with a very dry period in the 70s and 80s (Biasutti, Citation2019; Daron, Citation2014; Nicholson, Citation2013; Riede et al., Citation2016; Sanogo et al., Citation2015; Sarr, Citation2012). After the severe drought periods, rainfall seems to be recovering, but this recovery is characterized by new rainfall features including false start and early cessation of rainy seasons, increased frequency of rainy days along with increased precipitation intensity, more frequent dry spells, increasing number of hot nights and warm days (Biasutti, Citation2019; Salack et al., Citation2016; Sanogo et al., Citation2015). Rather than a rainfall recovery, the SARs of West Africa is experiencing a new era of climate extremes (Biasutti, Citation2019; Bichet & Diedhiou, Citation2018; Panthou et al., Citation2018). An analysis of rainfall data from Koutiala weather station confirmed the strong spatio-temporal variability in rainfall patterns than a clear significant change (Segnon, Citation2019).
The new rainfall conditions termed “hybrid rainy seasons” induced by global warming and characterized by false start and early cessation of rainy seasons and increased frequency of intense daily rainfall (Salack et al., Citation2015; Salack et al., Citation2016) have serious implications for agricultural production, which is mainly rain-fed in the SARs of West Africa (Gautier et al., Citation2016; Salack et al., Citation2015; Sultan et al., Citation2013; Sultan et al., Citation2014; Sultan & Gaetani, Citation2016; You et al., Citation2011). In the Sahel, variability and changes in temperature and precipitation have led to a significant decline in tree density and species richness (Gonzalez et al., Citation2012). It is very likely that services and functions derived from tree-based ecosystems were also affected/reduced. Changes in the number of rainy days and the timing of the rainy season negatively affected vegetation growth in the semi-arid Sahel (Zhang et al., Citation2018). Climate change and variability also led to a southward shift of the climatic zones in West Africa (Gonzalez et al., Citation2012), with serious consequences for agricultural output and human livelihoods (Sissoko et al., Citation2011). In addition, the strong spatio-temporal variability in rainfall patterns has far-reaching impacts on water quality and availability, on crop yield and production, and thus on food security in the region (Ben Mohamed, Citation2011; Gautier et al., Citation2016; Sissoko et al., Citation2011; Sultan & Gaetani, Citation2016; Zougmoré et al., Citation2016). The late twenty-first century projections reveal an extension of torrid, arid and semi-arid climate regime throughout West Africa, with the recession of moist and wet zones (Sylla et al., Citation2016). The current Sahel, mainly semi-arid in present-day conditions, is expected to face a moderately persistent future arid climate (Sylla et al., Citation2016). In Mali, projected cereal crops yield reductions are expected to reduce food availability and food self-sufficiency, especially of smallholder farmers, who are already food insecure (Butt et al., Citation2005; Traore et al., Citation2017). In Sikasso region, southern Mali, white (Irish) potatoes, a key cash crop for households, will be the most affected by changing climatic conditions by 2060, with yields decreasing, under both dry and wet conditions, by almost 25% (Ebi et al., Citation2011).
3.2. Data collection
To assess household vulnerability to climatic and non-climatic stressors, a household survey was designed and conducted in the 10 villages selected within a watershed in Koutiala (see ). The communities were randomly selected from a list of communities located within the watershed. The selected communities were Danzana, Dentiola, M’Pessoba (in M’Pessoba district), Fonfona (Tao district), Oudiala, Zansoni (in Fakolo-Kou district), N'Tossoni, Diéla (in N'Tossoni district), Ntiesso (in Koutiala district), and Zangorola (in N’Golonianasso district). The household survey sample size was determined following Krejcie and Morgan (Citation1970):
where
is the required sample size, i.e. the number of farm household to be surveyed;
is the table value of chi-square for one degree of freedom at the confidence level fixed at 95%;
is the population size, i.e. the total population of household in Koutiala based on the latest population census;
is the population proportion, i.e. the proportion of farm household. In Sikasso region, where the study area is located, about 60% of households are farm households;
is the degree of accuracy and fixed at 0.05 (5%). The sample size following the above formula is 368 households. Oversampling was done to increase the sample to 501 households. Roughly 50 households were randomly selected in each community. A household was defined as “a group of people living in the same dwelling space who have at least one common plot together or one income-generating activity together (for example, herding, business, or fishing) and who acknowledge the authority of a man or woman who is the head of household” (Beaman & Dillon, Citation2012).
The MLVI framework (vulnerability as a function of exposure, sensitivity, and adaptive capacity) (Gerlitz et al., Citation2017) was adopted and modified to suit the context of the semi-arid study area to assess household vulnerability to climatic and non-climatic factors. The MLVI is composed of 12 components which address factors that are relevant to authors’ specific context (Gerlitz et al., Citation2017). In this study, components that were not relevant to the study area context (e.g. environmental stability was linked to the mountain specificities of the Hindu Kush Himalayas region where the MLVI was developed) were removed, resulting in 10 components ( and ). Each component is operationalized by a number of measurable and specific indicators (Gerlitz et al., Citation2017). A preliminary list of indicators was identified based on a review of literature in the SARs of West Africa (Achigan-Dako et al., Citation2013; Segnon, Citation2019). The list of indicators was revised and refined during participatory workshops with local stakeholders, including communities and local experts in the study area (). The indicators were documented through the household survey using a semi-structured questionnaire. The survey questionnaire was pre-tested with 20 households (within Koutiala cercle, but not in study villages; these households did not participate in this research) to ensure that the questions were understandable.
Table 1. Vulnerability dimensions, components, and indicators.
3.3. Data analysis
The vulnerability pattern approach (Kok et al., Citation2016; Sietz et al., Citation2011) was adopted in analysing household vulnerability patterns. To identify and analyse household vulnerability patterns, typologies or archetypes of vulnerability were constructed using Factor Analysis of Mixed Data (FAMD) (Pagès, Citation2014) combined with a Hierarchical Cluster Analysis using the package FactoMineR (Lê et al., Citation2008). FAMD is similar to Principal Component Analysis but allowed to simultaneously quantify categorical and quantitative variables while reducing the dimensionality of the data (Akohoue et al., Citation2018; Pagès, Citation2014). Since we have both categorical and quantitative indicators in our dataset, we used FAMD. To identify the relevant number of components to retain, the eigenvalues of the components were analysed and components with eigenvalue greater than one were kept (Abdi & Williams, Citation2010).
Hierarchical Clustering on Principal Component (HCPC) analysis (Husson et al., Citation2017) was performed on factors constructed from FAMD to identify homogenous archetypes. Before performing the HCPC analysis, the clustering tendency of the data was assessed using the Visual Assessment of cluster Tendency (VAT) algorithm (Bezdek & Hathaway, Citation2002). Clustering tendency was assessed to evaluate whether the dataset contains meaningful clusters (i.e. non-random structures) or not, in other word the feasibility or validity of the clustering analysis on the data (Bezdek & Hathaway, Citation2002). To evaluate the clustering validity and identify the optimal number of clusters, the silhouette method (Rousseeuw, Citation1987) was used. It measures the quality of a clustering by determining how well each object lies within its cluster (Rousseeuw, Citation1987). A high average silhouette width indicates a good clustering and the optimal number of clusters k is the one that maximizes the average silhouette over a range of possible values for k (Rousseeuw, Citation1987). Descriptive statistics was used to describe the archetypes identified and summarize the climatic and non-climatic stressors. We used Chi-square test to test if the types of stressors were archetype-dependent. To test whether vulnerability archetypes were independent of study communities (or research sites), we also used Chi-square test. All the statistical analyses were performed in R statistical environment (R Core Team, Citation2019).
4. Results
4.1. Household socio-economic profiles
Over 98% of households interviewed were headed by a male. Household head ages ranged from 19 to 84 years, with mean age of 48.33 (± 12.28) years. More than 86% of the households interviewed belonged to Minianka ethnic groups, which is the dominant sociolinguistic group in the study area. The rest of households interviewed were either Peulh (about 4%) or belonged to other groups (6%) which were Bambara, Sonike and Senoufo.
About 34% of household heads had no formal education, while about 21% and 5% of them attained primary and secondary educations respectively. About 11% of the household heads attained Islamic or Koranic education and 28% had been trained to read and write in a local language. Islam is the dominant religion in the study area and was practiced by more than 95% of the households interviewed. On average, households interviewed had about nine productive members (number of household members between 19 and 64 years of age), but this varied largely (from 1 to 58 productive members). Dependency ratio (number of household members under 15 and over 65 years of age to number of household members between 19 and 64 years of age) ranged from 0.17 to 6.5, with an average of 1.42. More than 63% of the households had a dependency ratio greater than one and 39% of them had a value greater or equal to 1.5. A summary of the descriptive statistics of household socio-economic and demographic characteristics is presented in Supplementary Material Table S1.
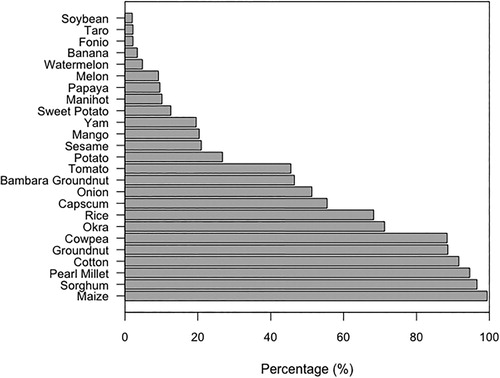
Farming was the main livelihood activity of all the surveyed households. illustrates the diversity and importance of cultivated crops in the study area. Cultivated crops per household ranged from two to 22, with an average of 10.42 ± 3.65. In total, 25 different crops were cultivated by the surveyed households. While there was a diversity of crops (see ), maize (cultivated by more than 99% of the surveyed households), sorghum (about 97% of the surveyed households), pearl millet (about 95% of the surveyed households), cotton (about 92% of the surveyed households), groundnut (about 89% of the surveyed households) and cowpea (88% of the surveyed households) were respectively the most cultivated crops by the surveyed households. Crops cultivated by few households were soybean, Taro, Fonio, banana and watermelon ().
Figure 3. Diversity of cultivated plants and their importance.
4.2. Diversity of climatic and non-climatic stressors
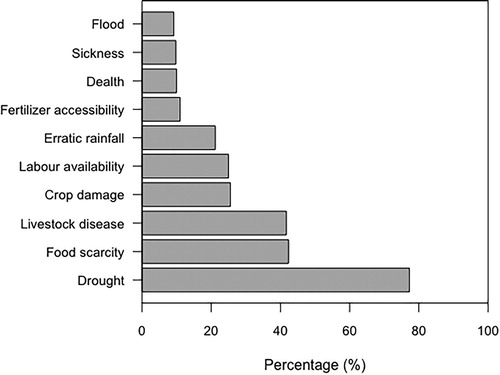
Stressors to which household were exposed to in the study area were of both climatic and non-climatic nature. illustrates the diversity of stressors to which households were exposed. Drought was the most experienced stressors by the majority of surveyed households (77.25%). Other stressors included food scarcity (42.32%), livestock disease (41.72%), erratic rainfall patterns (21.16%) and floods (9.58%). Other key non-climatic stressors experienced by households were damage to crops and farms by livestock (25.55%), scarcity of labour to perform farm activities (24.95%), inability to access fertilizer (10.98%), and death (9.98%) or sickness of a household member (9.78%).
Figure 4. Diversity of stressors/shocks experienced by surveyed households.
Over the past 12 months prior to the survey, the total number of shocks experienced by households ranged between one and seven, with a median number of three per household (mean 2.73 ± 1.35). It ranged from zero to five for both environmental and socio-economic shocks, and a median number of one (mean 0.81 ± 0.93) for socio-economic shocks and a median number of two (mean 1.92 ± 0.83) for environmental shocks.
4.3. Household vulnerability patterns
The Factor Analysis of Mixed Data (FAMD) analysis showed that the first 12 Principal Components (PC) have eigenvalues greater than one and accounted for 61.20% of the total variance (Figure S1). In addition to these first 12 PCs, the next four components with eigenvalues close to 1 (above 0.9) were included in order to increase the total variance to be used in the further analysis. The first 16 components accounted for 71.61% of the total variance and were considered in the clustering analysis. Supplementary Material Figure S1 presented the eigenvalues and the percentage of variance explained by the first 16 PCs included in the cluster analysis. Supplemental Material Table S2 presented the correlation of the indicator variables with the first five principal components. Supplemental Material Figure S2 illustrated the quality of representation of these variables on the principal components.
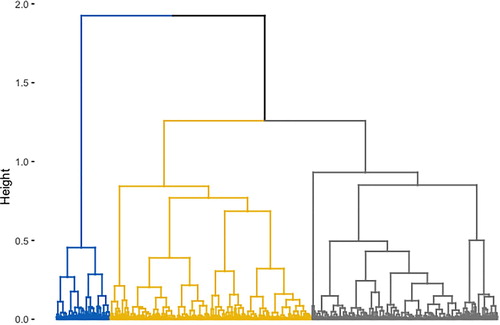
The results of the feasibility of clustering analysis performed confirmed that there is a cluster structure in the data (Supplementary Material Figure S3). The dark diagonal blocks in Supplementary Material Figure S3 clearly indicate the presence of clusters, as well as the isolated singleton in data. The Hierarchical Clustering on Principal Component (HCPC) analysis showed three clusters or archetypes of household vulnerability patterns (). This was supported by the analysis of the dendrogram (), which clearly revealed three classes. Cluster validity analysis performed using the silhouette method indicated the average silhouette width was maximized when the number of clusters was three (Supplementary Material Figure S4). The highest average silhouette width is 0.4, indicating that households have been acceptably clustered in each archetype.
Figure 5. Archetypes of household vulnerability patterns.
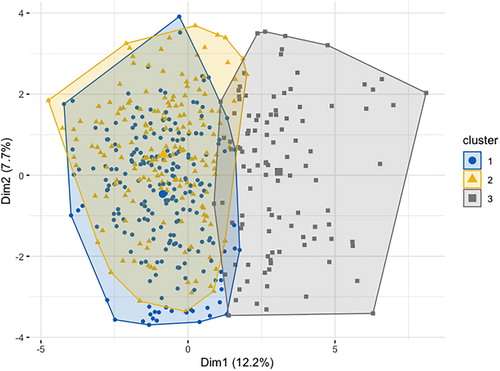
Figure 6. Dendrogram showing the grouping of households into vulnerability archetypes.
The most discriminant indicators of household vulnerability patterns were related to socio-demographic status (education and number of household productive members), livelihood strategies (all the three indicators, see ), household resources (all the indicators, see ), food security (all the indicators, see ), water security (diversity of water source and water sufficiency), social network (membership of CBOs and diversity of CBOs), physical accessibility (road practicability), and health and sanitation (drinking water quality, toilet facility quality, illness and average time to health facility). Indicators that were not discriminant included variables related to environmental and socio-economic stressors. In addition, a Chi-square test of independence indicated that there was no dependence between vulnerability archetypes and either overall stressors (Chi-squared = 20.845, df = 18, p-value = 0.287), environmental stressors (Chi-squared = 13.802, df = 8, p-value = 0.087) or socio-economic stressors (Chi-squared = 6.2593, df = 8, p-value = 0.618). This result indicated that stressors were not specific to any archetypes and that households were similarly exposed to stressors across communities.
Table 2. Characterization of household vulnerability patterns based on discriminant indicators.
presents the description of the three vulnerability archetypes according to the discriminant vulnerability indicator variables. Vulnerability archetype 1 was composed of households with low resource endowments and limited livelihood activities and comprised 43.31% of surveyed households. Households in this vulnerability archetype had smaller land holdings (9.40 ± 3.66 ha, p < 0.001), fewer livestock (4.38 ± 4.18 TLU, p < 0.001) and less agricultural equipment (number of ploughs, drought animals, carts, donkeys, seed drills, and pesticide sprayers; p < 0.001, ) than average. They had limited productive household members (6.88 ± 3.58, p < 0.001), were involved in few livelihood activities (2.68 ± 0.88, p < 0.001), especially agricultural livelihood activities (1.91 ± 0.71, p = 0.023), cultivated lower numbers of crops (9.22 ± 2.93, p < 0.001), had limited water sources to satisfy household needs (1.04 ± 0.19, p < 0.001) and belonged to fewer farmer- or community-based organization (1.11 ± 0.49, p < 0.001). About 75% of households in vulnerability archetype 1 also did not have access to an improved drinking water source (p < 0.001, ). About 28% of households that buy more food to supplement their own production to satisfy household needs belong to vulnerability archetype 1 (p < 0.001, ). This archetype can be characterized as a mildly vulnerable archetype.
Vulnerability archetype 2, which is composed of 35.13% of surveyed households, was also composed of households with low resource endowments and limited livelihood activities () but was characterized by prevalent food insecurity conditions. Households in vulnerability archetype 2 had smaller land holdings (9.71 ± 4.49 ha, p < 0.001), fewer livestock (3.79 ± 3.75 TLU, p < 0.001) and less agricultural equipment (number of ploughs, drought animals, carts, donkeys, seed drills, and pesticide sprayers; p < 0.001, ) than average households. They had limited productive household members (7.45 ± 4.22, p < 0.001), and were involved in fewer livelihood activities (2.65 ± 0.87, p < 0.001), particularly non-agricultural livelihoods activities (0.66 ± 0.64, p < 0.001). More than 81% of households in vulnerability archetype 2 were not food secure and were unable to feed their households with their own production all the months of the year (p < 0.001). The number of months in which households of this vulnerability archetype did not have sufficient food to satisfy household needs was higher than the average (2.39 ± 1.71 vs. 1.97 ± 1.64, p < 0.001). About 58% of households that bought more food to supplement their own production to satisfy household needs belong to vulnerability archetype 2 (p < 0.001, ). Only about 14% of households in this vulnerability archetype produced enough food to satisfy household needs (p < 0.001). More than 98% of households in this vulnerability archetype used both improved and non-improved drinking water sources and more than 69% of them did not have access to improved toilet facilities (p < 0.001). Households in this archetype had, however, more water sources than average households or households in other archetypes (2.07 ± 0.26, p < 0.001) and about 53% of them had enough water to satisfy household needs year-round (p = 0.001, ). Compared to other archetypes, vulnerability archetype 2 was composed of less educated households: about 48% of them received no education and almost 50% of households with no education belong to this archetype, while only about 12% of them received primary education. Households in this vulnerability archetype can be characterized as highly vulnerable.
Vulnerability archetype 3 included 21.56% of surveyed households and was composed of households with high resource endowments and livelihood activities, and a diverse social network, and food secure households (). Households in this vulnerability archetype had larger land holdings (18.88 ± 6.39 ha, p < 0.001), larger (14.34 ± 8.68 TLU, p < 0.001) and diverse livestock resources (3.96 ± 0.79 livestock type, p < 0.001), and more agricultural equipment (number of ploughs, drought animals, carts, donkeys, seed drills, and pesticide sprayers; p < 0.001, ) than average. They had more productive household members (15.83 ± 9.10, p < 0.001), and were involved in a larger variety of livelihood activities (3.23 ± 1.02, p < 0.001), both agricultural (2.15 ± 0.80, p = 0.023) and non-agricultural (1.08 ± 0.72, p < 0.001). About 99% of households in vulnerability archetype 3 were members of at least one farmer- or community-based organization (p = 0.041, ), with most of them having more diverse membership than average (1.44 ± 0.60, p < 0.001). They cultivated a higher number of crops (12.68 ± 3.55, p < 0.001) and reported fewer months than average (1.37 ± 1.44, p < 0.001) in which households did not have sufficient food to satisfy household needs. Households in this archetype either produced enough food to satisfy household needs year-round (about 38% of households in the archetype) or supplemented an amount of food lower than their own production from external sources (about 55% of households in the archetype). About 43% of households in this archetype were food self-sufficient (p < 0.001, ). However, more than 66% of households in this archetype did not have enough water to satisfy household consumption needs year-round (p = 0.001, ); only 33% of them were water secure. This vulnerability archetype was composed of fewer households with no education (20.37%) and more literate households (37.97%). Households in this vulnerability archetype can be characterized as less vulnerable.
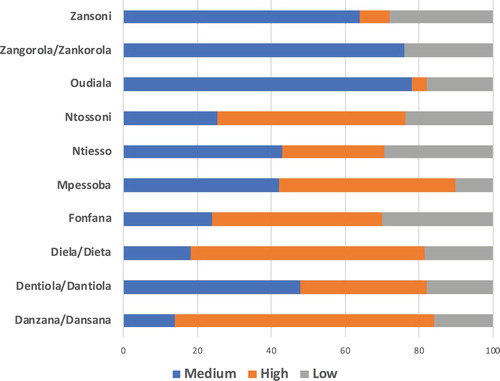
4.4. Distribution of vulnerability archetypes across community
showed the distribution of the three vulnerability archetypes across the study communities. Except in one community (Zankorola) where only two archetypes were identified, all the three vulnerability archetypes were represented in all the 10 study communities. While the medium vulnerability archetype is the most represented (with 43.31% of surveyed households) followed respectively by high (35.13% of surveyed households) and low (21.56% of surveyed households) vulnerability archetypes, their distribution varied across community (see ). Chi-square test of independence indicated that there was a significant association between archetypes and community (Chi-squared = 144.12, df = 18, p-value < 0.001). High vulnerable households were more represented respectively in Danzana (70% of the surveyed households), Diela (63%), Ntossini (51%) and Mpessoba (48%). Zankorala seems to be better off with only medium (75%) and less (25%) vulnerable households. In addition to Zankorala, medium vulnerable households were more represented in Oudiala (78%), Zanzoni (64%) and Dentiola (48%). In Ntiesso, the three archetypes are fairly distributed with respectively 43%, 29% and 27% of high, low and medium vulnerability households. A similar observation is also made in Fonfana with respectively 46%, 30% and 24% of high, low and vulnerability households ().
Figure 7. Distribution of vulnerability archetypes across the study communities.
5. Discussions
5.1. Diversity of climatic and non-climatic stressors
Our findings highlight the diversity of stressors to which households are exposed to in the study area. Drought was the most mentioned stressor in the study area, confirming previous studies that have reported drought as the most important climatic stressor in SARs of West Africa (Epule et al., Citation2018; Gautier et al., Citation2016). The second most mentioned stressor was food insecurity. This is consistent with previous studies highlighting the association between food insecurity and high vulnerability in Africa (McDowell et al., Citation2016; Williams et al., Citation2018). While climatic stressors, namely drought, were the most mentioned, households were also exposed to a wide range of climatic and non-stressors, including food scarcity, livestock disease, labour unavailability, crop damage, inaccessibility to fertilizer, erratic rainfall patterns, and death or sickness of a household member. Climatic stressors were just one among many challenges. Indeed, a recent systematic review of climatic stressors in the SARs of West Africa has shown that while climatic drivers are dominant, there is, however, an increasing recognition of the influential role of non-climatic stressors (Epule et al., Citation2018). Our findings emphasized the interconnections between multiple climatic and non-climatic stressors to which households are vulnerable in this region and contribute to the increasing and growing ‘multiple stressors’ studies in sub-Saharan Africa (Ahmed et al., Citation2016; Antwi-Agyei et al., Citation2017; Nyantakyi-Frimpong & Bezner-Kerr, Citation2015; Räsänen et al., Citation2016; Williams et al., Citation2018). Multiple non-climatic stressors operating at different scales drive vulnerability (Räsänen et al., Citation2016) and climate change intersects with many socio-ecological challenges that smallholder farmers are facing in SARs (Ahmed et al., Citation2016; Nyantakyi-Frimpong & Bezner-Kerr, Citation2015; Ouédraogo et al., Citation2016).
5.2. Heterogeneity in household vulnerability patterns
Indicator-based vulnerability assessments typically use aggregation methods to compute a composite index at a given scale (country, region, sub-region or community) (Hahn et al., Citation2009; Hinkel, Citation2011; Tonmoy et al., Citation2014; Vincent & Cull, Citation2014). This fails to capture intra- or within scale differential vulnerability and treats community or sub-region as homogeneous. The vulnerability pattern approach used in this study to construct vulnerability archetypes illustrated the heterogeneity in household vulnerability patterns within and across communities (see ). All the three vulnerability archetypes identified were represented in all the 10 study communities. This implies that households are not uniform or homogeneous in terms of vulnerability to climatic and non-climatic risks both within and across communities. Within the same community, high, medium and low vulnerability household can be present. By revealing and describing patterns in household vulnerability, our study contributes to the growing bodies of studies that operationalize vulnerability pattern approach through archetype analysis in various contexts across the world (see Akohoue et al. (Citation2018); Kok et al. (Citation2016); Nazari Nooghabi et al. (Citation2019); Sietz et al. (Citation2011); Sietz et al. (Citation2012); Vidal Merino et al. (Citation2019)).
5.3. Drivers of household vulnerability patterns
We found that key determinants of household vulnerability patterns were socio-demographic status, livelihood strategies, household resource endowments, food security, water security, social network, physical accessibility, and health and sanitation. Exposure to stressors was not discriminant. This implies that household vulnerability patterns in the study area were mainly shaped by household adaptive capacity and sensitivity. The non-association between vulnerability archetypes and stressors implies that household exposure to stressors was similar across the archetypes and communities. These findings confirmed that differential vulnerability can be explained not just by the difference in exposure to climate-related and environmental hazards but largely by social and economic processes (Thomas et al., Citation2019). Our findings are, however, inconsistent with Nazari Nooghabi et al. (Citation2019) results, where drought was a key vulnerability-driving factor for one of the three wheat farmer vulnerability archetypes in Northeast Iran. Socio-economic drivers were key vulnerability factors for the two other archetypes (Nazari Nooghabi et al., Citation2019).
Thomas et al. (Citation2019) identified four broad themes – resource access, governance, culture, and knowledge – as useful in explaining differential local-scale vulnerability. In our study, resource access and knowledge were key determinants of differential vulnerability patterns. Resource endowments (agricultural land, livestock and agricultural equipment in this study) are one crucial factor that shapes people’s ability to plan for and respond to climate change challenges (Thomas et al., Citation2019). Resource endowments influence vulnerability by reducing or increasing exposure, sensitivity, and adaptive capacity (Thomas et al., Citation2019). Marginalization and deprivation arising from social stratification play important roles in unequal access to resources, which in turn explains differential sensitivity to and capacity to respond to climate impacts (Thomas et al., Citation2019). Knowledge and information interact, directly and indirectly, with vulnerability to climate change by shaping peoples’ adaptive capacity, exposure, and sensitivity (Thomas et al., Citation2019). Different types and sources of information and modes of knowledge transmission affect how people understand, perceive, and act on information (Thomas et al., Citation2019). While information is necessary, it is not alone sufficient for reducing vulnerability (Thomas et al., Citation2019).
In the study area, household socio-demographic characteristics such as household size or number of productive household members determined household ability to respond to various socio-ecological challenges such as labour availability, ability to produce enough food (in terms of diversity and quantity) to ensure food security, household members’ sickness or death. In fact, family labour, especially child labour, is still playing an important role in West African farming systems, and elsewhere in Africa. Indeed, according to the 2016 Global Estimates of Child Labor, the agriculture sector accounts for 85% of all child labour in Africa (ILO, Citation2017). For instance, one of the main drivers of farmers’ decisions to adopt, as well as to intensify the use of soil and water conservation practices to adapt to climate change in SARs of West Africa is the presence of children in the household (Kpadonou et al., Citation2017). The household labour force is also one of the key drivers of the adoption of climate-smart technologies and practices in southern Mali (Ouédraogo et al., Citation2019). These highlight how crucial household size and labour are for household adaptive capacity in the region.
Previous research has shown that vulnerability in SARs of Africa is gendered differentiated (Rao et al., Citation2019). As female-headed households were rare in our study area context, our analysis was unable to reveal gender-differentiated vulnerability patterns. A replication of our approach in a context where female-headed households are culturally accepted and common might provide better insights regarding gender and household vulnerability patterns. Consistently with previous studies highlighting the association between food insecurity with high vulnerability in Africa (McDowell et al., Citation2016; Williams et al., Citation2018), our findings also showed that food insecurity was a key determinant of vulnerability patterns.
6. Conclusions
This study analysed the diversity of stressors experienced by smallholder farmers in SARs of Mali and provided a typology or archetype of household vulnerability. The combined vulnerability patterns and MLVI approaches used in this study to construct archetypes of vulnerability offer a pragmatic way to reveal the heterogeneity in household vulnerability to both climatic and non-climatic stressors within and across communities. The findings showed that while climatic stressor, mainly drought, was the most reported stressor, households in the study were exposed to a diversity of environmental and socio-economic shocks, including food scarcity, livestock disease, labour unavailability, crop damage, inaccessibility of fertilizer, erratic rainfall patterns, death or sickness of a household member. Climatic stressors or risks were just one among many socio-ecological challenges facing smallholder farmers in SARs. The typology revealed three household vulnerability archetypes differentiated by adaptive capacity and sensitivity dimensions, implying that households were similarly exposed to stressors. Availability of productive household members, household resource endowments (agricultural land, livestock and agricultural equipment), livelihood diversification and social networks are the main discriminant factors of household adaptive capacity. Challenges to get sufficient food and water to satisfy household needs throughout the year make households more sensitive to stressors. The analysis also highlighted the heterogeneity in household vulnerability patterns within and across communities and the context-specific driving forces of vulnerability in SARs. Failing to account for this heterogeneity in vulnerability patterns across scales and nuanced understanding of context-specific drivers in adaptation planning might result in a mismatch between adaptation needs and interventions, and potentially in maladaptation.
Supplemental Material
Download MS Word (1.5 MB)Acknowledgements
This research was carried out as part of the Adaptation at Scale in Semi-Arid Regions (ASSAR) project. ASSAR is one of four research programs funded under the Collaborative Adaptation Research Initiative in Africa and Asia (CARIAA), with financial support from the UK Government's Department for International Development (DFID) and the International Development Research Centre (IDRC), Canada. The views expressed in this work are those of the creators and do not necessarily represent those of DFID, IDRC or its Board of Governors. This work got additional support through the CGIAR Research Program on Climate Change, Agriculture and Food Security (CCAFS), which is carried out with support from the CGIAR Fund Donors and through several bilateral funding agreements (the CGIAR Fund Council, Australia-ACIAR, European Union, International Fund for Agricultural Development-IFAD, Ireland, New Zealand, Netherlands, Switzerland, USAID, UK, and Thailand). For details, please visit https://ccafs.cgiar.org/donors.
Disclosure statement
No potential conflict of interest was reported by the author(s).
Correction Statement
This article has been republished with minor changes. These changes do not impact the academic content of the article.
Additional information
Funding
Notes on contributors
Alcade C. Segnon
Dr Alcade C. Segnon is a Postdoctoral Fellow at the CGIAR Research Program on Climate Change, Agriculture and Food Security (CCAFS) based at the International Crops Research Institute for the Semi-Arid Tropics (ICRISAT), Bamako, Mali. Dr Segnon holds a BSc and MSc in Agronomy from the University of Abomey-Calavi (Benin) and a PhD in Environmental Science from the University of Ghana. His research interest is at the intersection of climate change adaptation, agrobiodiversity utilization and traditional knowledge systems, and agroecosystem sustainability. He is particularly interested in how and to what extent agrobiodiversity and knowledge that local people share on it can be used to improve smallholders' livelihoods and resilience to climate and environmental change. Recently, he has been exploring climate change adaptation effectiveness, especially agrobiodiversity-based adaptation. Dr Segnon is involved in the Global Adaptation Mapping Initiative (GAMI) and is a Contributing Author (Chapter 16) of the IPCC's 6th Assessment Report, WGII.
Edmond Totin
Dr Edmond Totin is an Assistant Professor at the National University of Agriculture (Benin). He holds a PhD in Knowledge Technology and Innovation from Wageningen University, the Netherlands (2013). He works as a rural sociologist in the field of management of agricultural innovation, climate adaptation and governance. He focusses on processes of socio-technical innovation and transformation and approaches to stimulate science-informed policy agendas.
Robert B. Zougmoré
Dr Robert B. Zougmoré is an agronomist and soil scientist with a PhD in Production Ecology & Resources Conservation (Wageningen University, The Netherlands). He is the Africa Program Leader of CCAFS based at the International Crops Research Institute for the Semi-Arid Tropics (ICRISAT), Bamako, Mali. Before joining CCAFS, he was a senior staff within the Environment Program of the Sahara & Sahel Observatory (Tunisia) where he was actively involved in initiatives on Desertification, land Degradation and Drought and on climate change adaptation in Africa for science-informed policies. His areas of expertise include Agronomy and soil science, Land degradation and development, Climate change adaptation & mitigation, Integrated Water and Nutrient Management, Agroecology, Climate-smart policies and institutions.
Jourdain C. Lokossou
Jourdain C. Lokossou holds an MSc in Agricultural Economist and has just started his PhD studies in Agricultural Economics. He has over eight years of research experience in CGIAR centres (AfricaRice and ICRISAT). His research interests include Agricultural technology Adoption and Impact Assessment; Climate change and food security; Household behavior under environmental uncertainty and production risk; Market economics and consumer preference analysis.
Mary Thompson-Hall
Dr Mary Thompson-Hall is a Senior Program Specialist at International START Secretariat. She holds a BA in environmental studies from the University of Tennessee and a MA and Ph.D. in geography from the University of South Carolina where her research focused on intersections of conservation and development in Sub-Saharan Africa. She joined START in 2015 as a Program Specialist working primarily on the Adaptation at Scale in Semi-Arid Regions (ASSAR) project, part of the broader Collaborative Adaptation Research Initiative in Africa and Asia (CARIAA). Previously, Mary worked with World Bank and African Development Bank experts on participatory adaptation fieldwork for the Zambian Pilot Program for Climate Resilience (PPCR), and also co-authored a USAID commissioned report on gender and climate change adaptation. Most recently, she worked as a post-doctoral researcher at the Basque Center for Climate Change (BC3) in Bilbao, Spain on topics relating to agricultural biodiversity and climate change adaptation.
Benjamin O. Ofori
Dr. Benjamin O. Ofori is a Senior Research Fellow at the Institute for Environment and Sanitation Studies (IESS) of the University of Ghana. He holds a PhD and MSc in Geography and Resource Development and a BA (Hons) in Geography with Sociology all from the University of Ghana. His current research areas include Rural Resource Utilization and Marketing, and Community Livelihoods, especially in Dam-affected Areas.
Enoch G. Achigan-Dako
Prof. Dr. Enoch G. Achigan-Dako is Geneticist and Plant Breeder. He is Associate Professor and Head of the Laboratory of Genetics, Horticulture and Seed Science of the Faculty of Agronomic Sciences, University of Abomey-Calavi. He holds a PhD from the Martin-Luther-University, Halle-Wittenberg (Germany). Prof. Achigan-Dako is an alumni of the African Plant Breeding Academy of the University of California, Davis and the Leibniz Institute of Plant Genetics and Crop Plant Research (Germany). He worked with the University of Wageningen as scientific editor of the programme Plant Resources of Tropical Africa (PROTA) in Kenya until 2012. His research focuses on the sustainable use of orphan and underutilized species and crop wild relatives.
Christopher Gordon
Prof. Christopher Gordon is based at the University of Ghana's Institute for Environment and Sanitation Studies. He graduated from the University of Ghana with BSc (Hons.) in 1980 and MSc, 1986 both in Zoology, and PhD from King's College, University of London (1995), in Human Environmental Science. Prof Gordon has supervised more than 60 MSc and PhD students in areas of Environmental Science, Climate Change and Sustainable Development, Chemistry, Agricultural Extension and Communication Studies. He has contributed to national and international policy in disciplines including Water Quality, Freshwater Biodiversity, Fisheries, Wetland Ecology. He has served as Vice-President for both Wetlands International and the International Society of Limnology. Currently he is member of the World Adaption Research Programme of UN Environment as well as an Earth Commissioner for Future Earth. In 2016 he was invested as Member Order of the Volta, for services in research, education and development.
References
- Abdi, H., & Williams, L. J. (2010). Principal component analysis. Wiley Interdisciplinary Reviews: Computational Statistics, 2(4), 433–459. https://doi.org/https://doi.org/10.1002/wics.101
- Achigan-Dako, E. G., Sogbohossou, O. D., Segnon, A. C., N’Danikou, S., Sinsin, A. B., & Vodouhè, S. R. (2013). Agricultural ecological intensification options in the West African Sahel and Dry Savannas: Current knowledge and possible scenario (pp. 84). Bioversity International, West and Central Office.
- Adger, W. N. (2006). Vulnerability. Global Environmental Change, 16(3), 268–281. https://doi.org/https://doi.org/10.1016/j.gloenvcha.2006.02.006
- Ahmed, A., Lawson, E. T., Mensah, A., Gordon, C., & Padgham, J. (2016). Adaptation to climate change or non-climatic stressors in semi-arid regions? Evidence of gender differentiation in three agrarian districts of Ghana. Environmental Development, 20, 45–58. https://doi.org/https://doi.org/10.1016/j.envdev.2016.08.002
- Akohoue, F., Segnon, A. C., & Achigan-Dako, E. G. (2018). Diversity in smallholder citrus orchards and cultivation bottlenecks: Research avenues for improved production in Benin, West Africa. Experimental Agriculture, 54(5), 641–654. https://doi.org/https://doi.org/10.1017/S001447971700028X
- Antwi-Agyei, P., Quinn, C. H., Adiku, S. G. K., Codjoe, S. N. A., Dougill, A. J., Lamboll, R., & Dovie, D. B. K. (2017). Perceived stressors of climate vulnerability across scales in the Savannah zone of Ghana: A participatory approach. Regional Environmental Change, 17, 213–227. https://doi.org/https://doi.org/10.1007/s10113-016-0993-4
- Bathiany, S., Dakos, V., Scheffer, M., & Lenton, T. M. (2018). Climate models predict increasing temperature variability in poor countries. Science Advances, 4(5), eaar5809. https://doi.org/https://doi.org/10.1126/sciadv.aar5809
- Beaman, L., & Dillon, A. (2012). Do household definitions matter in survey design? Results from a randomized survey experiment in Mali. Journal of Development Economics, 98(1), 124–135. https://doi.org/https://doi.org/10.1016/j.jdeveco.2011.06.005
- Ben Mohamed, A. (2011). Climate change risks in Sahelian Africa. Regional Environmental Change, 11(1), 109–117. https://doi.org/https://doi.org/10.1007/s10113-010-0172-y
- Bezdek, J. C., & Hathaway, R. J. (2002, May 12-17). VAT: a tool for visual assessment of (cluster) tendency [Paper presentation]. Proceedings of the 2002 International Joint Conference on Neural Networks IJCNN'02 (Cat. No.02CH37290), Honolulu, HI, USA.
- Biasutti, M. (2019). Rainfall trends in the African Sahel: Characteristics, processes, and causes. Wiley Interdisciplinary Reviews: Climate Change, 10(0), e591. https://doi.org/https://doi.org/10.1002/wcc.591
- Bichet, A., & Diedhiou, A. (2018). West African Sahel has become wetter during the last 30 years, but dry spells are shorter and more frequent. Climate Research, 75(2), 155–162. https://doi.org/https://doi.org/10.3354/cr01515
- Bohle, H. G., Downing, T. E., & Watts, M. J. (1994). Climate change and social vulnerability: Toward a sociology and geography of food insecurity. Global Environmental Change, 4(1), 37–48. https://doi.org/https://doi.org/10.1016/0959-3780(94)90020-5
- Brooks, N., Neil Adger, W., & Mick Kelly, P. (2005). The determinants of vulnerability and adaptive capacity at the national level and the implications for adaptation. Global Environmental Change, 15(2), 151–163. https://doi.org/https://doi.org/10.1016/j.gloenvcha.2004.12.006
- Butt, T. A., McCarl, B. A., Angerer, J., Dyke, P. T., & Stuth, J. W. (2005). The economic and food security implications of climate change in Mali. Climatic Change, 68(3), 355–378. https://doi.org/https://doi.org/10.1007/s10584-005-6014-0
- Cardona, O. D. (2004). The need for rethinking the concepts of vulnerability and risk from a holistic perspective: A necessary review and Criticism for effective risk management. In G. Bankoff, G. Frerks, & D. Hilhorst (Eds.), Mapping vulnerability: Disasters, development and people (pp. 37–51). Earthscan.
- Chambers, R. (1989). Editorial introduction: Vulnerability, coping and policy. IDS Bulletin, 20(2), 1–7. https://doi.org/https://doi.org/10.1111/j.1759-5436.1989.mp20002001.x
- Crane, T. A., Delaney, A., Tamás, P. A., Chesterman, S., & Ericksen, P. (2017). A systematic review of local vulnerability to climate change in developing country agriculture. Wiley Interdisciplinary Reviews: Climate Change, e464. https://doi.org/https://doi.org/10.1002/wcc.464
- Cutter, S. L. (1996). Vulnerability to environmental hazards. Progress in Human Geography, 20(4), 529–539. https://doi.org/https://doi.org/10.1177/030913259602000407
- Daron, J. D. (2014). Regional climate messages for West Africa CARIAA-ASSAR Working Papers. International Development Research Centre.
- de Sherbinin, A. (2014). Climate change hotspots mapping: What have we learned? Climatic Change, 123(1), 23–37. https://doi.org/https://doi.org/10.1007/s10584-013-0900-7
- Diallo, A., Donkor, E., & Owusu, V. (2020). Climate change adaptation strategies, productivity and sustainable food security in southern Mali. Climatic Change, 159(3), 309–327. https://doi.org/https://doi.org/10.1007/s10584-020-02684-8
- Diffenbaugh, N. S., & Giorgi, F. (2012). Climate change hotspots in the CMIP5 global climate model ensemble. Climatic Change, 114(3), 813–822. https://doi.org/https://doi.org/10.1007/s10584-012-0570-x
- Ebi, K. L., Padgham, J., Doumbia, M., Kergna, A., Smith, J., Butt, T., & McCarl, B. (2011). Smallholders adaptation to climate change in Mali. Climatic Change, 108(3), 423–436. https://doi.org/https://doi.org/10.1007/s10584-011-0160-3
- Engle, N. L. (2011). Adaptive capacity and its assessment. Global Environmental Change, 21(2), 647–656. https://doi.org/https://doi.org/10.1016/j.gloenvcha.2011.01.019
- Epule, T. E., Ford, J. D., & Lwasa, S. (2018). Climate change stressors in the Sahel. GeoJournal, 83(6), 1411–1424. https://doi.org/https://doi.org/10.1007/s10708-017-9831-6
- Ford, J. D., Pearce, T., McDowell, G., Berrang-Ford, L., Sayles, J. S., & Belfer, E. (2018). Vulnerability and its discontents: The past, present, and future of climate change vulnerability research. Climatic Change, 151(2), 189–203. https://doi.org/https://doi.org/10.1007/s10584-018-2304-1
- Füssel, H.-M. (2007). Vulnerability: A generally applicable conceptual framework for climate change research. Global Environmental Change, 17(2), 155–167. https://doi.org/https://doi.org/10.1016/j.gloenvcha.2006.05.002
- Füssel, H.-M., & Klein, R. J. T. (2006). Climate change vulnerability assessments: An evolution of conceptual thinking. Climatic Change, 75(3), 301–329. https://doi.org/https://doi.org/10.1007/s10584-006-0329-3
- Gautier, D., Denis, D., & Locatelli, B. (2016). Impacts of drought and responses of rural populations in West Africa: A systematic review. Wiley Interdisciplinary Reviews: Climate Change, 7(5), 666–681. https://doi.org/https://doi.org/10.1002/wcc.411
- Gerlitz, J.-Y., Macchi, M., Brooks, N., Pandey, R., Banerjee, S., & Jha, S. K. (2017). The multidimensional livelihood vulnerability index – an instrument to measure livelihood vulnerability to change in The Hindu Kush Himalayas. Climate and Development, 9(2), 124–140. https://doi.org/https://doi.org/10.1080/17565529.2016.1145099
- Gonzalez, P., Tucker, C. J., & Sy, H. (2012). Tree density and species decline in the African Sahel attributable to climate. Journal of Arid Environments, 78(0), 55–64. https://doi.org/https://doi.org/10.1016/j.jaridenv.2011.11.001
- Hahn, M. B., Riederer, A. M., & Foster, S. O. (2009). The livelihood vulnerability index: A pragmatic approach to assessing risks from climate variability and change – a case study in Mozambique. Global Environmental Change, 19(1), 74–88. https://doi.org/https://doi.org/10.1016/j.gloenvcha.2008.11.002
- Hinkel, J. (2011). “Indicators of vulnerability and adaptive capacity”: Towards a clarification of the science–policy interface. Global Environmental Change, 21(1), 198–208. https://doi.org/https://doi.org/10.1016/j.gloenvcha.2010.08.002
- Hoegh-Guldberg, O., Jacob, D., Taylor, M., Bindi, M., Brown, S., Camilloni, I., Diedhiou, A., Djalante, R., Ebi, K. L., Engelbrecht, F., Guiot, J., Hijioka, Y., Mehrotra, S., Payne, A., Seneviratne, S. I., Thomas, A., Warren, R., & Zhou, G. (2018). Impacts of 1.5°C global warming on natural and human systems. In V. Masson-Delmotte, P. Zhai, H. O. Pörtner, D. Roberts, J. Skea, P. R. Shukla, A. Pirani, W. Moufouma-Okia, C. Péan, R. Pidcock, S. Connors, J. B. R. Matthews, Y. Chen, X. Zhou, M. I. Gomis, E. Lonnoy, T. Maycock, M. Tignor, & T. Waterfield (Eds.), Global warming of 1.5°C. An IPCC Special Report on the impacts of global warming of 1.5°C above pre-industrial levels and related global greenhouse gas emission pathways, in the context of strengthening the global response to the threat of climate change, sustainable development, and efforts to eradicate poverty. World Meteorological Organization.
- Huang, J., Yu, H., Dai, A., Wei, Y., & Kang, L. (2017). Drylands face potential threat under 2 °C global warming target. Nature Climate Change, 7, 417. https://doi.org/https://doi.org/10.1038/nclimate3275
- Husson, F., Lê, S., & Pagès, J. (2017). Exploratory multivariate analysis by example using R (2nd ed.). CRC Press.
- ILO. (2017). Global estimates of child labour: Results and trends, 2012-2016. International Labour Office (ILO).
- Klutse, N. A. B., Ajayi, V. O., Gbobaniyi, E. O., Egbebiyi, T. S., Kouadio, K., Nkrumah, F., Quagraine, K. A., Olusegun, C., Diasso, U., Abiodun, B. J., Lawal, K., Nikulin, G., Lennard, C., & Dosio, A. (2018). Potential impact of 1.5 °C and 2 °C global warming on consecutive dry and wet days over West Africa. Environmental Research Letters, 13(5), 055013. https://doi.org/https://doi.org/10.1088/1748-9326/aab37b
- Kok, M., Lüdeke, M., Lucas, P., Sterzel, T., Walther, C., Janssen, P., Sietz, D., & de Soysa, I. (2016). A new method for analysing socio-ecological patterns of vulnerability. Regional Environmental Change, 16(1), 229–243. https://doi.org/https://doi.org/10.1007/s10113-014-0746-1
- Kpadonou, R. A. B., Owiyo, T., Barbier, B., Denton, F., Rutabingwa, F., & Kiema, A. (2017). Advancing climate-smart-agriculture in developing drylands: Joint analysis of the adoption of multiple on-farm soil and water conservation technologies in West African Sahel. Land Use Policy, 61, 196–207. https://doi.org/https://doi.org/10.1016/j.landusepol.2016.10.050
- Krejcie, R. V., & Morgan, D. W. (1970). Determining sample size for research activities. Educational and Psychological Measurement, 30(3), 607–610. https://doi.org/https://doi.org/10.1177/001316447003000308
- Laris, P., & Foltz, J. (2014). Cotton as catalyst? The role of shifting fertilizer in Mali’s Silent maize Revolution. Human Ecology, 42(6), 857–872. https://doi.org/https://doi.org/10.1007/s10745-014-9694-0
- Laris, P., Foltz, J. D., & Voorhees, B. (2015). Taking from cotton to grow maize: The shifting practices of small-holder farmers in the cotton belt of Mali. Agricultural Systems, 133, 1–13. https://doi.org/https://doi.org/10.1016/j.agsy.2014.10.010
- Lê, S., Josse, J., & Husson, F. (2008). Factominer: An R package for multivariate analysis. Journal of Statistical Software, 25(1), 1–18. https://doi.org/https://doi.org/10.18637/jss.v025.i01
- McDowell, G., Ford, J., & Jones, J. (2016). Community-level climate change vulnerability research: Trends, progress, and future directions. Environmental Research Letters, 11(3), 033001. https://doi.org/https://doi.org/10.1088/1748-9326/11/3/033001
- Miller, F., Osbahr, H., Boyd, E., Thomalla, F., Bharwani, S., Ziervogel, G., Walker, B., Birkmann, J., Van der Leeuw, S., Rockström, J., Hinkel, J., Downing, T., Folke, C., & Nelson, D. (2010). Resilience and vulnerability: Complementary or conflicting concepts? Ecology and Society, 15(3), 11.
- Müller, C., Waha, K., Bondeau, A., & Heinke, J. (2014). Hotspots of climate change impacts in sub-Saharan Africa and implications for adaptation and development. Global Change Biology, 20(8), 2505–2517. https://doi.org/https://doi.org/10.1111/gcb.12586
- Nazari Nooghabi, S., Fleskens, L., Sietz, D., & Azadi, H. (2019). Typology of vulnerability of wheat farmers in Northeast Iran and implications for their adaptive capacity. Climate and Development, 1–14. https://doi.org/https://doi.org/10.1080/17565529.2019.1679072
- Nelson, D. R., Adger, W. N., & Brown, K. (2007). Adaptation to environmental change: Contributions of a resilience framework. Annual Review of Environment and Resources, 32(1), 395–419. https://doi.org/https://doi.org/10.1146/annurev.energy.32.051807.090348
- Nicholson, S. E. (2013). The West African Sahel: A review of recent studies on the rainfall regime and Its Interannual variability. ISRN Meteorology, 2013, 32. https://doi.org/https://doi.org/10.1155/2013/453521
- Nyantakyi-Frimpong, H., & Bezner-Kerr, R. (2015). The relative importance of climate change in the context of multiple stressors in semi-arid Ghana. Global Environmental Change, 32(Supplement C), 40–56. https://doi.org/https://doi.org/10.1016/j.gloenvcha.2015.03.003
- O'Brien, K., Eriksen, S., Nygaard, L. P., & Schjolden, A. N. E. (2007). Why different interpretations of vulnerability matter in climate change discourses. Climate Policy, 7(1), 73–88. https://doi.org/https://doi.org/10.1080/14693062.2007.9685639
- Ouédraogo, M., Houessionon, P., Zougmoré, B. R., & Partey, T. S. (2019). Uptake of climate-smart agricultural technologies and practices: Actual and potential adoption rates in the climate-smart village site of Mali. Sustainability, 11(17), 4710. https://doi.org/https://doi.org/10.3390/su11174710
- Ouédraogo, M., Zougmoré, R., Moussa, A. S., Partey, S. T., Thornton, P. K., Kristjanson, P., Ndour Ndèye, Y. B., Somé, L., Naab, J., Boureima, M., Diakité, L., & Quiros, C. (2016). Markets and climate are driving rapid change in farming practices in savannah West Africa. Regional Environmental Change, 1–13. https://doi.org/https://doi.org/10.1007/s10113-016-1029-9
- Pagès, J. (2014). Multiple factor analysis by example using R. CRC Press.
- Panthou, G., Lebel, T., Vischel, T., Quantin, G., Sane, Y., Ba, A., Ndiaye, O., Diongue-Niang, A., & Diopkane, M. (2018). Rainfall intensification in tropical semi-arid regions: The Sahelian case. Environmental Research Letters, 13(6), 064013. https://doi.org/https://doi.org/10.1088/1748-9326/aac334
- R Core Team. (2019). R: A language and environment for statistical computing. http://www.R-project.org/
- Rao, N., Lawson, E. T., Raditloaneng, W. N., Solomon, D., & Angula, M. N. (2019). Gendered vulnerabilities to climate change: Insights from the semi-arid regions of Africa and Asia. Climate and Development, 11(1), 14–26. https://doi.org/https://doi.org/10.1080/17565529.2017.1372266
- Räsänen, A., Juhola, S., Nygren, A., Käkönen, M., Kallio, M., Monge Monge, A., & Kanninen, M. (2016). Climate change, multiple stressors and human vulnerability: A systematic review. Regional Environmental Change, 16(8), 2291–2302. https://doi.org/https://doi.org/10.1007/s10113-016-0974-7
- Reed, M. S., Podesta, G., Fazey, I., Geeson, N., Hessel, R., Hubacek, K., Letson, D., Nainggolan, D., Prell, C., Rickenbach, M. G., Ritsema, C., Schwilch, G., Stringer, L. C., & Thomas, A. D. (2013). Combining analytical frameworks to assess livelihood vulnerability to climate change and analyse adaptation options. Ecological Economics, 94(0), 66–77. https://doi.org/https://doi.org/10.1016/j.ecolecon.2013.07.007
- Riede, J. O., Posada, R., Fink, A. H., & Kaspar, F. (2016). What’s on the 5th IPCC Report for West Africa? In J. A. Yaro & J. Hesselberg (Eds.), Adaptation to climate change and variability in rural West Africa (pp. 7–23). Springer International Publishing.
- Rousseeuw, P. J. (1987). Silhouettes: A graphical aid to the interpretation and validation of cluster analysis. Journal of Computational and Applied Mathematics, 20, 53–65. https://doi.org/https://doi.org/10.1016/0377-0427(87)90125-7
- Salack, S., Klein, C., Giannini, A., Sarr, B., Worou, O. N., Belko, N., Bliefernicht, J., & Harald, K. (2016). Global warming induced hybrid rainy seasons in the Sahel. Environmental Research Letters, 11(10), 104008. https://doi.org/https://doi.org/10.1088/1748-9326/11/10/104008
- Salack, S., Sarr, B., Sangare, S., Ly, M., Sanda, I., & Kunstmann, H. (2015). Crop-climate ensemble scenarios to improve risk assessment and resilience in the semi-arid regions of West Africa. Climate Research, 65, 107–121. https://doi.org/https://doi.org/10.3354/cr01282
- Sanogo, S., Fink, A. H., Omotosho, J. A., Ba, A., Redl, R., & Ermert, V. (2015). Spatio-temporal characteristics of the recent rainfall recovery in West Africa. International Journal of Climatology, 35(15), 4589–4605. https://doi.org/https://doi.org/10.1002/joc.4309
- Sarr, B. (2012). Present and future climate change in the semi-arid region of West Africa: A crucial input for practical adaptation in agriculture. Atmospheric Science Letters, 13(2), 108–112. https://doi.org/https://doi.org/10.1002/asl.368
- Segnon, A. C. (2019). Exploring agrobiodiversity-based climate change adaptation in semi-arid areas of West Africa: a case study in Mali [PhD thesis]. University of Ghana, Accra, Ghana.
- Sidibé, A., Totin, E., Thompson-Hall, M., Traoré, O. T., Sibiry Traoré, P. C., & Olabisi, L. S. (2018). Multi-scale governance in agriculture systems: Interplay between national and local institutions around the production dimension of food security in Mali. NJAS – Wageningen Journal of Life Sciences, 84, 94–102. https://doi.org/https://doi.org/10.1016/j.njas.2017.09.001
- Sietz, D., Lüdeke, M. K. B., & Walther, C. (2011). Categorisation of typical vulnerability patterns in global drylands. Global Environmental Change, 21(2), 431–440. https://doi.org/https://doi.org/10.1016/j.gloenvcha.2010.11.005
- Sietz, D., Mamani Choque, S. E., & Lüdeke, M. K. B. (2012). Typical patterns of smallholder vulnerability to weather extremes with regard to food security in the Peruvian Altiplano. Regional Environmental Change, 12(3), 489–505. https://doi.org/https://doi.org/10.1007/s10113-011-0246-5
- Sissoko, K., van Keulen, H., Verhagen, J., Tekken, V., & Battaglini, A. (2011). Agriculture, livelihoods and climate change in the West African Sahel. Regional Environmental Change, 11(1), 119–125. https://doi.org/https://doi.org/10.1007/s10113-010-0164-y
- Smit, B., & Wandel, J. (2006). Adaptation, adaptive capacity and vulnerability. Global Environmental Change, 16(3), 282–292. https://doi.org/https://doi.org/10.1016/j.gloenvcha.2006.03.008
- Sultan, B., & Gaetani, M. (2016). Agriculture in West Africa in the twenty-first century: Climate change and impacts Scenarios, and Potential for adaptation. Frontiers in Plant Science, 7, 1262. https://doi.org/https://doi.org/10.3389/fpls.2016.01262
- Sultan, B., Guan, K., Kouressy, M., Biasutti, M., Piani, C., Hammer, G. L., McLean, G., & Lobell, D. B. (2014). Robust features of future climate change impacts on sorghum yields in West Africa. Environmental Research Letters, 9(10), 104006. https://doi.org/https://doi.org/10.1088/1748-9326/9/10/104006
- Sultan, B., Roudier, P., Quirion, P., Alhassane, A., Muller, B., Dingkuhn, M., Ciais, P., Guimberteau, M., Traore, S., & Baron, C. (2013). Assessing climate change impacts on sorghum and millet yields in the Sudanian and Sahelian savannas of West Africa. Environmental Research Letters, 8(1), 014040. https://doi.org/https://doi.org/10.1088/1748-9326/8/1/014040
- Sylla, M. B., Elguindi, N., Giorgi, F., & Wisser, D. (2016). Projected robust shift of climate zones over West Africa in response to anthropogenic climate change for the late twenty-first century. Climatic Change, 134(1), 241–253. https://doi.org/https://doi.org/10.1007/s10584-015-1522-z
- Sylla, M. B., Nikiema, P. M., Gibba, P., Kebe, I., & Klutse, N. A. B. (2016). Climate change over West Africa: Recent trends and future projections. In J. A. Yaro & J. Hesselberg (Eds.), Adaptation to climate change and variability in Rural West Africa (pp. 25–40). Springer International Publishing.
- Thomas, K., Hardy, R. D., Lazrus, H., Mendez, M., Orlove, B., Rivera-Collazo, I., Roberts, J. T., Rockman, M., Warner, B. P., & Winthrop, R. (2019). Explaining differential vulnerability to climate change: A social science review. Wiley Interdisciplinary Reviews: Climate Change, 10(2), e565. https://doi.org/https://doi.org/10.1002/wcc.565
- Tonmoy, F. N., El-Zein, A., & Hinkel, J. (2014). Assessment of vulnerability to climate change using indicators: A meta-analysis of the literature. Wiley Interdisciplinary Reviews: Climate Change, 5(6), 775–792. https://doi.org/https://doi.org/10.1002/wcc.314
- Traore, B., Descheemaeker, K., van Wijk, M. T., Corbeels, M., Supit, I., & Giller, K. E. (2017). Modelling cereal crops to assess future climate risk for family food self-sufficiency in southern Mali. Field Crops Research, 201, 133–145. https://doi.org/https://doi.org/10.1016/j.fcr.2016.11.002
- Turco, M., Palazzi, E., von Hardenberg, J., & Provenzale, A. (2015). Observed climate change hotspots. Geophysical Research Letters, 42(9), 3521–3528. https://doi.org/https://doi.org/10.1002/2015GL063891
- Vidal Merino, M., Sietz, D., Jost, F., & Berger, U. (2019). Archetypes of climate vulnerability: A mixed-method approach applied in the Peruvian Andes. Climate and Development, 11(5), 418–434. https://doi.org/https://doi.org/10.1080/17565529.2018.1442804
- Vincent, K., & Cull, T. (2014). Using indicators to assess climate change Vulnerabilities: Are there lessons to learn for emerging loss and damage debates? Geography Compass, 8(1), 1–12. https://doi.org/https://doi.org/10.1111/gec3.12105
- Williams, P. A., Crespo, O., Abu, M., & Simpson, N. P. (2018). A systematic review of how vulnerability of smallholder agricultural systems to changing climate is assessed in Africa. Environmental Research Letters, 13(10), 103004. https://doi.org/https://doi.org/10.1088/1748-9326/aae026
- You, L., Ringler, C., Wood-Sichra, U., Robertson, R., Wood, S., Zhu, T., Nelson, G., Guo, Z., & Sun, Y. (2011). What is the irrigation potential for Africa? A combined biophysical and socioeconomic approach. Food Policy, 36(6), 770–782. https://doi.org/https://doi.org/10.1016/j.foodpol.2011.09.001
- Zhang, W., Brandt, M., Tong, X., Tian, Q., & Fensholt, R. (2018). Impacts of the seasonal distribution of rainfall on vegetation productivity across the Sahel. Biogeosciences (online), 15(1), 319–330. https://doi.org/https://doi.org/10.5194/bg-15-319-2018
- Zougmoré, R., Partey, S., Ouédraogo, M., Omitoyin, B., Thomas, T., Ayantunde, A., Ericksen, P., Said, M., & Jalloh, A. (2016). Toward climate-smart agriculture in West Africa: A review of climate change impacts, adaptation strategies and policy developments for the livestock, fishery and crop production sectors. Agriculture & Food Security, 5(1), 26. doi:https://doi.org/10.1186/s40066-016-0075-3