
Abstract
With increased mobile traffic to fashion retailers’ websites, conversion rates are lower than for desktop users. Mobile consumers more readily abandon retailers if not satisfied with their shopping experience. There is a dearth of literature involving Google Analytics to analyze digital consumer shopping behavior and customer journeys. Retailers need to innovate the ways they approach the vast amount of digital analytics data. This research highlights the need for continuous auditing of Google Analytics data to ensure retailers understand the behavior of their mobile consumers and respond to their needs accordingly. A multi-method research design incorporated mobile fashion consumer data from Google Analytics, innovative mobile eye tracking technology and retrospective think aloud. A comparison of consumer shopping journeys showed that a Digital User Journey Mapping Framework based on eye tracking data can be used to audit Google Analytics datasets and to understand what elements of the fashion retailer’s website consumers prefer to interact with. Retrospective think aloud interviews complementing eye tracking experiments define how digital user experience can be improved in fashion m-retail. The shopping journey map framework can be used for mobile fashion consumer behavior analysis, auditing Google Analytics datasets and enhancing digital user experience.
Introduction
Digital marketers face complex decisions requiring a deep knowledge of trends in the area of digital consumer behavior. The rapid changes in this area influenced by the exponential adoption of smartphones, require sophisticated responses to consumer needs. Fashion is the product category with the greatest purchasing penetration globally, with more than half of fashion consumption happening online. The industry’s value is projected to reach $672.71 billion by 2023 (Shopify Citation2022). The UK is a world leader by share of international site traffic on the top fashion websites; its e-commerce is projected to reach 60% of total apparel sales by 2025 (Statista Citation2022a).
Yet, only 51% of mobile consumers are satisfied with available digital shopping platforms (DigitalCommerce360 Citation2020). Eighty-five per cent of mobile retail baskets do not result in a purchase (Statista Citation2022b), leading to abandoning the retailer (V12 Citation2020). With increased mobile traffic to their websites, retailers are missing out on an enormous commercial gain as the conversion rate on mobile devices remains half of desktop websites (Smart Insights Citation2022).
Despite these rapid advances, capturing big data about mobile consumers in real-time remains less well known (Akter et al. Citation2019). This means that gaining insights from retailers’ data analytics to improve marketing decision-making and achieve competitive advantage is in its infancy (Cao, Duan, and El Banna Citation2019). Accordingly, this paper responds to the call for further research into mobile consumer experience beyond insights about website’s traffic, traffic sources, visitors’ devices, time of the visit, impact of advertising campaigns, retention, user experience and commercial activity of the company (Järvinen and Karjaluoto Citation2015). Specifically, it addresses the need to review traditional marketing practices to identify innovative strategies within marketing metrics and analytics areas (Misirlis and Vlachopoulou Citation2018). It offers retailers a roadmap to assess existing Google Analytics (GA) platform and the range of data available about digital users visiting retailers’ websites. Finally, it responds to the call from Tupikovskaja-Omovie and Tyler (Citation2021a) for methodological advances in the fashion m-retail literature by using Google Analytics for mobile consumer shopping behavior analysis with a focus on the customer journey and identifying significant usability issues (Benyon Citation2019).
Mobile website design and user experience have become crucial to attract and retain customers (Camilleri Citation2022) and to compete in the e-commerce market (Huang, Wang, and Ye Citation2022). There is a need for a process-tracing approach of consumer decision-making (Aiolfi, Bellini, and Grandi Citation2022; Zuschke Citation2020) to understand how consumers interact with mobile websites or mobile apps (Raza and Khan Citation2022; Schall Citation2016; Tupikovskaja-Omovie and Tyler Citation2020a). The user experience evaluation on mobile devices is an emerging area of research requiring multi-methods approach, triangulation of multiple datasets (Hussain et al. Citation2018; Lynch and Barnes Citation2020) and novel techniques of visual analysis of mobile eye tracking data (Burch Citation2019; Eraslan, Yesilada, and Harper Citation2016; Kurzhals et al. Citation2016).
The theoretical and methodological contributions of this research are therefore fourfold. First, it offers new insights into the elements of the digital user shopping journey gathered by fashion retailers through Google Analytics. Second, it offers a deeper understanding of the elements of mobile websites that digital users interact with when shopping for fashion products using their smartphones. Third, it offers a route to enhance digital consumer experience through gaining user feedback of using the fashion retailer’s mobile website when purchasing apparel online. Fourth, it offers a methodological framework for auditing Google Analytics datasets to better inform decisions designed to improve the experiences of mobile fashion consumer using m-retail channels.
The following research questions ensue
RQ1: What types of elements of the digital user shopping journey are tracked by the fashion retailer’s Google Analytics database?
RQ2: What elements of the digital user shopping journey do mobile fashion consumers interact with when shopping on the fashion retailer’s website using a smartphone?
RQ3: How is digital consumer experience enhanced through gaining user feedback of using the fashion retailer’s mobile website?
RQ4: How should fashion retailers audit their Google Analytics database to enable improvements of the experience of mobile fashion consumers?
To achieve these goals, the paper is organized as follows: the Literature Review section reviews the literature on Google Analytics in fashion retail, eye tracking research in fashion mobile retail and customer journey mapping. The Methodology section focuses on the research methodology, including sample description, eye tracking settings and data analysis approach, while the Findings section presents and discusses the key results. Finally, the Discussion and Conclusions section elucidates methodological and managerial implications, concluding with limitations and directions for future research.
Literature Review
Google Analytics in fashion retail
Digital user experience on mobile websites has received increasing attention because of its role in e-commerce and omnichannel retailing performance (Alexander and Kent Citation2022). User experience can be evaluated using Google Analytics to improve the website design, utilizing data on system performance, the behaviors and categorizing activities of individuals or their different groups (Benyon Citation2019).
Existing academic studies have tended to use Google Analytics (GA) as a supplementary data source supporting a qualitative research method (Burgess et al. Citation2017), and come from the digital libraries’ domain (Redkina Citation2018), thereby limiting the ability to assess the use of GA data within a fashion m-retailing domain. Given that GA data available to retailers is in an anonymized and fragmented form (Kakatkar and Spann Citation2019), further studies are required to engage with the dynamics of the data discovery, collection and preparation for analysis (Stieglitz et al. Citation2018), and to better understand the impact of user experience and mobile consumer behavior research.
GA data on pageview was used as a component in the usability evaluation (Hasan, Morris, and Probets Citation2013), but it is often difficult to track and relate it to other sources of data. Research utilizing qualitative methods within the GA domain is limited to investigating a link between adoption of business analytics and business performance (Ramanathan et al. Citation2017), opportunities and challenges of marketing teams with the emergence of big data. Within the fashion retail domain, GA can measure the digital channel’s success through website traffic, unique users and online awareness, segment digital customers based on basket sales data (Griva et al. Citation2018; Musalem, Aburto, and Bosch Citation2018) or usage behavior (Aida and Abdul-Rahman Citation2020). Marketing analytics use anonymized and fragmented event-based tracking data as the means of recovering individual-level heterogeneity from the raw data (Kakatkar and Spann Citation2019), these marketing decisions miss out on invaluable knowledge coming from detailed GA data describing consumer behavior at an individual level (Tupikovskaja-Omovie and Tyler Citation2021a). Given the complexity of the fashion retail domain, availability of various shopping channels and need for innovation (Alexander and Kent Citation2021; Azemi et al. Citation2022; Wu, Hitt, and Lou Citation2020), fashion retailers are increasingly concerned by the changes in consumer behavior and ways of maintaining competitive advantage. Therefore, this research takes a novel staged approach to assess mobile consumer behavior and enhancing user experience journey through using GA data along other research methods.
Eye tracking research in fashion mobile retail
Eye tracking technology has proved useful for tracking users’ changing focus on different areas of the website (Boardman, McCormick, and Henninger Citation2022), and measuring fixation lengths and durations (Benyon Citation2019). Research attempting to collect deep insights about mobile fashion user experience (Bojko Citation2013) remain scarce, even though the use of mobile devices in-stores can lead to increased purchases (Grewal et al. Citation2018), and eye tracking technology offers researchers an objective tool for data gathering about visual consumer behavior (King et al. Citation2019).
Previous research used eye tracking technology to analyze the differences in behavior on different screen sizes and the influence on consumers’ attention and purchase intention (Wang et al. Citation2017). Prior studies attempting to document digital user experience in the retail domain remain scarce, even though it can capture user attention to web design elements and images on e-commerce websites (Gidlöf et al. Citation2012; Haesner et al. Citation2018; Jahanian, Keshvari, and Rosenholtz Citation2018; Lamberz et al. Citation2018; Wang et al. Citation2014), e-commerce search behavior (Ahn et al. Citation2018; Cortiñas et al. Citation2019a; Hautala et al. Citation2018; Huddleston et al. Citation2018; Kessler and Zillich Citation2019; Cortiñas, Chocarro, and Villanueva Citation2019b), the effect of the background of a product image on consumer attention and how consumers process reviews online (Maslowska et al. Citation2020; Fu et al. Citation2020).
A few prior studies used eye tracking experiments with fashion websites (Boardman and McCormick Citation2021; Boardman, McCormick, and Henninger Citation2022; Huddleston et al. Citation2015) but are limited with regard to mobile fashion retail settings with a focus on fashion websites on smartphones (Tupikovskaja-Omovie and Tyler Citation2020b; Tupikovskaja-Omovie et al. Citation2015), despite scholarly and practitioner recognition that mobile website traffic increased but conversion rates remain low (Kannan and Kulkarni Citation2022; Smart Insights Citation2022).
Past research with fashion websites used manipulated static stimuli to simulate online or in-store environments and research into the actual shopping process online is limited (Huddleston et al. Citation2015; Tupikovskaja-Omovie and Tyler Citation2019) and excluded payment (Gidlöf et al. Citation2012), which is a crucial part of the user shopping journey on smartphones (Tupikovskaja-Omovie and Tyler Citation2018).
Retailers can enhance consumers’ shopping experiences by offering relevant digital shopping formats (Wagner, Schramm-Klein, and Steinmann Citation2020) for unified shopping experiences (Savastano et al. Citation2019). Furthermore, mobile eye tracking technology on fashion retailers’ websites and mobile apps can be used for consumer shopping journey development (Tupikovskaja-Omovie and Tyler Citation2018) and clustering digital fashion consumers based on browsing and shopping behavior patterns (Tupikovskaja-Omovie and Tyler Citation2020a), and digital fashion marketing professionals can target mobile consumers and offer a personalized shopping experience. Therefore, in contrast with prior studies (including those by the author), this research takes a novel, dynamic approach necessary to understand the nature and extent of user experience in fashion m-retail by analyzing user experience on mobile websites using mobile eye tracking experiments including the whole user shopping journey (Tupikovskaja-Omovie and Tyler Citation2018).
Customer journey mapping
Companies use customer journey as a lens for “seeing services as people do” (Parker and Heapy Citation2006) and can offer a personalized customer experience and shopping journey through understanding how consumers interact with diverse shopping channels (Barwitz and Maas Citation2018). In omnichannel fashion retailing, in-store technology implementation is still limited but shows that retailers can enhance customer experience by implementing a “technology-enabled customer shopping journey in-store” (Alexander and Kent Citation2021). Within the marketing domain, an effective customer journey design is an important approach in understanding consumer behavior (Kuehnl, Jozic, and Homburg Citation2019), the impact of digital strategies on consumer decision-making process and individual service experience (Dasgupta and Grover Citation2019; Halvorsrud, Kvale, and Følstad Citation2016). Existing studies defined the customer journey by multiple stages of awareness, familiarity, consideration, purchase, and loyalty (Farah, Ramadan, and Harb Citation2019), or pre-purchase, purchase, and post-purchase experiences and behavior (Lemon and Verhoef Citation2016; Voorhees et al. Citation2017), thereby limiting the ability to assess changes in consumer behavior and user experience driven by the use of smartphones for fashion shopping.
Customer journey maps are used as visualization techniques to represent the flow of unfolding shopping experiences (Halvorsrud, Kvale, and Følstad Citation2016) and the viewpoint of the customer (Følstad and Kvale Citation2018). Recent studies extended the existing conceptual customer journey framework to visually map purchase stages (Alexander and Kent Citation2022; Rudkowski et al. Citation2020) and analyzed consumer attention on the user shopping journey within the retailer’s homepage (Boardman, McCormick, and Henninger Citation2022). Whilst prior research reconstructed the individual customer journey based on data from interviews, diary studies and process tracking from back-end systems, clickstream data (Halvorsrud, Kvale, and Følstad Citation2016), reconstructed by participants and surveys (Herhausen et al. Citation2019), these methods of data collection are often based on generic touch points derived from focus groups (Vakulenko et al. Citation2019) or previous literature (Lemon and Verhoef Citation2016; Voorhees et al. Citation2017). Existing studies have tended to investigate the path to purchase (Cortiñas, Chocarro, and Villanueva Citation2019b) using simulated websites, thereby limiting the ability to analyze the actual experiences during the shopping journey documenting actual elements and features of the website consumers interact with.
Given that mobile website traffic is increasing and consumer desire to use smartphones for shopping is strong, further studies are required to engage with the dynamics of the m-retail channel from the mobile consumer perspective and to better understand user experience with live retail websites accessed by smartphones (Tupikovskaja-Omovie and Tyler Citation2019). Prior studies tended to understand user experience on mobile devices by presenting users with manipulated screens (Jeske, Briggs, and Coventry Citation2016), thereby limiting the ability to understand mobile consumers’ experience and preferences during the actual purchasing stage (Tupikovskaja-Omovie and Tyler Citation2020b).
Research attempting to use GA data for digital consumer research in mobile retailing remain scarce, even though it is a key tool in marketing decision-making and even less so from a fashion m-retail perspective (Tupikovskaja-Omovie and Tyler Citation2021a). Moreover, few prior studies take the consumer shopping journey approach to research design and none within GA with a focus on smartphone usage, despite scholarly and practitioner recognition that novel approaches to marketing analytics and user journey are necessary to understand the changing mobile fashion consumer behavior. Therefore, in contrast with prior studies, this research takes a novel, staged multi-methods research approach to assess mobile consumer experience within the fashion m-retail context, incorporating Google Analytics, Eye Tracking and Retrospective Think Aloud datasets.
Methodology
As this research was interested in tracking mobile consumer experience in fashion m-retail, an exploratory multi-methods perspective (Lynch and Barnes Citation2020), using Google Analytics (GA), mobile Eye Tracking technology (ET) and Retrospective Think Aloud (RTA) interviews, was deployed. These methods provide access to in-depth knowledge about mobile user experience, preferred elements of the website and issues observed (Benyon Citation2019). A multi-methods perspective and data triangulation are often embodied in user experience design to generate a deeper understanding of underdeveloped areas such as mobile consumer behavior, and to overcome issues regarding research validity and rigor (Walker and Federici Citation2018). In this study, it provided clarity on the process of user experience analyzed and compared through the shopping journey framework.
Thus, the user journey mapping framework (Tupikovskaja-Omovie and Tyler Citation2018) was utilized for data visualization (Burch Citation2019), and comparison of user journeys from different datasets (Tupikovskaja-Omovie and Tyler Citation2021b), provided insights about users’ behavior patterns (Tupikovskaja-Omovie and Tyler Citation2020b). A major retailer of fashion leisurewear was involved in this study, it is anonymized for the analysis and cannot be revealed due to the non-disclosure agreement. In this paper, this fashion leisurewear company is called “the fashion retailer.” Its current online business has over 310,000 unique users per year, and over 52% of them use smartphones to access the website. However, the fashion retailer’s conversion rate for mobile is lower than that for desktop.
Mobile fashion consumers’ shopping journeys were developed based on GA and ET data gathered in parallel with the same sample of participants (Tupikovskaja-Omovie and Tyler Citation2021a), and 14 mobile fashion consumers accessed the fashion retailer’s website on smartphones. In addition, RTAs were gathered with each participant upon completing the ET experiment. Each participant viewed the recording of their interaction with the fashion retailer’s website and were encouraged to talk aloud about what they were doing, feeling or trying to achieve at that point. These RTAs were audio recorded and transcribed for analysis.
Sample
According to the fashion retailer’s GA database, the majority of the retailer’s mobile customers use iPhones. This informed a purposive sampling technique, and the participants were recruited based on the following criteria to ensure the validity of the data: they own an iPhone and have experience shopping on smartphones on the fashion retailer’s website (Tupikovskaja-Omovie and Tyler Citation2021b). A total of 14 participants successfully completed this study, female, aged 18 to 34 years old. These participants (recruited by the fashion retailer) were given a promotional voucher for the retailer’s website as an incentive to join this study (provided by the fashion retailer).
Eye tracking settings
For this research, mobile eye tracking technology (SMI Eye Tracking Glasses 2.0 with smartphone-based recorder by SensoMotoric Instruments) was used to document digital fashion consumers’ browsing and shopping behavior using smartphones on the fashion retailer’s website. In order to ensure equally identical conditions for all participants and eliminate potential bias, all participants were given the same smartphone, iPhone 8, connected to the same Wi-Fi during the eye tracking experiments.
The participants had to browse the fashion retailer’s website using the smartphone provided and purchase up to two items from the fashion retailer’s website within a set budget of £55. In order to achieve a natural and unobtrusive settings for this research, mobile eye tracking glasses were employed to record users’ interactions with the fashion retailer’s website. This allowed the participant to hold the smartphone in the way they felt comfortable whilst sitting in any position they liked. SMI BeGaze 3.7 software was used to extract the eye tracking data files for analysis.
Data analysis
Mobile ET data analysis, when data files are dynamic visualizations in a form of video files, still remains challenging. The fashion retailer’s website has over 14,300 pages indexed on Google (Sitechecker Citation2020), allowing for a vast diversity of web pages to be visited by the participants. Prior research found no link between website design elements of page usability and numeric eye tracking data, and this study required a novel method of mobile user behavior research considering all elements of web pages visited by mobile users (Eraslan, Yesilada, and Harper Citation2016). The shopping journey framework, accounting for “the whole shopping process through from initial search to the payment” (Tupikovskaja-Omovie and Tyler Citation2018), was utilized for analysis of mobile consumers’ behavior on the fashion retailer’s website.
Two sets of shopping journeys were developed, one based on GA data (), and another based on ET data (). Both reveal elements of the website used by the participants, the flow of the browsing and purchasing behavior, including areas users viewed, clicked and have looked at without clicking on anything.
Figure 1 Shopping journey developed based on GA data (participant P11).
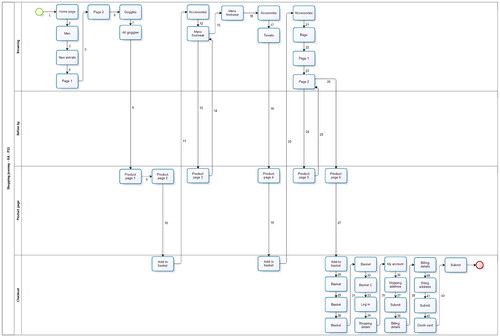
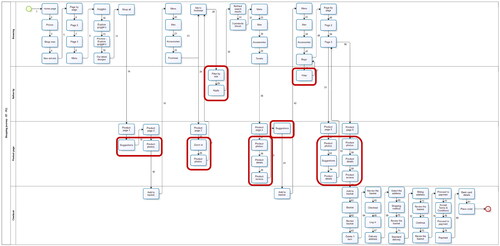
Figure 2 Shopping journey developed based on ET data (participant P11).
As this study uses staged multi-methods approach, RTAs were conducted after each ET experiment, these interviews were audio recorded and transcribed. These interviews are qualitative datasets for user experience evaluation alongside ET data collection. The RTA interviews were based on each individual participant’s experience using the fashion retailer’s website rather than semi-structured interview protocol. Therefore, the commonly used coding and themes were not applied in analyzing the RTAs. The RTAs helped to assess user feedback highlighting any issues or user pain points not documented via other research methods (Benyon Citation2019; Bojko Citation2013; Tupikovskaja-Omovie et al. Citation2015). Comparison of user experience journeys, the elements that were tracked using GA and ET, and RTAs associated with each ET user journey, are discussed in more detail in the Findings section.
Findings
Elements of the mobile user shopping journey tracked by the fashion retailer’s Google Analytics database
Following the data gathering approach on the fashion retailer’s GA database (described in Tupikovskaja-Omovie and Tyler Citation2021a), this study gathered information about digital users’ activities on the retailer’s website from the “User Explorer” reports. The user shopping journeys developed based on these reports tracked the following elements used by the mobile consumer on the website: pages visited, “filtering,” “sort by,” “view all,” “size guide,” product pages visited, products added to the basket, time spent visiting a page and checkout. The participant P11 () relied on the “menu” of the website to find desired products and visited several categories: “new arrivals,” “goggles,” and “accessories.” Upon viewing various sections of the website, this user visited six separate product pages and added three to the basket. The total shopping journey (P11) accounts for 43 steps, 19 of which are within the browsing stage, 6 on product pages and 19 within the checkout.
Elements of the mobile user shopping journey that mobile fashion consumers interact with when shopping on the fashion retailer’s website using a smartphone
In contrast, ET technology offered a more comprehensive and detailed insight about the actual mobile consumer behavior on the fashion retailer’s website. The shopping journey developed for the same user (P11) based on ET (), documented the following elements: “promotional banners” viewed and clicked, “filtering,” “sort by,” “view all,” product pages visited, products added to basket, photos viewed, “zoom” used, “size guide,” product “details” and “reviews” read, looking at “suggestions” and clicks on “suggested product.” Most significantly, this shopping user journey captures 81 steps in total, 35 of which are within the browsing stage, three for filtering, 20 on product pages and 24 steps at the checkout stage. The next sub-section explores the user feedback through RTAs about using the fashion retailer’s website on smartphone.
Enhancing mobile consumer experience through gaining user feedback about using the fashion retailer’s mobile website
Each RTA followed immediately after the ET experiment, was moderated by the researcher face-to-face and lasted 20–30 minutes. Given the study’s natural and unobtrusive settings for this research, the range of web pages available and participants’ freedom to browse “as they usually do,” RTAs applied no protocol for interview and the follow up questions were determined by the stage of the shopping journey and unusual behavior of the participant or the website. The dynamic user experience data were analyzed using thematic analysis linking to the shopping journey framework, its key stages and elements of the website to ensure consistency of understanding.
Shopping experiences on a mobile some are great, some really hard… can be hit or miss thus many fashion consumers tend to look in more detail on a computer and complete their purchases on a desktop. It was found that the same digital user accessing the website on a smartphone via a different browser is tracked with independent Client IDs (Tupikovskaja-Omovie and Tyler Citation2021a). Thus, GA was unable to link the same user’s shopping experiences when migrating across channels and there is a need to focus on enhancing GA tools to capture omnichannel shopping experience on those kinds of sites that allow… cross device usage.
Many participants associated “shop men” or “shop women” buttons from the home page with the actual category for menswear or womenswear, and were disappointed that it had less products than the original category from the menu with the same title and thought that seemed a bit limited. The users expected to see all the products of that category, but were presented with a limited mix of products from different categories.
The “size guide” was documented by both GA and ET, and 6 out of 14 participants checked the “size guide” during their shopping journey. The retailer needs to understand what consumers do on product pages. RTAs revealed major issues with “size guide” requiring further improvements because the user needed [size] twelve… the size chart didn’t quite match up with the size that was offered on the product page.
Although, the fashion retailer’s GA recorded all instances of adding products to the basket, not all participants agreed it was flawless as when they added that to the basket I wasn’t really sure if it added to the basket or not. The website did not provide any notification of the action completed.
Many participants were confused by the “+” button next to product photos, they thought it was add to basket button. The mobile consumers bring their past experiences when interacting with websites: certain functions you’d expect to work, the scroll up and down with your finger to make the website move, the scroll left and right to go through images and the pinch to zoom in. Unfortunately, not all websites are standardized, and in order to enhance user experience, retailers need to utilize mobile users’ feedback to understand these users’ preferences using the website, as failing to do so may unwittingly encourage them to divert to competitors offering a better user experience.
Auditing the fashion retailer’s Google Analytics database to improve the mobile user experience
The comparison of the shopping journeys (GA and ET) ( and ) reveals that GA and ET user journeys differ in a number of areas, and differences are encircled in red in , highlighting the elements and steps that were not documented through the GA (). Firstly, major differences were observed in relation to the numbers of steps conducted by each participant that were recorded using GA and ET. The average total number of steps on the GA journeys is just 42, with browsing stage 19 steps, 5 on product pages and 18 at the checkout. For ET, it is around 80 steps in total, 37 browsing, 12 on product pages and 27 at the checkout. Secondly, the number of elements of the website used by participants and documented through GA and ET are different (). Within the browsing stage, 10 participants used the “filtering” option, but GA only recorded the use of filtering in four out of 10 cases. “Sort by” function was used by three users, but documented in one case by GA. The only elements documented equally by both GA and ET were: “view all” search results, “size guide” on product pages, the number of products visited and added to the basket.
Table 1. Comparison of elements of the website used during the shopping journey developed based on ET and GA data.
The following elements were omitted by GA and not documented: “promotions,” product photos, “zoom” function, “product description,” “product reviews,” “suggested products” and, most importantly, if clicked on any of the “suggested” products. “Filtering” and “sort by” functions were documented via GA, but not in all instances.
The fashion retailer can use the findings from the shopping journeys comparison to identify the areas of the website to configure for the GA database in order to capture the whole shopping experience of their customers. Furthermore, it is important to relate these gaps to their role within the shopping journey. For instance, the elements of the website that were not recorded by GA, namely filtering, photos, zoom, product details, reviews and suggestions, could be enhanced through users’ feedback by implementing the redesign of the website and adding interactive design requirements that could be tracked through GA.
This section focuses on triangulating the findings from previous sub-sections to propose the roadmap for retailers to audit the GA database and enhance mobile consumer experience. RTAs with each participant followed the flow of the shopping journey as they interacted with the website. P11 () wanted to use “filtering” while browsing, as they appreciate having filters to stop wasting… time with looking at stuff that are not [going to] fit. When visiting the product pages, the photos’ zoom option was a bit odd, like the carousel this swiping through, and the user struggled to find where the [product] details were, like the size of it… you’d want some sort of product description with the product, there were just pictures. These mobile consumers expect to be able to achieve their goal on mobile devices during a break at lunch time… just quickly do it, but often it’s not obvious straight away then you might not get there in the first place. This user struggled to see product reviews’ location on the website … felt like you have to look for it, things like reviews I’d expect to expand out. The “suggestions” which were not tracked via GA, proved very important with half of the participants looking at the suggested products: the other products at the bottom prompted me that I wanted to look for a bag so… I looked for that.
In order to satisfy the mobile users’ needs, the fashion retailer needs to make sure their users do not struggle when browsing or accessing product pages, and are able to find all relevant information, including, product description, reviews, size guide and suggestions. More importantly, the fashion retailer needs to focus on the mobile users’ feedback when optimizing their mobile website. The knowledge about the required elements on the website from mobile consumers’ perspective can help retailers to convert more customers by triggering more purchases.
Discussion and Conclusions
First, this study contributes to research on enhancing mobile consumer experience when visiting the website of a fashion retailer, and specifically to the elements of the mobile website and how consumers interact with them when shopping on smartphones. Secondly, it offers an approach to enhancing digital consumer experience through gaining user feedback of using the fashion retailer’s mobile website when purchasing apparel online. In doing so, it offers a methodological framework for auditing Google Analytics database and identifying the optimized user journey based on common elements of the website to better inform retailer’s choice concerning improving the mobile fashion consumer experience using m-retail channel.
The findings of the comparison of the shopping journeys developed based on GA and ET data showed that ET can be used not only to identify potential usability issues, but also to audit existing GA dashboard (Tupikovskaja-Omovie and Tyler Citation2021a), and this study extends prior research by adding mobile users’ feedback to understand what fashion consumers’ expectations are when shopping via smartphones. The innovative shopping journey framework proved useful to visually map and identify major gaps in data for further improvement by marketing and digital analytics teams (Kuehnl, Jozic, and Homburg Citation2019). The findings from RTAs, mapped directly to individual elements of the website within the shopping journey, provide invaluable insights about how certain elements of the website should be redesigned to offer easy to use and satisfactory user experience.
This study’s methodological contribution highlights that using multiple methods (Lynch and Barnes Citation2020; Walker and Federici Citation2018), including qualitative users’ feedback during the ET study (Tupikovskaja-Omovie et al. Citation2015), and triangulating the findings (Benyon Citation2019), can deepen an understanding about real-time mobile users’ experience and highlights important issues otherwise missed by either GA or ET.
Due to the infancy of user experience evaluation methods on mobile devices, research in mobile fashion retail requires a staged multi-methods approach and triangulation of findings from various datasets (Benyon Citation2019; Hussain et al. Citation2018) and innovative methods for visual analysis of mobile ET data (Burch Citation2019; Eraslan, Yesilada, and Harper Citation2016; Kurzhals et al. Citation2016), as quantitative data alone cannot explain consumer behavior, especially shopping experience using smartphones (Tupikovskaja-Omovie and Tyler Citation2018). This study extends previous research by using GA, mobile ET and RTAs for data gathering and analysis in order to understand fashion consumers’ shopping journey on smartphones.
The shopping journey mapping framework accounted for all elements of the website and pages visited by users (Eraslan, Yesilada, and Harper Citation2016; Tupikovskaja-Omovie and Tyler Citation2021a). It can therefore be used to compare mobile consumer behavior on mobile apps and websites (Tupikovskaja-Omovie and Tyler Citation2018), cluster digital consumers based on their browsing and purchasing patterns (Tupikovskaja-Omovie and Tyler Citation2020a), gender differences (Tupikovskaja-Omovie and Tyler Citation2020b) and users’ prior experience levels (Tupikovskaja-Omovie and Tyler Citation2021b). This study extended existing knowledge about mobile consumer behavior and shopping journeys by mapping consumer feedback onto the user journey with the goal of influencing the retailer’s GA and the website’s redesign strategy. Future research could investigate if there is a link between an issue on the website and the duration inspecting that element of the website by triangulating ET, GA and RTA data within the same user shopping journey to advance GA use for enhancing mobile consumer experience.
Therefore, from a practical perspective, the findings offer several implications for retailers. First, they increase the retailers’ awareness of diverse GA data types. Second, the findings prompt retailers to innovate and experiment with their GA database to improve the mobile consumer experience, emphasizing that those meeting mobile user needs convert better (Wang et al. Citation2021). Retailers using aggregated data for making marketing decisions overlook invaluable knowledge coming from GA event-based data, which can be improved through parallel GA and ET shopping journey analysis. Thirdly, this study applied the shopping journey framework in the area of digital analytics research to discover how to map a reliable shopping journey based on actual experiences on the fashion retailer’s website. This framework offers a standardized template covering four major shopping journey stages, specifically browsing, personalization, product pages and checkout, and offers an easy-to-follow method for comparison of two seemingly distinct datasets, namely GA and ET, with RTAs offering insights about mobile consumer behavior and digital user experience.
The limitations of the study are its focus on one fashion retailer and the sample size. Similar studies could be undertaken with other fashion retailers and their GA databases. Promising directions for further research include user journey analysis linked to conversion rate. Further, given the associations arising concerning omnichannel and multichannel retailing, further research on digital consumer experience across channels would be useful. Finally, the staged multi-methods approach and user journey framework can be used in future studies to enhance available fashion retailers’ digital analytics data and to improve mobile consumer experience on fashion retailers’ websites on various devices.
Disclosure Statement
No potential conflict of interest was reported by the author.
Additional information
Notes on contributors
Zofija Tupikovskaja-Omovie
Dr Zofija Tupikovskaja-Omovie is a Lecturer in Digital User Experience and Web Design at the School of Digital Arts (SODA), Manchester Metropolitan University. Zofija’s research interests are in Digital User Experience and how eye tracking technology, digital and visual research methods can help to support business development in e-Commerce, AR, VR, XR, Metaverse, websites, mobile apps, games, and other creative industries. [email protected], [email protected]
References
- Ahn, J.-H., Y.-S. Bae, J. Ju, and W. Oh. 2018. “Attention Adjustment, Renewal, and Equilibrium Seeking in Online Search: An Eye-Tracking Approach.” Journal of Management Information Systems 35 (4): 1218–1250. doi:10.1080/07421222.2018.1523595.
- Aida, K., and O. A. Abdul-Rahman. 2020. “Google Users as Sequences: A Robust Hierarchical Cluster Analysis Study.” IEEE Transactions on Cloud Computing 8 (1): 167–179. doi:10.1109/TCC.2017.2766227.
- Aiolfi, S., S. Bellini, and B. Grandi. 2022. “Using Mobile While Shopping in-Store: A New Model of Impulse-Buying Behaviour.” Journal of Consumer Marketing 39 (5): 432–444. doi:10.1108/JCM-05-2020-3823.
- Akter, S., R. Bandara, U. Hani, S. Fosso Wamba, C. Foropon, and T. Papadopoulos. 2019. “Analytics-Based Decision-Making for Service Systems: A Qualitative Study and Agenda for Future Research.” International Journal of Information Management 48: 85–95. doi:10.1016/j.ijinfomgt.2019.01.020.
- Alexander, B., and A. Kent. 2021. “Tracking Technology Diffusion in-Store: A Fashion Retail Perspective.” International Journal of Retail & Distribution Management 49 (10): 1369–1390. doi:10.1108/IJRDM-05-2020-0191.
- Alexander, B., and A. Kent. 2022. “Change in Technology-Enabled Omnichannel Customer Experiences in-Store.” Journal of Retailing and Consumer Services 65: 102338. doi:10.1016/j.jretconser.2020.102338.
- Azemi, I., W. Ozuem, R. Wiid, and A. Hobson. 2022. “Luxury Fashion Brand Customers’ Perceptions of Mobile Marketing: Evidence of Multiple Communications and Marketing Channels.” Journal of Retailing and Consumer Services 66: 102944. doi:10.1016/j.jretconser.2022.102944.
- Barwitz, N., and P. Maas. 2018. “Understanding the Omnichannel Customer Journey: Determinants of Interaction Choice.” Journal of Interactive Marketing 43: 116–133. doi:10.1016/j.intmar.2018.02.001.
- Benyon, D. 2019. Designing User Experience: A Guide to Hci, ux and Interaction Design. 4th ed. Harlow, UK: Pearson.
- Boardman, R., and H. McCormick. 2021. “Attention and Behaviour on Fashion Retail Websites: An Eye-Tracking Study.” Information Technology & People. doi:10.1108/ITP-08-2020-0580.
- Boardman, R., H. McCormick, and C. E. Henninger. 2022. “Exploring Attention on a Retailer’s Homepage: An Eye-Tracking & Qualitative Research Study.” Behaviour & Information Technology: 1–17. doi:10.1080/0144929X.2022.2059396.
- Bojko, A. 2013. Eye Tracking the User Experience: A Practical Guide to Research. Brooklyn, NY: Rosenfeld Media.
- Burch, M. 2019. “Interaction Graphs: Visual Analysis of Eye Movement Data from Interactive Stimuli.” In Proceedings of the 11th ACM Symposium on Eye Tracking Research & Applications. Denver, CO: Association for Computing Machinery, Article 89.
- Burgess, K., K. M. Atkinson, J. Westeinde, N. Crowcroft, S. L. Deeks, and K. Wilson. 2017. “Barriers and Facilitators to the Use of an Immunization Application: A Qualitative Study Supplemented with Google Analytics Data.” Journal of Public Health 39 (3): e118–e126. doi:10.1093/pubmed/fdw032.
- Camilleri, M. A. 2022. “E-Commerce Websites, Consumer Order Fulfillment and After-Sales Service Satisfaction: The Customer is Always Right, Even after the Shopping Cart Check-Out.” Journal of Strategy and Management 15 (3): 377–396. doi:10.1108/JSMA-02-2021-0045.
- Cao, G., Y. Duan, and A. El Banna. 2019. “A Dynamic Capability View of Marketing Analytics: Evidence from UK Firms.” Industrial Marketing Management 76: 72–83. doi:10.1016/j.indmarman.2018.08.002.
- Cortiñas, M., R. Cabeza, R. Chocarro, and A. Villanueva. 2019a. “Attention to Online Channels across the Path to Purchase: An Eye-Tracking Study.” Electronic Commerce Research and Applications 36: 100864. doi:10.1016/j.elerap.2019.100864.
- Cortiñas, M., R. Chocarro, and A. Villanueva. 2019b. “Image, Brand and Price Info: Do They Always Matter the Same?” In Proceedings of the 11th ACM Symposium on Eye Tracking Research & Applications. Denver, CO: Association for Computing Machinery, Article 92.
- Dasgupta, S., and P. Grover. 2019. “Impact of Digital Strategies on Consumer Decision Journey.” Academy of Marketing Studies Journal 23 (1): 1–14.
- DigitalCommerce360. 2020. “The Shopper Speaks: Site Satisfaction Amid Heightened Shopper Expectations Should Inform Platform Selection.” //www.digitalcommerce360.com/2020/01/06/the-shopper-speaks-site-satisfaction-amid-heightened-shopper-expectations-should-inform-platform-selection/.
- Eraslan, S., Y. Yesilada, and S. Harper. 2016. “Scanpath Trend Analysis on Web Pages: Clustering Eye Tracking Scanpaths.” ACM Transactions on the Web 10 (4): 1–35. doi:10.1145/2970818.
- Farah, M. F., Z. B. Ramadan, and D. H. Harb. 2019. “The Examination of Virtual Reality at the Intersection of Consumer Experience, Shopping Journey and Physical Retailing.” Journal of Retailing and Consumer Services 48: 136–143. doi:10.1016/j.jretconser.2019.02.016.
- Følstad, A., and K. Kvale. 2018. “Customer Journeys: A Systematic Literature Review.” Journal of Service Theory and Practice 28 (2): 196–227. doi:10.1108/JSTP-11-2014-0261.
- Fu, H., G. Manogaran, K. Wu, M. Cao, S. Jiang, and A. Yang. 2020. “Intelligent Decision-Making of Online Shopping Behaviour Based on Internet of Things.” International Journal of Information Management 50: 515–525. doi:10.1016/j.ijinfomgt.2019.03.010.
- Gidlöf, K., N. Holmberg, and H. Sandberg. 2012. “The Use of Eye-Tracking and Retrospective Interviews to Study Teenagers’ Exposure to Online Advertising.” Visual Communication 11 (3): 329–345. doi:10.1177/1470357212446412.
- Grewal, D., C.-P. Ahlbom, L. Beitelspacher, S. M. Noble, and J. Nordfält. 2018. “In-store Mobile Phone Use and Customer Shopping Behavior: Evidence from the Field.” Journal of Marketing 82 (4): 102–126.
- Griva, A., C. Bardaki, K. Pramatari, and D. Papakiriakopoulos. 2018. “Retail Business Analytics: Customer Visit Segmentation Using Market Basket Data.” Expert Systems with Applications 100: 1–16. doi:10.1016/j.eswa.2018.01.029.
- Haesner, M., J. Chandra, A. Steinert, and E. Steinhagen-Thiessen. 2018. “An Eye Movement Analysis of Web Usability: Differences between Older Adults with and without Mild Cognitive Impairment.” Assistive Technology 30 (2): 66–73. doi:10.1080/10400435.2016.1251994.
- Halvorsrud, R., K. Kvale, and A. Følstad. 2016. “Improving Service Quality through Customer Journey Analysis.” Journal of Service Theory and Practice 26 (6): 840–867. doi:10.1108/JSTP-05-2015-0111.
- Hasan, L., A. Morris, and S. Probets. 2013. “E-Commerce Websites for Developing Countries: A Usability Evaluation Framework.” Online Information Review 37 (2): 231–251. doi:10.1108/OIR-10-2011-0166.
- Hautala, J., C. Kiili, Y. Kammerer, O. Loberg, S. Hokkanen, and P. H. T. Leppänen. 2018. “Sixth Graders’ Evaluation Strategies When Reading Internet Search Results: An Eye-Tracking Study.” Behaviour & Information Technology 37 (8): 761–773. doi:10.1080/0144929X.2018.1477992.
- Herhausen, D., K. Kleinlercher, P. C. Verhoef, O. Emrich, and T. Rudolph. 2019. “„Loyalty Formation for Different Customer Journey Segments.” Journal of Retailing 95 (3): 9–29. doi:10.1016/j.jretai.2019.05.001.
- Huang, J., X. Wang, and J. Ye. 2022. “User Experience Evaluation of B2c E-Commerce Websites Based on Fuzzy Information.” Wireless Communications and Mobile Computing 2022: 1–10. doi:10.1155/2022/6767960.
- Huddleston, P. T., B. K. Behe, C. Driesener, and S. Minahan. 2018. “Inside-Outside: Using Eye-Tracking to Investigate Search-Choice Processes in the Retail Environment.” Journal of Retailing and Consumer Services 43: 85–93. doi:10.1016/j.jretconser.2018.03.006.
- Huddleston, P., B. K. Behe, S. Minahan, and R. T. Fernandez. 2015. “Seeking Attention: An Eye Tracking Study of In-store Merchandise Displays.” International Journal of Retail & Distribution Management 43 (6): 561–574.
- Hussain, J., W. A. Khan, T. Hur, H. S. M. Bilal, J. Bang, A. U. Hassan, M. Afzal, and S. Lee. 2018. “A Multimodal Deep Log-Based User Experience (UX) Platform for UX Evaluation.” Sensors (Basel, Switzerland) 18 (5): 1622. doi:10.3390/s18051622.
- Jahanian, A., S. Keshvari, and R. Rosenholtz. 2018. “Web Pages: What Can You See in a Single Fixation?” Cognitive Research: Principles and Implications 3 (1): 1–15.
- Järvinen, J., and H. Karjaluoto. 2015. “The Use of Web Analytics for Digital Marketing Performance Measurement.” Industrial Marketing Management 50: 117–127. doi:10.1016/j.indmarman.2015.04.009.
- Jeske, D., P. Briggs, and L. Coventry. 2016. “Exploring the Relationship between Impulsivity and Decision-Making on Mobile Devices.” Personal and Ubiquitous Computing 20 (4): 545–557. doi:10.1007/s00779-016-0938-4.
- Kakatkar, C., and M. Spann. 2019. “Marketing Analytics Using Anonymized and Fragmented Tracking Data.” International Journal of Research in Marketing 36 (1): 117–136. doi:10.1016/j.ijresmar.2018.10.001.
- Kannan, P. K., and G. Kulkarni. 2022. “The Impact of Covid-19 on Customer Journeys: Implications for Interactive Marketing.” Journal of Research in Interactive Marketing 16 (1): 22–36. doi:10.1108/JRIM-03-2021-0078.
- Kessler, S. H., and A. F. Zillich. 2019. “Searching Online for Information about Vaccination: Assessing the Influence of User-Specific Cognitive Factors Using Eye-Tracking.” Health Communication 34 (10): 1150–1158.
- King, A. J., N. Bol, R. G. Cummins, and K. K. John. 2019. “Improving Visual Behaviour Research in Communication Science: An Overview, Review, and Reporting Recommendations for Using Eye-Tracking Methods.” Communication Methods and Measures 13 (3): 149–177. doi:10.1080/19312458.2018.1558194.
- Kuehnl, C., D. Jozic, and C. Homburg. 2019. “Effective Customer Journey Design: Consumers’ Conception, Measurement, and Consequences.” Journal of the Academy of Marketing Science 47 (3): 551–568. doi:10.1007/s11747-018-00625-7.
- Kurzhals, K., M. Hlawatsch, M. Burch, and D. Weiskopf. 2016. “Fixation-Image Charts.” In Proceedings of the Ninth Biennial ACM Symposium on Eye Tracking Research & Applications, 11–18. Charleston, South Carolina: Association for Computing Machinery.
- Lamberz, J., T. Litfin, Ö. Teckert, and G. Meeh-Bunse. 2018. “Still Searching or Have You Found It Already? – Usability and Web Design of an Educational Website.” Business Systems Research Journal 9 (1): 19–30. doi:10.2478/bsrj-2018-0002.
- Lemon, K. N., and P. C. Verhoef. 2016. “Understanding Customer Experience throughout the Customer Journey.” Journal of Marketing 80 (6): 69–96. doi:10.1509/jm.15.0420.
- Lynch, S., and L. Barnes. 2020. “Omnichannel Fashion Retailing: Examining the Customer Decision-Making Journey.” Journal of Fashion Marketing and Management: An International Journal 24 (3): 471–493. doi:10.1108/JFMM-09-2019-0192.
- Maslowska, E., C. M. Segijn, K. A. Vakeel, and V. Viswanathan. 2020. “How Consumers Attend to Online Reviews: An Eye-Tracking and Network Analysis Approach.” International Journal of Advertising 39 (2): 282–306. doi:10.1080/02650487.2019.1617651.
- Misirlis, N., and M. Vlachopoulou. 2018. “Social Media Metrics and Analytics in Marketing – S3M: A Mapping Literature Review.” International Journal of Information Management 38 (1): 270–276. doi:10.1016/j.ijinfomgt.2017.10.005.
- Musalem, A., L. Aburto, and M. Bosch. 2018. “Market Basket Analysis Insights to Support Category Management.” European Journal of Marketing 52 (7/8): 1550–1573. doi:10.1108/EJM-06-2017-0367.
- Parker, S., and J. Heapy. 2006. The Journey to the Interface: How Public Service Design Can Connect Users to Reform. London: Demos.
- Ramanathan, R., E. Philpott, Y. Duan, and G. Cao. 2017. “Adoption of Business Analytics and Impact on Performance: A Qualitative Study in Retail.” Production Planning & Control 28 (11-12): 985–998. doi:10.1080/09537287.2017.1336800.
- Raza, S. A., and K. A. Khan. 2022. “Corona Fear and E-Commerce Adoption in an Emerging Economy: Paradigm Shift of Consumer Intention.” foresight 24 (2): 195–209. doi:10.1108/FS-02-2021-0034.
- Redkina, N. S. 2018. “Library Sites as Seen through the Lens of Web Analytics.” Automatic Documentation and Mathematical Linguistics 52 (2): 91–96. doi:10.3103/S0005105518020073.
- Rudkowski, J., C. Heney, H. Yu, S. Sedlezky, and F. Gunn. 2020. “Here Today, Gone Tomorrow? Mapping and Modeling the Pop-up Retail Customer Journey.” Journal of Retailing and Consumer Services 54: 101698. doi:10.1016/j.jretconser.2018.11.003.
- Savastano, M., F. Bellini, F. D’Ascenzo, and M. De Marco. 2019. “Technology Adoption for the Integration of Online–Offline Purchasing.” International Journal of Retail & Distribution Management 47 (5): 474–492. doi:10.1108/IJRDM-12-2018-0270.
- Schall, A. 2016. “Eyes on the Go: Using Eye Tracking to Understand How Mobile Users Consume Online Content.” In Proceedings of the 34th ACM International Conference on the Design of Communication. Silver Spring, MD: Association for Computing Machinery, Article 33.
- Shopify. 2022. “The State of the Ecommerce Fashion Industry: Statistics, Trends & Strategies to Use in 2022.” //www.shopify.co.uk/enterprise/ecommerce-fashion-industry.
- Sitechecker. 2020. “Website Pages Indexed on Google.” https://sitechecker.pro/google-index/.
- Smart Insights. 2022. “E-Commerce Conversion Rates Benchmarks 2022 – How Do Yours Compare?” Digital Marketing Statistics. https://www.smartinsights.com/ecommerce/ecommerce-analytics/ecommerce-conversion-rates/.
- Statista. 2022a. “Fashion E-Commerce in the United Kingdom.” B2C e-commerce Digital & Trends. //www-statista-com.mmu.idm.oclc.org/study/35821/online-clothes-market-in-the-united-kingdom-uk-statista-dossier/.
- Statista. 2022b. “Online Shopping Behavior in the United States.” Digital & Trends. //www-statista-com.mmu.idm.oclc.org/study/20918/online-shopping-behavior-statista-dossier/.
- Stieglitz, S., M. Mirbabaie, B. Ross, and C. Neuberger. 2018. “Social Media Analytics – Challenges in Topic Discovery, Data Collection, and Data Preparation.” International Journal of Information Management 39: 156–168. doi:10.1016/j.ijinfomgt.2017.12.002.
- Tupikovskaja-Omovie, Z., and D. J. Tyler. 2018. “Mobile Consumer Shopping Journey in Fashion Retail: Eye Tracking Mobile Apps and Websites.” In Etra 2018, Warsaw, Poland, June 14.
- Tupikovskaja-Omovie, Z., and D. J. Tyler. 2021a. “Eye Tracking Technology to Audit Google Analytics: Analysing Digital Consumer Shopping Journey in Fashion m-Retail.” International Journal of Information Management 59: 102294. doi:10.1016/j.ijinfomgt.2020.102294.
- Tupikovskaja-Omovie, Z., and D. J. Tyler. 2021b. “Experienced versus Inexperienced Mobile Users: Eye Tracking Fashion Consumers’ Shopping Behaviour on Smartphones.” International Journal of Fashion Design, Technology and Education 15 (2): 178–186. doi:10.1080/17543266.2021.1980614.
- Tupikovskaja-Omovie, Z., and D. Tyler. 2019. “Mobile Consumers’ Shopping Journey Types: Eye Tracking Digital User Behaviour Patterns in Fashion m-Retail.” In AM2019: The 52nd Academy of Marketing Conference ‘When You Tire of Marketing You Tire of Life, London, UK.
- Tupikovskaja-Omovie, Z., and D. Tyler. 2020a. “Clustering Consumers’ Shopping Journeys: Eye Tracking Fashion m-Retail.” Journal of Fashion Marketing and Management: An International Journal 24 (3): 381–398. doi:10.1108/JFMM-09-2019-0195.
- Tupikovskaja-Omovie, Z., and D. Tyler. 2020b. “Mobile Consumer Behaviour in Fashion m-Retail: An Eye Tracking Study to Understand Gender Differences.” In Symposium on Eye Tracking Research and Applications (ETRA ’20 Adjunct), June 2–5, Stuttgart, Germany. New York: ACM, 8. doi:10.1145/3379157.3391305.
- Tupikovskaja-Omovie, Z., D. Tyler, S. Dhanapala, and S. Hayes. 2015. “Mobile App versus Website: A Comparative Eye-Tracking Case Study of Topshop.” International Journal of Social, Behavioural, Educational, Economic, Business and Industrial Engineering 19 (10): 691–701.
- V12. 2020. “What Do Consumers Want in Mobile Shopping.” //v12data.com/blog/what-do-consumers-want-mobile-shopping-experience/.
- Vakulenko, Y., P. Shams, D. Hellström, and K. Hjort. 2019. “Service Innovation in e-Commerce Last Mile Delivery: Mapping the e-Customer Journey.” Journal of Business Research 101: 461–468. doi:10.1016/j.jbusres.2019.01.016.
- Voorhees, C. M., P. W. Fombelle, Y. Gregoire, S. Bone, A. Gustafsson, R. Sousa, and T. Walkowiak. 2017. “Service Encounters, Experiences and the Customer Journey: Defining the Field and a Call to Expand Our Lens.” Journal of Business Research 79: 269–280. doi:10.1016/j.jbusres.2017.04.014.
- Wagner, G., H. Schramm-Klein, and S. Steinmann. 2020. “Online Retailing across e-Channels and e-Channel Touchpoints: Empirical Studies of Consumer Behaviour in the Multichannel e-Commerce Environment.” Journal of Business Research 107: 256–270.
- Walker, C., and F. M. Federici, eds. 2018. Eye Tracking and Multidisciplinary Studies on Translation. Vol. 143. Amsterdam: John Benjamins Publishing Company (Benjamins Translation Library (BTL)). Accessed 1 September 2022. doi:10.1080/14781700.2020.1821759.
- Wang, Q., S. Yang, M. Liu, Z. Cao, and Q. Ma. 2014. “An Eye-Tracking Study of Website Complexity from Cognitive Load Perspective.” Decision Support Systems 62: 1–10. doi:10.1016/j.dss.2014.02.007.
- Wang, Q., Z. Xu, X. Cui, L. Wang, and C. Ouyang. 2017. “Does a Big Duchenne Smile Really Matter on e-Commerce Websites? An Eye-Tracking Study in China.” Electronic Commerce Research 17 (4): 609–626. doi:10.1007/s10660-016-9237-4.
- Wang, X., Y. Li, Z. Cai, and H. Liu. 2021. “Beauty Matters: Reducing Bounce Rate by Aesthetics of Experience Product Portal Page.” Industrial Management & Data Systems 121 (8): 1848–1870. doi:10.1108/IMDS-08-2020-0484.
- Wu, L., L. Hitt, and B. Lou. 2020. “Data Analytics, Innovation, and Firm Productivity.” Management Science 66 (5): 2017–2039. doi:10.1287/mnsc.2018.3281.
- Zuschke, N. 2020. “An Analysis of Process-Tracing Research on Consumer Decision-Making.” Journal of Business Research 111: 305–320. doi:10.1016/j.jbusres.2019.01.028.