
Abstract
Aim: In obese patients, adipose tissues produce excessive adipokines, which contribute to the development and progression of colon cancer. This study aims to elucidate the pivotal role of adipokine-related genes and colon cancer. Materials & methods: Data from colonic adenocarcinoma cohorts were acquired from TCGA and GEO databases. Colonic adenocarcinoma subgroups were delineated based on consensus clustering. A prognostic model was constructed using LASSO regression. Results: The adipokine-related genes inactive subgroup exhibited superior prognosis and higher survival rates. The prognostic model based on adipokine-related genes demonstrated robust predictive capability in both training and validation datasets, with higher survival rates observed in the low-risk group. Conclusion: The constructed prognostic model for colon cancer could predict the prognosis and the responsiveness to immunotherapy.
Plain language summary
Colon cancer is one of the most common cancer types and the second leading cause of death worldwide. Despite the advances in new cancer diagnostic and therapeutic strategies, the prognosis of colon cancer is still unsatisfactory. In obese patients, adipose tissues produce excessive adipokines, which contribute to the development and progression of colon cancer. Targeting adipokine-related genes holds the potential to develop an effective prognostic tool for colon cancer.
Here, we identified two colon cancer subgroups, adipokine-related genes active and adipokine-related genes inactive, based on adipokine-related genes, which have significant differences in clinical outcome, immune features, and biology functions.
An adipokine-related gene-based prognostic model was developed. The model performed well in predicting the prognosis and immunotherapy responsiveness of patients.
Significant variations in tumor-associated pathway activity were identified between the high-risk and low-risk groups, offering new insights into tailored treatments.
Keywords: :
1. Background
Colon cancer is one of the most common cancer types and the second leading cause of death worldwide [Citation1,Citation2]. Despite the advances in new cancer diagnostic and therapeutic strategies, the prognosis of colon cancer is still unsatisfactory. Seeking novel reliable and robust molecular markers may help improve the prevention and treatment of colon cancer.
Obesity is defined as excess fat accumulation or excessive calorie intake that affects health. In the past decades, due to the change in modern lifestyle, the number of patients with obesity has been increasing year by year, such as increased calorie intake and reduced physical exercise [Citation3]. Epidemiological studies have shown that colon cancer is highly correlated with obesity and abnormal nutrition intake [Citation4–6]. Increased fat intake can induce higher levels of triglycerides and low-density lipoprotein (LDL) and increased expressions of proinflammatory cytokines such as TNF-α, IL-1, and IL-6, these factors are important mediators for the development of colon cancer [Citation7].
Adipose tissues produced biologically active adipokines [Citation8], such as eptin, metrnl, and asprosin, which play pivotal roles in obesity [Citation9,Citation10]. As a consequence of obesity, elevated adipokines are associated with the development of various types of cancer [Citation11,Citation12]. In recent years, the association between obesity and colorectal cancer has garnered increasing attention from scholars [Citation13]. Al-Shibli et al. detected the level of leptin in colorectal cancer patients. They found that the expression of leptin was elevated in colorectal cancer patients, with the level of LEP/LEPR being higher compared with normal tissues [Citation14]. MCP1 and resistin play important roles in regulating inflammation and immune responses [Citation15,Citation16]. Franco et al. demonstrated that in obese patients with colorectal cancer, MCP1 promotes a chronic inflammatory state, fostering a tumor-permissive microenvironment that stimulates cellular proliferation and enhances tumor aggressiveness [Citation17]. Singh et al. established that the serum level of resistin is elevated in colon cancer patients and correlates with tumor grade [Citation18].
Adipokines are associated with colon cancer risk. Significant differences in metrnl and asprosin expression were also discovered in colon cancer tissues compared with healthy controls [Citation19]. Adiponectin treatment could attenuate the proliferation of colon cancer cells stimulated by IL-6 through inhibiting STAT-3 phosphorylation and activation [Citation20].
Up to date, 11 adipokine genes (ADIPOQ, ADIPOR1, ADIPOR2, LEP, LEPR, RETN, RETNLB, RBP4, SFRP5, NAMPT, SPP1) have been identified and they participate in regulating metabolisms involved in obesity [Citation21,Citation22]. Therefore, further mechanistic exploration of these genes may improve our understanding of how obesity contributes to the development and progression of colon cancer. We hypothesize that adipokine-related genes play a pivotal role in colon cancer and possess prognostic significance.
Our study aims to unravel the predictive potential of adipokine-related genes as prognostic markers for colon cancer, thereby offering crucial insights for personalized treatment strategies and prognosis evaluation. In the present study, we have applied multiple bioinformatics approaches to divide the patients into different subgroups based on the expression of adipokine-related genes. By analyzing the correlation between immune features and the clinical prognosis of colon cancer, we constructed an adipokine-related prognosis model through machine learning approaches in the training datasets. The stability and predictive ability of this model were then verified in the testing datasets. Further analyses revealed that this model correlated with the cancer-related pathways, tumor stage, and response to immunotherapy in colon cancer.
2. Materials & methods
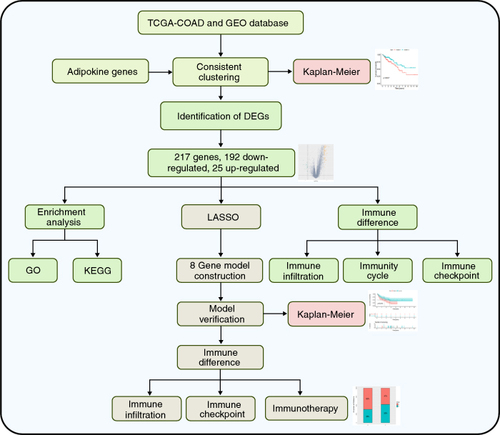
2.1. Study flow diagram & data acquisition
The flow diagram of this study is shown in . The gene expression data and related clinical information were downloaded from the TCGA database and GEO database.
Figure 1. The flow diagram of the study.
DEG: Differentially expressed gene.
The training dataset utilized in this study was derived from the TCGA database and consisted of colonic adenocarcinoma (COAD) samples and GSE33113, GSE39582, GES100797, GSE135222, and GSE78220 from the GEO database were used as validation datasets. These datasets were retrieved from the databases in October 2023. Adipokine-related genes (ADIPOQ, ADIPOR1, ADIPOR2, LEP, LEPR, RETN, RETNLB, RBP4, SFRP5, NAMPT, SPP1) were obtained from the publications [Citation21,Citation22].
2.2. Identification of adipokine-related subgroups
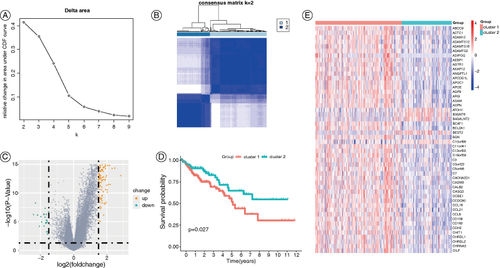
By using the expression levels of 11 adipokine-related genes, we utilized a consensus clustering analysis with the median as the central point. The Partitioning Around Medoids (PAM) algorithm was used to ensure the stability and consistency of our clustering results. Through this method, we were able to classify colon cancer patients into distinct subgroups. This analysis was performed using the ‘ConsensusClusterPlus’ R package.
2.3. Identification & functional enrichment analysis of differentially expressed genes
The ‘limma’ R package was used to identify differentially expressed genes (DEGs) between the two subgroups [Citation23]. The threshold criteria were set as |log2FC ≥ 1.5 and p-value ≤ 0.05. A total of 217 DEGs were identified, of which 192 were upregulated and 25 were downregulated. Subsequent analysis of DEGs included GO and KEGG enrichment studies [Citation24,Citation25].
2.4. Analysis of immune infiltration differences between the two subgroups
CIBERSORTx algorithm was employed to evaluate the immune cell infiltration [Citation26], evaluating the levels of 22 immune cell types. Additionally, we used the ‘ESTIMATE’ R-package to calculate the proportion of immune and stromal components in the tumor microenvironment of each patient, expressed as ImmuneScore, StromalScore, and ESTIMATEScore. The ‘vioplot’ R package was used to generate a violin plot of immune infiltration.
2.5. COX regression analysis & model construction
We used the ‘survival’ R package to conduct univariate COX regression analysis with survival information to screen for DEGs associated with patient survival [Citation27]. Subsequently, LASSO regression analysis was performed to select the optimal set of feature genes for constructing the prognosis model [Citation28].
2.6. Functional validation of prognostic models
The established prognostic model was assessed in the TCGA-COAD, GSE33113, and GSE39582 datasets to assess its predictive efficiency. The log-rank test compared overall survival between the high and low-risk patients. Kaplan-Meier curves were used to visualize the survival rate differences and receiver operating characteristic curves were used to evaluate the accuracy of the prognostic model.
2.7. Software & statistical analysis
All statistical calculations in this study were performed using R 4.1.1 software. Considering a sufficient sample size (n = 288) that the distribution of the sample mean is very close to the normal distribution according to the central limit theorem, we used the Student's t-test and Wilcoxon test to compare the two groups. p < 0.05 was considered statistically significant.
3. Results
3.1. Consistency clustering of colon cancer patients
We performed consensus cluster analysis on the TCGA-COAD dataset based on 11 adipokine-related genes and the best cluster stability was achieved when K = 2 (A & B). Therefore, the samples were divided into two subgroups, in which subgroup 1 has 182 patients while subgroup 2 has 105 patients. A total of 217 DEGs were identified between these two subgroups, with 192 upregulated and 25 downregulated (Figure 2C). The two subgroups significantly differed in survival. Patients in subgroup 2 exhibited a significantly better prognosis compared with subgroup 1 (D). The adipokine-related genes were more highly expressed in subgroup 1 compared with that in subgroup 2 as shown in the heatmap (E). Thus, subgroup 1 was named the ‘adipokine-related genes active (ARGA) subgroup’, and subgroup 2 was named the ‘adipokine-related genes inactive (ARGI) subgroup’.
Figure 2. Classification of subgroups of colon cancer patients in the TCGA-COAD dataset based on adipokine-related genes. (A) Consensus clustering CDF (k = 2 to 9). (B) Consensus clustering matrix for k = 2. (C) Volcano plot of DEGs between the two subgroups. (D) Kaplan-Meier OS curves of patients with different COAD subgroups. (E) The heatmap of DEGs in patients with different COAD subgroups.
CDF: Cumulative distribution function; COAD: Colonic adenocarcinoma; DEG: Differentially expressed gene; OS: Overall survival.
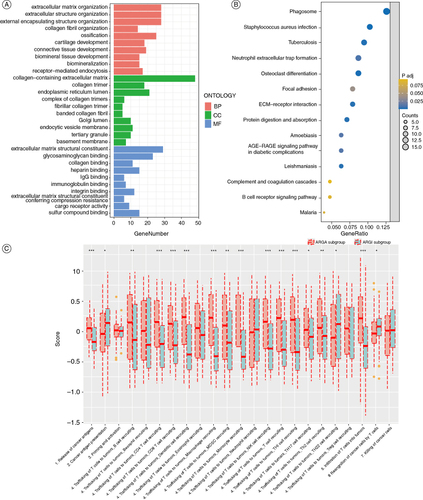
3.2. Functional enrichment analysis of the inter-subgroup DEGs & differences in cancer immune circuits
The GO functional enrichment analysis of the DEGs between the two subgroups indicated that these genes enrichment in receptor-mediated endocytosis, immunoglobulin binding, and extracellular matrix-associated pathways (A). Results of KEGG functional enrichment analysis of DEGs showed that the DEGs were mainly enriched in neutrophil extracellular trap formation, focal adhesion, and B-cell receptor signaling pathways (B). The results of the cancer immune circuit analysis showed that the ARGA subgroup has significantly higher immune activities than the ARGI subgroup (C).
Figure 3. Enrichment analysis of the DEGs between the ARGA subgroup and the ARGI subgroup. (A & B) The GO (A) and KEGG (B) enrichment analysis of the DEGs. (C) Differences in the various steps of the cancer immunity cycle between two subgroups.
*p < 0.05; **p < 0.01; ***p < 0.001.
ARGA: Adipokine-related genes active; ARGI: Adipokine-related genes inactive; DEG: Differentially expressed gene.
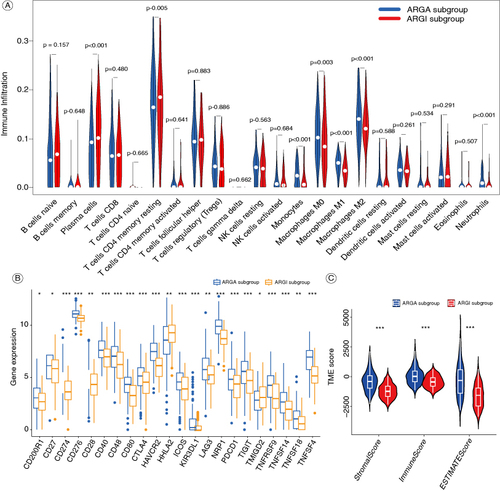
3.3. Differences in immune features between the two subgroups
Compared with the ARGA subgroup, the ARGI subgroup has higher levels of infiltrations of T-cells CD4 memory resting and plasma cells, but lower levels of monocytes, macrophages M0, macrophages M1, macrophages M2, and neutrophils (A). We analyzed the expression of 22 common immune checkpoint genes in the two subgroups, revealing that most of these genes were highly expressed in the ARGA subgroup in the ARGA subgroup (B). The ARGA subgroup has higher ImmuneScore, StromalScore, and ESTIMATEScore than the ARGI subgroup (C).
Figure 4. The immune features of the ARGA and ARGI subgroups. (A) Violin diagram of the proportion of 22 types of immune cells in the two subgroups. (B) The expression of common immune checkpoints between the two subgroups. (C) Violin diagram of the ImmuneScore, StromalScore, and ESTIMATEScore between the two subgroups.
*p < 0.05; **p < 0.01; ***p < 0.001.
ARGA: Adipokine-related genes active; ARGI: Adipokine-related genes inactive.
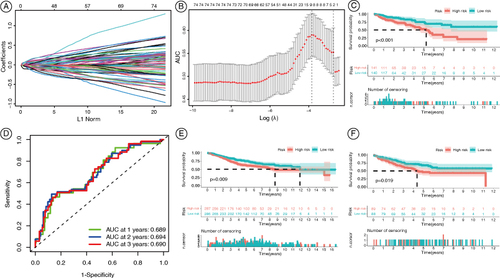
3.4. Construction of an adipokine-related prognostic model for colon cancer
To further investigate the differences in prognosis between the ARGA and ARGI subgroups, we utilized a single-factor COX regression analysis to identify prognostically relevant DEGs. A total of 77 DEGs were obtained. Subsequently, we constructed a prognostic model consisting of eight genes (ATOH1, B4GALNT2, B3GNT6, HEPACAM2, PTPRN, C5orf46, HOXC6, and CALB2) using LASSO regression (A & B). Based on this model, patients from the TCGA-COAD dataset were divided into high and low-risk groups. As shown in C, patients in the low-risk group had significantly longer overall survival than those in the high-risk group. Receiver operating characteristic analysis showed the area under curve values of 0.689, 0.694, and 0.690 for 1-year, 2-year, and 3-year overall survival, respectively (D). The stability of the model was validated in the GSE39582 and GSE33113 datasets, where patients were also divided into high and low-risk groups (E & F). Similarly, patients in the low-risk group have better overall survival than those in the high-risk group.
Figure 5. Construction of the adipokine-related prognostic model for colon cancer. (A) Ten-time cross-verification for tuning parameter selection in the LASSO model. Each curve corresponds to a single gene. (B) Characteristic genes were screened by the LASSO logistic regression algorithm. (C) Kaplan-Meier OS curves for COAD patients in the TCGA database. (D) AUC of the prognostic model for COAD patients in the TCGA database. (E) Kaplan-Meier OS curves for COAD patients in the GSE39582. (F) Kaplan-Meier OS curves for COAD patients in the GSE33113.
AUC: Area under curve; COAD: Colonic adenocarcinoma; OS: Overall survival.
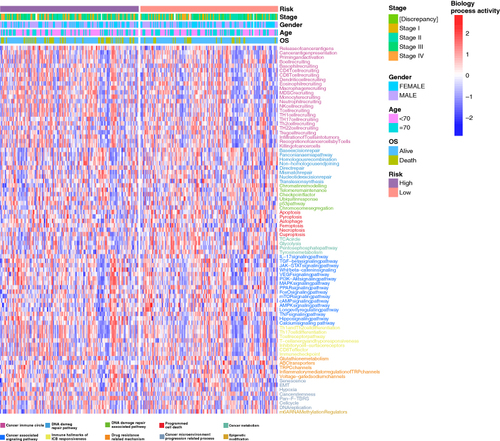
3.5. Analysis of cancer-related pathways in the high-risk & low-risk groups
We used the gene set variation analysis (GSVA) to compare the activities of cancer-related pathways between the high and low-risk groups, along with clinical parameters including tumor stage, age, gender, and overall survival. A total of 83 cancer-related pathways were involved and their GSVA scores were visualized by using heatmaps (). The results showed that the high-risk group had higher activities in cancer-related pathways and were more active, such as the VEGF signaling pathway, PI3K-Akt signaling pathway, and MAPK signaling pathway ().
Figure 6. Comparisons in activities of cancer-related pathways and clinical parameters in the high-risk and low-risk groups. The activities of 83 cancer-related pathways and clinical parameters including tumor stages, age, gender, and OS were compared between the high-risk and low-risk groups in the TCGA-COAD cohort by using GSVA. The pathway-related functions are displayed in different colors at the bottom of the heatmap.
COAD: Colonic adenocarcinoma; GSVA: Gene set variation analysis; OS: Overall survival.
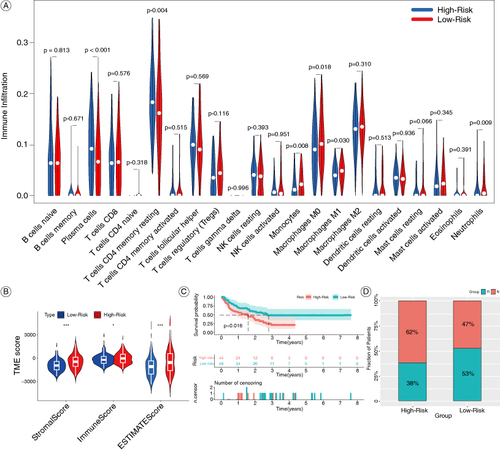
3.6. Differences in immune response between the high & low-risk groups
To investigate the predictive ability of the model for immunotherapy in colon cancer, we first evaluated the differences in the infiltration of immune cells. As shown in A, the high-risk group has higher levels of infiltration of plasma cells and T-cells CD4 memory resting, while lower levels of monocytes, macrophages M0, macrophages M1, and neutrophils (A). The tumor microenvironment scores including ImmuneScore, StromalScore, and ESTIMATEScore were significantly higher in the high-risk group compared with the low-risk group (B). These results suggest that the high-risk group may have a better response to immunotherapy. Then we integrated three datasets (GSE100797, GSE135222, GSE78220), in which immunotherapy was involved, into a META dataset to validate the predictive ability of the model for immunotherapy. Patients in the low-risk group demonstrate a notably superior prognosis compared with those in the high-risk group (C). Additionally, patients in the high-risk group exhibit a significantly higher response to immunotherapy than those in the low-risk group, as illustrated in the stacked bar chart (D).
Figure 7. Comparisons of immune features and the response to immunotherapy in the high-risk and low-risk groups. (A) Violin diagram of the proportion of 22 types immune cell in the two groups. (B) Violin diagram of the ImmuneScore, StromalScore and ESTIMATEScore between the high-risk and low-risk groups. (C) Kaplan-Meier OS curves for immunotherapy patients in the META-cohort. (D) Percentages of patients responding to immunotherapy.
*P < 0.05; ***P < 0.001.
OS: Overall survival.
4. Discussion
Colon cancer is still a major public health issue worldwide. With the increased prevalence of obesity, the incidence of colon cancer is increasing [Citation29]. In the present study, we analyzed the association of adipokine-related genes and colon cancer and constructed a prognostic model for colon cancer based on these genes.
We collected cancer cohorts from the TCGA database (TCGA-COAD) and the GEO database (GSE33113 and GSE39582). We utilized TCGA-COAD as the training dataset, and GSE33113, and GSE39582 as the testing datasets. Consensus clustering of the COAD dataset was performed based on 11 adipokine-related genes. The TCGA-COAD cohorts were divided into two subgroups. Based on the expression of adipokine-related genes, subgroup 1 was named the ARGA subgroup, and subgroup 2 was named the ARGI subgroup. The outcomes of patients in the ARGI subgroup were better than those of the ARGA subgroup. We compared the difference in prognosis between patients with ARGA and ARGI subgroups. The results showed that the prognosis of patients in the ARGI subgroup was better than those in the ARGA subgroup. It is consistent with a previous study that obesity increases the metabolic burden and aggravates the progression of colon cancer [Citation30].
We then identified the DEGs between the two subgroups. A total of 217 DEGs were identified, with 192 upregulated and 25 downregulated. Enrichment analyses were performed using the DEGs. GO functional enrichment revealed that these genes were primarily enriched in receptor-mediated endocytosis, immunoglobulin binding, and extracellular matrix-associated biological processes. Among them, extracellular matrix-associated pathways are proven to be closely related to colon cancer development [Citation31,Citation32]. KEGG functional enrichment analysis revealed that the DEGs were predominantly associated with neutrophil extracellular trap formation, focal adhesion, and B-cell receptor signaling pathways, which are all closely related to colon cancer [Citation33–35]. Extracellular matrix-related pathways and their interaction with cell receptors are key regulators involved in the progression and metastasis of colorectal cancer [Citation36]. The immune system disorder is also associated with the occurrence and development of colon cancer and immunotherapy is also widely used in the treatment of colon cancer [Citation37].
The immune status of the two subgroups was then compared. Cancer immune circuit analysis showed that the ARGA subgroup has higher immune activity compared with the ARGI subgroup. Compared with the ARGA subgroup, the ARGI subgroup has higher infiltration levels of plasma cells, T-cells CD4 memory resting, but lower levels of monocytes, macrophages M0, macrophages M1, macrophages M2, neutrophils, etc. For the expression of 22 common immune checkpoint genes, most of these immune checkpoint genes were highly expressed in the ARGA subgroup. Immune checkpoints play an important role in the activation or apoptosis of immune cells, which are crucial for the development of cancer immunotherapy [Citation38]. Targeting CTLA-4 and PDCD1 has been successfully employed in cancer immunotherapy, as the inhibition of CTLA-4 and PDCD1 expression can eliminate or weaken the tumor-infiltrating Treg, thus evoking effective antitumor immune response by conventional T-cells and improve the efficacy of immunotherapy [Citation39]. CD40 is expressed in a variety of immune cells, particularly B-cells and myeloid cells. The targeted activation of CD40 has the potential to stimulate both innate and adaptive immune responses, ultimately enhancing the therapeutic efficacy of immunotherapy in tumor treatment [Citation40]. CD276, an immune checkpoint of the B7 family, is abnormally and consistently expressed in a variety of cancers, which was associated with poor prognosis of patients by blocking T-cell infiltration and promoting CD8 T-cell exhaustion. The targeted inhibition of CD276 expression is a potential strategy to improve cancer immunotherapy [Citation41]. This is consistent with our results that highly expressed immune checkpoints correlate with a worse prognosis in ARGA patients.
The immune scores of the ARGA subgroup were significantly higher than those of the ARGI subgroup, including the ImmuneScore, StromalScore, and ESTIMATEScore. Recent studies have shown that the high infiltration levels of macrophage M0, macrophage M1, and monocytes are associated with a poor prognosis in colon cancer patients [Citation42]. It is consistent with our results that patients from the ARGA subgroup have higher immune infiltration levels, but worse prognosis than ARGI subgroup. These results indicated that we successfully identified active and inactive subgroups based on adipokine-elated genes using consensus clustering.
An increasing number of studies have shown that adipokine-related genes are closely associated with tumor prognosis [Citation43]. To aid clinical practice, we hope to further utilize machine learning methods to extract genetic signatures associated with tumor prognosis from fat-associated gene subtypes, so we identified the DEGs between ARGA and ARGI subgroups. The DEGs with prognostic potential were screened. Then, a prognosis model consisting of eight genes (ATOH1, B4GALNT2, B3GNT6, HEPACAM2, PTPRN, C5orf46, HOXC6, and CALB2) was constructed by LASSO regression analysis. Using this model, the colon cancer patients were divided into high and low-risk groups. Patients in the low-risk group have better prognosis and may be more sensitive to immunotherapy. Evidence has demonstrated that ATOH1 serves as a tumor suppressor in colon cancer. Targeted inhibition of ATOH1 by miR-613 can result in the progression of colon cancer, which can be restored by miR-613 inhibitors [Citation44]. Elevated expression of B4GALNT2 in colon cancer is associated with a more favorable prognosis, as B4GALNT2 can induce the down-regulation of the stem cell-related gene SOX2, resulting in a decrease in cancer stem cell number [Citation45]. Furthermore, lower expression of B3GNT6, HOXC6, and CALB2 genes was associated with a better prognosis of colon cancer [Citation46–48]. While, the correlation between the other genes (HEPACAM2, PTPRN, and C5orf46) and colon cancer remains unexplored.
The results of GSVA analysis showed that the high-risk groups have higher activity in cancer-related pathways such as the VEGF signaling pathway, PI3K-Akt signaling pathway, and MAPK signaling pathway. The VEGF pathway is a key promoter in the formation and growth of tumor blood vessels, thereby ensuring the supply of oxygen and nutrients to the tumor [Citation49]. Bakshi et al. highlighted the role of the VEGF pathway in the regulation of angiogenesis and metastasis in colon cancer cells [Citation50]. The PI3K-Akt pathway is abnormally activated in colorectal cancer, exhibiting a strong correlation with tumor occurrence, invasion, and metastasis [Citation51]. A study found that the elevated activity of the PI3K/Akt pathway in colon cancer patients is attributed to the secretion of adipokines, including leptin and adiponectin [Citation52]. These findings align with our results. In colorectal cancer, the abnormal activation of the MAPK signaling pathway is closely related to the occurrence, growth, and metastasis of tumors [Citation53]. This aberrant activation is particularly prominent in KRAS-mutated colorectal cancer cases [Citation54]. These findings suggest that the malignancy of tumors in the high-risk group is stronger than in the low-risk group.
Recent studies have found that both leptin, adiponectin, and other adipokines are closely related to the change in immune function. For example, leptin acts as a fat cell-derived hormone/cytokine that can link nutritional status to neuroendocrine and immune function. It can influence innate and adaptive immunity by inducing proinflammatory responses, thus playing a key role in the pathogenesis regulation of multiple autoimmune/inflammatory diseases [Citation55]. Adiponectin, as a key regulator of the innate immune system, plays an important role in the progression of inflammation and metabolic disorders. Metabolic stress can be sensed under both physiological and pathological conditions and metabolic adaptation can be regulated by targeting the innate immune system, which plays a crucial role in the regulation of immune function [Citation56]. In addition, adipocytes can secrete various other chemokines and cytokines that are derived from adipocytes themselves or neighboring cells, including resident and infiltrating macrophages. This interaction causes adipocytes, preadipocytes, and macrophages to interact in the microenvironment of adipose tissue, with profound effects on the immune microenvironment [Citation57]. Therefore, we compared the differences in immune responses between the high-risk and low-risk groups to evaluate the predictive capability of the model in colon cancer immunotherapy. In comparison to the low-risk group, patients in the high-risk group exhibited reduced levels of plasma cells and T-cells CD4 memory resting, while higher infiltration levels of monocytes, macrophages M0, macrophages M1, and neutrophils. Chang et al. found that macrophage M0 was related to the distance metastasis and prognosis of colon cancer [Citation58]. Similarly, Kvorjak et al. demonstrated that macrophages regulate the progression of colorectal cancer by modulating the glycosylation of MUC1 in epithelial cells [Citation59]. The high-risk group exhibited a significantly higher immune score compared with the low-risk group, which correlated with a poorer prognosis for colon cancer. This suggests that there are significant differences in immune characteristics between the two groups and that patients in the high-risk group may have a better response to immunotherapy.
We then conducted a meta-analysis by integrating three immunotherapy datasets (GSE100797, GSE135222, GSE78220). The survival curve indicated that patients in the low-risk group exhibit better prognosis compared with those in the high-risk group. Additionally, a stacked bar chart was presented to illustrate the immune response rates of patients in both groups. These results indicate that our model has the potential to accurately predict colon cancer patients' response to immunotherapy, supporting the case for personalized treatment. However, our prognostic model still exhibits certain limitations that require further validation through a larger number of clinical samples to ensure its reliability. Future studies are necessary to validate the effectiveness of this model with more clinical data.
5. Conclusion
The adipokine-related genes were correlated with colon cancer prognosis and immune microenvironment. A prognostic model based on adipokine-related genes was constructed that can predict the prognosis and the responsiveness to immunotherapy for colon cancer patients. This work offers a new reference for individualized treatment of colon cancer.
Author contributions
Y Jiang, W Li, and Y Wang contributed to the conception and design of the study. Y Jiang, W Li, J Xu, and X Sun wrote or contributed to the writing of the manuscript. W Li and N Deng collected the data. J Xu, Z Wen, and Q Zhong did the bioinformatic analysis. All authors reviewed the manuscript.
Financial disclosure
This work was supported by the Guangdong High-level Hospital Construction Fund at Zhongshan City People's Hospital (Grant No. SG2002005), the National Natural Science Foundation of China (Grant No. 82370269), the Natural Science Foundation of Heilongjiang Province (Grant No. LH2021H018), the Heilongjiang Postdoctoral Foundation (Grant No. LBH-Q21134), and the Guangdong Province Clinical Key Specialty of 14th Five-Year Plan (Grant No. T2023005). The authors have no other relevant affiliations or financial involvement with any organization or entity with a financial interest in or financial conflict with the subject matter or materials discussed in the manuscript apart from those disclosed.
Writing disclosure
No writing assistance was utilized in the production of this manuscript.
Competing interests disclosure
The authors have no competing interests or relevant affiliations with any organization or entity with the subject matter or materials discussed in the manuscript. This includes employment, consultancies, honoraria, stock ownership or options, expert testimony, grants or patents received or pending, or royalties.
Data availability statement
The data that support the findings of this study are available from the corresponding author upon reasonable request.
Additional information
Funding
References
- O'Keefe SJ. Diet, microorganisms and their metabolites and colon cancer. Nat Rev Gastroenterol Hepatol. 2016;13(12):691–706. doi:10.1038/nrgastro.2016.165
- Sung H, Ferlay J, Siegel RL, et al. Global cancer statistics 2020: GLOBOCAN estimates of incidence and mortality worldwide for 36 cancers in 185 countries. CA Cancer J Clin. 2021;71(3):209–249. doi:10.3322/caac.21660
- Broughton DE, Moley KH. Obesity and female infertility: potential mediators of obesity's impact. Fertil Steril. 2017;107(4):840–847. doi:10.1016/j.fertnstert.2017.01.017
- Berlau J, Glei M, Pool-Zobel BL. Colon cancer risk factors from nutrition. Anal Bioanal Chem. 2004;378(3):737–743. doi:10.1007/s00216-003-2284-4
- Ben Q, An W, Jiang Y, et al. Body mass index increases risk for colorectal adenomas based on meta-analysis. Gastroenterology. 2012;142(4):762–772. doi:10.1053/j.gastro.2011.12.050
- de Jong AE, Morreau H, Nagengast FM, et al. Prevalence of adenomas among young individuals at average risk for colorectal cancer. Am J Gastroenterol. 2005;100(1):139–143. doi:10.1111/j.1572-0241.2005.41000.x
- Tarasiuk A, Mosinska P, Fichna J. The mechanisms linking obesity to colon cancer: an overview. Obes Res Clin Pract. 2018;12(3):251–259. doi:10.1016/j.orcp.2018.01.005
- Zorena K, Jachimowicz-Duda O, Slezak D, et al. Adipokines and obesity. Potential link to metabolic disorders and chronic complications. Int J Mol Sci. 2020;21(10):3570. doi:10.3390/ijms21103570
- Yu Z, Han S, Cao X, et al. Genetic polymorphisms in adipokine genes and the risk of obesity: a systematic review and meta-analysis. Obesity (Silver Spring). 2012;20(2):396–406. doi:10.1038/oby.2011.148
- Wallenius K, Jansson JO, Wallenius V. The therapeutic potential of interleukin-6 in treating obesity. Expert Opin Biol Ther. 2003;3(7):1061–1070. doi:10.1517/14712598.3.7.1061
- Odarenko KV, Salomatina OV, Chernikov IV, et al. Soloxolone methyl reduces the stimulatory effect of leptin on the aggressive phenotype of murine neuro2a neuroblastoma cells via the MAPK/ERK1/2 pathway. Pharmaceuticals (Basel). 2023;16(10):1369. doi:10.3390/ph16101369
- Alfaqih MA, Elsalem L, Nusier M, et al. Serum leptin receptor and the rs1137101 variant of the LEPR gene are associated with bladder cancer. Biomolecules. 2023;13(10):1498. doi:10.3390/biom13101498
- Loh NY, Wang W, Noordam R, et al. Obesity, fat distribution and risk of cancer in women and men: a Mendelian randomisation study. Nutrients. 2022;14(24):5259. doi:10.3390/nu14245259
- Al-Shibli SM, Harun N, Ashour AE, et al. Expression of leptin and leptin receptors in colorectal cancer - an immunohistochemical study. PeerJ. 2019;7:e7624. doi:10.7717/peerj.7624
- Vinolo MA, Rodrigues HG, Nachbar RT, et al. Regulation of inflammation by short chain fatty acids. Nutrients. 2011;3(10):858–876. doi:10.3390/nu3100858
- Rzepa L, Peller M, Eyileten C, et al. Resistin is associated with inflammation and renal function, but not with insulin resistance in type 2 diabetes. Horm Metab Res. 2021;53(7):478–484. doi:10.1055/a-1492-3077
- Di Franco S, Bianca P, Sardina DS, et al. Adipose stem cell niche reprograms the colorectal cancer stem cell metastatic machinery. Nat Commun. 2021;12(1):5006. doi:10.1038/s41467-021-25333-9
- Singh S, Chouhan S, Mohammad N, et al. Resistin causes G1 arrest in colon cancer cells through upregulation of SOCS3. FEBS Lett. 2017;591(10):1371–1382. doi:10.1002/1873-3468.12655
- Onat E, Kocaman N, Balta H. The role of meteorin-like peptide and asprosin in colon carcinoma. Cureus. 2023;15(10):e47073. doi:10.7759/cureus.47073
- Fenton JI, Birmingham JM. Adipokine regulation of colon cancer: adiponectin attenuates interleukin-6-induced colon carcinoma cell proliferation via STAT-3. Mol Carcinog. 2010;49(7):700–709. doi:10.1002/mc.20644
- Ouchi N, Parker JL, Lugus JJ, et al. Adipokines in inflammation and metabolic disease. Nat Rev Immunol. 2011;11(2):85–97. doi:10.1038/nri2921
- Catalan V, Gomez-Ambrosi J, Rodriguez A, et al. Up-regulation of the novel proinflammatory adipokines lipocalin-2, chitinase-3 like-1 and osteopontin as well as angiogenic-related factors in visceral adipose tissue of patients with colon cancer. J Nutr Biochem. 2011;22(7):634–641. doi:10.1016/j.jnutbio.2010.04.015
- Ritchie ME, Phipson B, Wu D, et al. limma powers differential expression analyses for RNA-sequencing and microarray studies. Nucleic Acids Res. 2015;43(7):e47. doi:10.1093/nar/gkv007
- Kanehisa M, Goto S. KEGG: kyoto encyclopedia of genes and genomes. Nucleic Acids Res. 2000;28(1):27–30. doi:10.1093/nar/28.1.27
- Gene Ontology C. Gene ontology consortium: going forward. Nucleic Acids Res. 2015;43(Database issue):D1049–D1056. doi:10.1093/nar/gku1179
- Steen CB, Liu CL, Alizadeh AA, et al. Profiling cell type abundance and expression in bulk tissues with CIBERSORTx. Methods Mol Biol. 2020;2117:135–157. doi:10.1007/978-1-0716-0301-7_7
- Cole BF, Gelber RD, Goldhirsch A. Cox regression models for quality adjusted survival analysis. Stat. Med. 1993;12(10):975–987. doi:10.1002/sim.4780121009
- Xi LJ, Guo ZY, Yang XK, et al. Application of LASSO and its extended method in variable selection of regression analysis. Zhonghua Yu Fang Yi Xue Za Zhi. 2023;57(1):107–111. doi:10.3760/cma.j.cn112150-20220117-00063
- Moghaddam AA, Woodward M, Huxley R. Obesity and risk of colorectal cancer: a meta-analysis of 31 studies with 70,000 events. Cancer Epidemiol Biomarkers Prev. 2007;16(12):2533–2547. doi:10.1158/1055-9965.EPI-07-0708
- Sung MK, Yeon JY, Park SY, et al. Obesity-induced metabolic stresses in breast and colon cancer. Ann NY Acad Sci. 2011;1229:61–68. doi:10.1111/j.1749-6632.2011.06094.x
- Mao L, Yang J, Yue J, et al. Decorin deficiency promotes epithelial-mesenchymal transition and colon cancer metastasis. Matrix Biol. 2021;95:1–14. doi:10.1016/j.matbio.2020.10.001
- Karlsson S, Nystrom H. The extracellular matrix in colorectal cancer and its metastatic settling – alterations and biological implications. Crit Rev Oncol Hematol. 2022;175:103712. doi:10.1016/j.critrevonc.2022.103712
- Stehr AM, Wang G, Demmler R, et al. Neutrophil extracellular traps drive epithelial-mesenchymal transition of human colon cancer. J Pathol. 2022;256(4):455–467. doi:10.1002/path.5860
- Liu Y, Wang G, Li Y, et al. miR-424-5p reduces 5-fluorouracil resistance possibly by inhibiting Src/focal adhesion kinase signalling-mediated epithelial-mesenchymal transition in colon cancer cells. J Pharm Pharmacol. 2021;73(8):1062–1070. doi:10.1093/jpp/rgab031
- Zhu J, Liu W, Bian Z, et al. Lactobacillus plantarum zhang-LL inhibits colitis-related tumorigenesis by regulating arachidonic acid metabolism and CD22-mediated B-cell receptor regulation. Nutrients. 2023;15(21):4512. doi:10.3390/nu15214512
- Nersisyan S, Novosad V, Engibaryan N, et al. ECM-receptor regulatory network and its prognostic role in colorectal cancer. Front Genet. 2021;12:782699. doi:10.3389/fgene.2021.782699
- Gessani S, Belardelli F. Immune dysfunctions and immunotherapy in colorectal cancer: the role of dendritic cells. Cancers (Basel). 2019;11(10):1491. doi:10.3390/cancers11101491
- Haanen JB, Robert C. Immune checkpoint inhibitors. Prog Tumor Res. 2015;42:55–66. doi:10.1159/000437178
- Tay C, Tanaka A, Sakaguchi S. Tumor-infiltrating regulatory T-cells as targets of cancer immunotherapy. Cancer Cell. 2023;41(3):450–465. doi:10.1016/j.ccell.2023.02.014
- Tang T, Cheng X, Truong B, et al. Molecular basis and therapeutic implications of CD40/CD40L immune checkpoint. Pharmacol Ther. 2021;219:107709. doi:10.1016/j.pharmthera.2020.107709
- Mortezaee K. B7-H3 immunoregulatory roles in cancer. Biomed Pharmacother. 2023;163:114890. doi:10.1016/j.biopha.2023.114890
- Zhou R, Zhang J, Zeng D, et al. Immune cell infiltration as a biomarker for the diagnosis and prognosis of stage I-III colon cancer. Cancer Immunol Immunother. 2019;68(3):433–442. doi:10.1007/s00262-018-2289-7
- Du M, Wang Y, Vallis J, et al. Associations between polymorphisms in leptin and leptin receptor genes and colorectal cancer survival. Cancer Biol Med. 2023;20(6):438–451. doi:10.20892/j.issn.2095-3941.2022.0635
- Yang X, Zhang L, Song X, et al. MicroRNA-613 promotes colon cancer cell proliferation, invasion and migration by targeting ATOH1. Biochem Biophys Res Commun. 2018;504(4):827–833. doi:10.1016/j.bbrc.2018.09.054
- Pucci M, Gomes Ferreira I, Orlandani M, et al. High expression of the Sd(a) synthase B4GALNT2 associates with good prognosis and attenuates stemness in colon cancer. Cells. 2020;9(4):948. doi:10.3390/cells9040948
- Zhou B, Yu J, Cai X, et al. Constructing a molecular subtype model of colon cancer using machine learning. Front Pharmacol. 2022;13:1008207. doi:10.3389/fphar.2022.1008207
- Liang L, Zeng JH, Qin XG, et al. Distinguishable prognostic signatures of left- and aight-sided colon cancer: a study based on sequencing data. Cell Physiol Biochem. 2018;48(2):475–490. doi:10.1159/000491778
- Zhang D, Zhao Y, Wang S, et al. A prognostic model of angiogenesis and neutrophil extracellular traps related genes manipulating tumor microenvironment in colon cancer. J Cancer. 2023;14(11):2109–2127. doi:10.7150/jca.85778
- Patel SA, Nilsson MB, Le X, et al. Molecular mechanisms and future implications of VEGF/VEGFR in cancer therapy. Clin Cancer Res. 2023;29(1):30–39. doi:10.1158/1078-0432.CCR-22-1366
- Bakshi HA, Quinn GA, Nasef MM, et al. Crocin inhibits angiogenesis and metastasis in colon cancer via TNF-alpha/NF-kB/VEGF pathways. Cells. 2022;11(9):1502. doi:10.3390/cells11091502
- Stefani C, Miricescu D, Stanescu S II, et al. Growth F9actors, PI3K/AKT/mTOR and MAPK signaling pathways in colorectal cancer pathogenesis: where are we now? Int J Mol Sci. 2021;22(19):10260. doi:10.3390/ijms221910260
- Bou Malhab LJ, Abdel-Rahman WM. Obesity and inflammation: colorectal cancer engines. Curr Mol Pharmacol. 2022;15(4):620–646. doi:10.2174/1874467214666210906122054
- Urosevic J, Nebreda AR, Gomis RR. MAPK signaling control of colon cancer metastasis. Cell Cycle. 2014;13(17):2641–2642. doi:10.4161/15384101.2014.946374
- Wang Z, Kang B, Gao Q, et al. Quadruple-editing of the MAPK and PI3K pathways effectively blocks the progression of KRAS-mutated colorectal cancer cells. Cancer Sci. 2021;112(9):3895–3910. doi:10.1111/cas.15049
- Procaccini C, La Rocca C, Carbone F, et al. Leptin as immune mediator: interaction between neuroendocrine and immune system. Dev Comp Immunol. 2017;66:120–129. doi:10.1016/j.dci.2016.06.006
- Luo Y, Liu M. Adiponectin: a versatile player of innate immunity. J Mol Cell Biol. 2016;8(2):120–128. doi:10.1093/jmcb/mjw012
- MacLaren R, Cui W, Cianflone K. Adipokines and the immune system: an adipocentric view. Adv Exp Med Biol. 2008;632:1–21. doi:10.1007/978-0-387-78952-1_1
- Chang Z, Huang R, Fu W, et al. The construction and analysis of ceRNA network and patterns of immune infiltration in colon adenocarcinoma metastasis. Front Cell Dev Biol. 2020;8:688. doi:10.3389/fcell.2020.00688
- Kvorjak M, Ahmed Y, Miller ML, et al. Cross-talk between colon cells and macrophages increases ST6GALNAC1 and MUC1-sTn expression in ulcerative colitis and colitis-associated colon cancer. Cancer Immunol Res. 2020;8(2):167–178. doi:10.1158/2326-6066.CIR-19-0514