
ABSTRACT
Oil palm waste from South Sumatra may represent an abundant source of biochar for beneficial agronomic use in Australian broad-acre farming systems. Here a cost–benefit analysis and carbon footprint of biochar applied to three different Australian broad-acre crops are presented, covering application rates of between 1 and 40 Mg ha−1 and considering either the effect of the biochar on yield or the effect of the biochar on reduced fertilizer requirement. Yield and nutrient efficiency effects are assumed to be constant across all crops. Analysis reveals that empty fruit bunch biochar could be produced in South Sumatra and transported to the farm gate in Australia at a minimum acceptable sale price per Mg of USD $266 to the biochar manufacturer. Despite assumed uniformity of the biochar effect, the return on investment for the biochar user from the perspective of yield increase varied significantly by crop (sugarcane: 67% return on investment [ROI], irrigated cotton: 43% ROI, dry land cotton: −22% ROI, wheat: −72% ROI). The study found that the average carbon footprint in CO2e over 100 years was −691 kg Mg−1 biochar when used to influence crop yield, and −286 kg Mg−1 biochar when used to reduce fertilizer requirements.
Introduction
Biochar is the chemically stable carbon rich residue derived from the pyrolysis of biomass at temperatures between 300 and 700°C [Citation1]. The application of biochar to cropping soils has been demonstrated to improve agricultural yields [Citation2], reduce greenhouse gas emissions [Citation3] and rehabilitate weathered soils [Citation4]. Observed yield and nutrient retention performance of biochars on different crops and soils is highly varied [Citation5].
Crane-Droesch et al. [Citation6] concluded that the greatest economic benefit and emissions reduction or sequestration potential for biochar could likely be found in the world's humid tropics. Humid tropics are often regions where high rural poverty is a major concern [Citation7]. Addressing rural poverty is a key focus of the Indonesian government's Poverty Reduction Programs [Citation101]. Indonesia produces large amounts of oil palm biomass with underdeveloped waste management systems, a shortfall that has generated interest in developing opportunities to utilize the biomass for bioenergy or biochar [Citation8].
This abundance contrasts with Australia, where future sources of biomass assume cultivation of dedicated bioenergy crops [Citation9]. The status of biomass use in 2012 arguably reflects the financial incentive to exploit centralized waste streams, with bagasse (44%), wood biomass (42%) and landfill waste (6%) constituting almost all feedstocks for bioenergy [Citation10]. Australia's bioenergy production totaled 212 PJ in 2013 [Citation11]. In contrast, oil palm empty fruit bunch (EFB) from Indonesia constituted 530.5 PJ in 2013 (calculated as 18.9 GJ Mg−1 EFB from Kong [Citation12] multiplied by Mg EFB produced in Indonesia in 2013 [Citation102]), a potential energy resource equivalent to more than twice the bioenergy produced in Australia in 2013, and more than Australia's expected bioenergy consumption of 340 PJ in 2030 [Citation10].
Through the process of harvesting, oil palm waste residues are centralized in the palm oil production process, with EFB, fibre, palm kernel shell, oil palm trunk and palm fronds all treated as waste products. EFB is returned to plantations for use as organic fertilizer.
Minimizing feedstock cost is a desirable objective for biochar production [Citation13]. Harsono et al. [Citation14] quote USD $15.80 Mg−1 for EFB, constituting 14.5% of project cost. Researchers at the Universiti Putra Malaysia Biorefinery [Pers. Comm., February 2, 2016] quoted an expense of USD $7.10 Mg−1 of EFB for use as a biochar feedstock (MYR:USD exchange rate 4.22:1).
Unverified long-term yield effect assumptions in biochar cost–benefit analyses are not robust [Citation15]. To address this, Dickinson et al. [Citation16] considered a range of durations of biochar yield enhancement in performing a cost–benefit analysis of biochar, an approach adopted in this study.
Land-use change is incorporated in the carbon footprint presented in this paper through the adoption of greenhouse gas balances from Germer and Sauerborn [Citation17]. The extent of greenhouse gas reduction through palm oil waste residue pyrolysis may be trivial in a broad life-cycle analysis if the biomass is sourced from an area that has been recently deforested [Citation18]. This detrimental effect will be further magnified in the case where peat forest has been deforested and drained [Citation19].
Existing financial analyses and carbon footprints of biochar production systems have not considered an international trade scenario. The purpose of the research presented here is to assess the financial viability and carbon footprint of a biochar export scenario where EFBs are taken from a mill northwest of Palembang, Indonesia, to produce biochar at a pyrolysis unit nearby. This biochar is then ground into a coarse powder and transported to Palembang Port, Indonesia, and exported to Mackay, Brisbane and Fremantle Ports in Australia. From there it is transported by road to Australian broad-acre sugarcane cropping, cotton crops (dryland and irrigated) and wheat cropping located in north Queensland, Oakey, on the Darling Downs, and Westonia in the Western Australian Wheat Belt, respectively. The biochar financial value is calculated from two perspectives, the first being crop yield improvement and the second being fertilizer saving through enhanced plant nutrient uptake efficiency. The study considers 40 biochar application rate scenarios between 1 and 40 Mg per hectare. The carbon footprint of the biochar product is calculated over 100 years.
Materials and methods
The model used in this paper considers the financial viability and carbon footprint of each application and crop scenario with two biochar use intentions, namely:
assessing increased crop yield effect while maintaining control fertilizer levels; and
assessing reductions in fertilizer requirements due to biochar addition while maintaining control-level crop yields.
The persistence of the EFB biochar's effect on crop yield and nutrient uptake is assumed to be 5 years in duration. This effect is parameterized by the amount of char remaining in the soil at a given time after application (EquationEquation 1(1) ). Existing field trials of EFB biochar are not longer than 12 months in duration, so this assumption is not verified, but it is assumed to be a reasonable expectation based on a personal communication with the lead author of Bakar et al. [Citation20] [Pers. Comm., February 2, 2016]. This study employs the use of cost–benefit analysis [Citation21] to determine the financial value of the biochar.
Biochar persistence in soil
One of the most important properties of biochar from a financial feasibility and carbon sequestration perspective is the long-term persistence of biochar in soil. Based on models from Wang [Citation22] and Lehmann et al. [Citation23], the ratio of biochar carbon mineralization is here estimated as a negative exponential function of time using the H:C atomic ratio of the biochar products in Claoston [Citation24]:
(1)
where is defined as the carbon content of the biochar remaining at year ‘t’. This leads to an estimate of the biochar remaining in the soil after 100 years (). It is essential to note that biochar yield effect and plant nutrient uptake modelling have been parameterized by EquationEquation (1
(1) ) in subsequent modelling.
Table 1. Estimated EFB biochar organic carbon (BC) persistence in soil temperature of 20°C after 100 years [Citation24] as a function of empty fruit bunch (EFB) biochar H/C atomic ratio of biochars produced at different pyrolysis temperatures.
Technology
The technology assumed in this study is the pyrolysis reactor currently used by Badja Baru for the production of Deorub® Liquid Smoke [Citation25] produced from oil palm kernel shell. Their nine pyrolysis reactors operate at 280°C, and are equipped for the collection of gas and liquid products of pyrolysis. Each unit processes 2 metric tons of palm kernel shell per day and has a 35% biochar yield of 700 kg. The EFB biochar yield of 20% is assumed from Harsono et al. [Citation14]. The production capacity and costs associated with the unit are presented in .
Table 2. Pyrolysis reactor costs and outputs [Anton H, Pers. Comm. January 26, 2016].
It is assumed here that gases and liquids are reinjected in the pyrolysis process, reducing the biodiesel fuel requirement.
Yield influence and nutrient retention assumptions
Bakar et al. [Citation20] applied EFB biochar to acid sulfate soils with rice cropping, and found yield increased between 141 and 472% for applications of 10–40 Mg ha−1 (). Rabileh et al. [Citation26] applied EFB biochar at 5, 10 and 20 Mg ha−1 to maize grown in Ultisol soil, and observed increased dry weight plant mass of 61, 99 and 181%, respectively. Abdulrazzaq et al. [Citation27] observed a 202–435% increase in sweet corn dry weight with application rates of 15–30 Mg ha−1, outperforming the application of the rice husk biochar and wood biochar in the same study.
Yield effects and nutrient retention of N, P and K were assumed from the results of Bakar et al. [Citation20]. A piecewise linear function was utilized between observed data points. Dry mass of plant biomass was the assumed data for crop yield, as opposed to rice grain yield, on account of its lower yield result of between 25 and 87% for application rates between 10 Mg ha−1 and 40 Mg ha−1. There are no published field trials of EFB biochar applied to sugarcane, wheat or cotton, and the authors do not claim that yields will be similar to those of Bakar et al. [Citation20] due to different climatic, topographic and edaphic conditions. Rather, uniform effects are assumed across all crops of application in order to determine the degree to which crop selection influences biochar's financial value.
System boundary
The system boundary of the financial assessment in this study is defined as all of the processes of the sourcing of feedstock, undergoing pyrolysis, transporting feedstock and biochar product and the application and crop effect of the biochar product as illustrated in . The entirety of the process takes place over the assumed biochar effect persistence duration of 5 years, as communicated by an author of Bakar et al. [Citation20] [Pers. Comm., February 2, 2016]. The EFB biochar effect persistence parameter is adjusted to between 1 and 20 years in sensitivity testing, therefore assessing all of the cases possible within the model design.
Figure 1. Empty Fruit Bunch biochar yield influence on rice yield [Citation20], sweet corn shoot dry weight [Citation27] and maize dry weight [Citation26].
![Figure 1. Empty Fruit Bunch biochar yield influence on rice yield [Citation20], sweet corn shoot dry weight [Citation27] and maize dry weight [Citation26].](/cms/asset/16e8a545-df68-4a07-b8c8-40c6d0c6f839/tcmt_a_1435958_f0001_b.gif)
Figure 2. Assessment boundaries for financial assessment and carbon footprintof empty fruit bunch (EFB) biochar.
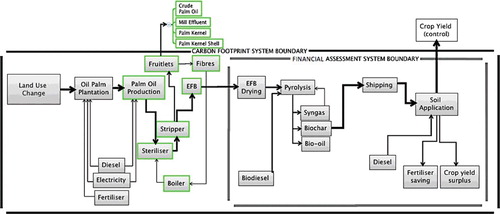
The system boundary of the carbon footprint in this study is defined as all of the processes from the land-use change scenarios, plantation and milling operations, pyrolysis, transporting and shipping, application, crop effect of the biochar and CO2 mineralization of the biochar. Under the PalmGHG calculator methodology, system expansion is used for by-products. The allocation of emissions among palm oil products has been adopted from the Roundtable on Sustainable Palm Oil (RSPO) guidelines [Citation28] with emissions allocated by mass.
Data
Data underpinning costs and benefits considered for the financial model include:
Feedstock costs from UPM Biorefinery [Pers. Comm., February 2, 2016];
Cost of feedstock haulage and biochar haulage [Citation103];
Cost of pyrolysis equipment and operation [Anton H, Pers. Comm., January 26, 2016];
Cost of biochar packaging quoted by Bulk Handling Australia [Pers. Comm., April 27, 2016];
Cost of biochar shipping and associated fees [Citation104–108];
Cost of biochar application quoted by Verterra Ecological Engineering [Pers. Comm., February 17, 2016];
Biochar-induced yield benefits [Citation20] materialized as revenue from additional crop yield assuming that 2016 prices for crops will remain constant from 2016 to 2035 [Citation109]; and
Biochar-induced nutrient retention materialized as avoided fertilizer costs. Fertilizer prices are assumed to be constant from 2016 to 2035 [Citation109].
Emissions data and factors for the carbon footprint include:
Emissions from organic and non-organic fertilizer use assumed from Hansen [Citation29] for oil palm; Renouf and Wegener [Citation30] for sugarcane; Biswas, Barton, and Carter [Citation31] for wheat; and Visser [Citation32] for dryland and irrigated cotton;
Emissions from shipping [Citation33], haulage and heavy machinery quotes from Verterra Ecological Engineering [Pers. Comm., February 17, 2016];
Emissions associated with biodiesel used in pyrolysis [Citation34], and emissions associated with syngas combustion [Citation14];
Emissions associated with biochar mineralization [Citation24,Citation109];
Emissions avoided through decreased crop emissions intensity associated with increased crop yield [Citation30–32]; and
Emissions associated with land-use change, assumed from Germer and Sauerborn [Citation17].
Cost benefit analysis (CBA)
In considering the minimum required biochar price for the viability of the biochar production unit, cash outflows from the operating costs ‘Ct’ and initial capital cost ‘Ck’ of the biochar unit were subtracted from the sales revenue of biochar (defined as the price of biochar ‘P’ multiplied by the annual production of ‘Q’ Mg of EFB biochar) adjusted to the present value using a cost of capital ‘i’ for a given year ‘t’, described in EquationEquation (2(2) ). Setting the producer's net present value (NPV) to USD $0 enables the calculation of a minimum biochar price ‘Pproducer’.
(2)
From the perspective of the biochar user, initial cash outflows from the cost of application ‘CA’ and the cost of obtaining the biochar itself (equal to the price of biochar ‘Puser’ multiplied by the application rate ‘A’) are summated with revenues attributable to augmented yield calculated as the revenue per hectare of crop ‘Rcrop’ multiplied by the yield effect of biochar ‘rA,t’. Setting the user's NPV to USD $0 enables the calculation of a maximum acceptable biochar price, ‘Puser’.
(3)
When considering the biochar value from the perspective of its enhancement of nutrient uptake and therefore reduced nutrient requirement, the NPV can be defined as the sum of the revenue streams (the fertilizer saved ‘F-FA,t,θ’ as a result of enhanced nutrient uptake multiplied by the price of that fertilizer at a given time ‘Pt,fert’) attributable to each fertilizer type ‘fert’, adjusted to present value using a cost of capital ‘i’, less the cost of application ‘CA’.
(4)
If the break-even price of the producer exceeds the maximum acceptable price of the user, then the CBA framework indicates that no commercial opportunity exists.
Carbon footprint
A carbon footprint (greenhouse gas-specific life-cycle analysis) was performed in accordance with the international standard ISO14040 (2006) measured in carbon dioxide equivalent (CO2e) with a 100-year global warming potential (GWP). Greenhouse gases considered include carbon dioxide (CO2) with a GWP of 1, methane (CH4) with a GWP of 21 and nitrous oxide (NO2) with a GWP of 310 [Citation110].
The system boundary of the carbon footprint is outlined in . EFB CO2 emissions are treated as zero sum, as is the practice in the PalmGHG calculation. By extension, biogenic CO2 as a component of syngas both generated and burnt during pyrolysis is also zero. Field emissions of N2O arising from EFB's use as an organic fertilizer are deduced from EFB nitrogen content [Citation35]. The persistence of the EFB biochar carbon can be considered a negative emission in the biochar carbon footprint calculation. In the only current carbon footprint of EFB biochar found in the literature, Harsono et al. [Citation14] use CO2e kg−1 EFB per year as the functional unit. Gaunt and Cowie [Citation36] adopt CO2e Mg−1 biochar. Here CO2e Mg−1 biochar is adopted as the functional unit.
The model of GHG emissions is defined in below using component models for the supply chain, application, sequestration and emissions displacement through increased crop yield efficiency or decreased nitrification from avoided N fertilizer use [Citation37].
Table 3. Model components of the biochar carbon footprint.
Where is the molecular weight ratio of C to CO2, ‘c’ is the percentage carbon content of the EFB biochar product, ‘
’ are the emissions (CO2e) of the supply chain (Mg ha−1), ‘
’ are the emissions (CO2e) associated with biochar application, ‘
’ is the emissions (CO2e) intensity of the crop (Mg ha−1), ‘Y’ is the average yield (Mg ha−1), ‘YA,t’ is the biochar augmented crop yield (Mg ha−1), ‘EY’ is the existing emissions intensity per metric ton of crop, ‘A’ is the application rate of EFB biochar (Mg ha−1), ‘t’ is the time (years) from application of biochar, ‘
’ is an indicator function denoting the persistence of effects for a given year, ‘N’ is the nitrogen nutrient requirement of the crop (kg N ha−1yr−1), ‘
’ is the molecular weight ratio of N2 to N2O, ‘
’ is the global warming potential of nitrous oxide, ‘
’
is the biochar influence on the crop where
and ‘rA,N’ is the biochar augmented nitrogen uptake of the crop (
).
Results
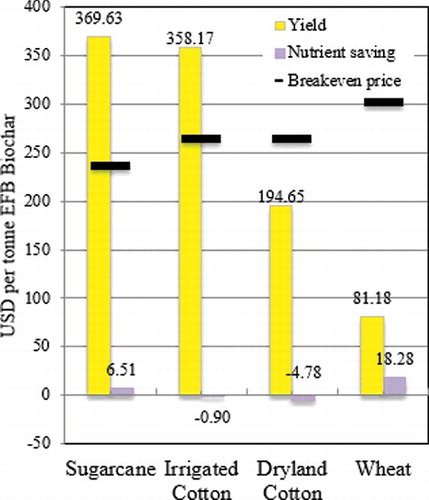
Average biochar values of USD $327 Mg−1 and USD $6 Mg−1 were calculated in consideration of yield and nutrient saving, respectively, with a default assumed biochar effect on yield and nutrient uptake persistence of 5 years (). An average break-even cost of USD $266 Mg−1 was calculated across all scenarios from the biochar producer's perspective.
Figure 3. Average empty fruit bunch (EFB) biochar value for user calculated in consideration of yield and nutrient saving compared with break-even price for producer evaluated across all crops.
EFB biochar valuations per Mg in excess of the break-even cost result in cases with positive NPV. Of the 160 cases, 70 (44%) exhibited positive NPV results where EFB biochar was applied for the intent of increasing yield effect (). On a crop-by-crop basis, 30 of 40 sugarcane cases and 40 of 40 irrigated cotton cases resulted in positive NPVs. Wheat and dryland cotton did not exhibit positive NPVs at the application rates considered.
Figure 4. Net present value of all scenarios of biochar applied for yield effect (USD).
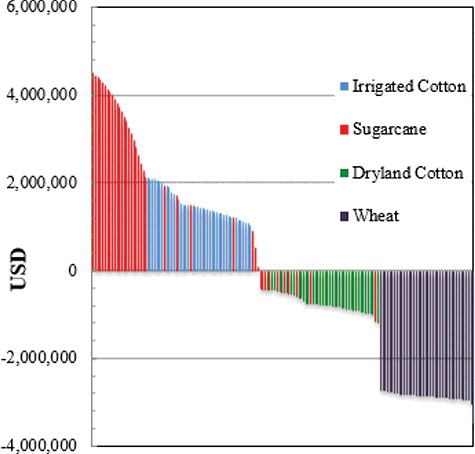
In contrast to EFB biochar applied for yield augmentation, zero cases exhibited positive NPV results where EFB biochar was applied with the intention of reducing fertilizer requirements. This result is unchanged in sensitivity testing where the effects of nutrient retention remained constant for 20 years, as opposed to the default assumed effect persistence of 5 years.
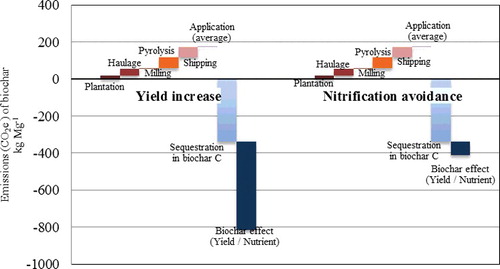
The average EFB biochar carbon footprint (CO2e Mg−1 biochar) is found to be − 691 kg in consideration of biochar yield effect decreasing crop emissions intensity, and −286 kg in consideration of plant nutrient uptake reducing nitrification. For every application rate, the carbon footprint of the biochar for augmented crop yield was lower than that of the increased nutrient uptake for avoided fertilizer use. presents the average greenhouse gas emission sources and sinks.
Figure 5. Average CO2e sources and sinks of biochar carbon footprint considered in terms of yield effect (decreased crop emissions intensity) and nutrient saving (leading to nitrification avoidance).
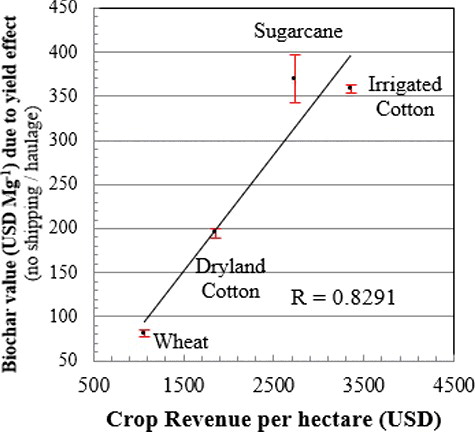
While 44% of the scenarios delivered a positive return on investment (ROI) where biochar was applied for its yield effect, none of the scenarios delivered a positive ROI where the biochar product was evaluated for the intent of reducing fertilizer use. Where biochar yield performance is assumed constant across crops, the value of the crop (revenue per hectare) is a statistically significant linear predictor of biochar value (using student's t-test, α = 0.1%) This is affirmed in consideration of the correlation coefficient of 83% for the linear relationship between crop revenue per hectare and average biochar value ().
Figure 6. Simple linear regression of average biochar value (applied for yield increase) and crop revenue per hectare. Bounds around mean values are 95% confidence intervals. The model has a Pearson's correlation coefficient of 83%.
The pyrolysis process constitutes the greatest source of costs and emissions, representing 27% of the present value of expenses and 60 kg of greenhouse gas emissions (CO2e).
Discussion
There is a significant contrast in the NPV of EFB biochar when used for yield effect and the NPV of EFB biochar when used for nutrient saving. None of the scenarios delivered a positive ROI where the biochar product was evaluated for the intent of reducing fertilizer use.
A substantial difference was observed in the results across biochar value created depending on crop, application rate, and yield or nutrient saving perspective. The extent of this range can be illustrated in the case of EFB biochar applied to sugarcane for yield effect at 40 Mg ha−1, resulting in a positive NPV of USD $5.9 million, representing a 143% ROI, and the case of EFB biochar applied to wheat at 1 Mg ha−1 for yield effect, resulting in an NPV loss of USD $5.4 million, equivalent to an ROI of −87%.
Sensitivity analysis
Several model variables appear to be highly sensitive for the financial model ().
Figure 7. Sensitivity analysis considering the key variables of the model. Sensitivity is measured as deviation from the base scenario of net present value. Variables include Container or Bulk Shipping (Containers), Feedstock Cost (Feedstock), Haulage Distance, Long Term Biochar Price (LT Bc Price), Cost of Capital, Operational Expenditure (Opex), Capital Expenditure (Capex), Exchange Rate IDR/AUD (FX), Carbon Price (C Price), Long Term Fertiliser Price (LT Fert Price).
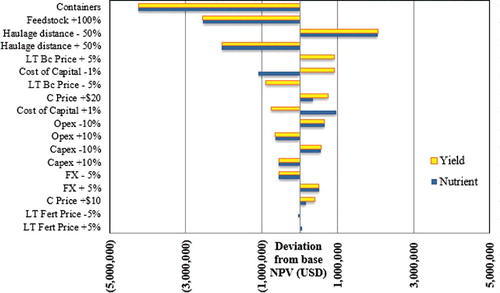
Any convergence of the Indonesian rupiah (IDR) to the Australian dollar (AUD) influences NPV, with a 5% decrease in IDR/AUD value leading to a decrease in project NPV by USD $110,000 where EFB biochar is considered for yield effect. The value of the project in consideration of EFB biochar yield effect is increased by USD $80,000 with a USD $10 carbon price. This assumes that reduced GHG emissions are eligible for accreditation in a hypothetical carbon market and that the value of the carbon credit is incorporated in the sale price of the biochar, with credit ownership transferring to the end user. A 1-percentage-point increase in cost of capital, used as the discount rate ‘r’, decreases the NPV result in consideration of biochar yield effect by USD $150,000. This implies that sources of capital will be a substantial influence on project value. The shipping cost component of the biochar product per Mg is significantly altered by whether container shipping or bulk shipping is adopted.
Container shipping decreases project NPV by USD $850,000, increasing the average break-even price from USD $266–329 Mg-1 of biochar. This study assumes that the biochar product is transported via bulk shipping, an assumption that presupposes sufficient market demand to sustain large transport volumes. In earlier stages of the market, container shipping would be the likely method of transport, and has the higher unit cost.
Biochar persistence effect
Adjustments of biochar effect persistence demonstrate its importance as a determinant of ROI. The average biochar value applied for yield augmentation exceeds the break-even price only where biochar yield effect persists for 5 years or more ().
Figure 8. Effect persistence of biochar yield effect on average return on investment.
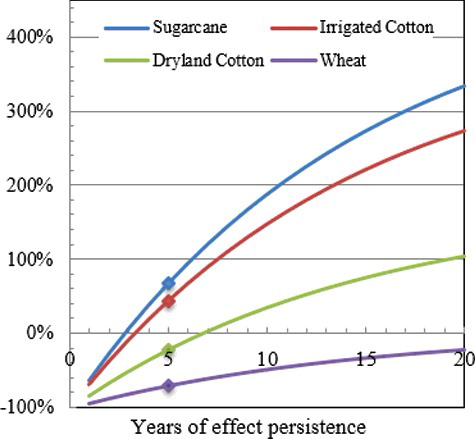
Despite this, there are 29 individual sugarcane application scenarios that demonstrate positive returns where the yield effect of the biochar persists for 3 years of duration. In the case where biochar yield effects persist for 4 years, 68 of the 160 cases exhibited positive ROIs. In contrast to this, no cases exhibited positive ROIs where biochar was valuated in the context of nutrient saving, irrespective of the duration of effect persistence. Similarly, the carbon sequestration of EFB biochar is increased where the biochar product has longer effect persistence, particularly where the biochar use intention is crop yield augmentation.
Land-use change significantly alters EFB biochar's carbon footprint. Conversion of peat forest to oil palm plantation leads to a footprint (CO2e Mg−1 biochar) of 4742 kg in this study. Conversely, land-use change of grassland to oil palm plantation leads to a carbon footprint of − 1030 kg.
Conclusion
The average break-even point for the biochar producer of USD $266 Mg−1 is low in the context of the literature [Citation14–16,Citation38,Citation39] and in the context of Australian biochar producers. Harsono et al. [Citation14] calculated a minimum sale price of USD $533 Mg−1 for EFB biochar in 2013. Personal communications with five wholesale Australian biochar producers, namely Black is Green [Pers. Comm., March 5, 2016], Biochar Industries [Pers. Comm., March 8, 2016], CCarbon [Pers. Comm., March 6, 2016], Triple R Biochar [Pers. Comm., March 22, 2016], and Earth Haven Biochar [Pers. Comm., March 7, 2016] during March of 2016 implied an average minimum biochar price of USD $727 Mg−1 and a maximum order size of 27 Mg. This indicates that the international trade scenario considered in this paper is cost competitive in comparison with current Australian prices. This supply chain is particularly sensitive to the method of shipping, feedstock cost and haulage distance.
EFB biochar use for yield augmentation resulted in 44% (70/160) commercially viable scenarios, specifically in crops with higher revenue per hectare (sugarcane: 30/40, irrigated cotton: 40/40). EFB biochar's use for reducing fertilizer requirements is not viable under any scenario considered in this paper, and these results are insensitive to fertilizer price fluctuation. Extending from this, it was found that the exact same biochar product with uniformly assumed modelled influence on yield had different valuations when applied to different Australian crops. Specifically, the value of the biochar is positively correlated with the magnitude of the revenue per hectare of the crop.
The carbon footprint of the biochar supply chain is net negative in all scenarios, with CO2e averaging −489 kg Mg−1 biochar where land-use change is excluded. However, EFB biomass sourced from plantations where land-use change of forest or peat forest has occurred within the system boundary results in a net CO2e emission of 2087 kg and 4742 kg Mg−1 of biochar produced, respectively. In contrast to EFB's current use as an organic fertilizer, the average carbon footprint of 1 metric ton of EFB used in the biochar supply chain as defined in this paper leads to an emissions reduction of 102 kg Mg−1 of EFB. If this practice were extended across the 6.4 million hectares of Indonesian oil palm plantation, an annual CO2e emissions reduction of 3.1 million Mg could be achieved.
EFB biochar with longer persistence of effects increases both financial value and net greenhouse gas emissions reduction within the assumptions made here. Longer term field trials measuring yield, nutrient retention in excess of 12 months for EFB biochar and biochars more generally are needed to ascertain the persistence of yield and nutrient retention effects. This in turn will enable improved accuracy in the quantification of biochar's financial viability and greenhouse gas emission reduction.
Financial analyses of biochar that evaluate crop yield effect have tended to focus on low-value crops such as wheat [Citation16], and they conclude that biochar is unviable without substantial cost reduction or economic incentives. The present study produced a similar result in wheat, but also demonstrated that biochar viability is strongly influenced by crop revenue per hectare. Crop value should therefore be a key consideration for the marketing efforts of biochar producers and the purchasing decisions of biochar users, with higher revenue per hectare crops such as sugarcane or irrigated cotton generating far more financial value where biochar yield effect is comparable.
Acknowledgements
This research did not receive any specific grant from funding agencies in the public, commercial or not-for profit sector.
Disclosure statement
No potential conflict of interest was reported by the authors.
References
- Sohi SP, Krull E, Lopez-Capel E, Bol R. A review of biochar and its use and function in soil. In: Advances in Agronomy. Donald LS (Ed.). Academic Press, Burlington, 47–82 (2010).
- Lehmann J, da Silva JP Jr., Steiner C, Nehls T, Zech W, Glaser B. Nutrient availability and leaching in an archaeological Anthrosol and a Ferralsol of the Central Amazon basin: fertilizer, manure and charcoal amendments. Plant Soil. 249, 343–357 doi:10.1023/A:1022833116184 (2006a).
- Lehmann J, Gaunt J, Rondon M. Bio-char sequestration in terrestrial ecosystems – a review. Mitig. Adapt. Strat. Glob Change 11, 403–427 doi:10.1007/s11027-005-9006-5 (2006b).
- Major J, Steiner C, Downie A, Lehmann J. Biochar effects on nutrient leaching. In: Biochar for Environmental Management: Science and Technology. Joseph S, Lehmann J (Eds). Earthscan, London, 271–288 (2009).
- Mukherjee A & Lal R. The biochar dilemma. Soil Res. 52, 217–230 doi:10.1071/SR13359 (2014).
- Crane-Droesch A, Abiven S, Jeffrey S, Torn M. Heterogeneous global crop yield response to biochar: a meta-regression analysis. Environ. Res. Lett. 8(4), 044049 doi:10.1088/1748-9326/8/4/044049 (2013).
- Sanchez PA Ecology. Soil fertility and hunger in Africa. Science 295(5562), 2019–2020 doi:10.1126/science.1065256 (2002).
- Mikhlef S, Saidur R, Safari A, Mustaffa W. Biomass energy in Malaysia: current state and prospects. Renew. Sustain. Energ. Rev. 15(7), 3360–3370 doi:10.1016/j.rser.2011.04.016 (2011).
- Farine D, O'Connell D, Raison R, et al. An assessment of biomass for bioelectricity and biofuel and for greenhouse gas emission reduction in Australia. Glob. Change Biol. Bioenergy 4, 148–175 doi:10.1111/j.1757-1707.2011.01115.x (2012).
- GA. Australian Energy Resource Assessment. Geoscience Australia, Canberra, ACT (2014).
- BREE. Energy in Australia 2014. Bureau of Resources and Energy Economics, Canberra, ACT (2014).
- Kong SH, Loh SK, Bachmann RT, Rahim SA, Salimon J. Biochar from oil palm biomass: a review of its potential and challenges. Renew. Sustain. Energ. Rev. 3, 729–739 doi:10.1016/j.rser.2014.07.107 (2010).
- Roberts KG, Gloy BA, Joseph S, Scott NR, Lehmann J. Life cycle assessment of biochar systems: estimating the energetic, economic, and climate change potential. Environ. Sci. Technol. 44, 827–833 doi:10.1021/es902266 (2010).
- Harsono SS, Grundman P, Hang Lau L, et al. Energy balances, greenhouse gas emissions and economics of biochar production from palm oil empty fruit bunches. Resour. Conserv. Recycl. 77, 108–115 doi:10.1016/j.resconrec.2013.04.005 (2013).
- Shackley S, Clare A, Joseph S, McCarl B, Schmidt HP. Economic evaluation of biochar systems. In: Biochar for Environmental Management: Science and Technology. Joseph S, Lehmann J, (Eds). Earthscan, London, 821–822 (2015).
- Dickinson D, Balduccio L, Buysse J, Ronsse F, Van Huylenbroeck G, Prins W. Cost-benefit analysis of using biochar to improve cereals agriculture. GCB Bioenergy 7, 850–864 doi:10.1111/gcbb.12180 (2015).
- Germer J, Sauerborn J. Estimation of the impact of oil palm plantation establishment on greenhouse gas balance. Environ. Dev. Sustain. 10, 697–716 doi:10.1007/s10668-006-9080-1 (2008).
- Butler R, Koh L, Ghazoul J. REDD in the red: palm oil could undermine carbon payment schemes. Conserv. Lett. 2, 67–73 doi:10.1111/j.1755-263X.2009.00047.x (2009).
- Hooijer A, Page S, Canadell J, et al. Current and future CO2 emissions from drained peatlands in Southeast Asia. Biogeosciences 7, 1505–1514 doi:10.5194/bg-7-1505-2010 (2010).
- Bakar RA, Razak ZHA, Ahmad SH, Seh-Bardan BJ, Tsong LC, Meng CP. Influence of Oil Palm Empty Fruit Bunch Biochar on Floodwater pH and Yield Components of Rice Cultivated on Acid Sulphate Soil under Rice Intensification Practices. Plant Produc. Sci. 18, 491–500 doi:10.1626/pps.18.491 (2015).
- Boardman A, Greenberg D, Vining A, Weimer D. Cost Benefit Analysis: Concepts and Practice. Prentice Hall, Englewood Cliffs, NJ, USA (1996).
- Wang T, Camps-Arbestain M, Hedley M. Predicting C aromaticity of biochars based on their elemental composition. Org. Geochem. 62, 1–6 doi:10.1016/j.orggeochem.2013.06.012 (2013).
- Lehmann J, Abiven S, Kleber M, et al. Persistence of Biochar in Soil. In: Biochar for Environmental Management: Science and Technology. Lehmann J, Joseph S (Eds). Earthscan, London, 235–282 (2015).
- Claoston N, Samsuri AW, Husni MHA, Mohd Amran MS. Effects of pyrolysis temperature on the physicochemical properties of empty fruit bunch and rice husk biochar. Waste Manag. Res. 32, 331–339 doi:10.1177/0734242X14525822 (2014).
- IR.H.M.Solichin MP, . The use of liquid smoke for natural rubber processing. In: IR.H.M. SOLICHIN, MP. Indonesia (2002, World Intellectual Property Organisation).
- Rabileh MA, Shamshuddin J, Panhwar QA, Rosenani AB, Anuar AR. Effects of biochar and/or dolomitic limestone application on the properties of Ultisol cropped to maize under glasshouse conditions. Can. J. Soil. Sci. 95, 37–47 doi:10.4141/cjss-2014-067 (2015).
- Abdulrazzaq H, Hamdan J, Husni A, Bakar RA. Biochar from empty fruit bunches, wood and rice husks: effects on soil physical properties and growth of sweet corn on acidic soil. JAS 7(1), 192–200 doi:10.5539/jas.v7n1p192 (2014).
- Chase LDC, Henson IE, Abdul-Manan AFN, et al. The PalmGHG Calculator: The RSPO Greenhouse Gas Calculator for Oil Palm Products, Beta-Version. The Roundtable for Sustainable Palm Oil (RSPO), Kuala Lumpur, Malaysia (2012).
- Hansen S. Feasibility study of performing an life cycle assessment on crude palm oil production in Malaysia. Int. J. Life Cycle Assessm. 12(1), 50–58 doi:10.1065/lca2005.08.226 (2007).
- Renouf MA, Wegener MK. Environmental life cycle assessment (LCA) of sugarcane production and processing in Australia. Proceedings of the Australian Society of Sugar Cane Technologists. 2007 Cairns, , Queensland, Australian Society of Sugar Cane Technologists.
- Biswas WK, Barton L, Carter D. Global warming potential of wheat production in Western Australia: a life cycle assessment. Water Environ. J. 22(3), 206–216 (2008).
- Visser GF, PhD Thesis. The development of a crop carbon management model to add value to agricultural products through the reduction in Greenhouse Gas emission levels, School of Geography, Planning and Environmental Management, University of Queensland, 10.14264/uql.2014.328. (2014, 133).
- McKinnon A, , Piecyk M. Measuring and managing CO2 emissions of European Chemical Transport. 2010, Brussels, Brussels Capital Region, Belgium. European Chemical Industry Council.
- Kittithammavong V, Arpornpong N, Charoensaeng A, Khaodhiar S. Environmental life cycle assessment of palm oil-based biofuel production from transesterification: greenhouse gas, energy and water balances. A Presentation at International Conference on Advances in Engineering and Technology (ICAET’2014), March 29-30. (2014, Singapore, Republic of Singapore, International Institute of Engineers).
- IPCC. 2006 IPCC guidelines for national greenhouse gas inventoriess – A primer, Prepared by the National Greenhouse Gas Inventories Programme. Miwa K, Eggleston HS, Srivastava N, Tanabe K (Eds). IGES, Japan (2008).
- Gaunt J, Cowie A. Biochar, greenhouse gas accounting and emissions trading. In: Biochar for Environmental Management: Science and Technology. Joseph S, Lehmann J (Eds). Earthscan, London, 317–340 (2009).
- Bouwman AF. Direct emission of nitrous oxide from agricultural soils. Nutr. Cycl. Agroecosyst. 46, 53–70 doi:10.1007/BF00210224 (1996).
- Wrobel-Tobiszewska A, Boersma M, Sargison J, Adams P, Jarick S. An economic analysis of biochar production using residues from Eucalypt plantations. Biomass Bioenergy 81, 177–182 doi:10.1016/j.biombioe.2015.06.015 (2015).
- Galinato S, Yoder J, Granatstein D. The economic value of biochar in crop production and carbon sequestration. Energy Policy 39, 6344–6350 doi:10.1016/j.enpol.2011.07.035 (2011).
Websites
- Aji P. Summary of Indonesia's Poverty Analysis. Asian Development Bank, (2015). http://www.adb.org/publications/summary-indonesias-poverty-analysis ( Accessed 1 January 2016)
- BPS. Plantation Area by Province and Crops, Indonesia (000 Ha) 2012–2014. Badan Pusat Statistik (Statistics Indonesia), (2015). http://www.bps.go.id/Subjek/view/id/54#subjekViewTab3accordion-daftar-subjek3 ( Accessed 10 October 2015)
- Nusantara. Tronton Fuso Truck Rentals. (2015). http://en.nusagroup.web.indotrading.com/product/sewa-truck-tronton-p174871.aspx
- PortBris. Schedule of Port Charges 1 July 2016. Port of Brisbane, (2016). https://www.portbris.com.au/PortBris/media/General-Files/Shipping%20Operations/PORT18618-PortCharges-2016-Final-110416.pdf ( Accessed 13 February)
- FP. Fremantle Ports Ship and Cargo Charges. Fremantle Ports, (2015). http://www.fremantleports.com.au/SiteCollectionDocuments/Ship%20and%20Cargo%20Charges%20from%201%20July%202015.pdf
- NQBP. Port of Mackay Shipping Charges. North Queensland Bulk Ports Corporation, (2015). http://nqbp.com.au/wp-content/uploads/2015/10/Port-Pricing-Mackay-2015-2016.pdf ( Accessed 19 February)
- MOL. Indonesia (ID) – All ports/location. Mitsui OSK Lines. (2013). http://www.molpower.com/VLCWeb/UISTATIC/Tariff/localcharge/Indonesia.pdf
- SeaRates. Request a freight quote. SeaRates. (2016). https://www.searates.com/shipping/request/fcl ( Accessed 20 December)
- WBG. GEM Commodities. World Bank Group. (2016). https://data.worldbank.org/data-catalog/commodity-price-data
- UNFCCC. , Global Warming Potentials. United Nations Framework Convention on Climate Change, (2014). http://unfccc.int/ghg_data/items/3825.php