ABSTRACT
This work is intended to present an investigation into the macroeconomic reasons for carbon dioxide emissions in Pakistan for the period 1971–2016. This study adds to the current empirical literature on the association among carbon dioxide emissions, energy consumption, economic growth and the level of investment in Pakistan. The data has been checked for its stationarity by applying the augmented Dickey-Fuller (ADF) unit root test, and then a cointegration test helped in the estimation of long-run equilibrium association between environmental variables. The outcomes of the co-integration test suggest the presence of a long-run equilibrium connection between series. The results of Vector Error Correction Model (VECM) demonstrate that all variables transform to sustain long-run equilibrium. The outcomes of a Granger causality test showed that causality runs from economic performance and population toward CO2 emissions, while bi-directional causality is found between carbon dioxide emissions and energy usage, and carbon dioxide emissions and trade openness. The results of cumulative sum of recursive residuals (CUSUM) and cumulative sum of recursive residuals squares (CUSUMSQ) show the stability of the functional relationship established in the present work, which implies that this model is an adequate and useful tool for strategy formulation. So, an upsurge or a decrease in macroeconomic series will cause and has caused variations in carbon dioxide emissions in the long run in Pakistan.
Introduction
The emission of carbon dioxide from the burning of fossil fuels has increased by 3 times since 1960. The world faces greater concerns as carbon dioxide emission has played a significant role in global warming. Carbon dioxide emissions – economic performance models could play a vital role in explaining part of population growth patterns and economic performance patterns. The fast growth of the economy and high increase of population increase the degradation of the environment.
The empirical testing of environmental and macroeconomic variables is necessary; because every economy heavily depends on energy consumption, the environmental policies of energy conservation have the potential to influence economic performance. Knowledge of directional causality among macroeconomic variables and environmental variables can elucidate policy implications and recommendations. The most critical problems faced by the world economy are the formulation and implementation of restrictions on emissions of carbon dioxide for the welfare of society and the betterment of the environment.
Various governments of the world signed the Kyoto Protocol in 1997, which was related to the emission of environmental pollutants and gases. The protocol emphasizes that industrial countries of the world must reduce their emissions to 5% less than the emission level in 1990, during the period from 2008 to 2012. Trade can intensify pollution and environmental degradation in developing economies due to the production of emission-intensive products. The climate dynamics of Asian countries are very delicate due to their weather conditions and deployment of heavy industry.
Developing countries, such as Pakistan, do not have access to infrastructure facilities and financial resources to adapt to climatic variations. Pakistan fulfills more than 50% of its energy needs using oil and gas, which contribute toward the emission of carbon dioxide in the environment. Environmental problems become more sensitive in the case of Pakistan, which is in the phase of development and is using a considerable amount of energy to run the cycle of its economy. The government of Pakistan cannot afford to think about controlling climatic variations at the cost of its economic performance. This study will analyze this sensitive and critical problem of Pakistan.
The Pakistani economy has observed remarkable as well as depressing growth rates, and a high as well as a low level of economic development between 1971 and 2016. So, this kind of study is of great significance for Pakistan to plan the path toward a decrease in CO2 emissions intensity. This work attempts to observe the contributory associations among carbon emissions, economic performance, and energy usage in Pakistan, employing annual time series data, and including trade openness, level of investment and population as possible determinants of energy emissions.
The contribution of the current work is that it considers several potential advantages as compared to the earlier literature. The research contributes to the body of empirical literature by attempting to observe the contributory connection among economic performance, energy usage and carbon dioxide emissions in Pakistan with yearly time series data, and including the level of investment, trade openness and population growth as possible determinants of carbon dioxide emissions. To best of the authors’ knowledge, this is the first study to incorporate the level of investment, trade openness and population growth as possible determinants of carbon dioxide emissions in general, and particularly for the case of Pakistan. Moreover, another contribution is that this study employed the most recent available data set (i.e. from 1971 to 2016). To best of the authors’ knowledge, this is the first work to use this latest available data set. Another input of this work is toward strategy making. The outcomes of this research work could support legislators in developing a complete energy policy on the degradation of the environment in Pakistan.
This research is also an effort to fulfill the gap identified in [Citation1]. That study indicated in its conclusion that other researchers should use their methodology and results to obtain better insight into the environment and finance-economic connection in other developing countries. As Pakistan is the developing country of the world, so this study fulfills the gap indicated in [Citation1]. To make this work more valuable, the following variables were added to the study: level of investment, trade openness and population, with an opinion on classifying the explanatory variable(s) accountable for the Granger positioning of CO2 emission and energy usage, thus revealing the cause of Pakistan's environmental degradation. The fundamental intention is to utilize the results of this study as strategic guidance for other South Asian countries, who are engaged in their own struggle to meet their economic growth prospects and minimize environmental degradation.
The remainder of the current article is as follows. The next section presents a survey of previous work on the topic under review. The third section elaborates the methodology employed in this paper. The results are analyzed and debated in the fourth section. The fifth section concludes the study.
Literature review
Many studies have been carried out to determine the relationship between the carbon emission, energy consumption and economic performance of a country. Researchers [Citation2–5,Citation101] have debated whether economic performance and energy consumption lead to higher carbon emission, which further leads to environmental pollution. They have suggested that environmental pollution and economic performance both increase with increased usage of energy. There is a dynamic relationship among economic growth, energy consumption and carbon emission in the USA [Citation6]. Increase in economic growth leads to an increase in energy consumption, which increases CO2 emission. The work of [Citation7,Citation8] studied France and Malaysia's economic performance and concluded that in these countries, economic growth leads to energy consumption and CO2 emission. The study of [Citation9] found that there is a direct relationship between Chinese economic performance and energy consumption and CO2 emission. The paper [Citation10] investigated 11 countries to find their relationship among economic performance, energy consumption, and carbon emission.
In the context of the Turkish economy, the impact of financial development, energy usage, trade openness and economic growth on carbon dioxide emissions has been assessed in [Citation1]. The study employed data from 1960 to 2007 for its analysis. The findings of the study revealed the verification of the environmental Kuznets curve (EKC) hypothesis in Turkey. The results of the bound F-test approach for cointegration gave proof of a long-run association among the variables employed in the study. The study concluded that any variations in the long-run equilibrium among variables are adjusted for each interval to reach the level of the long-run equilibrium.
Countries like Bangladesh and Indonesia have other sources of CO2 emissions besides economic activities, whereas other countries are facing CO2 emissions due to economic performance and increase in energy consumption. Examining per-capita carbon emission, electricity consumption per capita, Gross Domestic Product (GDP) per capita and fiscal expansion through in-depth research, a study [Citation11] concluded that electricity consumption could increase carbon emission which would in turn increase GDP per capita and economic development. According to [Citation12], Saudi Arabia tried to reduce its CO2 emission, but this had adverse effects on the economic growth of the country. Energy consumption, energy price and carbon emission are the driving forces of economic growth. Industrial civilization is using fossil energy for economic activity. Greenhouse gas emissions are increasing day by day, which shows a constant increase in human activities. Coal consumption for energy is around 69.7% of the total energy. The paper [Citation13] concluded that CO2 emission has a positive relationship with economic growth and increase in GDP in the case of China.
Another study [Citation14] looked into the association among CO2 emissions, economic growth and use of energy over the period from 1971 to 2007 for six Association of South-East Asian Nations (ASEAN) (Indonesia, Malaysia, Philipines, Singapore, Thailand and Brunei Darussalam). That study employed panel vector autoregression (VAR) methodology to discover the connection between series. The outcomes of research stated that energy usage has a statistically meaningful role in the GDP growth equation. This means that intensive energy usage leads to better economic activity. The results of the VAR suggested that the growth hypothesis holds for ASEAN states. The research paper concluded that energy plays a limiting role toward economic growth and energy supply shocks could negatively affect economic growth.
A study [Citation15] observed the connection between economic performance, CO2 emissions, and energy usage in Italy. The study employed different time series econometric methods such as unit root tests for stationarity, cointegration and VAR for the long-run association, and a Toda–Yamamoto (TY) causality test for analysis of causality. The results indicated that CO2 emissions and real GDP play a role in driving energy consumption. The research showed bi-directional causation among CO2 emissions and economic performance. The study concluded that Italy has to reduce CO2 emissions via reducing energy use.
The causal association among real GDP, financial development, urbanization, CO2 emissions, trade openness and energy usage is the focus of a study in the context of Tunisia [Citation16]. The study covers the period from 1971 to 2012, and used the Auto-Regressive Distributive Lag (ARDL) test to estimate long-run association and an error correction method for analyzing short-run dynamics of the relationship among variables. This research showed that Tunisia's financial progress is taking place at the cost of environmental pollution. The study could not prove the validity of the EKC hypothesis in the case of Tunisia.
Another paper [Citation17] analyzed the connections among the growth of the economy, emissions of CO2 and energy usage from 1971 to 2006 in case of Israel. The study employed time series econometric techniques for analysis of data. Various tests of a unit root were applied to check stationarity of data. The study used Johansen and Juselius cointegration and the TY Granger non-causality test for underlying association among variables. The results indicated the existence of long-run association among series. The outcomes of the causality test showed that GDP initiated energy usage and CO2 emissions. The study concluded that waste and energy usage would have little or no influence on the performance of the economy.
The influences of trade, financial development and growth of the economy on electric power consumption were observed in [Citation18] for Japan. That paper employed the Cobb-Douglas production function for time series data from 1970 to 2012. The findings revealed the presence of a long-run relationship among the series. The research concluded that capital lowers energy usage in Japan, in both the short run and the long run.
The work of [Citation48] tried to investigate the effects of Foreign Direct Investment (FDI), economic growth, and energy consumption on carbon dioxide emissions. In this regard, five economically developed ASEAN countries, namely Indonesia, Malaysia, the Philippines, Singapore and Thailand, were selected for the period from 1981 to 2011. The primary reason for choosing these ASEAN countries was the observation of high energy demand in the last few years in these countries. The study employed a panel data framework to find out the determinants of carbon dioxide emission. Further, quantile regression techniques were used to investigate the factors throughout the conditional distribution. The results showed that the impacts of different factors on CO2 emissions are divergent. The effect of FDI on CO2 emission is positive, but this is negative in the low- or middle-emission countries. Energy consumption also has a significant positive effect with high quantiles, while economic growth was found to have an adverse effect in the uppermost quantile.
The study [Citation49] has examined the EKC hypothesis in Brazil, India, China and Indonesia. This bell-shaped EKC curve explains that economic growth brings prosperity to the environment in the long run. It states that environmental well-being rises first with high economic growth and then falls at the last stage of a given income level. Population growth was taken as one of the significant factors in the model as it is considered to increase greenhouse gas emissions and urbanization. The results showed that the relationship between economic growth and the environment is vital in all of the selected countries, and energy consumption and population growth act as a mediating variable and play an important role in carbon dioxide emissions. In China, GDP per capita and energy consumption per capita were found to have a significant positive relationship with CO2 emissions in both the long and short run. For Brazil, a significant negative relationship was found of population growth with CO2 emissions, while GDP per capita and energy consumption were found to have a significant positive relationship in the long run. Overall, the study supports the fact that energy consumption and economic growth have a negative effect the environment. Therefore, these countries, as emerging economies, should focus efforts on energy savings and should fulfill energy demands through non-fossil fuels.
An investigation of the association among energy consumption, economic growth and carbon dioxide emissions for the years 1992 to 2013 in South Caucasus and Turkey was carried out in [Citation19]. The study employed three variables (i.e. GDP per capita, CO2 emissions per capita and energy usage). The principal purpose of this work was to make a comparison of aggregate income to energy factors in countries at different levels of socio-economic integration. The study employed panel-data VAR methodology for analysis. The VAR estimates show that real GDP has been influenced by its previous trends as well as by CO2 with a negative sign, indicating that emissions have a determining effect on the economic activity of the region.
Another study, conducted by [Citation50]), investigated the effects of carbon dioxide emissions in 12 sub-Sahara African countries from 1971 to 2010. This study used the bounds test to check the cointegration as well as causality among variables as developed by previous researchers. It was found that in the long run, there is a direct relationship of energy consumption and economic growth with CO2 emissions. The bi-directional causal relationship is found between economic growth and carbon dioxide emissions for the Democratic Republic of Cango, Gabon and Nigeria. This result supports the literature and the hypothesis that the levels of economic activity and CO2 emissions affect each other.
An analysis of economic performance, CO2 emissions and energy consumption in Middle East countries was carried out in [Citation20]. The study authors chose 10 different Middle East countries over the period 1971 to 2010 for analysis. The study employed panel-data VAR methodology. This technique incorporates traditional VAR methodology. It takes all variables in the system as endogenous, with a panel-data approach that allows for individual unobserved heterogeneity. In the VAR estimations of Gulf Cooperation Council (GCC) countries, the response of economic growth is negative toward CO2 emissions. Energy usage drives CO2 emissions along with lagged CO2 emissions. The study notes that energy usage and CO2 emissions have no impact on the economic growth of non-GCC nations.
The study [Citation51] analyzed the spatiotemporal and econometric characteristics of CO2 emissions in China for the period 1995–2012. As China is now becoming the world's largest developing country, the results of this study indicate that its per capita and total carbon dioxide emissions have notably increased in the past few years. In this regard, panel data was employed to measure the causal relationship among economic growth, energy consumption, and CO2 emissions. The overall results show a positive cointegration among all variables in the long run. Due to the rapid economic growth of China, it depends on carbon energy consumption, which is the primary cause of increasing carbon dioxide emissions in China. So, the findings indicate an urgent need to implement long-term energy and economic development policies in China to address the issues caused by the emission of CO2 and other greenhouse gases.
The study [Citation21] assessed the association among energy use, GDP and CO2 emissions for six GCC states from 1960 to 2013. Several econometric time series tools were used for analysis. The paper revealed that the ‘energy-led growth hypothesis’ holds for Kuwait, Oman and Qatar. The ‘conservation hypothesis’ holds for Bahrain, ‘feedback mechanism’ for Saudi Arabia and ‘neutrality hypothesis’ for the United Arab Emirates. According to [Citation22], the absence of causality among GDP and energy usage is referred to as the ‘neutrality hypothesis’. Uni-directional causality running from GDP toward energy is called the ‘conservation hypothesis’. Uni-directional causality running from energy to economic performance is called the ‘growth hypothesis’. The bi-directional causality between economic performance and energy usage is known as a ‘feedback mechanism’.
The influence of trade openness, economic performance and financial progress on energy was addressed for the South African economy [Citation23]. The study covers the period from 1970 to 2011. The study employed the Ng-Perron unit root test and the Zivot-Andrew unit root test for a structural break. The research examined the long-run relationship through the ARDL bound test approach to cointegration,. and causality was investigated through vector error correction model (VECM) Granger causality analysis. The study concluded that financial development plays a stimulating role in energy demands of South Africa. It is argued in the study that energy should be acknowledged as a partially responsible element for achieving strategic economic development and sustainable growth of the economy.
Literature focusing on Pakistan
Several studies including empirical research have focused on the economy to study the environmental degradation and economic performance of Pakistan. This segment of the paper points out the gaps in these studies and outlines the contribution of the current study toward those issues on which previous studies were silent. A detailed analysis is given below.
The existing literature outlines three different approaches to studying the association between macroeconomic variables and environmental variables of the country. The first approach emphasizes environmental degradation variables and economic performance linkage, which is commonly acknowledged as examining the soundness of the EKC hypothesis. The second approach concentrates on the association between economic performance and usage of energy in the country. The third approach is a combination of the above two methods, which observes the connection of economic performance, environmental variables, and energy usage together.
The current study employs this third approach, examining economic variables and environmental variables along with energy consumption simultaneously. Most of the previous reviews on Pakistan have used tri-variate models, focusing on quadratic relationships, that yield inconsistent findings. As indicated in , the EKC hypothesis is rejected or partially verified in all cases, so now it has become necessary to study a multivariate model by including the level of investment, trade openness and population growth simultaneously in a linear relationship. None of the previous studies included the level of investment in their model. So, the current research focuses on including the level of investment as a potential determinant of emissions, along with incorporating trade openness and population growth in the model.
Table 1. Summary of literature focusing on Pakistan
Methodology
In contrast with a couple of past studies, the present study looked at a multivariate system that is used to identify the actual and real relationship among six variables, instead of analyzing bi-variate or tri-variate association. The present paper uses environmental and macroeconomic variables in the settings of Pakistan's economy. The study examines the connections among environmental and macroeconomic variables using various econometric time series tools. This study postulates a linear relationship between different variables. The basic structure of the model is an extended version of another study [Citation29] that has been adapted for the case of Pakistan. The model has the following formula:
(1)
where:
= carbon dioxide emissions per capita
Energy consumption and economic performance are widely considered primary sources of national carbon dioxide emissions, greenhouse gases and ultimate degradation of the environment. Government institutions and other bodies across the globe pay attention to such concerns when analyzing the dimensions of climatic variations, and other ecological disruptions. According to a report of the Royal Society [Citation52], increasing patterns of energy consumption are exhausting the resources of the planet and hence producing various environmental issues including carbon dioxide emissions to the atmosphere. So, this is the original notion of including the variables (i.e. carbon dioxide emissions, energy consumption and economic performance) in an empirical model of the current study [Citation30].
The belief exists in different policy circles that the level of investment (public as well as private) can increase the level of productivity in a country,which can in turn lead to better economic performance. Public and private investment not only provides capital financing for the economy but also develops positive externalities through technology adoption. This proposition generates a debate about its costs and benefits. Capital inflows undoubtedly boost economic activity and productivity gains. Private-sector investment is encouraged because of its prominent role in job creation and economic growth. However, these concerns could undercut environmental regulations to attract investment in general, and mainly private investment. The bottom line is that a country becomes ‘pollution heaven’ as the private sector tries its best to cut environmental costs. Even the government/public sector is least interested in environmental concerns in countries like Pakistan, where the government itself initiated the project of coal power plants for electricity generation, which will undoubtedly lead to environmental degradation of the associated area in future. This notion leads to the inclusion of the variable ‘level of investment’ in the current study [Citation3].
In recent times, various international bodies, especially the World Trade Organization (WTO), International Center for Trade and Development International Trade Center, have emphasized a strong association between trade and environment. They aim to propose a program on natural resources, trade and environment as they are focusing on the need for an adequate trade plan that could lead toward sustainable development and an improved lifestyle in different nations using natural resources. Pakistan became a member of the WTO on January 1, 1995, but Pakistani economists and policymakers have not developed a framework for examining the effects of trade opening on pollution and environment and vice versa. So, this study has included the variable of trade openness in its empirical model to capture the effect mentioned above. The fundamental proposition is that carbon dioxide emissions could be affected due to an increase in economic activity as a result of trade. The boost in trade will generate economic activities as well as energy usage. Assuming other things remain constant, economic activities and energy usage could lead to higher carbon dioxide emissions [Citation31].
The variable of population is also part of the empirical model of the current study. Everyone has energy demands for shelter, water, food and so forth. Assuming all else is equal, if the population increases, energy demands also increase. The literature suggests two phenomena: first, increasing population in any country could generate a demand for energy for different purposes such as power, transportation and industry, thus increasing carbon dioxide emissions. The second phenomenon elaborates that population growth could lead to deforestation that could contribute to carbon dioxide emissions [Citation32].
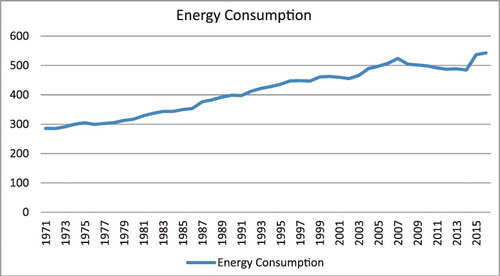
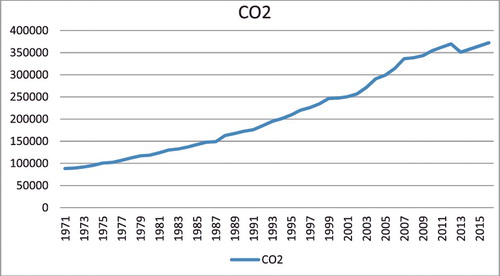
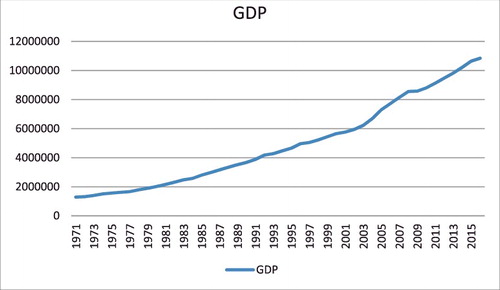
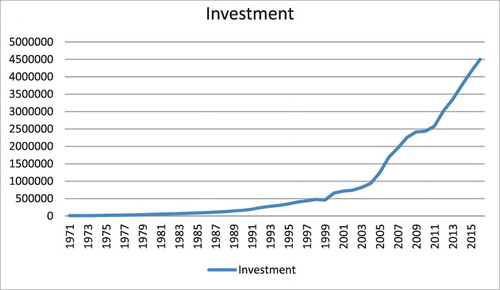
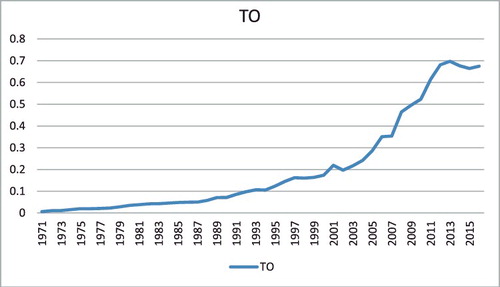
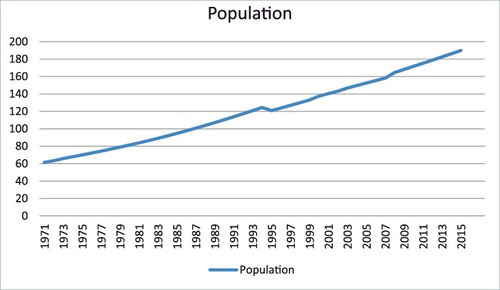
This study used annual data from 1971 to 2016. The data for these variables were collected from World Development Indicators (2016) Citation[53] and Handbook of Statistics on the Economy of PakistanCitation[54], which is published by the State Bank of Pakistan. A graphical representation of variables included in the model can be found in Appendix I. It is worth mentioning here that energy consumption patterns faced some decline in the near past. The energy mix of Pakistan is comprised of commercial fuels as well as traditional fuels. According to the figures for 2012, conventional fuel had a share of 34.9%, natural gas 31.7%, and oil 24.8%. The rest of the fuel was provided by coal, hydropower and nuclear power. Electricity generation from oil has been increasing since 1996; hydro sources remained the same. After 2002, the economy began growing as per-capita income increased by 8.9% between 2004 and 2008. Growth in energy usage was significant in the commercial sector (11.3%) and the industrial sector (12.5%). After 2008, energy usage/consumption was unable to expand due to constraints. Demand for energy expanded but government as well as the private sector failed to address and accommodate the increasing demand. The gap between energy supply and demand increased from 3000 MW to 7000 MW in 2011. Supply was constant and demand continued to grow. Due to these facts, energy consumption failed to follow its increasing patterns of the past. This was the result of the prevailing energy crisis that reached its peak in 2014 [Citation33].
The first step in time-series analysis is to test for the stationarity of variables. So, the initial phase is to verify the presence of unit root in data series, as time-series variables are often non-stationary. The augmented Dickey-Fuller (ADF), Dickey-Fuller Generalized Least Squares (DF-GLS), Phillip and Parron (PP) and Kwiatkowski, Phillips, Schmidt, and Shin (KPSS) tests were employed to deduce non-stationarity of macroeconomic series. Consider the autoregressive AR (1) model:
is a white noise process. If
, the series is taken as stationary, and if
, the series is known to have a unit root and is non-stationary. The null hypothesis (Ho) and the alternative hypothesis (HA) for the presence of unit root in environmental and macroeconomic series are Ho; µ = 1 and HA; µ < 1, respectively.
If macroeconomic variables are found to be integrated at the same order, then variables could be considered cointegrated. The cointegration method is employed for estimation of long-run equilibrium association among series. To observe the long-run connection between environmental and macroeconomic variables (i.e. GDP, trade openness, population growth, carbon dioxide emissions, and energy consumption), Johansen cointegration is estimated for EquationEquation (1)(1) . However, the present study followed the method elaborated in [Citation34], to correct for small-sample bias and allow more appropriate statistical interferences to be made with small samples. However, due to the small size of the sample considered in the current paper, it is likely that the Johansen test statistics might be prejudiced [Citation35]. Consequently, the study followed the method of Reinsel and Ahn [Citation34], who recommended multiplying the Johansen trace statistics with the scale factor N/(N–pk). N is the number of observations, k is the number of variables and p is the lag parameter in the estimated VAR system. Such a practice corrects for small-sample prejudice and permits more proper statistical intrusions to be made with fewer samples.
Autocorrelation is most likely to occur in a time-series framework. It is defined in the form of an equation as:
The equation states that error terms
and
should be independently distributed. For checking autocorrelation, the ordinary least squares (OLS) regression equation is initially estimated, and then Breusch-Godfrey Serial Correlation (LM) test is applied to check for an occurrence of serial correlation.
It is important to note that the cointegration technique can only explain the long-term association among the series included in the empirical model, thus overlooking the short-term features of the changing aspects contained in the data. EquationEquation (1)(1) is additionally assessed to test short-run changing issues of environmental and macroeconomic series. The study designs a VECM for the series. The VECMs include lagged values of fluctuations in all series in EquationEquation (1)
(1) in addition to lagged values of estimated residuals. Afterward, pairwise Granger causality test is employed to observe the direction of causality between series. The technique used to examine the association is the Granger causality test suggested in [Citation36], which considers the cause and effect association between two or more variables. Cumulative sum of recursive residuals (CUSUM) test is also applied to observe the stability of coefficients.
Analysis and discussion of results
Before moving to the first step of testing for unit root test, it is necessary to have a brief look at descriptive statistics. As a preliminary analysis, summarizes descriptive statistics. The mean value of all variables is positive. All the variables except trade openness have a negative value of skewness, indicating that the distribution is skewed to the left, with more observations on the right. Tables 2–8 provides the summary statistics for the sample. The mean value of all variables is positive. It is specified that for every variable, the standard deviation value is near to the pseudo standard deviation; the inter-quartile range (IQR) shows the absence of outliers in the observed sample.
Table 2. Descriptive statistics.
Table 3. Correlation matrix.
All the series are highly correlated, as all correlation coefficients (r) surpass 0.80 except for population. Furthermore, these outcomes are verified by the cross-correlations analysis.
The ADF unit root test (with constant and no trends) is applied to test the stationarity of variables (i.e. CO2 emissions, energy consumption, GDP, level of investment, trade openness and population). The results indicate acceptance of unit root in all series. The lag differences were selected conforming to the Schwarz information criterion (SIC). The test results, shown in , indicate that all of the series are made stationary at first difference I (Equation1(1) ).
Table 4. Results of the ADF unit root test.
The results obtained from the ADF unit root test were verified by estimating DF - (GLS), PP unit root test and KPSS unit root tests. All tests validate the results obtained from the ADF unit root test. The results of the DF (GLS), PP unit root test and KPSS unit root test are given in –, respectively.
Table 5. Results of the DF-GLS unit root test.
Table 6. Results of the PP unit root test.
Table 7. Results of the KPSS unit root test.
The Bai-Perron test was used to detect the presence of any structural breaks in time series. displays the results of this test, which show the absence of a structural break in any of the series included in this study. There are no structural breaks in series.
Table 8. Results of the Bai-Perron test for structural breaks.
Cointegration helps us to estimate the relationship between variables. A long-run equilibrium relationship exists among these environmental variables (i.e. CO2 emissions, energy consumption, GDP, level of investment, trade openness and population), as all of them are integrated at the same order. and show the results based on the Johansen cointegration test trace statistic and Max-Eigen statistic, respectively. The results of the test indicate that there is a long-run equilibrium relationship between variables. The null hypothesis (Ho) for the trace statistic test is that there are, at most, r cointegrating vectors is rejected, and the alternative hypothesis that there are more than this is accepted, as the trace statistics are higher than the critical value in both cases. Based on the results obtained from the Johansen cointegration test, it is concluded that all the variables are cointegrated.
Table 9. Results of the cointegration rank test (trace).
Table 10. Results of the Johansen unrestricted cointegration rank test (Max-Eigen).
According to the results of OLS estimation, there is a positive relationship between the outputs (growth) and CO2 emissions, energy consumption and CO2 emissions, and level of investment and CO2 emissions. A negative and insignificant link is found between trade openness and CO2 emissions, and population and CO2 emissions. shows the results of the OLS estimations. The coefficients indicate that a 1-unit change in energy consumption in Pakistan causes the CO2 emissions to increase by 0.001773 units, a 1-unit change in GDP increases CO2 emissions by 0.222605 units, and a 1-unit change in the level of investment increases CO2 emissions by 0.041964 units. The relationship between trade openness and CO2 emission, and population and CO2 emission, is negative but insignificant.
Table 11. Long-run coefficients.
The VECM was used to measure the short-run behavior of environmental variables with its long-term relationship as it is utilized for examining short-run dynamics of variables. VECM incorporates error correction terms and requires all series to be integrated at the same order, and there exists a long-run relationship between them that was confirmed earlier. The results of VECM are reported in .
Table 12. Vector error-correction estimates.
The test results in show the correction of variables because of the disequilibrium of the previous period. The error correction terms show that the adjustments are significant, and depict the stability of long-run relationship in the long run. The results of VECM demonstrate that all the environmental variables adjust to sustain the long-run equilibrium of EquationEquation (1)(1) .
Finally, the Granger causality test was applied to assess the direction of causality between environmental variables of Pakistan. reports the results, which show that CO2 emissions do Granger cause energy consumption as the p-value is significant at 1% and 10%, respectively, and the F-statistic is also substantial. Energy consumption does Granger cause CO2 emissions, as both the p-value and F-statistic are significant, and GDP do Granger cause CO2 emissions as its p-value and F-statistic are significant at the 1% level. CO2 emission does Granger cause investment because the p-value is significant at the 1% level and the F-statistic is also significant. CO2 emissions do Granger cause trade openness, and vice versa, as the p-values as well as F-statistics are significant. The level of the population does Granger CO2 emissions, but CO2 emissions do not Granger cause the level of population in the case of Pakistan.
Table 13. Pairwise Granger causality tests.
The causality test results indicate bi-directional causality between energy usage and carbon emissions (i.e. causality running from energy consumption to emissions and from carbon dioxide emissions to energy consumption). The result is in line with [Citation37]. This bi-directional causality shows that energy (in general) and electricity (in particular) conservation strategies could severely influence economic performance, and this possibly deteriorated economic performance results in low energy demands. Better economic performance and energy consumption lead toward carbon dioxide emissions and energy usage to boost economic performance. Pakistan must work for energy efficiency (renewable energy) so that carbon dioxide emissions can be reduced while maintaining the quality of the environment and economic performance.
Various diagnostic tests were employed to check the problem of autocorrelation, heteroskedasticity and model stability. The Breusch-Godfrey Serial Correlation LM test was used to verify the presence of autocorrelation, and the results are reported in . These results show that lagged disturbance terms of that variable do not influence disturbance terms relating to any variable.
Table 14. Breusch-Godfrey serial correlation LM test.
The White heteroskedasticity test is applied, and its results are reported in . These results show that disturbance terms relating to any variables have constant variances.
Table 15. White heteroskedasticity test.
To investigate model stability, the Ramsey Regression Equation Specification Error Test (RESET) is applied, the results of which are reported in . The test shows that variables included in the model are correctly specified.
Table 16. Ramsey RESET test.
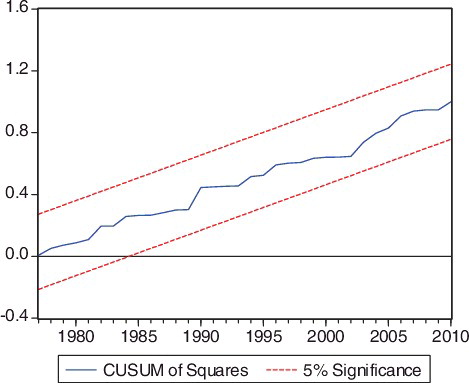
A graphical representation of the CUSUM test and cumulative sums of squares (CUSUMSQ) test is shown in and respectively. The plot of CUSUM and CUSUMSQ does not cross the 5% critical limit, which is indicative of the absence of any proof of structural instability in macroeconomic variables that determine CO2 emissions in the economy. So, the stability of coefficient estimations is reinforced. Meanwhile, the plots of both CUSUM and CUSUMSQ lie within the critical boundaries of 5% significance. The fact specifies that the projected parameters do not suffer from structural instability.
Figure 1. The plot of the cumulative sum of recursive residuals (CUSUM) statistics for the stability of coefficients.
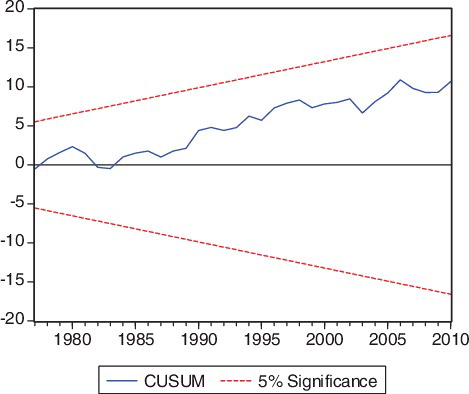
Figure 2. The plot of the cumulative sum of recursive residuals squares (CUSUMSQ) statistics for the stability of coefficients.
The outcomes of the current study are in line with the cases of Tunisia, Canada and Turkey [Citation38–40]. The results for Pakistan show that as GDP increases, an increase is observed in CO2 emissions. The stance could clarify the uni-directional causality from economic performance to carbon dioxide emissions that increased carbon dioxide emissions are connected to a rise in input use [Citation14]. The dependency of carbon dioxide emissions on economic performance suggests that while economic growth brings additional emissions, energies to decrease emissions would have adverse effects on economic performance. It is concluded in a literature review [Citation41] on the issue of economic growth and energy consumption linkage that results differ not only across states but also across statistical methods employed. The present findings pointedly reject the hypothesis that energy is neutral for growth. This result resembles those of [Citation42] and [Citation43].
It is prudent to discuss some policies related to the management of emission of carbon in Pakistan. Environmental contamination and the ecosystem are the components of the Pakistani constitution's concurrent list; this means that both state and provincial administrations have constitutionally delegated the tasks for managing natural resources. So, numerous queries arise about the appropriate distribution of and synchronization among several responsibilities and functions. In the meantime, Local Government Ordinance 2001 additionally surrogated some environmental responsibilities to local governments, but they lack the capability to manage environmental issues [Citation44].
Several sets of technical and sector-oriented plans have been established for Initial Environmental Examination and Environmental Impact Assessment, together with rules for community consultations, thermal power stations, housing estates and new town development, industrial estates, oil and gas exploration and production, chemical and manufacturing plants, and road and sewerage schemes. A set of current strategies regulating upstream petroleum exploration has also been developed. All these procedures are complete, but only thermal power plants and oil and gas subdivisions have been adopting them. Other segments have not considered them. The degree of community consultation in legislation is inadequate, and the public and business circles are not consulted to analyze the environmental influence of policies.
In 2015, the government started a plan, ‘Carbon Neutral Pakistan’, through procedural support from China, to initiate a native carbon marketplace to reduce the emission of greenhouse gases. The projected cost of the plan, which is part of Pakistan's Public-Sector Development Program (PSDP), is $3.85 million (US Dollars). The idea would be helpful to industry and other segments for buying and selling of carbon credits locally. Carbon markets will be likely to generate competition for clean technology in Pakistan.
The Climate Change Fund (CCF) was established in 2008, and its primary purpose was to create ease for investments in Developing Member Countries via the Clean Energy Financing Partnership Facility to account for climate variations. The Asian Development Bank’s net income and ordinary capital resources are currently funding CCF. It focuses on three zones: clean energy, sustainable transport and low-carbon urban development; reduced emissions from deforestation and degradation, and improved land use management; and adaptation [Citation45].
Conclusion
A reasonable proportion of economists and media, as well as politicians, usually blame energy consumption and carbon dioxide emissions as the cause of some environmental problems. This study has investigated the connection of carbon dioxide emissions with energy usage, economic performance, trade openness, level of investment and growth of population. It is a thought-provoking element that the connection between carbon dioxide emissions and macroeconomic variables has been the emerging topic of all the states of this world regardless of whether they are emerging or industrialized nations.
This work examined the association between environmental variables and macroeconomic variables for the years 1971 to 2016. The study is significant as the paper used a model that consists of series that have substantial backing from previous empirical studies about their association with carbon dioxide emissions. The variables were made stationary by taking the first difference, and all variables became stationary at level I (1).
A long-run equilibrium relationship exists among the variables as they have been integrated at same order. The results of the Johansen cointegration test show that there is a long-run equilibrium relationship among series. In the next step, the VECM was employed to analyze the short-run behavior of environmental and macroeconomic variables. It means that adjustments are significant, and all variables adjust to sustain their relationship with carbon dioxide emissions.
The Granger causality test was employed to confirm the direction of causality among carbon dioxide emissions, energy usage, trade openness, economic performance, level of investment and population growth of Pakistan. The test results show that CO2 emissions do Granger cause energy consumption, as the p-value is significant at 1% and 10%, and the F-statistic is also substantial. Energy consumption does Granger cause CO2 emissions, as the p-value and F-statistic are both significant, while GDP does Granger cause CO2 emissions as the p-value and F-statistic are significant at the 1% level. CO2 emissions Granger cause the level of investment, because the p-value is significant at the 1% level and the F-statistic is also substantial. CO2 emissions do Granger cause trade openness, and vice versa, as both p-values and F-statistics are significant. The level of the population does Granger cause CO2 emissions, but CO2 emissions do not Granger cause the level of population, in the case of Pakistan.
From this entire debate, it can be concluded that macroeconomic variables and energy consumption have a strong equilibrium relationship with carbon dioxide emissions in Pakistan. Henceforth, it is determined that an increase or decrease in energy usage, trade openness, economic performance, level of investment and growth of population will cause, and has triggered, fluctuations in carbon dioxide emissions (macroeconomic equilibrium) in the long run in the setting of Pakistan's economy.
The above discussion indicates that if CO2 emission increases with a similar tendency, it will be a serious risk in the coming years. The government would have to put energy into cutting and controlling the environmental pollution. Innovative benchmarks and monitoring systems must be established to decrease the emissions, as these are successfully operating in the western world. At this level, procedural care and environmental safety are called for, as CO2 emissions are the main reason for environmental degradation. Moreover, they are highly connected to energy usage, level of investment and population. In terms of policy implications, legislators must discover other energy strategies, such as reducing the energy intensity, enhancing the use of cleaner energy bases, developing energy preservation plans and enhancing energy efficiency. Such efforts would lead to reduced emissions and an improved environment. Also, the Pakistani government must implement operative and well-organized environmental strategies to withstand economic growth and to boost the introduction of cleaner technologies for the decrease in emissions of carbon dioxide.
This study argues that energy problems must be considered as a message and test, to green energy rising and revival in Pakistan. To safeguard against the limitations of cost and time, the study contends that it is necessary for Pakistan to open access for the extended entry of FDI, inside its renewable energy division, and to continue with the creation of industrial channels that encourage the production of renewable energy mechanisms in Pakistan.
Acknowlegements
The authors are indebted to Prof. Dr. Attiya Y. Javid (Pakistan Institute of Development Economics, Islamabad, Pakistan) and Mr. Muhammad Badar Iqbal (Assistant Professor; COMSATS Institute of Information Technology, Sahiwal, Punjab, Pakistan) for their guidence and support in completion of this paper. The authors are also thankful to anonymous reviewers for their valuable comments and suggestions on initial draft of this paper.
Disclosure statement
No potential conflict of interest was reported by the authors.
References
- Ozturk I, Acaravci A. The long-run and causal analysis of energy, growth, openness and financial development on carbon emissions in Turkey. Energy Econ. 36(2013), 262–267 (2012).
- Kraft J, , Kraft A. On the relationship between energy and GNP. The Journal of Energy and Development 401–403, 2 (1978).
- Grossman G, Krueger A. Environmental Impacts of North American Free Trade Agreement. National Bureau of Economic Research, Cambridge (1991).
- Shafik N, Bandyopadhyay S. Economic growth and environmental quality: time series and cross-country evidence. World Bank, Washington (1992).
- Stern DI, Common MS, Barbier EB. Economic growth and environmental degradation: The environmental Kuznets curve and sustainable development. World Development 24(7), 1151–1160 (1996).
- Soytas U, Sari R, Ewing BT. Energy consumption, income, and carbon emissions in the United States. Ecol. Econ. 62(3-4), 482–489 (2007).
- Ang JB. CO2 emissions, energy consumption, and output in France. Energy Policy 30(10), 4772–4778 (2007).
- Ang JB. Economic development, pollutant emissions and energy consumption in Malaysia. Journal of Policy Modeling 30(2), 271–278 (2008).
- Chang C-C. A multivariate causality test of carbon dioxide emissions, energy consumption and economic growth in China. Appl. Energy 87(11), 3522–3527 (2010).
- Shahbaz M, Mahalik MK, Shah SH, Sato JR. Time-varying analysis of CO2 emissions, energy consumption, and economic growth nexus: Statistical experience in next 11 countries. Energy Policy 98(2016), 33–43 (2016).
- Salahuddin M, Gow J, Ozturk I. Is the long-run relationship between economic growth, electricity consumption, carbon dioxide emissions and financial development in Gulf Cooperation Council Countries robust? Renew. Sust. Energ. Rev. 51(2015), 317–326 (2015).
- Alshehry AS, Belloumi M. Energy consumption, carbon dioxide emissions and economic growth: The case of Saudi Arabia. Renew. Sust. Energ. Rev. 41(2015), 237–247 (2015).
- Fei Li. Energy consumption-economic growth relationship and carbon dioxide emissions in China. Energy Policy 39(2011), 568–574 (2011).
- Magazzino C. A Panel VAR Approach of the Relationship among Economic Growth, CO2 Emissions, and Energy Use in the ASEAN-6 Countries. International Journal of Energy Economics and Policy 4(2), 546–553 (2014).
- Magazzino C, . The relationship between CO2 emissions, energy consumption and economic growth in Italy. Int. J. Sust. Energy, 35 1–14 (2014).
- Farhani S, Ozturk I. The causal relationship between CO2 emissions, real GDP, energy consumption, financial development, trade openness, and urbanization in Tunisia. Environ. Sci. Pollut. Res. 22(20), 15663–15676 (2015).
- Magazzino C. Economic growth, CO2 emissions and energy use in Israel. Int. J. Sust. Dev. World, 22 1–9 (2015).
- Rafindadi AA, Ozturk I. Effects of financial development,economic growth and trade on electricity consumption: Evidence from post-Fukushima Japan. Renew. Sust. Energ. Rev. 54(2016), 1073–1084 (2015).
- Magazzino C. CO2 emissions, economic growth, and energy use in the Middle East countries: A panel VAR approach. Energy Sources, Part B: Economics, Planning, and Policy 11(10), 60–968 (2016).
- Magazzino C. Economic Growth, CO2 Emissions and Energy Use in the South Caucasus and Turkey: a PVAR analyses. Int. Energy J. 16, 153–162 (2016).
- Magazzino C. The relationship between real GDP, CO2 emissions, and energy use in the GCC countries: A time series approach. Cogent Economics & Finance, 4 1–20 (2016).
- Squalli J. Electricity consumption and economic growth: Bounds and causality analyses of OPEC members. Energy Econ., 29 1192–1205 (2007).
- Rafindadi AA, Ozturk I. Dynamic effects of financial development, Trade openness and economic growth on energy consumption: Evidence from South Africa. International Journal of Energy Economics and Policy 2(3), 74–85 (2017).
- Alam S, Fatima A, Butt MS. Sustainable development in Pakistan in the context of energy consumption demand and environmental degradation. Journal of Asian Economics 18(2007), 825–837 (2007).
- Nasir M, Rehman FU. Environmental Kuznets Curve for carbon emissions in Pakistan: An empirical investigation. Energy Policy 39(2011), 1857–1864 (2011).
- Ahmed K, Long W. Environmental Kuznets Curve and Pakistan: An empirical analysis. Procedia Econ. Financ 1(2012), 4–13 (2012).
- Hussain M, Javaid MI, Drake PR. An econometric study of carbon dioxide (CO2) emissions, energy consumption, and economic growth of Pakistan. International Journal of Energy Sector Management 6(4), 518–533 (2012).
- Haseeb M, Azam M. Energy consumption, economic growth and CO2 emission nexus in Pakistan. Asian Journal of Applied Sciences 8(1), 27–36 (2015).
- Albiman MM, Suleiman NN, Baka HO. The relationship between energy consumption, CO2 emissions and economic growth in Tanzania. International Journal of Energy Sector Management 9(3), 361–375 (2015).
- Jorgenson AK, Clark B. The relationship between national-level carbon dioxide emissions and population size: An assessment of regional and temporal variation, 1960–2005. PLOS ONE 8(2), 1–8 (2013).
- Farhani S, Chaibi A, Rault C. A Study of CO2 Emissions, Output, Energy Consumption, and Trade. IPAG Business School, Paris (2014).
- Shi A. Population Growth and Global Carbon Dioxide Emissions. Development Research Group, The World Bank, Washington, D.C (2001).
- Aziz R, Ahmad MB. Pakistan's Power Crisis; The Way Forward. United States Institute of Peace, Washington, DC (2015).
- Reinsel GC, Ahn SK. Vector autoregressive model with unit roots and reduce rank structure estimation. Likelihood ratio test, and forecasting. J. Time Ser. Anal. 13(4), 353–375 (1992).
- Cheung YW, Lai KS. A fractional cointegration analysis of purchasing power parity. J. Bus. Econ. Stat. 11(1), 103–112 (1993).
- Granger CWJ. Investigating Causal Relations by Econometric Models and Cross-spectral Methods. Econometrica 37(3), 424–438 (1969).
- Lu W-C. Greenhouse gas emissions, energy consumption and economic growth: A panel cointegration analysis for 16 Asian countries. Int. J. Environ. Res. Public Health 14(1436), 1–15 (2017).
- Halicioglu F. An econometric study of CO2 emissions, energy consumption, income and foreign trade in Turkey. Energy Policy 37(3), 1156–1164 (2009).
- Fodha M, Zaghdoud O. Economic growth and pollutant emissions in Tunisia: an empirical analysis of the environmental Kuznets curve. Energy Policy 38, 1150–1156 (2010).
- He C, Sandberg R. Testing parameter constancy in unit root autoregressive models against multiple continuous structural changes. Econom. Rev. 31(1), 34–59 (2012).
- Mozumder P, Marathe A. Causality relationship between electricity consumption and the GDP in Bangladesh. Energy Policy 35(1), 395–402 (2007).
- Oh W, Lee K. Causal relationship between energy consumption and GDP revisited: The case of Korea 1970–1999. Energy Econ. 26, 51–59 (2004).
- Damette O, Seghir M. Energy as a driver of growth in oil exporting countries. Energy Econ. 37, 193–199 (2013).
- Chaudhry QZ. Climate Change Profile of Pakistan. Asian Development Bank, Manila (2017).
- Asian Development Bank. Climate Change Fund. Asian Development Bank, Manila (2008).
- Zhu Huiming, Duan Lijun, Guo Yawei, Yu Keming. The effects of FDI, economic growth and energy consumption on carbon emissions in ASEAN-5: Evidence from panel quantile regression. Economic Modelling. 58, 237–248, https://doi.org/10.1016/j.econmod.2016.05.003 (2016).
- Alam Md. Mahmudul, Md. Wahid, Md. Noman, Ozturk. Relationships among carbon emissions, economic growth, energy consumption and population growth: Testing Environmental Kuznets Curve hypothesis for Brazil, China, India and Indonesia. Ecological Indicators. 70, 466–479, https://doi.org/10.1016/j.ecolind.2016.06.043 (2016).
- Esso Loesse, Yaya. Energy consumption, economic growth and carbon emissions: Cointegration and causality evidence from selected African countries. Energy. 114, 492–497, https://doi.org/10.1016/j.energy.2016.08.010 (2016).
- Wang Shaojian, Zhou, Li, Feng. CO2, economic growth, and energy consumption in China's provinces: Investigating the spatiotemporal and econometric characteristics of China's CO2 emissions. Ecological Indicators. 69, 184–195, https://doi.org/10.1016/j.ecolind.2016.04.022 (2016).
- The Royal Society Science Policy Centre (2012) People and the Planet. London: The Royal Society.
- World Bank. 2016. World Development Indicators 2016. Washington, DC. © World Bank..
- State Bank of Pakistan. (2016). Handbook of Statistics on Pakistan Economy. http://www.sbp.org.pk/departments/stats/PakEconomy_HandBook/index.htm.
Website
- Panayotou T. Empirical Tests and Policy Analysis of Environmental Degradation at Different Stages of Economic Development. (1993). [Online] Available at:http://www.ilo.org/public/libdoc/ilo/1993/93B09_31_engl.pdf [Accessed 31 01 2016].
Appendix I