
 ?Mathematical formulae have been encoded as MathML and are displayed in this HTML version using MathJax in order to improve their display. Uncheck the box to turn MathJax off. This feature requires Javascript. Click on a formula to zoom.
Abstract
Monitoring and mapping forest carbon is critical for informing climate change mitigation measures. Evidence indicates that forest edges hold less carbon than the forest interior. In this study, using field inventory data from a Chinese fir forest ecosystem in southeast China, the carbon at the forest edge and forest interior at different elevations was measured. The results showed a significant increasing trend in carbon with elevation. The results also revealed that forest edges had significantly lower carbon than the forest interior. Carbon density values varied between 265 Mg C ha−1 at forest edges and 320 Mg C ha−1 at forest interior. The study highlights that ignoring edge effects overestimates carbon density by 9.46%. These findings suggest that edge effects should be given proper consideration during national forest carbon inventory. Furthermore, the authors recommend the establishment of permanent sampling plots along forest edges for precise and accurate carbon accounting.
Introduction
Forest ecosystems are considered a potentially important tool for reducing global warming [Citation1]. Forests contain more than 45% of the world’s terrestrial biomass carbon and play a prominent role in the global carbon cycle [Citation2]. Measurement of biomass carbon is needed for developing mitigation measures in response to climate change at both global and regional scales [Citation3–5]. A precise assessment of forest carbon is critical for prediction of national carbon climate feedback mechanisms and execution of mitigation measures and policies [Citation2, Citation6–8]. Biomass carbon is calculated by conducting forest inventories [Citation9, Citation10], which do not take into account the differences in carbon density that occurs in a forest where they meet other land uses [Citation11].
The forest edge is the limit of continuous canopy or boundary in canopy composition [Citation12]. Due to the process of forest fragmentation, forest edge has become the dominant feature in landscapes around the globe. Forest edges are exposed to different microclimatic conditions in terms of temperature, light, wind and soil moisture than the forest interior and have greater potential to catch atmospheric deposition [Citation13]. Edaphic and microclimatic conditions are generally different from forest edge to interior zones [Citation14–24]. Studies show that edges have greater values of wind speed, air and soil temperature and vapor pressure aspersion, and lower air and soil humidity, than the forest interior. These different microclimate conditions affect plant physiology [Citation25, Citation26].
The edge effect depends on tree species, edge structure and various forest management activities [Citation27–29]. Edge effects may also influence the carbon storage ability of a forest ecosystem [Citation30]. Elevation is a determining factor for ecosystem properties in mountain ecosystems and can influence the carbon pools [Citation31, Citation32]. Both increasing and decreasing trends in biomass carbon along an altitude gradient have been reported previously [Citation33–36]. This changing pattern is likely driven by climatic variation, as well as other variables such as soil nutrient levels, and the amount of dead wood and vegetation on the forest floor [Citation37]. While the edge effect on biomass carbon has been widely studied, very little literature is available regarding the edge effect on carbon along altitude gradients.
Globally, each member state of the Intergovernmental Panel on Climate Change (IPCC) monitors the status of carbon in their forests using IPPC-proposed guidelines [Citation9]. China is a signatory to the UNFCCC and to the Kyoto Protocol, and is ranked as the fifth largest country by forest area, contributing 5% to the global total [Citation38, Citation39]. China is committed to increasing forest land cover by 40 million hectares by 2020, with the overall goal of enhancing carbon sequestration [Citation40]. A large number of studies have demonstrated the status of stored carbon and the sink potential of China’s forests. For example, Fang et al. [Citation41], Pan et al. [Citation42] and Zhao et al. [Citation43] referred to Chinese forest as a sink. The biomass carbon of the country has been assessed using different methodologies and data sources [Citation41, Citation42, Citation44–47]; some studies used national forest inventory (NFI) data and the biomass expansion factor (BEF) method. Piao et al. [Citation48] and Chi et al. [Citation49] assessed biomass carbon based on a remote sensing method. Other researchers used mean carbon density methods based on field inventory data [Citation44, Citation50–52]. These different methodologies and data sources produced estimates of the biomass store carbon in the range of 32 to 144 Mg C ha−1 [Citation39]. In other estimates, the biomass carbon was reported to be between 37.94 and 50.71 Mg C ha−1 [Citation43, Citation53, Citation54]. In addition to biomass carbon, the estimated soil carbon in China’s forest to 100 cm depth has been estimated at 115.90–193.55 Mg C ha−1 [Citation50, Citation51, Citation55–58].
However, to the best available knowledge, no study has been conducted to outline the effect of edges on the carbon density of different pools in a forest ecosystem of China. Experimental studies from around the globe reported a difference in carbon of 9% and 50% between the forest edge and forest interior [Citation59, Citation60]. Similarly, Chaplin-Kramer et al. [Citation61] reported a 25% lower estimate of carbon density within the forest edges than in the forest interior. This suggests that by not considering the forest edge, the reported stored carbon in China’s forests may be an overestimate. To explore this, this study analyzed the difference in carbon density between the forest edges and the interior in a sub-tropical forest in China’s Fujian province with the overall goal of establishing whether there is a difference in the carbon density at forest edges versus the interior forest, among different carbon pools. The carbon density of the forest is calculated in different carbon pools along forest edges and in the forest interior, at different altitudes. The results show that there is a clear difference in the carbon density value at forest edges versus the interior among the major carbon pools, and that ignoring forest edges in assessing the carbon density of a forest can lead to overestimating the carbon.
Materials and methods
Site description
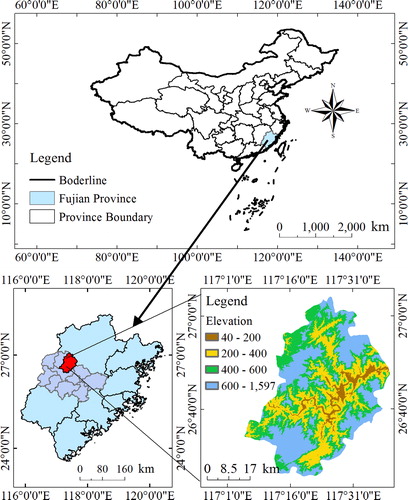
The Jiangle county state-owned forest farm is situated in Fujian province, China (). It has an area of 2246.7 km2 and lies at 117°05’–117°40’E and 26°26’–27°04’N. The area has a humid tropical monsoon climate, with marine and continental climate characteristics. The mean relative humidity is 81% and the frost-free period is 287 days. The area is characterized by red, fertile, moist and loamy soil. The average annual precipitation of the county is 1699 mm, and has an average annual temperature of 18.7 °C. The recorded woodland of the forest farm is 1887 km2, which constitutes 83.9% of its geographical area. The primary species in the forest farm are Chinese fir, Moso bamboo, and Masson pine [Citation62–64]. The dominant tree species is Chinese fir. The shrub layer includes Itea chinensis, Microlopia marginata, Rubus reflexus, Pellionia scabra and Loropetalum chinense. The herb layer includes Lophatherum gracile, Diplopterygium chinense, Cyclosorus parasiticus and Sarcandra glabra.
Figure 1. The location and image of the study site.
Sampling and data analysis
Stratified random sampling was used for field data collection. The basis for stratification was elevation. The elevation of the study area ranges from 40 m to 1203 m above sea level (asl). The area was divided into four elevation classes (ECs). The elevation difference between one class and the next was 200 m (asl). In each EC, four sample plots were taken at forest edges and four sample plots were taken in the forest interior (). The forest interior plots were laid out at 60 m distance from the forest edges. Forest edge can affect biomass carbon at distances from 15 to 100 m [Citation13, Citation59–61]. Similarly, some studies pointed out that the edge effect appears to occur within 40 to 50 m [Citation65, Citation66]. According to the mentioned supporting literature, the present distance was considered sufficient for this study.
The size of sample plots varied from 400 to 600 m2. Overall, 32 sample plots were laid out. For assessing the aboveground biomass carbon in the tree component a non-destructive method of sampling was used. This method uses the main variable measurement of aboveground trees, such as the diameter at 1.3 m above the ground and height (H), of the standing trees in the sampling plots. The diameter of each tree within each plot was measured using diameter tape (Metric Diameter Tape, Beijing Guangpu Measure Co., Ltd., MS, China) and for measuring tree height (H), a hypsometer (Trupulse 200B, Laser Technology Inc., Centennial, CO, USA) was used. To estimate the biomass carbon of detritus (deadwood and litter) and herbaceous vegetation in each sample plots, 3 sub-plots of 1 m2 each were established. Similarly, for the determination of shrub biomass in each plot, three further sub-plots of size 5 m2 each were taken. For soil carbon analysis, soil samples were collected at three depth levels: 0.20 cm, 20–40 cm and 40–60 cm.
Biomass carbon estimation of standing trees
To measure the value of biomass carbon, the dendrometric characteristics of living trees (LT), such as diameter at breast height (DBH) and tree height (H) were measured as explanatory variables [Citation67]. Then, the models of Yujun et al. [Citation68] for Chinese fir for the estimation of the aboveground biomass (AGB) and belowground biomass (BGB) were used.
(1)
(1)
The carbon density of standing trees was estimated by multiplying total biomass (Mg·ha−1) by a conversion factor (0.5) that has been used globally for the measurement of carbon density [Citation69–72].
Biomass carbon estimation of understory vegetation
For assessing the biomass of the understory vegetation, sub-plots of 5 m2 for shrubs, and of 1 m2 for herbs, grasses and detritus, were laid out. The understory vegetation in each plot was harvested and their fresh weight was recorded. Similarly, the detritus materials in each plot were collected and their weight was recorded with an electronic balance in the field. Samples of 1 kg of understory vegetation and detritus were labeled in bags and transferred to the Southern Forest, Experimental Base of the Beijing Forestry University Sanming Jiangle, and were oven-dried at 72 °C for 48 hours [Citation71, Citation73]. The oven-dried sample weight was recorded in kg and biomass was considered to be the oven-dried weight (kg).
Soil sampling and analysis
To measure soil carbon, soil samples were collected from the three sub-plots of 1 × 1 m within each plot of 400–600 m2. Soil samples were collected at three depth increments in the center of the subplot (i.e. 0–20, 20–40 and 40–60 cm). Three samples in each plot were taken and kept separately. A soil auger and soil core samples of an identified volume of 100 cm3 were used and the weight of each sample was measured before it was packed in the labeled bags and transferred for further analysis to the Southern Forest, Experimental Base of Beijing Forestry University Sanming Jiangle. To calculate the soil organic carbon (SOC) content, soil samples were air dried and the bulk density (g·cm−3) of each sample was measured to assess the carbon value per hectare (Mg C ha−1). Air-dried soil samples were passed through a 0.50-mm sieve for determination of the SOC as described by [Citation74]. Soil bulk density (BD) was measured using the following equation:
(3)
(3)
The oxidizable organic carbon method [Citation75] was used for soil carbon estimation. The soil carbon in Mg ha−1 was calculated according the equation developed by [Citation76]:.
(4)
(4)
Calculation of total biomass carbon
The total ecosystem biomass carbon (Mg·ha−1) was calculated by adding the total carbon stored in all pools (tree, soil, understory vegetation and detritus).
Statistical analysis
Tree biomass carbon, soil carbon and understory vegetation data were processed using MS Excel. Analysis of variance (ANOVA) and Least significant difference (LSD) were performed to test the differences in carbon density of various ecosystem components at forest edges and in the interior. The differences were considered statistically significant at p < 0.05, and the Statistix version 8.1 (Analytical Software, 2005) package was used. Sigma Plot version 12.5 was used to obtain the relationship between biomass carbon and basal area at forest edge and interior.
Results
Ecosystem biomass
Across the different elevation classes, the biomass values in LTs, detritus, shrubs and herbs at the forest edges and forest interior were estimated (). The results showed that biomass values of LTs at forest edges and interior increase with an increase in elevation. Similarly, the biomass values of detritus at both forest edges and interior increase with increasing elevation. However, in the case of shrub and herb biomass, the same increasing trend was not found. The biomass values of all five components including LT, detritus, shrubs and herbs were found to be significantly different (p < 0.05) across the elevation at the forest edges and forest interior. Both at the forest edges and in the interior, a significantly lower value of total biomass was recorded at lower elevations and a significantly higher biomass was recorded at higher elevations. Overall, these results underline that the forest interior had statistically higher biomass in all of the respective biomass components than the forest edges did. Altogether, at forest edges the mean biomass was 408 Mg·ha−1, whereas in the forest interior it was 504 Mg ha−1.These results show that the forest interior had 10.52% more biomass than forest edges. The findings presented here demonstrate that ignoring edge effects could result in overestimating the biomass of the forest ecosystem.
Table 2. Biomass (Mg·ha−1) and its allocation in different elevation classes at forest edges and forest interior.
Carbon density in the forest ecosystem
The carbon density values of different ECs in the respective carbon components at forest edges and in the forest interior are presented in . LT carbon density showed a significant increasing trend with elevation at the forest edges and in the forest interior (). LTs had the highest carbon density as compared to other ecosystem components. The mean recorded carbon value of LTs at forest edges and in the forest interior was 195 Mg ha−1 and 242 Mg ha−1, respectively. Out of the total stored carbon in LTs, forest edges and forest interior comprised 44.61% and 55.39%, respectively, which showed that forest edge stored 10.78% less carbon than the forest interior in LT. A significant increasing trend in SOC was also observed along the forest edges and in the forest interior, but a decreasing trend was observed with soil depth (). The percentage of SOC at forest edges and in the forest interior, at 0–20 cm, was 47.24% and 52.76%, respectively. Similarly, for 20–40 and 40–60 cm depth, SOC was 47 and 53%, and 47 and 53%, respectively. The mean soil carbon at forest edges and in the forest interior was 61 and 68 Mg·ha−1 (). There was an overall difference of 5.71% in soil carbon values at forest edges versus forest interior. The recorded carbon density in detritus varied between 4.42 Mg ha−1 at forest edges and 4.92 Mg ha−1 in the forest interior (). In all ECs, the carbon density of detritus at forest edges and in forest interior was 47.32% and 52.68%, respectively, showing 5.35% less carbon at forest edges as compared to the forest interior.
Figure 2. Regression relationship of basal area (BA) with total tree biomass (TTB) and total tree carbon (TTC) at forest edge (a) and forest interior (b). Regression model (a) R2 = 0.09980 with standard error of estimate 9.3966 and regression model (b) R2 = 0.9985 with standard error of estimate 8.7943.
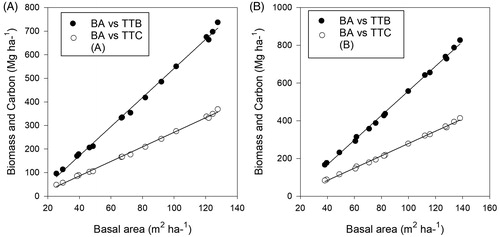
Table 3. Carbon density (Mg·ha−1) and its allocations in different elevation classes at forest edges and forest interior.
In contrast with LTs, soil and detritus, the carbon density of understory vegetation (shrubs and herbs) decreases with increasing elevation. The carbon concentration of shrubs and herbs at forest edges and in the forest interior were 3.06 and 2.10 Mg·ha−1 and 3.25 and 2.39 Mg·ha−1, respectively (). Across all ECs, the carbon concentration of shrubs was 48.49% and 51.51% and that of herbs was 46.77% and 53.23% at forest edges and in the forest interior, respectively. The results showed an edge difference of 3.01% for shrubs and 6.46% for herbs. Altogether, the mean carbon density of all components at forest edges and in the interior is estimated at 265 and 320 Mg C ha−1, respectively, representing a total difference of 9.46%. The present findings fully justify the claim that forest edges store comparatively lower carbon than the forest interior and thus that ignoring forest edges in carbon inventories can result in an overestimation of forest carbon.
Discussion
The present study investigated carbon density at forest edges and in the forest interior at different elevation classes. Carbon density at forest edges and in the forest interior increases with increasing elevation, and a higher carbon concentration was found in the forest interior compared to the forest edges (), confirming the hypothesis that by not considering edge effects the carbon density in China’s forests may have been overestimated.
The biomass carbon of LTs in the present study was found to be statistically higher at higher elevations compared to lower elevations () both at the forest edges and in the forest interior. This might be due to the presence of larger diameter trees at higher elevations, which can be attributed to the better site quality, with more soil organic matter. Lower elevations recorded significantly higher stem density than upper elevations, but significantly lower basal area both at the forest edges and in the interior (). These results indicate the dominance of larger trees at higher elevation, which result in higher biomass carbon. The ratio between basal area and carbon depends on tree size. Therefore, the amount of carbon per unit of basal area increases with increasing tree size [Citation77–79]. Consistent results were found of larger carbon values with respect to the increase in tree size with increasing elevation. Similarly, the present findings highlight significant variation in the mean carbon values at forest edges versus the forest interior (). Statistically larger values of LT biomass carbon were recorded in the forest interior than at the edges, with an overall difference of about 10.78%. This may be related to various factors; for example, forest edges affect microclimate (by increasing wind speed), plant desiccation, and increased mortality, which affect in turn phenology and recruitments [Citation80–83].
Figure 3. (a) Carbon density (Mg·ha−1) in different elevation classes (different letters on the bars indicate significant differences in carbon density among the elevation classes); (b) percentage contribution of carbon pools in different components at forest edges and forest interior. AGC, aboveground carbon; BGC, belowground carbon; SH, shrub; HER, herb; DW, detritus; SOC, soil organic carbon
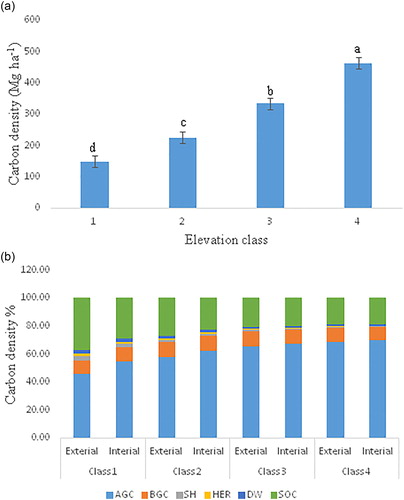
Figure 4. (a) Soil carbon concentration (Mg·ha−1) of different depths at forest edge and forest interior among different elevation classes; (b) soil carbon concentration (Mg·ha−1) at different depths among different elevation classes.
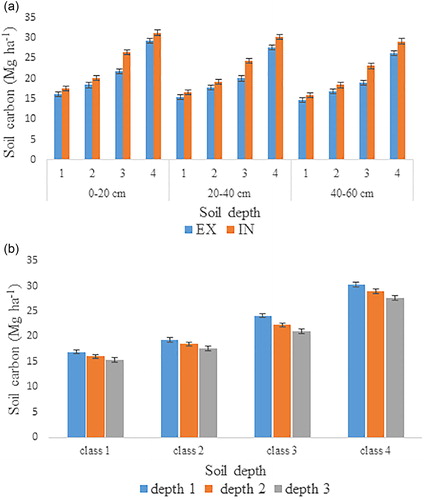
Table 1. Characteristics of the Cunninghamia lanceolata at Forest exterior (EX) and Forest interior (IN) in Jiangle County, Fujian Province.
Previous studies have shown that the mean tree height at the forest edges is smaller than that in the forest interior due to the high mortality rate of tall trees [Citation84–86]. This in turn increases the recruitment of new trees, and hences reduce tree height and basal area [Citation86]. Similar results were obtained in this study. It can be seen from that at the forest edge the stem density is greater while the height and basal area are lower. The lower height and basal area at forest edges is another major reason for the carbon difference between the edges and interior. The biomass carbon increases with an increase in basal area and tree height [Citation87, Citation88]. The correlation analysis () between basal area and biomass carbon showed a strong positive correlation (R2 = 0.99) both at forest edges and in the interior, but the lower value for the standard error of estimate in the analysis for the forest interior is more evidence of the presence of larger trees that resulted in higher carbon. In comparison, the result for the LT carbon difference, of 10.78% between forest edges and interior, is similar to the difference of 5–10% reported by [Citation89].
In addition to the increasing trend in LT carbon with elevation, the same increasing trend in soil and detritus carbon from lower to higher elevation was observed. The area of forest located at lower elevations had significantly lower carbon in soil and detritus both at the edges and in the interior. The statistically lower carbon density in soil may be the result of low deposition of detritus materials on the forest floor () which may in turn be linked to the increase in tree diameter with elevation (). With increasing tree diameter the natural competition for light, space and nutrients increase and natural pruning of lower branches occurs, which results in the availability of more detritus at higher elevation, and consequently gives higher carbon values, not only in soil but also in detritus. Moreover, the analysis reveals significant variation in the values of soil and detritus carbon across the forest edges and interior. However, this difference was about 6%, lower than the difference in LT carbon between forest edges and interior. By comparison the present findings are not in agreement with a previous study [Citation13] that reported more soil carbon at edges than in the interior. Nevertheless, some other studies showed slightly more carbon, but not significantly more, in the forest interior than at the edges [Citation90]. Microclimatic changes that occur after fragmentation, such as increase in temperature, soil desiccation, and wind incidence, can affect soil carbon due to an increased mortality of trees at the forest edges of the fragments [Citation15, Citation91]. As a result of this mortality, an increase in production and deposition of litter and deadwood materials occurs, which may result in higher carbon in fragmented forest edges when compared to the forest exterior [Citation89]. This discrepancy in the soil and detritus carbon values may be the result of more anthropogenic and natural disturbance along edges than in the interior. The occurrence of nearby human-modified land such as agricultural land, range land and settlements is linked with stronger edge effects throughout the tropics [Citation61]. Edge-related factors in the area include the presence of agricultural land, streams, roads and natural canopy gaps along or in the forest. Selective logging in the area (roads), agriculture activities and floods could cause soil compaction and erosion along the edges that reduce the soil carbon. Furthermore, understory vegetation decreases with increasing elevation both at the forest edges and in the interior. The reason for this might be the presence of fewer woody shrubs at higher elevation.
Overall, the findings presented here reveal that at forest edges significantly lower carbon is stored as compared to the forest interior. On average, at forest edges 9.46% lower carbon was found against the forest interior, which shows that assuming uniform biomass carbon across the edges and interior overestimates the carbon.
Chinese fir is an important species that has been widely planted in China, particularly in southeastern regions. It is a fast-growing species with high potential for biomass carbon accumulation. The species covered an area of 0.225 million hectares in Fujian Province of southeastern China. The current findings for carbon density ranged between 265 and 320 Mg C ha−1 at forest edges and forest interior, respectively. Extrapolating the per-hectare carbon into the whole study area, considering the 9.46% difference at forest edges and forest interior, reveals an overestimate of carbon by a total of 12.43 million tons. Similarly, in the whole of China the total area covered by the species is about 9 million [Citation92] hectares. Taking the present difference in carbon values at forest edges and forest interior into account, carbon has been overestimated by 498 million tons. The present findings fully justify the claim that the national carbon accounting system when considering a uniform carbon value, irrespective of forest edges and forest interior, overestimates carbon stock. Better accounting for the edge effect in carbon stock will improve precision in carbon stock assessment. Therefore, the authors suggest the establishment of permanent sample plots at forest edges for a better understanding of forest carbon dynamics, forest carbon conservation and mapping for effective climate change mitigation.
Disclosure statement
We have no conflicts of interest to disclose.
Additional information
Funding
Notes on contributors
Mukete Beckline
SY and SS designed the experiment. BZ, SS and LC collected the data. SS and BZ performed the experiments. AI, SS and AA analyzed the data. SS, MB, AM and AK contributed to writing the manuscript.
Liping Chen
SY and SS designed the experiment. BZ, SS and LC collected the data. SS and BZ performed the experiments. AI, SS and AA analyzed the data. SS, MB, AM and AK contributed to writing the manuscript.
Bo Zhang
SY and SS designed the experiment. BZ, SS and LC collected the data. SS and BZ performed the experiments. AI, SS and AA analyzed the data. SS, MB, AM and AK contributed to writing the manuscript.
Adnan Ahmad
SY and SS designed the experiment. BZ, SS and LC collected the data. SS and BZ performed the experiments. AI, SS and AA analyzed the data. SS, MB, AM and AK contributed to writing the manuscript.
Abdul Mannan
SY and SS designed the experiment. BZ, SS and LC collected the data. SS and BZ performed the experiments. AI, SS and AA analyzed the data. SS, MB, AM and AK contributed to writing the manuscript.
Alamgir Khan
SY and SS designed the experiment. BZ, SS and LC collected the data. SS and BZ performed the experiments. AI, SS and AA analyzed the data. SS, MB, AM and AK contributed to writing the manuscript.
Arshad Iqbal
SY and SS designed the experiment. BZ, SS and LC collected the data. SS and BZ performed the experiments. AI, SS and AA analyzed the data. SS, MB, AM and AK contributed to writing the manuscript.
Related Research Data
References
- Schimel DS, House JI, Hibbard KA, et al. Recent patterns and mechanisms of carbon exchange by terrestrial ecosystems. Nature. 414, 169–72 (2001).
- Beer C, Reichstein M, Tomelleri E, et al. Terrestrial gross carbon dioxide uptake: global distribution and covariation with climate. Science. 329, 834–8 (2010).
- Sharma CM, Baduni NP, Gairola S, Ghildiyal SK, Suyal S. Tree diversity and carbon stocks of some major forest types of Garhwal Himalaya, India. For. Ecol. Manage. 260, 2170–9 (2010).
- Beckline M, Yujun S, Etongo D, et al. Cameroon must focus on SDGs in its economic development plans. Environ. Sci. Policy Sustain. Dvlpmnt. 60, 25–32 (2018).
- Naveenkumar J, Arunkumar K, Sundarapandian S. Biomass and carbon stocks of a tropical dry forest of the Javadi Hills, Eastern Ghats, India. Carbon Mngemnt. 8, 351–61 (2017).
- McKinley DC, Ryan MG, Birdsey RA, et al. A synthesis of current knowledge on forests and carbon storage in the United States. Ecological Appl. 21, 1902–24 (2011).
- Pan Y, Birdsey RA, Fang J, et al. A large and persistent carbon sink in the world’s forests. Science. 333, 988–93 (2011).
- Yang Y, Li P, Ding J, et al. Increased topsoil carbon stock across China's forests. Global Chng Biol. 20, 2687–96 (2014).
- De Klein C, Novoa R, Ogle S, et al. IPCC Guidelines for National Greenhouse Gas Inventories. Volume 4: Agriculture, Forestry and Other Land Use. Chapter 11: N2O Emissions from Managed Soils, and CO2 Emissions from Lime and Urea Application. Intergovernmental Panel on Climate Change (IPCC), Geneva, Switzerland Google Scholar, (2006).
- Field CB, Barros VR, Mach K, Mastrandrea M. Climate change 2014: impacts, adaptation, and vulnerability. Cambridge University Press, Cambridge and New York, (2014).
- Broadbent EN, Asner GP, Keller M, Knapp DE, Oliveira PJ, Silva JN. Forest fragmentation and edge effects from deforestation and selective logging in the Brazilian Amazon. Biol. Consrv. 141, 1745–57 (2008).
- Harper KA, Macdonald SE, Burton PJ, et al. Edge influence on forest structure and composition in fragmented landscapes. Consrv. Biol. 19, 768–82 (2005).
- Remy E, Wuyts K, Boeckx P, et al. Strong gradients in nitrogen and carbon stocks at temperate forest edges. Forest Ecol. Mngmnt. 376, 45–58 (2016).
- Kapos V. Effects of isolation on the water status of forest patches in the Brazilian Amazon. J. Tropical Ecol. 5, 173–85 (1989).
- Camargo J, Kapos V. Complex edge effects on soil moisture and microclimate in central Amazonian forest. J Trop Ecol. 11, 205–21 (1995).
- Jose S, Gillespie AR, George SJ, Kumar BM. Vegetation responses along edge-to-interior gradients in a high altitude tropical forest in peninsular India. For. Ecol. Mngmnt. 87, 51–62 (1996).
- Williams-Linera G, Dominguez-Gastelu V, Garcia-Zurita M. Microenvironment and floristics of different edges in a fragmented tropical rainforest. Consrv. Biol. 12, 1091–102 (1998).
- Burke DM, Nol E. Edge and fragment size effects on the vegetation of deciduous forests in Ontario, Canada. Nat. Area. J. 18, 45–53 (1998).
- Rodrigues E. Edge effects on the regeneration of forest fragments in South Brazil. Department of Organismic and Evolutionary Biology, Harvard University, Cambridge, MA, (1998).
- Didham RK, Lawton JH. Edge structure determines the magnitude of changes in microclimate and vegetation structure in tropical forest fragments. Biotropica. 31, 17–30 (1999).
- Davies-Colley RJ, Payne G, Van Elswijk M. Microclimate gradients across a forest edge. N. Zealand J. Ecol. 24, 111–21 (2000).
- Gehlhausen SM, Schwartz MW, Augspurger CK. Vegetation and microclimatic edge effects in two mixed-mesophytic forest fragments. Plant Ecol. 147, 21–35 (2000).
- Delgado JD, Arroyo NL, Arévalo JR, Fernández-Palacios JM. Edge effects of roads on temperature, light, canopy cover, and canopy height in laurel and pine forests (Tenerife, Canary Islands). Landscape Urban Plan. 81, 328–40 (2007).
- Pohlman CL, Turton SM, Goosem M. Temporal variation in microclimatic edge effects near powerlines, highways and streams in Australian tropical rainforest. Agri. For. Meteorol. 149, 84–95 (2009).
- Kapos V, Ganade G, Matsui E, Victoria R. ∂^13C as an indicator of edge effects in tropical rainforest reserves. J. Ecol. 81, 425–32 (1993).
- Herbst M, Roberts JM, Rosier PT, Taylor ME, Gowing DJ. Edge effects and forest water use: A field study in a mixed deciduous woodland. For. Ecol. Mngmnt. 250, 176–86 (2007).
- Devlaeminck R, De Schrijver A, Hermy M. Variation in throughfall deposition across a deciduous beech (Fagus sylvatica L.) forest edge in Flanders. Sci. Total Envrnmnt. 337, 241–52 (2005).
- Wuyts K, De Schrijver A, Staelens J, Gielis M, Geudens G, Verheyen K. Patterns of throughfall deposition along a transect in forest edges of silver birch and Corsican pine. Canadian J Forest Res. 38, 449–61 (2008).
- Wuyts K, De Schrijver A, Vermeiren F, Verheyen K. Gradual forest edges can mitigate edge effects on throughfall deposition if their size and shape are well considered. For. Ecol. Mngmnt. 257, 679–87 (2009).
- Ziter C, Bennett EM, Gonzalez A. Temperate forest fragments maintain aboveground carbon stocks out to the forest edge despite changes in community composition. Oecologia. 176, 893–902 (2014).
- He X, Hou E, Liu Y, Wen D. Altitudinal patterns and controls of plant and soil nutrient concentrations and stoichiometry in subtropical China. Scientific Rep. 6, 24261 (2016).
- Jobbágy EG, Jackson RB. The vertical distribution of soil organic carbon and its relation to climate and vegetation. Ecol. Appl. 10, 423–36 (2000).
- Kitayama K, Aiba SI. Ecosystem structure and productivity of tropical rain forests along altitudinal gradients with contrasting soil phosphorus pools on Mount Kinabalu, Borneo. J Ecol. 90, 37–51 (2002).
- Culmsee H, Leuschner C, Moser G, Pitopang R. Forest aboveground biomass along an elevational transect in Sulawesi, Indonesia, and the role of Fagaceae in tropical montane rain forests. J. Biogeogr. 37, 960–74 (2010).
- Moser G, Leuschner C, Hertel D, Graefe S, Soethe N, Iost S. Elevation effects on the carbon budget of tropical mountain forests (S Ecuador): the role of the belowground compartment. Global Chng Biol. 17, 2211–26 (2011).
- Marshall AR, Willcock S, Platts P, et al. Measuring and modelling above-ground carbon and tree allometry along a tropical elevation gradient. Biol. Consrv. 154, 20–33 (2012).
- Spracklen D, Righelato R. Tropical montane forests are a larger than expected global carbon store. Biogeosci. Discuss. 10, 18893–924 (2013).
- Hu H, Wang S, Guo Z, Xu B, Fang J. The stage-classified matrix models project a significant increase in biomass carbon stocks in China’s forests between 2005 and 2050. Scientific Rep. 5, 11203 (2015).
- Peng S, Wen D, He N, Yu G, Ma A, Wang Q. Carbon storage in China's forest ecosystems: estimation by different integrative methods. Ecol. Evol. 6, 3129–45 (2016).
- Zeng W-S. Development of monitoring and assessment of forest biomass and carbon storage in China. For. Ecosyst. 1, 20 (2014).
- Fang J, Chen A, Peng C, Zhao S, Ci L. Changes in forest biomass carbon storage in China between 1949 and 1998. Science. 292, 2320–2 (2001).
- Pan Y, Luo T, Birdsey R, Hom J, Melillo J. New estimates of carbon storage and sequestration in China’s forests: effects of age–class and method on inventory-based carbon estimation. Climatic Chng. 67, 211–36 (2004).
- Zhao M, Yue T, Zhao N, Sun X. Spatial distribution of forest vegetation carbon stock in China based on HASM. J. Geograph. Sci. 68, 1212–24 (2013).
- Fang J-Y, Wang GG, Liu G-H, Xu S-L. Forest biomass of China: an estimate based on the biomass–volume relationship. Ecol. Appl. 8, 1084–91 (1998).
- Fang J, Guo Z, Piao S, Chen A. Terrestrial vegetation carbon sinks in China, 1981–2000. Sci. China Earth Sci. 50, 1341 (2007).
- Xu X, Cao M, Li K. Temporal-spatial dynamics of carbon storage of forest vegetation in China. Progress in Geogr. 26, 1–10 (2007).
- Zhang C, Ju W, Chen JM, et al. China’s forest biomass carbon sink based on seven inventories from 1973 to 2008. Clim. Chng. 118, 933–48 (2013).
- Piao S, Fang J, Zhu B, Tan K. Forest biomass carbon stocks in China over the past 2 decades: Estimation based on integrated inventory and satellite data. J. Geophys. Res.: Biogeosci. 110, G01006 (2005).
- Chi H. Research on forest aboveground biomass estimation in China based on ICESat/GLAS and MODIS data. Institute of Remote Sensing Applications, Beijing, (2011).
- Dixon RK, Brown S, Houghton Rea, Solomon A, Trexler M, Wisniewski J. Carbon pools and flux of global forest ecosystems. Science(Washington). 263, 185–9 (1994).
- Zhou Y-R, Yu Z-L, Zhao S-D. Carbon storage and budget of major Chinese forest types. Acta Phytoecol. Sinica. 24, 518–22 (2000).
- Ni J. Carbon storage in terrestrial ecosystems of China: estimates at different spatial resolutions and their responses to climate change. Clim. Chng. 49, 339–58 (2001).
- Guo Z, Fang J, Pan Y, Birdsey R. Inventory-based estimates of forest biomass carbon stocks in China: A comparison of three methods. For. Ecol. Mngmnt. 259, 1225–31 (2010).
- Weisheng LHLYZ. Forest carbon storage in China estimated using forestry inventory data [J]. Sci. Silvae Sinicae. 7, 4 (2011).
- Li K, Wang S, Cao M. Vegetation and soil carbon storage in China. Sci. China Ser. d earth sciences-english edition. 47, 49–57 (2004).
- Xianli X, Bo S, Huizhen Z. Organic carbon density and storage in soils of China and spatial analysis. Acta Pedologica Sinica. 41, 35–43 (2004).
- Yang Y, Mohammat A, Feng J, Zhou R, Fang J. Storage, patterns and environmental controls of soil organic carbon in China. Biogeochem. 84, 131–41 (2007).
- Yu D, Shi X, Wang H, et al. Regional patterns of soil organic carbon stocks in China. J. Envrnmntal. Mngmnt. 85, 680–9 (2007).
- Laurance WF, Laurance SG, Ferreira LV, et al. Biomass collapse in Amazonian forest fragments. Science. 278, 1117–8 (1997).
- de Paula MD, Costa CPA, Tabarelli M. Carbon storage in a fragmented landscape of Atlantic forest: the role played by edge-affected habitats and emergent trees. Trop. Consrv. Sci. 4, 349–58 (2011).
- Chaplin-Kramer R, Ramler I, Sharp R, et al. Degradation in carbon stocks near tropical forest edges. Nature Commun. 6, 10158 (2015).
- Hao X, Yujun S, Xinjie W, Jin W, Yao F. Linear mixed-effects models to describe individual tree crown width for China-fir in Fujian province, Southeast China. PLos One. 10, e0122257 (2015).
- Guangyi M, Yujun S, Saeed S. Models for predicting the biomass of Cunninghamialanceolata trees and stands in Southeastern China. PLos One. 12, e0169747 (2017).
- Liping C, Yujun S, Saeed S. Monitoring and predicting land use and land cover changes using remote sensing and GIS techniques—A case study of a hilly area, Jiangle, China. PLos One. 13, e0200493 (2018).
- Heithecker TD, Halpern CB. Edge-related gradients in microclimate in forest aggregates following structural retention harvests in western Washington. For. Ecol. Mngmnt. 248, 163–73 (2007).
- Chen J, Franklin JF, Spies TA. Growing-season microclimatic gradients from clearcut edges into old-growth Douglas-fir forests. Ecol. Appl. 5, 74–86 (1995).
- Justine MF, Yang W, Wu F, Tan B, Khan MN, Zhao Y. Biomass stock and carbon sequestration in a chronosequence of Pinus massoniana plantations in the upper reaches of the Yangtze River. Forests. 6, 3665–82 (2015).
- Sun Y, Wang X, Ma W. Research on forest carbon storage monitoring techniques of typical tree species in collective forest right system reform area. Beijing: China Forestry Publishing House, (2014).
- Brown S, Lugo AE. The storage and production of organic matter in tropical forests and their role in the global carbon cycle. Biotropica. 14, 161–87 (1982).
- Malhi Y, Baker TR, Phillips OL, et al. The above-ground coarse wood productivity of 104 Neotropical forest plots. Global Chng. Biol. 10, 563–91 (2004).
- Roy J, Mooney HA, Saugier B. Terrestrial global productivity. Academic Press, London, (2001).
- Ahmad A, Nizami SM. Carbon stocks of different land uses in the Kumrat valley, Hindu Kush Region of Pakistan. J. For. Res. 26, 57–64 (2015).
- Saeed S, Ashraf MI, Ahmad A, Rahman Z. The bela forest ecosystem of District Jhelum, A potential carbon sink. Pak. J. Bot. 48, 121–9 (2016).
- Lu R. Analytical methods of soil agrochemistry. China Agricultural Science and Technology Publishing House, Beijing, China, 18–99 (1999).
- Walkley A, Black IA. An examination of the Degtjareff method for determining soil organic matter, and a proposed modification of the chromic acid titration method. Soil Sci. 37, 29–38 (1934).
- Pearson TR, Brown SL, Birdsey RA. Measurement guidelines for the sequestration of forest carbon. Department of Agriculture, Washington, D. C, 6–15, (2007).
- Zianis D, Mencuccini M. On simplifying allometric analyses of forest biomass. For. Ecol. Mngmnt. 187, 311–32 (2004).
- West GB, Brown JH, Enquist BJ. A general model for the structure and allometry of plant vascular systems. Nature. 400, 664–7 (1999).
- Balderas Torres A, Lovett JC. Using basal area to estimate aboveground carbon stocks in forests: La Primavera Biosphere's Reserve, Mexico. For. 86, 267–81 (2012).
- Laurance WF, Lovejoy TE, Vasconcelos HL, et al. Ecosystem decay of Amazonian forest fragments: a 22-year investigation. Consrv. Biol. 16, 605–18 (2002).
- Briant G, Gond V, Laurance SG. Habitat fragmentation and the desiccation of forest canopies: a case study from eastern Amazonia. Biol. Consrv. 143, 2763–9 (2010).
- Peters HA. Clidemia hirta invasion at the Pasoh Forest Reserve: an unexpected plant invasion in an undisturbed tropical forest. Biotropica. 33, 60–8 (2001).
- Curran LM, Caniago I, Paoli G, et al. Impact of El Nino and logging on canopy tree recruitment in Borneo. Science. 286, 2184–8 (1999).
- Esseen P-A. Tree mortality patterns after experimental fragmentation of an old-growth conifer forest. Biol. Consrv. 68, 19–28 (1994).
- D'Angelo SA, Andrade AC, Laurance SG, Laurance WF, Mesquita RC. Inferred causes of tree mortality in fragmented and intact Amazonian forests. J. Trop. Ecol. 20, 243–6 (2004).
- Sampaio AB, Scariot A. Edge effect on tree diversity, composition and structure in a deciduous dry forest in central Brazil. Revista Árvore. 35, 1121–34 (2011).
- Philip MS. Measuring trees and forests. CAB international, Wallingford, Oxon, (1994).
- Nizami SM. The inventory of the carbon stocks in sub tropical forests of Pakistan for reporting under Kyoto Protocol. J. For. Res. 23, 377–84 (2012).
- Nascimento HE, Laurance WF. Biomass dynamics in Amazonian forest fragments. Ecol. Appl. 14, 127–38 (2004).
- Barros HS, Fearnside PM. Soil carbon stock changes due to edge effects in central Amazon forest fragments. For. Ecol. Mngmnt. 379, 30–6 (2016).
- Laurance WF, Ferreira LV, Rankin-de Merona JM, Laurance SG. Rain forest fragmentation and the dynamics of Amazonian tree communities. Ecology. 79, 2032–40 (1998).
- Lu Y, Coops NC, Wang T, Wang G. A process-based approach to estimate Chinese fir (Cunninghamia lanceolata) distribution and productivity in Southern China under climate change. Forests. 6, 360–79 (2015).