
 ?Mathematical formulae have been encoded as MathML and are displayed in this HTML version using MathJax in order to improve their display. Uncheck the box to turn MathJax off. This feature requires Javascript. Click on a formula to zoom.
Abstract
Carbon (C) mineralization of crop residues is an important process occurring in soil which is helpful in predicting CO2 emission to the atmosphere and nutrient availability to plants. A laboratory experiment was conducted in which C mineralization of residues of rice (Oryza sativa), wheat (Triticum aestivum), maize (Zea mays), mungbean (Vigna radiata) and their mixtures was applied to the soil surface or incorporated into an Alfisols from Northwest India. C mineralization was significantly affected by residue placement and type and their interactions. Rice residue had a higher decomposition rate (k = 0.121 and 0.076 day−1) than wheat (0.073 and 0.042 day−1) and maize residues (0.041 day−1) irrespective of placements. Higher decomposition rates of rice and wheat were observed when placed on soil surface than incorporated in the soils. Additive effects of the contribution of each residue type to C mineralization of the residue mixture were observed. When mungbean residue was added to the rice/wheat or maize/wheat mixture, decomposition of the residue mixture was enhanced. Crop residues with low N and high C/N ratio such as maize, wheat, rice and their mixtures can be applied on the soil surface for faster C and N mineralization, thereby helping to manage high volumes of residues under conservation agriculture-based practices in northwest India.
Introduction
Rice–wheat is a major crop rotation in the Indo-Gangetic Plains (IGP) of South Asia, spread over 13.5 million ha in Bangladesh, India, Nepal and Pakistan [Citation1]. Productivity of the double-grain system cannot be sustained unless the declining trend in soil fertility resulting from nutrient mining by these crops is reversed [Citation2] through healthy and well-designed supplements. Decreasing sources of organic manure (such as farmyard manure) along with escalating fertilizer prices and limited input availability have aggravated the undernourishment of agricultural fields.
Returning crop residues to soil is the most economical and ecological means of conserving soil and water for sustaining crop production [Citation3]. Crop residues serve as a source of nutrients, help in maintaining soil organic carbon (SOC) and subsequently improve overall soil quality [Citation4]. Release of essential nutrient elements in soil as well as emission of CO2 into the atmosphere are controlled by the mineralization of organic matter in soil [Citation5–7], making it the most important process occurring in soil. In India, to improve the productivity of the rice–wheat cropping system there is no doubt that an adequate and balanced supply of essential nutrients is of critical concern. Indian farmers, mostly marginal and small, do not apply the recommended doses of fertilizers. Crop residues represent a locally available source that has been often shown to enhance the efficiency of and reduce the requirement for chemical fertilizers [Citation8]. Burning of these crop residues leads to loss of organic matter as well as plant nutrients such as nitrogen (N), phosphorus (P) and sulfur (S). The best alternative is to recycle the crop residues into agricultural land for improving soil health and crop productivity [Citation4].
In northwest India, particularly Punjab and Haryana, conservation agriculture (CA) is widely adopted by farmers due to energy and water saving which ultimately leads to lower production costs and higher profitability [Citation9]. In CA the soil is less disturbed and residues typically remain on its surface. A major question about these expanding practices is to what extent the decomposition and nutrient release of these residues is favored or retarded by its retention on the surface as opposed to its incorporation into the soil and how this may vary with different crop species and mixtures.
For better understanding of organic matter dynamics in soil, carbon and or nitrogen mineralization studies are essential. CA also includes a cover crop in the rotation where the residue of the cover crop acts as mulch on the soil surface. The fresh organic matter derived from the crop residues decomposes and is subsequently mineralized in soil. C mineralization of these crop residues results in the release of CO2 to the atmosphere and nutrient elements for soil fertility improvement. The dynamics of C and N mineralization is directly linked with the decomposition of fresh plant material.
The initial placement of crop residues in soils can modify physical, biological and chemical conditions for decomposition and long-term soil conditions as well [Citation10]. But there are contradictory reports on the effects of residue location on C mineralization. A non-significant effect of residue placement on C mineralization is also reported [Citation11]. Other studies have shown that decomposition of crop residues was faster when they were incorporated into the soil rather than placed on the surface [Citation10,Citation12]. Residue type and nutrient availability in soil might have played an important role in such inconsistencies [Citation10,Citation13]. However, there is lack of information on the interactive effects of residue type and placement. The mineralization of crop residues returned to soils is controlled by many factors [Citation10,Citation14], of which residue type has long been identified as an important one [Citation15,Citation16].
In the CA system, rice and wheat are widely cultivated crops in the northwest IGP, and in many places rice is being replaced by maize and legumes, particularly mungbean, as a cover crop are included in the rotation. When crops are grown in association, different crop residues usually mix together and decompose simultaneously within the same soil [Citation17]. Therefore, the present laboratory experiment was designed to examine C mineralization patterns of these four residues and their mixtures when placed on the soil surface as well as incorporated into soils.
Materials and methods
Soils and crop residues
Soils and crop residues used for the incubation study were collected from the seed production field (latitude 29°43’N, longitude 76°58’E, altitude 245m mean sea level) located at Indian Council of Agricultural Research (ICAR)-Central Soil Salinity Research Institute, Karnal, Haryana, India. Carbon mineralization was determined by a laboratory incubation experiment in this study. The studied soil corresponds to the Zarifa Viran soil series. It is a member of the fine-loamy mixed hyperthermic family of Typic Natrustalf [Citation18].
Soil samples were collected from 0–15 cm depth in October 2013 after rice harvesting using a metal core sampler. After removal of the visible crop and residue debris, the soil samples were sieved through a 2-mm sieve and divided into two subsamples. One subsample was used to conduct the incubation experiment and another subsample was dried under shade and used for chemical analyses. The air-dried sample was used for analysis of pH, electrical conductivity (EC), oxidizable organic carbon, total C, available N, P and K, and sand, silt and clay contents. The values of the different soil parameters are presented in .
Table 1. Initial characteristics of the soil used for the incubation study.
Crop residues were collected during the harvest in March (wheat) and May (mungbean), 2013 and October, 2013 (maize and rice). Triplicate samples were collected per crop type. The crop residues were mixed together for each replicate and air-dried. A portion of the samples was oven-dried at 60°C to determine the water content and ground prior to determination of the concentrations of total C and N. Other samples were also ground (<0.25 mm) and stored in sealed containers for the incubation experiment. The chemical compositions of the residue mixtures were calculated based on the mass ratios of the individual components ().
Table 2. Initial chemical characteristics of the crop residues used for the study.
Soil analyses
Total C and N of the soil and crop residues were estimated using a CHNS Vario El III analyzer (Elementar, Germany). Soil pH (soil:water ratio 1:2) and EC were determined by following standard methods [Citation19]. The soil available nitrogen was determined by the alkaline permanganate method [Citation20], available phosphorus by the method of Olsen et al. [Citation21], and available potassium with a flame photometer using neutral normal ammonium acetate [Citation19]. Soil textural analysis was performed by following the International Pipette Method [Citation22]. Soil bulk density was measured by the core method using metal cores 5 cm long with 5 cm internal diameter by placing the core in the middle of the surface soil layer [Citation23].
Incubation experiment
In the incubation experiment, 15 treatments were included with three replicates. Treatments were applied as follows. Surface application of rice (Rs), maize (Ms) and wheat (Ws) residue was done. They were also incorporated in the soil, designated as rice (Ri), maize (Mi) and wheat (Wi). Mixtures of these residues were also used in the experiment, as surface application and by incorporation into the soil, of rice + wheat (RWs and RWi), maize + wheat (MWs and MWi), rice + wheat + mungbean (RWMbs and RWMbi), maize + wheat + mungbean (MWMbs and MWMbi), and Control (only soil). The ratio of the residues in the mixed residue treatments was equal on a mass basis.
Carbon mineralization was measured under controlled conditions using a modified laboratory incubation method [Citation24]. Briefly, fresh soils were preincubated at 25 °C for 24 hours to allow the microorganisms to adapt to the laboratory incubation conditions. Residues and their mixtures were incorporated into the soil homogeneously (equivalent to 20 g oven-dried soil) or placed as a single layer on the soil surface (soil:residue ratio 10:1) in a conical flask (500 mL in volume, 12 cm in height). The present experiment used a very high proportion of residue because in northwest India, farmers have been practicing conservation agriculture with zero tillage and residue retention for the last 15–20 years. Every year about 10–15 t ha−1 of residue has been added and this practice will be continued in the years to come. So this study has tried to capture the changes in C mineralization under different residue placements and types with higher rates of residue addition.
The conical flasks containing soils with or without residues were incubated at a constant temperature (25 °C) and water content of soil (60% of water-holding capacity) for 106 days. A double-layered high-quality parafilm cover was used to make the conical flasks air-tight, and they were placed in an incubator. The moisture content of the soil in the conical flasks was checked daily by measuring weight loss, and deionized water was added whenever needed. Gas samples were collected periodically (after 1, 3, 8, 15, 29, 43, 57, 78, 106 days) from the top of the conical flask using a 50-mL polypropylene syringe with a three-way leur lock and transferred immediately into a pre-evacuated and labeled 30-mL capacity vial. These vials were evacuated with an evacuator suction pump and labeled with the date and treatment. Collected samples were analyzed for CO2 using a gas chromatograph (GC model: Varion Green House Gas Analyzer 450) equipped with a thermal conductivity detector (TCD for CO2), with heater temperature settings of 200 °C with column oven temperature 50 °C. Zero air, hydrogen, nitrogen, 5% methane-argon and helium were used as carrier gas for the GC. The carrier gas helium was used for TCD with a flow rate of 20 mL min−1. Concentrations of gases were calculated by comparing relative peak areas against the curves prepared from known concentrations of standard gases (100 ppm and 500 ppm for CO2) obtained from Linde Specialty Gases, North America. To address the issue of GC drift, the GC was calibrated using these standards before running each batch of samples. Fluxes of CO2 were calculated by linear regression of gas concentration against time of sampling. All data were checked for linearity by visual inspection during data analysis. After collection of gas samples, air was allowed into the conical flasks by opening them for 2 hours and the moisture content of soil was adjusted with distilled water on a weight basis. The C mineralization was calculated as the difference between the amount of CO2 produced from the samples containing residues and those without residues. It was assumed that the effect of external residue inputs on the mineralization of native soil organic matter was negligible and therefore was ignored due to non-availability of isotope labelling facilities. This is the total CO2 evolved from decomposition of crop residues and native soil organic matter (i.e. priming effect). The amount of CO2 evolved after 1, 3, 8, 15, 29, 43, 57, 78, and 106 days was added together to determine the cumulative C mineralization for the 106-day incubation period. The values of CO2 evolved were divided by the mass of the soil samples (on an oven-dried weight soil basis) and were expressed as mg CO2-C g−1 soil. The cumulative C mineralization data were fitted into CurveExpert Professional version 2.2.0 software (a comprehensive data analysis software system for Windows, Mac and Linux) to find the trend of observed and predicted values of C mineralization.
Kinetics model and statistical analyses
The decomposition kinetics was fitted with a first-order exponential model [Citation25]. The first-order kinetic model is expressed as:
(1)
(1)
where Cm = cumulative CO2-C emission, C0 = potentially mineralizable C (mg g−1), k = decomposition rate constant (day−1), and t = time of incubation (days).
Model evaluation
The model was evaluated using the goodness-of-fit test to compare observed data with predictions [Citation26]. The mathematical expressions that describe these measures of analysis are the mean residual error (ME), mean relative error (MRE), the root mean square error (RMSE), modelling efficiency (EF), coefficient of determination (CD) and coefficient of residual mass (CRM). For a perfect fit between observed and simulated data, values of ME, MRE, RMSE, CRM, CD and EF should equal 0.0, 0.0, 0.0, 0.0, 1.0 and 1.0, respectively.
Mean residual error (ME):
(2)
(2)
Mean relative error (MRE):
(3)
(3)
Root mean square error (RMSE):
(4)
(4)
Coefficient of determination (CD):
(5)
(5)
Modelling efficiency (EF):
(6)
(6)
Coefficient of residual mass:
(7)
(7)
where:
Pi = Predicted values
Oi = Observed values
O = Mean of the observed data
n = Number of samples
Results
Chemical properties of the crop residues
Among the four crop species, mungbean residues had the highest total nitrogen (TN) concentration and the lowest C/N ratio, whereas rice residues showed the lowest total C and wheat residue showed the highest C/N ratio (P < 0.05; ). Rice and wheat residues had similar TN concentrations, whereas maize, wheat and mungbean showed similar total C concentrations. Averages for these values were used to calculate the properties of the residue mixtures.
C mineralization
Significant variation was observed with both residue type and placement, and mineralization was always lowest in unamended soils throughout the incubation period ( and ). Among the treatments, where residues and their mixtures were incorporated into the soil, RWMbi showed consistently higher cumulative C mineralization up to 43 days (). A steep increase was observed in Wi after 15 days, and cumulative C mineralization exceeded the value of RWMbi at 57 days of incubation and showed its highest value (666.8 µg C g−1 soil) after 106 days of incubation (). Treatment Ri showed a consistent increase in cumulative C mineralization up to 29 days of incubation, after which no more increase was observed and it became constant and parallel to the x-axis. After 106 days of incubation, the highest (666.8 µg C g−1 soil) cumulative C mineralization was observed under Wi followed by RWMbi (640.4 µg C g−1 soil), RWi (610 µg C g−1 soil), MWMbi (600 µg C g−1 soil), Mi (556.6 µg C g−1 soil), MWi (549 µg C g−1 soil) and Ri (413.7 µg C g−1 soil) ().
Figure 1 Changes in cumulative carbon mineralization (µg C g−1 soil) on different days under different residues incorporated in soil. Vertical bars indicate ± standard error of the mean of the observed values.Ri: Rice, incorporated into the soils. Wi: Wheat, incorporated into the soils. Mi: Maize, incorporated into the soils. RWi: Rice + wheat, incorporated into the soils. MWi: Maize + wheat, incorporated into the soils. RWMbi: Rice + wheat + mungbean, incorporated into the soils. MWMbi: Maize + wheat + mungbean incorporated into the soils. Control: only soil.
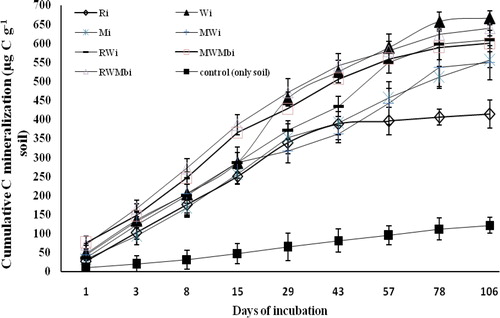
Figure 2 Changes in cumulative carbon mineralization (µg C g−1 soil) on different days under different residues surface-applied to the soil. Vertical bars indicate ± standard error of the mean of the observed values.Ri: Rice, incorporated into the soils. Wi: Wheat, incorporated into the soils. Mi: Maize, incorporated into the soils. RWi: Rice + wheat, incorporated into the soils. MWi: Maize + wheat, incorporated into the soils. RWMbi: Rice + wheat + mungbean, incorporated into the soils. MWMbi: Maize + wheat + mungbean incorporated into the soils. Control: only soil.
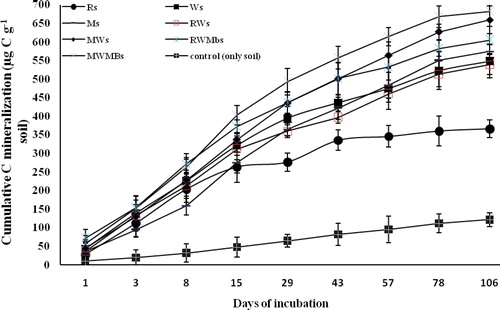
Among the surface-applied residue treatments, MWMbs produced the highest (682.8 µg C g−1 soil) cumulative C mineralization followed by MWs (659.4 µg C g−1 soil), RWMbs (605.3 µg C g−1 soil), Ms (574.4 µg C g−1 soil), Ws (548.6 µg C g−1 soil), RWs (538.9 µg C g−1 soil), and Control (366 µg C g−1 soil) after 106 days of incubation (). MWMbs showed consistently higher C mineralization than the other treatments throughout the incubation period. Up to 15 days of incubation, there was an increase in cumulative C mineralization in all the treatments, but after that Control showed a declining trend and became constant and parallel to the x-axis ().
Results show that cumulative C mineralization was significantly (both P < 0.001) affected by residue type and placement, whereas significant interactions between them were observed for cumulative C mineralization (P < 0.001; ). Sampling time and its interactive effects with residue placement were also significant for C mineralization (both P < 0.001). There was significant interaction between sampling time and residue type on C mineralization, and the interactive effects of sampling time, residue type and placement were also statistically significant ().
Table 3. Cumulative C mineralization (µg C g−1 soil) in soils amended with different residues after 106 days of incubation.
The carbon mineralization data were well fitted to a first-order exponential model (R2 = 0.88 − 0.99; and ). Rice residue had a higher decomposition rate constant (k values) than did wheat and maize residue irrespective of their placements (). The k values for all the treatments where rice, wheat and mung bean residues and their mixtures were placed on the soil surface were higher than those of the same residues incorporated into the soils, except the treatments with maize residue alone and a mixture of maize, wheat, and mung bean residues, where the opposite trend was observed (). This indicates that the mixed residues supported soil microbial activities more readily when were applied on the soil surface. Significant differences in cumulative C mineralization of the residue mixtures were found between the observed and predicted values for the two placements (P > 0.05, ), which suggests that mere arithmetic prediction is neither sufficient nor scientific for guessing the micro-biochemical treatments that the residue mixtures receive in the soil but the individual residues do not.
C mineralization rate
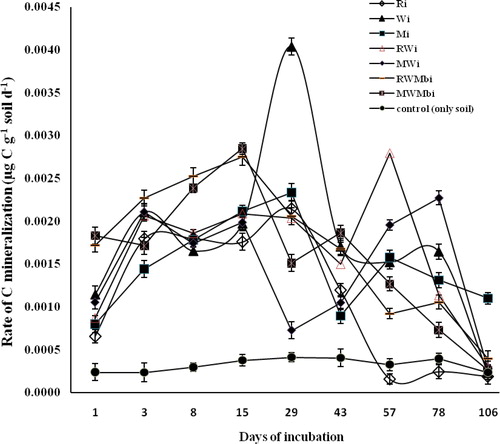
Rates of C mineralization varied significantly with incubation time under both residue placements. Initially all the treatments where residue was incorporated showed an increase in C mineralization rate up to the third day of incubation, except MWMbi which showed an inconsistent rate up to 29 days (). An initially higher rate of C mineralization was observed under RWMbi treatment compared with other treatments, up to 15 days, and then it sharply decreased until the end of the incubation period. The highest increase (0.0040 µg C g−1 soil d−1) in C mineralization rate was observed under Wi at 29 days of incubation (). After 29 days, Ri showed the highest decrease in mineralization rate, which was lower than the control treatment at 57 days of incubation. After 43 days, the highest (0.0028 µg C g−1 soil d−1) C mineralization rate was observed under treatment RWi followed by MWi (0.0020 µg C g−1 soil d−1). At 78 days of incubation, MWi showed the highest (0.0023 µg C g−1 soil d−1) increase in C mineralization rate followed by Wi (0.0016 µg C g−1soil d−1), and after that a decrease in mineralization rate was observed at 106 days of incubation ().
Figure 3 Changes in rate of carbon mineralization (µg C g−1 soil) on different days under different residues incorporated into the soil. Vertical bars indicate ± standard error of the mean of the observed values. Ri: Rice, incorporated into the soils. Wi: Wheat, incorporated into the soils. Mi: Maize, incorporated into the soils. RWi: Rice + wheat, incorporated into the soils. MWi: Maize + wheat, incorporated into the soils. RWMbi: Rice + wheat + mungbean, incorporated into the soils. MWMbi: Maize + wheat + mungbean incorporated into the soils. Control: only soil.
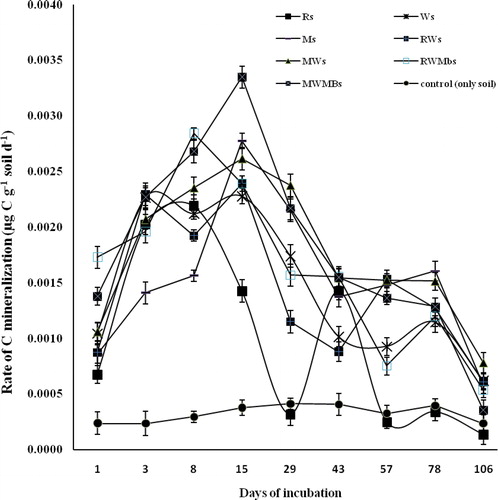
All the treatments where residue was applied to the soil surface showed an increase in C mineralization rate up to 8 days of incubation, except Ws and RWs treatments which showed a slight decrease in mineralization rate (). The highest C mineralization rate (0.0033 µg C g−1 soil d−1) was observed under the MWMbs treatment followed by Ms (0.0028 µg C g−1 soil d−1), MWs (0.0026 µg C g−1 soil d−1), RWMbs (0.0024 µg C g−1 soil d−1) = RWs (0.0024 µg C g−1 soil d−1) and Ws (0.0023 µg C g−1 soil d−1) at 15 days of incubation (). Treatments RWMbs and Rs showed a decrease in mineralization rate at 15 days of incubation. The highest decrease in mineralization rate was observed under the Rs treatment which went lower than the Control at 29 days of incubation, and then increased steeply at 43 days where other treatments showed a sharp decrease in mineralization rate. At 57 days of incubation, all the treatments showed a decline in the mineralization rate, except RWs which recorded an increase in the mineralization rate. After that, RWMbs and Ws showed a slight increase in C mineralization rate and the others were parallel to the x-axis ().
Figure 4 Changes in rate of carbon mineralization (µg C g−1 soil) on different days under different residues surface-applied to the soil. Vertical bars indicate ± standard error of the mean of the observed values.Ri: Rice, incorporated into the soils. Wi: Wheat, incorporated into the soils. Mi: Maize, incorporated into the soils. RWi: Rice + wheat, incorporated into the soils. MWi: Maize + wheat, incorporated into the soils. RWMbi: Rice + wheat + mungbean, incorporated into the soils. MWMbi: Maize + wheat + mungbean incorporated into the soils. Control: only soil.
Discussion
C mineralization as influenced by residue placement
Higher cumulative C mineralization was observed for residues incorporated into soils than placed on the soil surface, except for treatments where maize residue was applied. Li et al. [Citation25] also observed higher cumulative C mineralization with maize residues placed on soil surface than incorporated into soils. The effect of residue placement was significant (P < 0.001). The decomposition rate constant (k) values for rice and wheat residues applied on surface soil were higher than those of the same residues incorporated into the soil (), whereas a similar k value was observed with maize residue placed on the surface as well as incorporated into soil. MWMbi showed a higher k value than the surface application of the same residues (). Giacomini et al. [Citation10] observed a higher C mineralization rate under residue incorporation than surface application. Sarma et al. [Citation7] observed higher cumulative CO2 emission with the addition of organic amendments, and the highest increase was associated with vermicompost incorporated into soil. A higher C mineralization rate was observed under MWMbi treatment than surface application. Treatments where maize residues were surface-applied (Ms) and incorporated into soil (Mi) showed similar C mineralization rates, which is in accordance with the findings of Abiven and Recous [Citation11] who did not find any significant differences in C mineralization rate between surface-applied and soil-incorporated residues. The initial location of high N content and residues rich in soluble compounds in the soils did not affect C mineralization [Citation12]. But Sarma et al. [Citation27] found that organic substances such as fresh crop residues, farmyard manure, and composts with less humified organic amendments are more vulnerable to mineralization than stable structured organics (biochar, C-rich pyrolyzed product of biomass). Soil physical, chemical and biological properties were modified by the contact between soils and residues, ultimately affecting the decomposition of the residues [Citation28]. Many studies showed that closer contact between soil and residue facilitated the decomposition of the residues [Citation12,Citation29,Citation30]. The chemical characteristics (soluble compounds) and morphological features of the residues, particle size [Citation24], and location in the soil [Citation31,Citation32] influenced the residue–soil contact. Moisture content and temperature also affect the C mineralization of the residues incorporated or surface-applied [Citation14,Citation33]. But in the present case temperature and moisture content were controlled throughout the experiment. When residues are applied on the soil surface or incorporated, microorganisms act on the residues. Oxygen availability to the microorganisms is an important factor affecting the decomposition of residues [Citation34]. When residues are incorporated into the soil, gas diffusivity might be lower, thereby reducing the residue decomposition. Residues applied on the soil surface produced more CO2 than did residues incorporated into soils [Citation25]. In this study, this is true for the treatments where maize residues were applied singly or in combination with wheat or mungbean residues. Incorporation of maize residues in soil inhibited decomposition, which might be attributable to a lack of oxygen availability to the microorganisms [Citation25]. This might also have happened with the treatments MWMbi, Ms, and Mi, where lower or on-par values of the decomposition constant were observed. Except for the maize residue treatments, all treatments showed higher cumulative C mineralization when incorporated into the soil than when surface-applied. This might be attributable to the closer contact between soil and residues incorporated into the soil, leading to faster decomposition of residues [Citation12,Citation29,Citation30], although the rate of decomposition was higher in treatments where residues were surface-applied.
For decomposition of crop residues in soil, microorganisms need nitrogen. So, the availability of N in soil is an important factor determining decomposition of residues in soil. The rate of C and N mineralization in soil is regulated by the C/N ratio of the crop residues [Citation35]. The N mineralization in soil upon residue addition was not studied. But in general, when residues are applied in soil, immobilization of N takes place. In this study, in the treatments where mungbean residues were applied in combination with rice, wheat or maize residues, higher C mineralization was observed. This might be attributable to higher N content as well as a lower C/N ratio of mungbean leading to higher C mineralization in soil (). Li et al. [Citation25] also observed greater N immobilization upon maize residue incorporation in soil than with surface application. Abiven and Recous [Citation11] conducted a study where they maintained the mineral N content in the soil at 80 ppm through supplemental N to check N limitations during the process of decomposition. The present study did not use any N supplement, which might have caused nitrogen limitation for the microorganisms during the decomposition process of the residues. This might have resulted in different residue placement effects on C mineralization in the present study.
Residue-type effect on C mineralization
Crop residues with high N concentration and low C/N ratio showed higher initial C mineralization as compared to residues with low N and high C/N ratios (; and ). Many researchers have reported similar observations [Citation5,Citation25,Citation36]. The concentration of readily assimilable substrate and availability of nitrogen in soil determine the activity of the microorganisms [Citation37]. Microorganisms require nitrogen for their metabolism and cell synthesis; normally 1 part N is required for every 10 parts C assimilation [Citation38]. Decomposition of residue releases nitrogen into the soil which serves as an N source for the microorganisms, therefore favoring a stimulating effect on C mineralization [Citation25]. Therefore, C mineralization of the residues might have been affected by the initial N concentration. Because mungbean is a legume, its residue decomposed faster than rice, wheat and maize residues irrespective of placement (), as it contains higher N and has a lower C/N ratio (). In the treatments where mungbean residue was mixed with rice, wheat and maize, higher C mineralization was observed than without mungbean residue, irrespective of their placement ( and 5). Many studies showed that addition of high C/N ratio residues to soil caused immobilization of N during the process of decomposition [Citation39,Citation40]. In this experiment, a high C/N ratio was observed for rice, wheat and maize residues as well as their combinations (). Moreover, the soil used for the experiment contained low available N (130 kg N ha−1) which might have caused immobilization of N, and ultimately there was a limitation of N for the microorganisms for decomposition of rice, wheat and maize residues in soil.
Mixed effects of residues on C mineralization
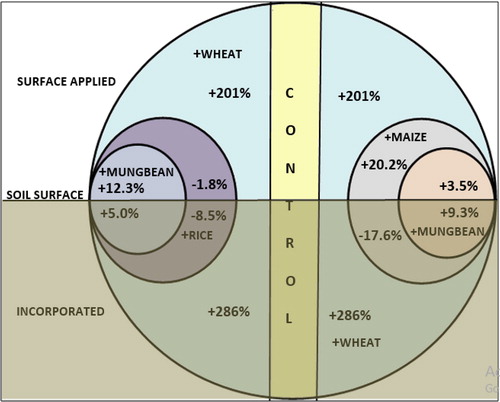
As the C and N concentrations of different residues were not similar (), the C mineralization of those residues in single or mixed forms was different (). A synergistic effect of mixed residues was found when mungbean residue was added with rice/wheat and maize/wheat residues irrespective of placement (). When rice or maize residue was added with wheat residue, there was a decrease in C mineralization irrespective of placement, except in the case of maize + wheat placed on the soil surface (). A higher decrease was observed when the residues were incorporated into soil, which might be due to lower O2 gas diffusivity causing O2 limitation to decomposer microorganisms [Citation25]. A similar negative effect of residue mixtures was also observed by Robinson et al. [Citation41]. But in the case of the maize + wheat residue mixture placed on the soil surface, about 20% higher C mineralization than with only wheat surface-applied was observed (). At the soil surface, higher O2 availability to microorganisms might have facilitated the decomposition of maize residues. The higher N and lower C/N ratio of mungbean residues facilitated the decomposition of mixed residues of rice/wheat or maize/wheat through higher activities of decomposer microorganisms. A similar synergistic effect of residue mixtures on C mineralization was reported by McTiernan et al. [Citation42]. Interestingly, the highest rates of C mineralization on the 29th, 57th and 78th days of incubation were recorded with the treatments W, RW and MW, respectively, where wheat residue was the sole component or one of the components. This may indicate that rice and maize residues are more readily mineralized than wheat (an initial acceptability sequence can be drafted as R > M > W) due to which the peak shifts toward the right from W to RW and MW, but after some initial difficulty, wheat residue becomes the most acceptable substrate for the microbiota in the soil ( and ).
Figure 5 Changes in cumulative C mineralization in soils amended with mixed residues of rice, wheat, maize and mungbean after the 106-day incubation.
Cumulative C mineralization as well as the decomposition rate constant in all the treatments except rice and wheat were higher when residues as well as their mixtures were placed on the soil surface rather than incorporated into soil. This implies higher mineralization of organic carbon leading to more nutrient availability to plants under CA-based practices with a maize-based cropping system. But higher mineralization also produces higher CO2 to the atmosphere. Therefore, in situ collection of CO2 as well as GHGs under different CA-based practices deserves further experimental study. As this study used a much higher rate of residue addition to soil, the potential C mineralization in all the treatments except the control were lower than the cumulative C mineralization. This indicates the process of mineralization was still going on even after the last observation on the 106th day. As a result, higher cumulative C mineralization was found under rice/wheat residue when incorporated into soil singly or in combination, but the decomposition rate constant was higher for the surface-applied treatments (). Therefore, the incubation experiment should have been continued for another 2–3 months to achieve complete mineralization.
Prediction of C mineralization
For prediction of the cumulative C mineralization under different residues and their mixtures, the observed cumulative C mineralization was fitted to a first-order exponential model using the curve-expert software (). From there the potential C mineralization was found as well as the decomposition rate constant (). This method provided an excellent visual interpretation of the differences between observed and predicted values of C mineralization for all the treatments with different residues and their mixtures placed on the soil surface or incorporated into the soil, in terms of bias and point scatter. Moreover, the results from the graph were evaluated by calculating the MRE, ME, RMSE, CD, CRM and EF, which gave a measurement of bias and scatter. The values of six statistics for the observed and predicted cumulative C mineralization are presented in . The ME and MRE represent the worst-case performance of the model, whereas the RMSE value shows how much the predictions overestimate or underestimate the measurements. In all the graphs, the dark-colored area indicates the confidence interval and the light-colored area indicates the prediction band. For all treatments, the MRE values were very low, but the treatments except rice incorporated into soil where wheat or maize, singly or in combination, was applied at the soil surface showed the lowest value and best fit the model. But the reverse took place with the treatments of mixed residues of rice/wheat/maize/mungbean that were incorporated into the soil. In the case of ME, surface-applied treatments were best fitted with the model with lower values, except the MWMbi treatment which was well fitted with the model. The lower value of MRE and the higher positive values of RMSE indicate a considerable scatter, and a very low value of CRM shows a tendency to overestimate. Except for the Ms and MWs treatments, lower values of RMSE were observed in treatments where residues and their mixtures were incorporated and best fitted to the model. Treatments where residues and their mixtures were applied on the soil surface showed the lowest values of CRM, except maize + wheat + mungbean treatment showing lower CRM under incorporation. Higher values of CD were observed under surface-applied treatments indicating best fit to the model. Except for the Ms and MWs treatments, higher modelling efficiency was observed under treatments where residues and their mixtures were incorporated. Overall, the statistics imply that the residues and their mixtures placed at the soil surface produced a satisfactory fit to the model compared with the residues incorporated into the soil.
Figure 6 Graphical presentation of observed and predicted cumulative C mineralization under different residues applied to soil.
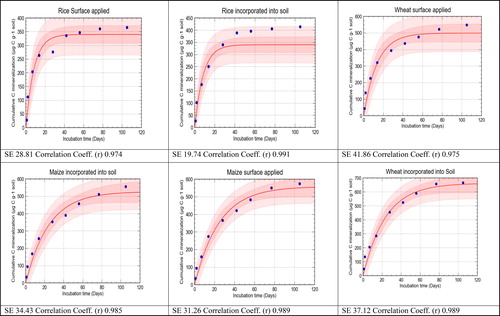
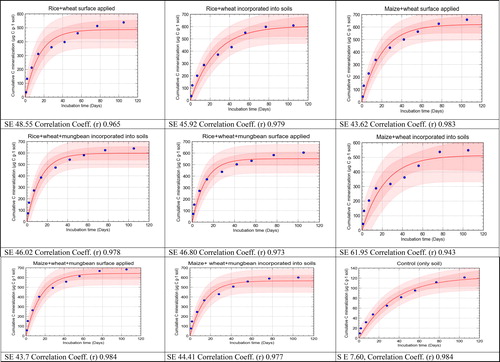
Table 4. Statistical parameters to evaluate the observed and predicted cumulative C mineralization.
Conclusion
Maize residues had a lower decomposition rate constant than rice and wheat residues due to low N content. Additive effects were observed when mungbean residue was added to both rice/wheat and maize/wheat mixtures, due to the low C/N ratio of mungbean. Higher C mineralization was observed when the residues as well as their mixtures were placed on the soil surface as compared to incorporated into the soil. A significant interaction between residue type and placement on C mineralization was observed. Residues decompose faster when surface-applied, thereby helping to manage a high volume of residues and sustainable intensification/diversification through inclusion of mungbean, which provides further opportunities to manage residues. Faster decomposition may release nutrients faster, which may lead to a higher crop yield, and hence the emission intensity will be lower. Therefore, CA with surface retention of mixed crop residue may serve as the best alternative and most efficient solution for eliminating residue burning. When conducting incubation experiments with higher rates of residue addition, the duration of the incubation should be more than 6 months for complete mineralization of the residues.
Acknowledgments
The infrastructure support of ICAR-Central Soil Salinity Research Institute (CSSRI), Karnal for the study and financial as well as technical support of International Maize and Wheat Improvement Center (CIMMYT) through USAID and Bill and Melinda Gates Foundation (BMGF) funded Cereal System Initiative for South Asia (CSISA) project and CGIAR Research Program on Wheat Agri-Food Systems are gratefully acknowledged. Authors also acknowledge the support from Indian Council of Agricultural Research (ICAR), New Delhi for the study.
Disclosure statement
No potential conflict of interest was reported by the authors.
Funding
This study was funded by the Bill and Melinda Gates Foundation; the U.S. Agency for International Development; and the CGIAR Research Program on Wheat Agri-Food Systems.
References
- Ladha JK, Fischer KS, Hossain M, Hobbs PR, Hardy B. Improving the productivity and sustainability of rice-wheat of the Indo-Gangetic Plains: A synthesis of NARS IRRI partnership research, p. 1–31. IRRI Discussion Paper Sereminer 40. IRRI, Manila, Philippines (2000).
- Subehia SK, Sepehya S. Influence of Long-Term Nitrogen Substitution through Organics on Yield, Uptake and Available Nutrients in a Rice-Wheat System in an Acidic Soil. J Indian Soc Soil Sci. 60, 213–217 (2012).
- Wilhelm WW, Johnson JMF, Douglas KL, Lightle DT. Corn stover to sustain soil organic carbon further constrains biomass supply. Agron J. 99, 1665–1667 (2007).
- Choudhary M, Datta A, Jat HS, Yadav AK, Gathala MK, Sapkota TB, Das AK, Sharma PC, Jat ML, Singh R, Ladha JK. Changes in soil biology under conservation agriculture based sustainable intensification of cereal systems in Indo Gangetic Plains. Geoderma 313, 193–204 (2018).
- Raiesi F. Carbon and N mineralization as affected by soil cultivation and crop residue in a calcareous wetland ecosystem in Central Iran. Agr Ecosyst Environ. 112, 13–20 (2006).
- Guntinas ME, Leiros MC, Trasar-Cepeda C, Gil-Sotres F. Effects of moisture and temperature on net soil nitrogen mineralization: A laboratory study. Euro J Soil Biol. 48, 73–80 (2012).
- Sarma B, Farooq M, Gogoi N, Borkotoki B, Kataki R, Garg, A. Soil organic carbon dynamics in wheat - green gram crop rotation amended with Vermicompost and Biochar in combination with inorganic fertilizers: A comparative study. J. Clean. Prod. 201, 471–480 (2018).
- Jat HS, Datta A, Sharma PC, Kumar V, Yadav AK, Choudhary M, Choudhary V, Gathala MK, Sharma DK, Jat ML, Yaduvanshi NPS, Singh G, McDonald A. Assessing soil properties and nutrient availability under conservation agriculture practices in a reclaimed sodic soil in cereal-based systems of North-West India. Archives of Agronomy and Soil Science 64, 531–545 (2018).
- Sharma PC, Jat HS, Kumar V, Gathala MK, Datta A, Yaduvanshi NPS, Choudhary M, Sharma S, Singh LK, Saharawat Y, Yadav AK, Parwal A, Sharma DK, Singh G, Ladha JK, McDonald A. Sustainable Intensification Opportunities Under Current and Future Cereal Systems of North-West India. Technical Bulletin. Central Soil Salinity Research Institute, Karnal, India, pp. 46 (2015). DOI: 10.13140/RG.2.2.16550.83521.
- Giacomini SJ, Recous S, Mary B, Aita C. Simulating the effects of N availability, straw particle size and location in soil on C and N mineralization. Plant Soil. 301, 289–301 (2007).
- Abiven S, Recous S. Mineralisation of crop residues on the soil surface or incorporated in the soil under controlled conditions. Biol Fertil Soils. 43, 849–852 (2007).
- Bremer E, Van Houtum W, Van Kessel C. Carbon dioxide evolution from wheat and lentil residues as affected by grinding, added nitrogen, and the absence of soil. Biol Fertil Soils. 11, 221–227 (1991).
- Nicolardot B, Bouziri L, Bastian F, Ranjard L. A microcosm experiment to evaluate the influence of location and quality of plant residues on residue decomposition and genetic structure of soil microbial communities. Soil Biol Biochem. 39, 1631–1644 (2007).
- Awad YM, Blagodatskaya E, Ok YS, Kuzyakov Y. Effects of polyacrylamide, biopolymer, and biochar on decomposition of soil organic matter and plant residues as determined by 14C and enzyme activities. Euro J Soil Biol. 48, 1–10 (2012).
- Gaillard V, Chenu C, Recous S. Carbon mineralisation in soil adjacent to plant residues of contrasting biochemical quality. Soil Biol Biochem. 35, 93–99 (2003).
- Mungai NW, Motavalli PP. Litter quality effects on soil carbon and nitrogen dynamics intemperate alley cropping systems. Appl Soil Ecol. 31, 32–42 (2006).
- Sakala WD, Cadisch G, Giller KE. Interactions between residues of maize and pigeonpea and mineral N fertilizers during decomposition and N mineralization. Soil Biol Biochem. 32, 679–688 (2000).
- Soil Survey Division Staff. Soil Survey Manual. United States Department of Agriculture, pp.63–65 (1993).
- Jackson ML. Soil chemical analysis. Prentice Hall of India Pvt. Ltd. New Delhi (1967).
- Subbiah BV, Asija GL. A rapid procedure for the determination of available nitrogen in soils. Curr Sci. 25, 259–260 (1956).
- Olsen CR, Cole CV, Wantanable FS, Dean LA. Estimation of available P in soil by extraction with sodium bicarbonate. USDA Circ. No. 939. Washington, 19pp, (1954).
- Baruah T C, Barthakur H P. A text book of Soil Analysis. Vikas Publishing Houses Pvt, Ltd., New Delhi (1999).
- Blake G R, Hartge K H. Bluk density, In: A. Klute (Eds.), Method of soil analysis, Part I. Physical and Mineralogical Methods: Agronomy Monograph no.9 (2nd ed.), American Society of Agronomy, Soil Science Society of America, Madison, Wisconsin, pp. 363–375 (1986).
- Angers DA, Recous S. Decomposition of wheat straw and rye residues as affected by particle size. Plant Soil. 189, 197–203 (1997).
- Li LJ, Han XZ, You MY, Yuan YR., Ding XL, Qiao YF. Carbon and nitrogen mineralization patterns of two contrasting crop residues in a Mollisol: effects of residue type and placement in soils. Euro J Soil Biol. 54, 1–6 (2013).
- Sarma B, Borkotoki B, Narzari R, Kataki R, Gogoi N. Organic amendments: Effect on carbon mineralization and crop productivity in acidic soil. J. Clean. Prod. 152, 157–166 (2017).
- Loague K, Green RE. Statistical and graphical methods for evaluating solute transport models: overview and application. J Contam Hydrol. 7, 51–73 (1991).
- Fruit L, Recous S, Richard G. Plant residue decomposition: Effect of soil porosity and particle size. In: Berthelin J Huang PM, Bollag JM, Andreux F (eds) Effect of mineral-organic microorganism interactions on soil and freshwater environments. Kluwer Academic/Plenum Publishers, New York, pp 189–196 (1999).
- Sims JL, Frederick LR. Nitrogen immobilization and decomposition of corn residue in soil and sand as affected by residue particle size. Soil Sci. 109, 355–361(1970).
- Ambus P, Jensen, ES. Nitrogen mineralization and denitrification as influenced by crop residue particle size. Plant Soil 197, 261–270 (1997).
- Henriksen TM, Breland TA. Carbon mineralization, fungal and bacterial growth, and enzyme activities as affected by contact between crop residues and soil. Biol Fertil Soils. 35, 41–48 (2002).
- Corbeels M, O’Connell AM, Grove TS, Mendham DS, Rance SJ. Nitrogen release from eucalypt leaves and legume residues influenced by their biochemical quality and degree of contact with soil. Plant Soil. 250, 15–28 (2003).
- Coppens F, Garnier P, De Gryze S, Merckx R, Recous S. Soil moisture, carbon and nitrogen dynamics following incorporation and surface application of labelled crop residues in soil columns. Euro J Soil Sci. 57, 894–905 (2006).
- Zibilske LM, Bradford JM. Oxygen effects on carbon, polyphenols, and nitrogen mineralization potential in soil. Soil Sci Soc Am J. 71, 133–139 (2007).
- Mohanty S, Nayak AK, Kumar A, Tripathi R, Shahid M, Bhattacharyya P, Raja R, Panda BB. Carbon and nitrogen mineralization kinetics in soil of rice-rice system under long term application of chemical fertilizers and farmyard manure. Eur. J. Soil Biol. 58, 113–121 (2013).
- Li LJ, Zeng DH, Yu ZY, Fan ZP, Yang D, Liu YX. Impact of litter quality and soil nutrient availability on leaf decomposition rate in a semi-arid grassland of Northeast China. J Arid Environ. 75, 787–792 (2011).
- Dinesh R, Chaudhuri S, Ganeshamurthy A, Pramanik S. Biochemical properties of soils of undisturbed and disturbed mangrove forests of South Andaman (India). Wetlands Ecol Manag.12, 309–320 (2004).
- Alexander M. 1961. Introduction to Soil Microbiology. John Wiley and Sons, Inc., New York and London.
- Mendham DS, Kumaraswamy S, Balasundaran M, Sankaran KV, Corbeels M, Grove TS, O’Connell AM, Rance SJ. Legume cover cropping effects on early growth and soil nitrogen supply in eucalypt plantations in south-western India. Biol Fertil Soils. 39, 375–382 (2004).
- Muhammad W, Vaughan SM, Dalal RC, Menzies NW. Crop residues and fertilizer nitrogen influence residue decomposition and nitrous oxide emission from a Vertisol. Biol Fertil Soils. 47, 15–23 (2011).
- Robinson CH, Kirkham JB, Littlewood R. Decomposition of root mixtures from high arctic plants: a microcosm study. Soil Biol Biochem. 31, 1101–1108 (1999).
- McTiernan KB, Ineson P, Coward PA. Respiration and nutrient release from tree leaf litter mixtures. Oikos. 78, 527–538 (1997).